a review of radionuclides in the marine environment - cresp
TRANSCRIPT

RADIONUCLIDES IN THE MARINE ENVIRONMENT A CRESP Science Review
Draft
Barry R. Friedlander Michael Gochfeld
Joanna Burger Charles W. Powers
Consortium for Risk Evaluation with Stakeholder Participation
July, 2005
Objectives
1. Characterize the worldwide effort (focusing on the Northern Hemisphere), including results, to identify “background” or monitoring levels of radionuclides in marine biota and examples of related information on water and sediment.
Data and Discussion:
Describe the various efforts in the Northern Hemisphere to characterize the marine environment. Regions include the North Pacific, Northern Europe, the polar regions of Northern Europe and the United States (northeast and northwest coastal waters). Describe the international effort to consolidate the data in a global database.
Describe the results in a series of tables focusing on radionuclides in marine biota. Discuss the problems or limitations of such studies. Also describe data for radionuclides bioconcentration factors of various radionuclides in various biota receptors as described for marine environments.
Describe the methods applied to estimate the degree of human risk associated with the consumption of radionuclides in biota that provide a human food source or contribute to a human food source (through the food chain) in different areas of the northern hemisphere.
Describe the evolving role of ecological risk assessment and its current status in regional or international monitoring efforts.
This information will help the reader place the Amchitka effort, and its eventual results, in perspective of international efforts to characterize marine radionuclides. This review includes key radionuclide data tables summarizing monitoring results of key national or regional marine programs, contains a current reference list, and has been reviewed, contributed to, and co-authored by several Amchitka Study advisory and science participants. A separate summary, in a much abbreviated form, is included in the Amchitka final report and has been drafted for the purpose of supporting effective communication with a wider variety of stakeholders.

1
TABLE OF CONTENTS
1.0 Abstract ........................................................................................................................................ 3 2.0 Introduction.................................................................................................................................. 5 3.0 Basis for Radionuclide Monitoring Programs ............................................................................. 6 4.0 Methods and Approaches............................................................................................................. 9 5.0 Radionuclide Measures.............................................................................................................. 12 6.0 Major Monitoring Programs and Databases .............................................................................. 12 7.0 Standards for Human Consumption of Radionuclides............................................................... 16 8.0 Detection Levels of Radionuclides in Marine Monitoring Programs........................................ 19 Graph 1: Detection Limits, Sample Size and Counting Times for Cs-137 in Amchitka biota ... 24 9.0 Monitoring Program Data: Biota, Seawater and Sediment........................................................ 27 9.1 United States ........................................................................................................................... 28
9.11 Biota................................................................................................................................. 28 9.12 Seawater........................................................................................................................... 30
9.2 Japan ....................................................................................................................................... 31 9.21 Biota................................................................................................................................. 31 9.22 Seawater........................................................................................................................... 34 9.23 Sediment .......................................................................................................................... 38
9.3 Hong Kong.............................................................................................................................. 39 9.31 Biota................................................................................................................................. 40 9.32 Seawater........................................................................................................................... 42 9.33 Sediment .......................................................................................................................... 42
9.4. Arctic and related Seas........................................................................................................... 44 9.41 Biota................................................................................................................................. 44 9.42 Seawater........................................................................................................................... 45 9.43 Sediment .......................................................................................................................... 47
9.5 North Atlantic Region............................................................................................................. 48 9.51 Biota................................................................................................................................. 48 9.52 Seawater........................................................................................................................... 51 9.53 Sediment .......................................................................................................................... 52 10.0 Human Risk Assessments: Ingestion of Radionuclides in Marine Biota ........................ 55
10.1 Marine Seafood Ingestion Risk Assessment – Examples ..................................................... 56 10.11 United Kingdom............................................................................................................. 56
10.2 Natural vs Anthropogenic Radionuclides: North East Irish Sea Dose Estimate .................. 58 10.21 Typical Consumption Pattern: Fish, Crustaceans, Molluscs ......................................... 58 10.22 Heavy Seafood Consumer: Fish, Crustaceans and Mollusks......................................... 60 10.23 Comparison: Natural and Anthropogenic Radionuclide Doses and Risks .................... 61 10.24 Cancer Mortality Risks of Radionuclides in Seafood: ICRP vs EPA............................ 62
11.0 Ecological Risk Assessments from Marine Radionuclides ..................................................... 66 11.1 Concentration Factors – indicators of biological uptake ................................................. 66 11.2 Reference Marine Biota ................................................................................................... 70 11.3 Marine biota ecological metrics: What to Measure? ....................................................... 73 11.4 Marine biota radio-ecotoxicology: Current Status........................................................... 73
12.0 Implications and Conclusions .................................................................................................. 75 13.0 References................................................................................................................................ 79

2
Appendix 1: Bodies of Water and Associated Countries................................................................. 86 Appendix 2: Radionuclide Ratios as Indicators of Source .............................................................. 87 Appendix 3:UK Dietary Survey Data for Seafood Consumption (RIFE-8) .................................... 92

3
Radionuclides in the Marine Environment A CRESP Science Review
March 14, 2005: Near Final DRAFT
1.0 Abstract
Several anthropogenic radionuclides have been detected through national, regional and
international monitoring programs designed to periodically assess marine water, sediment and
biota (fish, crustaceans, mollusks, algae, etc.) of the oceans and a number of seas and bays of the
Northern Hemisphere. Such information, while useful for evaluating broad temporal and spatial
trends in relationship to distant and local influences, can also assist in the interpretation of local
marine studies by providing information on concentrations (and there variability) detected in
various global marine sites. Marine biota radionuclide concentration data, in conjunction with
relevant dietary intake surveys, can form the basis to assess risks to human health from seafood
ingestion. Ecological risk assessment is evolving, has become an objective of several organizations
(including the International Atomic Energy Association) and will likely require an agreed upon set
of assumptions (i.e., a set of indicator organisms for the body of water in question and metrics of
ecotoxicity) as well as basic data on seawater and sediment concentrations as well as organism-
specific information including dietary patterns, food-chain bioconcentration and biomagnification,
residence time, and radionuclide and organism-specific toxicity.
Current efforts are underway to consolidate marine radionuclide data from monitoring
programs, published literature, and special studies in a large information database (GLOMARD) to
be maintained by the International Atomic Energy Agency in Monaco. Currently, detailed
radionuclide information is collected and maintained by several national and regional databases,
including substantial data from many of the 15 northern-European signatories to the OSPAR

4
Convention, from a number of countries bordering the Pacific Ocean and its minor Seas, from
countries on the Arctic Ocean, and from other monitoring efforts in the Northern Hemisphere.
The cessation of atmospheric testing by the early 1980s, accompanied by dilutional and
half-life factors, have generally resulted in reduced marine environmental concentrations of
Cesium-137 over the last few decades – although mobilization of sedimentary deposits continue to
contribute somewhat to some environmental burdens. Technetium-99 concentrations have varied
in the Irish and North Seas, primarily as a result of modulations in nuclear treatment volume
through ionization separation technology developments at Sellafield’s reprocessing facilities.
A number of regional dietary surveys in Ireland, England, Scotland, Norway, etc. have
linked seafood radionuclide concentrations to dose and risk estimates for typical and heavy
seafood consumers. The total anthropogenic radionuclide contribution to public dose through
consumption of contaminated seafood is, in recent years, relatively low – resulting in only one or
two percent of the composite radiation burden the public receives from all natural sources. The
lifetime human cancer risks from consuming artificial radionuclides is seafood is expected to range
from less than one in a million up to a few cases in a hundred thousand.
This paper places current marine biota radionuclide research – including that of Amchitka
(Powers et al, 2003) - in perspective to US and international food standards and guidelines, to
“background” concentrations in marine environments, and to the risks associated with natural
radiation in seafood. Several aspects are addressed, including the typical range of radionuclide
concentrations found internationally in marine biota, the sensitivity of a study to detect meaningful
concentrations in biota, and the degree of human risks that are currently associated with marine
systems that have long-standing increased levels of radionuclide contamination (i.e., the Irish Sea).
The reviewed data indicates that the key surveillance systems, as well as the Amchitka

5
investigation, are capable of a) detecting marine biota radionuclides at concentrations that clearly
meet international food standards and b) detecting low levels of human risk acceptable for seafood
consumption – even at high consumption rates. This degree of sensitivity suggested for the major
marine environmental surveillance systems is reassuring – but the extent to which such
surveillance addresses future potential sources of emissions must be periodically re-evaluated. Our
knowledge of ecological risks is evolving and is less complete, so the current interpretation that
marine radionuclide contamination is generally not thought to be deleterious needs to be carefully
reevaluated as new information on ecotoxicology and exposures develops in the ensuing years.
2.0 Introduction
During the last sixty years, human activity has resulted in varying degrees of contamination
of the world’s seas and oceans with anthropogenic radionuclides. Globally, the primary source of
this contamination is fallout from over 520 atmospheric nuclear weapons tests conducted between
1945 and 1980 primarily by the United States and the former USSR - but also by the United
Kingdom, France and the People’s Republic of China (Gafvert, Foyn, et al, 2003; Valette-Silver
and Lauenstein, 1995; Koide et al, 1985). Additional radionuclide burden to the marine
environment has resulted from current and/or prior emissions from the nuclear waste reprocessing
facilities at Sellafield (England), Dounreay (Scotland – facility closed in 1996), Cap de la Hague
(France) and Mayak (Russia), the dumping of nuclear waste (i.e. in the Kara Sea), accidents
involving nuclear facilities/reactors such as the 1986 event in the Ukraine at Chernobyl, from the
accidental sinking of nuclear submarines such as the Russian vessels the Komsomolets in the
Norwegian Sea and the Kursk in the Barents Sea ( Matishov and Mativshov, 2004; Kronfeld-

6
Goharani, 2003; Gafvert, et al, 2003), and from the 1964 re-entry burn-up of a plutonium-fueled
satellite (Koide et al, 1977).
The contribution of numerous underground nuclear tests - undertaken primarily beneath
Pacific islands – to contamination of the marine environment is less well understood. The French
government has supported research in the South Pacific by the International Atomic Energy
Agency (IAEA) to assess the potential impact of 147 underground nuclear tests undertaken by
France in the Mururoa and Fangataufa Atolls of French Polynesia (IAEA, 1998). Less recent
research has been undertaken in the North Pacific, although that void may subsequently be
addressed by current investigations of radionuclides in marine biota near three Amchitka, Alaska
United States test sites, where underground detonations were performed in the late 1960s and early
1970s (CRESP, 2003).
In this science review, we highlight major national and international marine radionuclide
databases that have been developed to provide a basis for comparative research and to characterize
“background” or monitoring levels of radionuclides in marine biota, water and sediment. We
describe concentrations typically found –in various marine biota. Furthermore, we provide
examples of how marine radionuclide data is being used at national levels for risk assessment
purposes. This review focuses primarily on monitoring activities in the Northern Hemisphere – the
geographic area most heavily impacted by the residues of global nuclear fallout due to the location
of most atmospheric tests and to relatively slow atmospheric mixing in the longitudinal plane of
the earth (Livingston and Povinec, 2002).
3.0 Basis for Radionuclide Monitoring Programs
Because of the potential for radiation contamination in the food web to adversely impact
human and ecological health, as well as the interest to understand the relative contributions of local

7
and global sources to current and future radionuclide concentrations, a number of scientific efforts
have been undertaken to characterize radionuclides in the marine environment, including biota,
water and sediments (Povinec, Hirose, et al, 2004; Dowdall et al, 2003; Ryan et al, 2003). To
support this effort, several countries and agencies have implemented marine expeditions and in
some instances have installed fixed sampling stations in order to assess and periodically track
environmental concentrations of radionuclides at national or regional locations. The substantial
growth in data at local, national and regional marine environments has necessitated the
development of centralized international databases through which research can provide a global
perspective and a basis for interpreting changes to the marine environment (GLOMARD, 2004;
Povinec et al, 2004; Aoyama and Hirose, 2004; Betti et al, 2004; IAEA, 2000; Duran et al., 2004).
Environmental radionuclide marine monitoring programs have functioned primarily to
assess the degree of radionuclide contamination in biota and/or media, evaluate trends over time,
compare results to guidelines or environmental commitments, determine the relative attribution of
potential sources, and interpret human health risk in light of seafood consumption patterns of the
general population and of critical subgroups with the greatest potential for high levels of intake -
such as subsistence harvesters (Ryan et al, 2003; Gafvert et al, 2003; SENES, 2003). Protection of
human populations has been the primary motivation for such work, although the health of
ecological receptors is an emerging international interest and may well influence future marine-
based environmental exposure standards or guidelines (Copplestone et al, 2004; ICRP, 2003;
ICRP, 2002; Pentreath, 1998).
Radionuclides in specific marine environments often reflect both emissions from local
sources, remobilization of sediment deposits, and arrival of contaminant plumes from more distant
locations. Ongoing marine monitoring programs are useful to determine the degree, significance

8
and trends of radionuclide pollution emitted by such sources as nuclear reprocessing plants,
accidental events, the operation of nuclear submarines and nuclear power plants, impacts of off-
shore oil exploration and mining activities (a potential source of naturally occurring radiation), or
legacies from prior nuclear tests from distant areas of the globe. Ocean surface circulation patterns
facilitate the movement of emissions from sources to receptors at distant locations. For example,
radionuclide emissions from reprocessing plants at the British Nuclear Fuels’ Sellafield facility in
Cumbria, England and the COGEMA La Hague facility in north-west France enter the Irish Sea
and the English Channel, respectively, and have been reported to migrate substantial distances
through marine currents to the Norwegian Sea, the Greenland Sea, the Barents Sea and other arctic
waters (Gerland et al, 2003: Frechou and Calmet, 2003; Kronfeld-Goharani, 2003; Hou et al,
2000). Ocean plume transit times from emission sources in La Hague and Sellafield to NW
Greenland have been estimated to range between 9 and 16 years (Hou et al, 2000).
A large segment of the diet and economic wellbeing of populations in several radionuclide
“receptor” countries, such as Norway, is derived from the sea. Radioactivity from Mayak, a
Russian weapons production and reprocessing facility near the Techa River, has also contributed to
distant radionuclide contamination. Its emissions include strontium-90, which have been reported
to travel the Techa River to enter the Kara Sea (Kronfeld-Goharani, 2003). These and other
potential radiation threats or perceptions of threat have produced substantial public and
governmental commitment within a number of countries to reduce radionuclide emissions and to
maintain aggressive, quality-assured, ongoing marine monitoring activities. The environmental
programs often include the periodic sampling and analysis of marine water, sediment and biota for
a several radionuclides of concern, as exemplified by monitoring and research derived from the
OSPAR Convention.

9
In 1998 the signatories to the OSPAR Convention (Convention for the Protection of the
Marine Environment of the North-East Atlantic) agreed to an agenda by which radioactive
discharges, emissions and losses will be reduced and monitored by each of the fifteen participating
countries. A major goal of OSPAR is to reduce marine radionuclide concentration increases in the
North-East Atlantic region to a level “close to zero” by 2020 (Ryan, McMahon, et al, 2003).
Member countries have each agreed to develop and implement ongoing monitoring programs of
their respective marine environments, and participate in ongoing quality control programs.
Additional monitoring efforts exist in other countries, often supported to some degree by agencies
involved with radiation standards and environmental research, such the International Atomic
Energy Agency (IAEA) and the National Center for Radiation Protection (NCRP). Russian
research by the Murmansk Marine Biological Institute on radionuclide transfer and
bioaccumulation in the Barents, Kara, Azov and Black Sea regions is such an example of national
efforts – under the framework of the Russian Academy of Sciences and the Russian Fund of
Fundamental Research – but also supported by grants from international agencies, such as IAEA
(Matishov and Matishov, 2004).
International agencies have supported the development and maintenance of a few well
designed and supported marine radionuclide databases. These databases have been designed to
support a wide range of marine research and radioecology monitoring programs, important toward
understanding and sustaining the long-term marine environment and its vital contributions to
human and ecological health (IAEA, 200X,; NCRP, 200X).
4.0 Methods and Approaches

10
The programs on marine radionuclide monitoring and resulting data were identified from
published literature databases, from general “online” resources, from linkages identified through
international (IAEA, WHO, ICRP) and national agencies (i.e., such as the U.S. DOE, EPA,
NFWS, NRC and from similar agencies in other countries), from contact with major researchers
and from the references identified in recent comprehensive reviews (i.e., FASSET; MARINA II).
The criteria for inclusion are:
a) at least one radionuclide is measured by defined analytic methods applied periodically to
at least one type of marine biota;
b) the measures include or make available information on the number of samples (ideally,
distinguishing “pooled” samples from individual samples), central tendency indicators (means,
geometric means or medians), and scatter (range, standard deviation/error, distributional plot, or
other indication of variability);
c) the body of water from which the biotic samples are obtained is named and the
geographic area covered by the monitoring program is defined – often through global positioning
system indicators;
d) the data has been published in a governmental report, the scientific literature or are
accessible “on line” , via “CD”, or through printed data tables; and
e) the analytic laboratories are accredited for the relevant tests and/or the analytic
techniques are adequately described, supported by active quality assurance and inter-laboratory
comparison programs. Programs in the Northern Hemisphere were the primary targets for this
review.
Monitoring programs vary by the specific radionuclides assessed, the reported units of
measurement, the analytic methods used to define concentrations, the minimum analytic detection

11
limits for the types/sizes of samples tested, and whether biotic findings are linked to local
environmental water and/or sediment radionuclide concentrations so that bioconcentration factors
can be estimated. Subsequent sections describe the basic metrics (see Appendices) used in
environmental radionuclide assessments, the major marine radionuclide monitoring programs of
the Northern Hemisphere identified by this review, summaries of radionuclide measurements
found in marine biota (particularly marine fish) and a description of risk assessment approaches
applied by Agencies to interpret the relevance of the marine data findings.
It is expected that the summarized information, which reflect the results of a large number
of recent tests from Northern Hemispheric monitoring programs, may be useful for placing the
results of specific, local radionuclide environmental studies in a broader perspective. It cannot be
claimed that the summarized data represent true “background” levels of radionuclide
concentrations in the marine environment, i.e., concentrations in pristine sites. The noted
concentrations are likely influenced both directly and indirectly (i.e., remobilization of
sedimentary deposits and ocean current distributions) by global fallout. Local radionuclide sources
could influence the results in some monitoring studies. Biota mobility could impact the extent and
time to which organisms are exposed to different environmental concentrations. A detailed review
of these factors is beyond the scope of the current review. However, that being said, the range of
data described in the paper should be of substantial value for comparative purposes. It summarizes
(and in some cases has actually compiled) recent results – most since 1999 - of multi-national
Northern Hemispheric monitoring programs that were developed to define the scope and extent of
radionuclide contamination in the Hemisphere’s major marine environmental systems.

12
Basic to interpreting the results of the monitoring systems is an understanding of the units
of measure used in radionuclide environmental studies. For readers who desire to review units of
radionuclide measures, Appendix 4 should be of some value..
5.0 Major Monitoring Programs and Databases
Most of the major radionuclide monitoring programs and databases (excluding the
Mediterranean Sea) from the Tropic of Cancer through the arctic zones of the Northern
Hemisphere are listed in tables 2. The monitoring programs periodically assess contaminants
through marine expeditions and via fixed sampling site activities. These programs provide an
important set of data that is maintained in the databases, which also include information from
special studies, one-time voyages, and data described in the published literature.
As noted in table 2, the monitoring programs of Northern Europe include substantial efforts
by Ireland, England, Scotland, France, Norway, and Russia. Additional studies have been
undertaken in the waters off Iceland, Estonia, Poland, Latvia, Sweden, Finland, Belgium, the
Netherlands, and in the more southern waters there have been some assessments off Spain and in
the Mediterranean and adjacent seas. Periodic monitoring in the North Pacific includes such areas
as the Sea of Japan, the Yellow Sea and the East China Sea. Further north there have been Pacific
and Arctic seawater assessments by Japan and Russia. Information generated from these
monitoring programs and other special studies is represented in the following databases.
The multinational or regional databases considered in this review are a) the HAM database
(Historical Artificial Radionuclides in the Pacific Ocean and its Marginal Seas) which includes
data on seawater concentrations, b) the ASPAMARD database (Asia-Pacific Marine Radioactivity
Database) which includes sea water, sediment, and some biota, c) the FASSET project which
includes information on seawater, sediment and biota for the North-Eastern Atlantic regions, d)

13
the MARINA II project for Northern European waters, e) the GLOMARD database – compiled by
the IAEA in Monaco, its effort is to aggregate and make available information on radionuclides in
marine environments across the globe (Aoyama and Hirose, 2003; Duran et al, 2004; Larsson,
2004; XXXXX; Nielsen and Hou, 2004), and f) RIFE, described below.
Several national monitoring programs maintain important databases. Norway has maintained,
since 1997, an annual monitoring program of the Norwegian Sea, the North Sea, the Barents Sea, the
Skagerrak, and selected Norwegian fjords. It data spans seawater, sediment and biota. Ireland,
through its Radiological Protection Instititue of Ireland (RPII) assesses all three media. Until 2004,
separate reports were generated by England and Wales, Ireland, and Scotland. Starting in 2004,
covering year 2003, the Radioactivity in Food and the Environment (RIFE-8) report combines the
efforts of the Food Standards Agency (England and Wales), the Scottish Environment Protection
Agency – SEPA (Scotland), Environment Agency and Environment Heritage Service of Northern
Ireland – and thus becomes a multinational program.
Table 2: Major Radionuclide Monitoring Programs and Related Data Integration Projects
Northern Hemisphere, Arctic and Temporate Zones
Program Description
Nord-Cotentin Nord-Cotentin Peninsula of the English Channel, north-west Database France. Radionuclides include Sr-90, Rb-87, Tc-99, Cs-137, (La Hague) Pu-238, 239, 240, 241, Am-241; Natural background data on Tritium, C-14, K-40, Po-210 and U-238. Data on Seawater, Sediment, and biota (crustacean, filtrating mollusks, non- filtrating mollusks, fish and algae). This program applies available data to model dose to marine biota and assess ecological risks. Its data is from a limited region of the English Channel.
RAME Norwegian marine environment monitoring includes data from the Norwegian Sea, the North Sea, the Barents Sea, the Skagerrak, and selected fjords. Radionuclides include Cs-137,

14
Cs-134, I-131, Pu-238, Am-241, Sr-90, and Co-60. Seawater, Sediment and biota samples are included in this program. NSTP National Status and Trends Program (Mussel Watch Project and the National Benthic Surveillance Project). 1976-78 and 1990, transuranic elements measured. 1990 survey of 36 U.S. Coastal sites for analysis of Am-241, Pu238, Pu239/40, Cs137, Ag110, Sr90, Zn65, Co60, Co58, K40 and Be7 in the mollusks Mytilus edulis (north Atlantic/Pacific) and Mytilus californianus (Pacific Coast) – as well as another mollusk in the Gulf Coast. This database has not been updated past 1990. AMAP The Arctic Monitoring and Assessment Programme integrates “the status and trends of the conditions of the Arctic ecosystems,” it “identifies possible causes for the changing conditions”, detects “emerging problems, their possible causes, and the potential risk to Arctic ecosystems, including indigenous peoples and other Arctic residents”. AMAP is a working group to the Arctic Council of Ministers. The AMAP Data Centre has compiled information on 137Cs in marine fish suggesting little, if any, difference in concentrations by species. HAM Summary of Cs-137, Sr-90, and Pu-239/40 in ocean water in Pacific Ocean and its marginal seas – published literature, Government of Japan survey reports and unpublished data. RIFE Data from the research monitoring programs of the UK Food Standards Agency, supplemented (in 2003) with the data from Ireland and from Scotland. This information includes a wide range of radionuclides in seawater, sediment and biota, as well as dietary intake surveys and risk assessments. RPII Radioactivity monitoring of the Irish marine environment (Irish database) undertaken by the Radiological Protection Institute of Ireland,
consistent with the OSPAR Convention. Earliest reports are from 1982-84 time periods, through recent dates (2003).
Analyses are reported for Cs-137 and other gamma emitters, and includeTc-99, Pu-238 and Pu-239/40 and Am-241 (est). Analyses are made for seawater, sediment and biota linked to ingestion pathways to estimate human health risks. GLOMARD Data summarized by the Marine Environment Laboratory, (IAEA-MEL IAEA, Monaco. To be eventual repository of data from Database) major monitoring programs, publications, research reports. Radionuclides in seawater, sediment, and biota will be included.
FASSET Framework for Assessment of Environmental Impact project involved 15 organizations in 7 European countries over the

15
period of 2000 – 2003, under the EC 5th Framework Programme. Includes source characterization, reference organisms, environ- mental transfer analysis, dosimetric aspects, effects analysis, and guidance on interpretation for seven important European ecosystems – including the marine systems of the northeastern Atlantic Ocean and its marginal seas. This project included the development of reference geometries of marine organisms, a compilation of radionuclide bio-concentration factors, transfer modeling and assessment, development of a FASSET radiation effects database (FRED), and six major reports. MARINA II Collates marine radioactivity data after 1985 in North European waters, including North-East Atlantic and contributory seas. Radionuclides included are: 210Pu, 137Cs, 99Tc, 90Sr, 238Pu, 239+240Pu, 241Am, 129I, 60Co,3H, and 106Ru. BNFL database Includes 26 consecutive annual data reports (as of 2002 report) on “radioactive discharges and disposals, monitoring of the environment, and radiological impact” of BNFL operations in the UK. Radionuclide data on tritium, C-14, Co-60, Sr-90, Zr-96, Nb-96, Tc-99, Ru-106, I-129, Cs-134, Cs-137, Pu (alpha) and Am-241 is provided for fish, mollusks, crustaceans, and seaweed for waterways potentially impacted by BNFS operations in UK. In addition are coastal radiation surveys, and inland impact analyses (i.e., milk, tap water, vegetables, lakes). HELCOM database Monitoring data of Baltic Sea since 1984 by (or supported by) member states to the Helsinki Commission (HELCOM): Denmark, Estonia, Finland, Germany, Latvia, Lithuania, Poland, Russia, and Sweden. Annual data on radionuclides in water, sediment, fish, aquatic pelagic and benthic animals of the Baltic Sea are entered into the HELCOM database. Cesium-137 and Strontium-90 are most frequently tested. Laboratories include Riso National Laboratory (Denmark), Federal Maritime and Hydrographic Agency (Germany), Swedish Radiation Protection Institute, Radiation and Nuclear Safety Authority (Finland), Central Laboratory for Radiological Protection (Poland), and V.G. Khlopin Radium Institute (Russia). ERICA Started in mid-2004, it is an outgrowth of FASSET and will develop an “integrated approach to scientific, managerial, social issues concerned with the environmental effects of contaminants emitting ionizing radiation, with emphasis on biota and ecosystems.” ERICA will develop risk tools, risk characterization methodologies, case-studies (including Sellafield marine releases of radionuclides). and guidance on decision-making involving stakeholder issues.

16
7.0 Standards for Human Consumption of Radionuclides
Some of the earliest public radiation protection guidelines for consumption in the United
States were developed in 1961, prior to the development of the nuclear industry. The guidelines
were derived by applying approximately 3% to NCRP’s occupational exposure guidelines, and
were developed for I-131, Sr-90, Sr-89, Cs-137, Ba-140, Tritium, and Ru-106
(Davistownmuseum).
In 1982, the US Food and Drug Administration (FDA) developed recommendations
regarding accidental radiation contamination of food products, which were replaced by
Recommendations for State and Local Agencies in 1998 (FDA, 1998). Recently, guidance levels
have been developed jointly in the codex alimentarius commission of the World Health
Organization and the Food and Agriculture Organization of the United Nations for radionuclides in
foods “destined for human consumption and traded internationally” (Codex, 2004). Within the
United States there has been an expansion of the 1998 Recommendations by the U.S. FDA for
application to “domestic food in interstate commerce or food offered for import into the United
States” (FDA, 2004).
The proposed international guideline levels for radionuclides in imported foods, as
described in the 2004 codex alimentarius (table 3) are based on the intervention level of about 1
mSv per year. It is considered that food that does not exceed the Guideline Levels “should be
considered as safe for human consumption.” While these limits were designed to protect against
risks that could occur from a major contamination event (i.e., a major radionuclide release, such as
at Chernobyl), and are intended to assure food safety for at least a one year timeframe after a
recognized incident, they can also be applied for longer time frames and are general acceptance
criteria for food in international trade.

17
Table 3: Guideline Levels (Bq/kg) for Radionuclides in Foods
Radionuclides Guideline Level (Bq/kg) Pu-238, 239,240, Am-241 1 Sr-90, Ru-106, I-129, I-131, U-235 100 S-35, Co-60, Sr-89, Ru-103, Cs-134, Cs-137, Ce-144, Ir-192 1,000 H-3, C-14, Tc-99 10,000 Note: The Guideline Level is for the total radionuclides in each noted group.
While not all radionuclides are included in the Guideline Levels, the list is considered
sufficient since it includes those most relevant to the food chain and those most important
biologically in either accidental or intentional environmental releases. The Guideline Level for the
radionuclide groups are addressed independently (i.e., the H-3, C-14, Tc-99 group guideline value
is 10,000 Bq/kg, regardless of what is found in the other groups). However, there is addition of
concentrations within in the same group, such that radiation contributions of Cs-134, Cs-137 and
other same group radionuclides would be combined and their total should be less than the stated
guideline level for that group, i.e., 1,000 Bq/kg for the group to which Cs belongs. The assumed
annual intake of food for adults is 550 kg and for infants is 200 kg (includes food and milk). It is
also assumed that imported foods comprise no more than 10% of the total diet.
The estimated exposure for individual consumers is derived from the following formula:
E = GL X M(a) X dC(a) X IPF, where E is the average mSv of internal dose, where GL is the
Guideline level in Bq/kg, M(a) is the age-dependent mass of food consumed (kg) per year, dC(a) is
the age-dependent ingestion dose coefficient (mSv/Bq), and IPF is the import/production factor –
assumed at 10% (or less). As per the example noted in ANNEX 2, Appendix XXII of the codex
alimentarius commission report of April, 2004, the Cs-137 dose estimation to adults and to infants
from applying the 1000 Bq/kg Guideline Level would be as follows:

18
Adult: E = 1000 Bq/kg X 550 kg/yr X 1.3E-05 mSv/Bq X 0.1 = 0.7 mSv/yr
Infant: E = 1000 Bq/kg X 200kg/yr X 2.1E-05 mSv/Bq X 0.1 = 0.4 mSv/yr
It should be noted that each of the values is less than the 1 mSv/yr standard.
The documentation for the USFDA Guidance Levels for radionuclides in foods used
domestically and in those imported were recently published, and are consistent with those values
reported in a prior 1998 FDA publication (FDA, 2004; FDA, 1998). The committed effective dose
basis of the Guidance is 5 mSv, with an associated lifetime total cancer mortality risk of about
2.25E-4 (approximately 1 in 4400) or less. The FDA values are derived from the most limiting
diets based upon the radionuclide in question and the most susceptible population age group –
taking into consideration age groups 3 months, 1 year, 5 years, 10 years, 15 years and adult. A
summary of the FDA Derived Intervention Levels (DIRs) is demonstrated in table 4.
Table 4: FDA Derived Intervention Levels (Bq/kg)
Radionuclide Group Derived Intervention Level(Bq/kg) Sr-90 160 I-131 170 Cs 134+137 total 1200 Ru*-103 6800 Ru-106 450 Pu + Am group total 2 *Ru 103 and 106 values are summed and divided by their DIRs with the total ratio DIR set a 1.
The FDA also performs market basket assessments of radionuclides in food products, as
part of if its Total Diet Study program of the U.S. food consumer (FDA, 2001). The data is
compiled for the total US population, as well as for fourteen age and sex subgroups. Dietary
exposure is computed by multiplying the concentrations found in 280 different foods in the survey
by the amount consumed of each type of food. While the minimal analytical reporting limits of
radionuclides are meant to be well below derived intervention levels, it is important to recognize
their importance – since values below the reporting limits are considered zero by the Agency. The

19
Agency has therefore essentially set, through the sensitivity of its radionuclide analytical program,
a food concentration below which there is no level of concern, i.e., a value indistinguishable from
zero.
The FDA minimal analytical reporting limits for some of the key radionuclides in food are
as follows: 90Sr = 0.1 Bq/kg; 137Cs = 5 Bq/kg; 241Am = 200 Bq/kg. The radionuclide monitoring
of US foods by FDA measures contaminants at levels sensitive enough for the purpose of assessing
the public’s Total Diet Intake. The analytical reporting limits differ from, but are related to
detection limits (see next section).
8.0 Detection Levels of Radionuclides in Marine Monitoring Programs
Environmental radionuclide monitoring programs must be supported by sufficient
laboratory capability to measure samples at concentrations that are distinguishable from
background, given a certain counting system, sample analytic counting uncertainty, counting time
and sample size. This potential capacity is called the minimum detectable amount or activity
(MDA). The MDA is a function of a counting system’s inherent assessment capability, the
radionuclide being tested, and the theoretical sample size. It is independent from what
concentrations are actually found in analysis of collected samples. The MDA is “the value that one
can legitimately advertise that one can measure with reasonable assurance” (Strom, 1998).
For example, if the environmental monitoring program is designed to detect potential
exposures in fish at a concentration that could produce a certain level of risk of cancer in a heavy
fish consuming public, then back calculations must be undertaken in advance of field studies to
determine the concentrations of a substance that must be detectable in a given counting system for
certain types of samples. Given the concentrations that must be detectable, the laboratory

20
determines the sample and analytical requirements needed to assure that the laboratory procedures
and equipment will have the capability to ascertain certain Minimum Detection Activities or
MDAs for the radionuclide in question in a given medium (i.e., Cs-137 at 4 E -05 Bq/kg-wet
weight of edible fish flesh).
The process by which one systematically computes the MDA for a particular measurement
process of radionuclide analysis of a radionuclide has been described in a classic work of nearly 40
years ago (Currie, 1968). The detection limit was defined by Currie as “the true net signal level
that may be expected a priori to lead to detection.” The detection limit is contrasted to the critical
level and the determination limit. The “critical level” is defined as “the signal level above which an
observed instrument response may be reliably recognized as ‘detected’.” The “determination
level” is another signal level, but this time is at a level above which “a quantitative measurement
can be performed with a stated relative uncertainty.” Furthermore, some laboratories or institutions
utilize the concept of laboratory “minimum reporting levels” or MRLs – which are based on “the
radiological significance of a particular concentration of activity” rather than just the technical
capability of measuring it (RIFE-8, 2003). MRLs are used to help render results more transparent
when taking into consideration data from laboratories with different detection limits. MRLs are
above the detection limit, but at concentrations below which there is thought to be no meaningful
risk potential, i.e., measures considered indistinguishable from zero in terms of information
content value. FDA converts food contaminant levels less than the reporting level to zero in its
calculations.
The MDA (as per Currie) can be computed as follows:
(Std Dev of background) + 2.71 MDA = ____________________________ (T)(Y)(E)(M)(K)

21
Where: Std Dev = the standard deviation of the background counts; T = the counting time (in seconds) per sample Y = the radiation yield per disintegration E = the absolute detector efficiency M = sample size in grams K = the unit conversions (from counts per second to pCi, etc.) As can be noted from the above equation, the MDA (sometimes called MDL) level will be
higher, that is will be less sensitive, if the background radiation count has high scatter or less
certainty (i.e., higher standard deviation). One could potentially reduce the background levels and
standard deviations by performing analyses in laboratories with low background radiation levels,
such as lead-shielded environments or underground counting laboratories (IAEA, 2004). The
MDA can also be reduced by increasing counting times and the sample size – as well as utilizing
large volume HPGe detectors with higher relative efficiency. Given the specific radionuclide, the
radiation yield per disintegration and the unit conversions are set values over which the
investigator has no control.
The MDLs from a number of national laboratories from Norway, Ireland, Japan, and Hong
Kong are shown (table 5) for Cesium-137 in fish. These minimum detection limits are all listed in
Bq/kg – wet weight. Unfortunately, not all laboratories report both sample size and analytic time
data, so direct comparisons of the potential capabilities of the laboratories to achieve similar MDLs
cannot be noted from the table. The data ranges from the least sensitive level of about 11 Bq/kg,
derived from a portable sodium iodide detector system applied to 0.2 kg fish samples, to a much
higher level of sensitivity at 0.06 Bq/kg, accomplished for 2 kg samples analyzed through a system
of four high purity germanium detectors. In general, HPGe technologies commonly have
environmental monitoring laboratory MDLs for Cesium-137 in fish in the range of 0.4 to 0.1

22
Bq/kg. Portable sodium iodide detectors have, as expected, less sensitive MDAs, with levels at
about 11 Bq/kg.
Table 5: Minimum Detection Limits for Cesium-137 in Marine Fish Environmental Monitoring
Findings from National and other Laboratories. Data on Analyses of Marine Fish
Laboratory Sample Analysis Detection Average Reference size Time Limit Conc.
Bq/kg Bq/kg Norwegian Radiation Protection Authority up to 5 kg 2 days 0.2 to 0.4 0.2 to 0.4 Gafvert et - ww (general al, 2003 findings)
Comment: NRPA low-level, HPGe detectors are in low-background lab and have relative efficiencies of 23% to 40%. IMR (The Institute of Marine Research) lab gamma counters include an extra-low background HPGe detector with 60% relative efficiency, electrostat cooling systems and 10cm lead shielding. FWHM=1.9 keV at 1332 keV. Norwegian Food Control Authority 0.5 kg 2-3 days 0.1 Gafvert et dried al, 2003 muscle Comment: EG&G Ortec GEM (p-type) detector with 45% relative efficiency. Directorate of Fisheries (Tromso) 0.2 kg Not stated 11 Gafvert et - local office (Norway) fresh al, 2003 muscle Comment: Canberra series 10 portable NaI detector Radiation Protection Institute of Ireland Not stated Not stated 0.3 0.8 Ryan et muscle al, 2003 Comment: High resolution gamma spectrometyr using high purity germanium detectors. Typical uncertainties are about 15%. Japan Chemical Analysis Center 4 kg Not stated 0.7 0.8 JCAC, No. muscle lowest 139, 2004 values Japan Nuclear Cycle Development Institute Not stated Not stated Not stated 0.1 Shinohara lowest 2003 values 7 E -5 Hong Kong Observatory 2 kg 20 hours 0.06 0.08 Li & Young 2003
(averages of only detectables
Comment: Gamma spectrometry system with 4 high purity germanium detectors. Canberra Genie-2000 software used.

23
MDAs from the Hong Kong Observatory laboratories (table 6) are shown again for
Cesium-137 – but also for Strontium-90, Plutonium-239, tritium and Iodine-131 in both
fish/shellfish and seaweed. Relatively large samples of fish were used (2 kg) for Cesium-137
analyses, and the MDA was at the low end of levels noted in other laboratories, at 0.06 Bq/kg-ww.
Limits of detection for Cs-137 were defined, as a function of counting time and biota
sample size (100 gram and 1000 gram samples) for the ongoing Amchitka study (Powers et al,
2003; Kosson and Stabin, 2005). A comparison of the detection limits to international food
standards for consumption and risk based thresholds was made, to assure that the analyses would
be planned to have sufficient sensitivity to detect concentrations of relevance to public health. As
noted (graph 1), the analytic system would be able to detected Cs-137 at 0.4 Bq/kg with 72 hour
determinations for 100 gram biota samples, and much lower concentrations for selected 1000 gram
sub-samples with shorter counting times. In all cases, the anticipated sensitivity would be
substantially below the requirements of the proposed international food standards (WHO, FAO,
2004) and risk-based thresholds for high consuming subsistence fishers.

24
Graph 1: Detection Limits, Sample Size and Counting Times for Cs-137 in Amchitka biota
Reference: Kosson and Stabin, 2005.
Table 6a outlines the MDAs at the Hong Kong Observatory for a few radionuclides in
seawater (suspended particulates) and seabed sediment from four sampling locations in the eastern
coastal waters of Hong Kong: , Basalt Island, Tai Long Wan, Waglan Island and Port Island. The
sediment MDAs for 137Cs are comparable to the “typical” sediment laboratory MDA of 1.5 E-04
Bq/g reported by South Korean investigators at Kyungpook, Pukyong and Daegu National
Universities of South Korea and the Korea Institute of Nuclear Safety (Park, Lin et al, 2004).
Table 6: Minimum Detection Activity (MDA) Hong Kong – Seaweed and Shellfish
1.0E-05
1.0E-04
1.0E-03
1.0E-02
1.0E-01
1.0E+00
0 20 40 60 80 100 120 140 160 180Count time (hr)
MDA
for
Cs-
137
(Bq/
g)
reported background range
48 hr 72 hr
100 g samples (actual)
1000 g samples (estimated)

25
Hong Kong Environmental Monitoring. Hong Kong Observatory, 2003 Data for Fish, Shellfish Data for Seaweed Radionuclide Sample Counting Bq/kg-ww Sample Counting Bq/kg-dw size Time MDA Size time MDA Cesium-137 2 kg 20 hours 0.06 0.5 kg 6 hours 2 Strontium-90 2 kg 8 hours 0.003 0.1 kg 8 hours 0.05 Plutonium-239 0.5 kg 61 hours 0.003 0.03 kg 61 hours 0.01 Tritium 0.01 kg 10 hours 4 .02 kg 10 hours 2 Iodine-131 2 kg 20 hours 0.03 0.5 kg 5.5 hours 1
Reference: Hong Kong Observatory, technical Report No. 23, “Summary of Envornmental Radiation Monitoring in Hong Kong, 2003. Li SW and Yeung KC.
Table 6a: Minimum Detection Activity (MDA) Hong Kong – Marine Water and Sediments
Hong Kong Environmental Monitoring. Marine Water and Sediment
Seawater Suspended Particulates
Sea Sediments Radionuclide
Sample size
Counting time
Bq/l MDA
Sample size
Counting Time
Bq/g-dw MDA
Iodine-131 4 liters 15.3 hrs 1.00E-02 2 kg 5.5 hrs 4.00E-04 Cesium-137 4 liters 15.3 hrs 2.00E-02 2 kg 5.5 hrs 5.00E-04 Strontium-90 3 liters 8.3 hrs 2.00E-03 Plutonium-239 2 liters 61 hrs 3.00E-04 .005 kg 61 hrs 2.00E-04
Note: Strontium-90 analyses: background level 1 CPM, 75% counting efficiency, and 90% chemical recovery. Plutonium-239 analysis: 20% counting efficiency and 50% chemical recovery. Reference: Hong Kong Observatory, technical Report No. 23, “Summary of Environmental Radiation Monitoring in Hong Kong, 2003. Li SW and Yeung KC.
Detection limits can be influenced by a number of factors, including the sensitivity of the
analytic instrument, the size of the sample, the counting time duration, background count rates, the
influence of radiochemical separation and concentration techniques. Detection limits will vary in
relation to the previously noted factors, and will often change within the same laboratory at
different times or with different laboratory setups or calibrations. Some guidance on what one
might expect for “typical” limits of detection in the analytic testing for a variety of radionuclides in
different marine media are outlined in a recent report (Jones, Simmonds et al, 2004) and are noted
below for a few radionuclides (table 7). These values, of course, are not specific to a particular
study and will be expected to vary by the relevant study conditions.

26
Table 7: Radionuclide Typical Detection Limits
Analysis of the Marine Environment Radionuclide Fish Crustacea Molluscs Seaweed Sediment Seawater Bq/kg-ww Bq/kg-ww Bq/kg-ww Bq/kg-ww Bq/kg-dw Bq/m3 90Sr 0.1 0.1 0.1 99Tc 0.08 0.08 0.00005 137Cs 0.1 0.1 0.1 0.1 0.4 0.0001 239+40Pu 0.0001. 0.0001 0.0001 241Am 0.0001 0.0001 0.0001
Reference: (adapted from) Jones, Simmonds et al, 2004.
The MDA for 129 I in biological samples has recently been described using direct gamma-
X spectrometry, with sub-samples as small as 20 mg (Frechou and Calmet, 2003). The detection
limit was noted as 0.5 Bq/kg. The technique was advocated by the authors as “a simple and fast I-
129 activity measurement technique to monitor environmental samples and to select the most
efficient and representative bio-indicators to assess the I-129 environmental contamination levels.”
The gamma-X spectrometry analysis is now routinely applied on a monthly surveillance basis of
the English Channel and to the North East Atlantic Ocean coast of France to several seaweed
species: Fucus serratus, Fucus vesiculosus and Ascophyllum nodosum – as well as to a variety of
foodstuff (Frechou and Calmet, 2003). Other more demanding measurement procedures, such as
Accelerator Mass Spectrometry and Radiochemical Neutron Activation Analysis, have been
previously used for the detection of low level I-129. Radiochemical Neutron Activation Analysis
has been reported to have a detection limit of 109 atoms of I-129 for 40 g seaweed samples (Hou et
al, 2000).
A common difficulty associated with the low concentrations assessed in environmental
radionuclide monitoring is how to report and statistically deal with results below the detection
limits. Data reporting options noted (Royal Society of Chemistry, 2001) to have been used by
27
various investigators to describe results below the study detection limits include: a) not detected,
i.e., nd; b) less than the detection level, i.e., <dl; c) assigning an arbitrary value of ½ of the
detection level, i.e., ½ dl; or d) list the result with its uncertainty expressed as the 95% confidence
level. The last option is to be preferred, since “it provides the most information” and can the data
can be incorporated in statistical assessments (Royal Society of Chemistry, 2001). Data from some
monitoring programs, such as individual samples from the UK Food Standards Agency, are
routinely reported with results and uncertainty. Frequently, however, average sample values are
often reported as below a given detection level or are simply excluded from data tables if the
average is below the detection level. It is this type of inconsistency in the reporting of radionuclide
monitoring data that makes it difficult to compare and assess results from various monitoring
programs.
9.0 Monitoring Program Data: Radionuclide Concentrations in Biota There are a number of approaches that can be used to display the results of radionuclide
environmental monitoring programs of the oceans and seas of the northern hemisphere. The basic
data consists of radionuclide (Cesium-137, Strontium-90, etc.), environmental compartment (ie,
surface water, sediment, biota), general type of biota (fish, mollusk, crustacean, seaweed), specific
type of biota (including scientific name), body of water (i.e. Arctic Ocean, Kara Sea, Baltic Sea,
etc.), and geographic convention categories of location. Data can be sorted by country or region,
and can be displayed using geospatial mapping. The results of monitoring can be influenced by
technical aspects, such as sampling schemes, sample sizes, analytic procedures, and detection
limits for various radionuclides in various environmental media.
The approach used in this report is two-fold. First, marine biota radionuclide data will be
summarized and reviewed separately by body of water, including key national or regional coastal

28
areas (i.e., Atlantic and Pacific Coasts of the mainland United States; Japan’s sea environment –
Sea of Japan and Coastal NW Pacific, etc.). A list of the bodies of water considered in this report,
and their major country shorelines, is outlined in Appendix 1. This method of describing data will
permit reviews of biota from major oceans and seas as well as their surrounding countries or
regions – and will provide a place in the report where a description of local potential sources of
radionuclides can be considered. The second approach summarizes the radionuclide information
for marine fish in a single composite table (see table YX) – where ranges of concentrations of the
most commonly measured radionuclides can be visualized for the Northern Hemisphere. These
approaches should provide the reader with increased clarity and a comprehensive assessment.
9.1 United States Marine Biota Concentrations Coastal Atlantic and Pacific Oceans Within the United States, radionuclides in bivalves were last surveyed in 1990, and
reported in a 1995 publication (Valette-Silver,1995). Data include Sr-90., Cs-137, Pu-238, Pu-
239,240 and Am-241 concentrations for bivalves collected on the East and West Coasts of the
United States. Gulf Coast data is also collected but is not summarized in this review. The results,
summarized in Tables 8 and 9, display the average values (for above detection limit samples) and
their SD, median, range and individual composite results. Only 4 of the 14 East Coast samples had
Cs-137 values above the detection limit, with the lowest reported concentration being 74 uBq/g –
dw. West Coast samples had higher Cs values, with 12 of 17 samples being above detection, the
lowest reported value being 0.11 Bq/kg-dw.
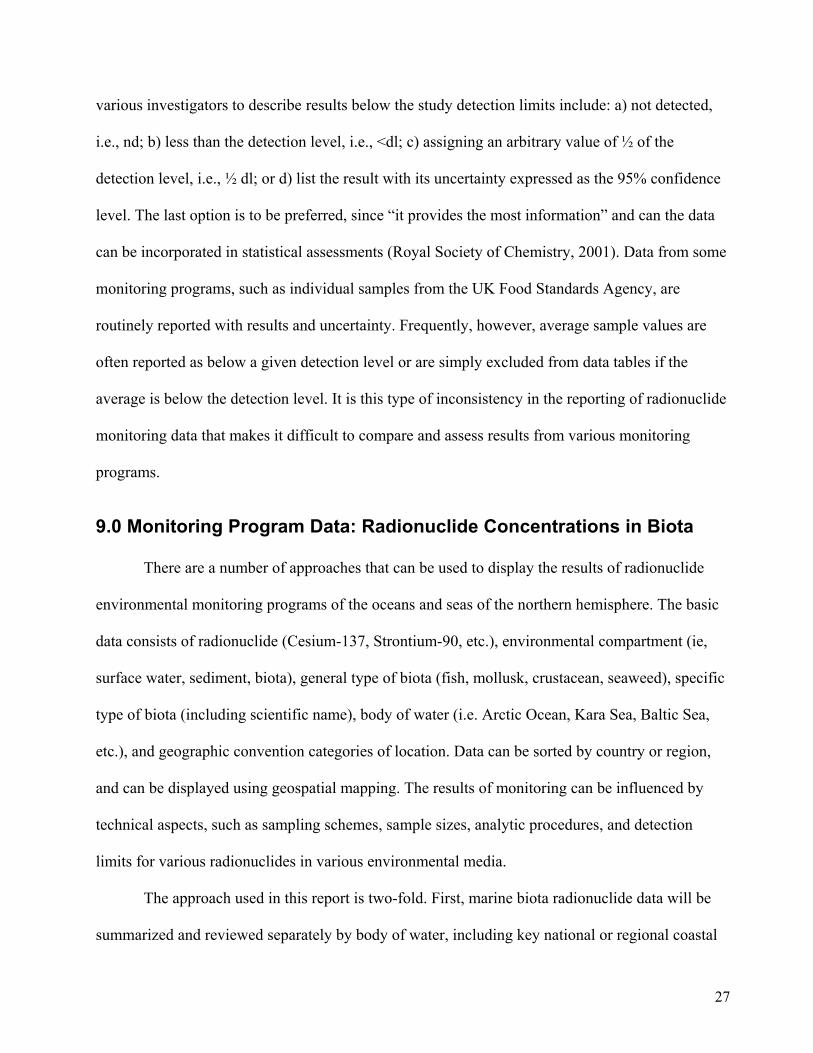
Table 8: Radionuclides in Bivalves – East Coast
Mussels and Oysters of Unites States. National Status and Trends Program, NOAA, 1990 data Ref: Valette-Silver and Lauenstein, 1995. Data in Bq/kg dry-weight.

29
E Coast Sr-90 Cs-137 Pu-238 Pu-239/40 Am-241 Ave 0.2 0.140 0.006 0.016 0.006 SD 0.25 0.060 0.006 0.016 0.003 # samples 14 14 14 14 14 Median 0.087 0.150 0.005 0.011 0.007 Range 0.02-0.69 <dl – 0.195 <dl -0.020 0.001-0.047 <dl-0.009 #>dl 14 4 13 14 14 Data Set 0.056 < 0.005 0.047 0.006
0.027 0.192 0.002 0.012 0.001 0.027 0.195 0.002 0.027 0.008 0.026 < 0.003 0.015 0.007 0.032 0.103 0.001 0.001 0.001 0.181 < 0.020 0.012 0.009 0.503 < < 0.046 0.008 0.124 < 0.005 0.002 < 0.017 < 0.004 0.002 0.008 0.209 0.074 0.005 0.008 0.0005 0.733 < 0.002 0.029 0.007 0.117 < 0.013 0.004 NA 0.037 < 0.005 0.011 0.007 0.692 < 0.016 0.004 0.005
Note: usually 300g dry soft tissue(about 180-200 mussels) per composite sample per site Ave, SD, Median all stated as reported in publication, with conversion to Bq/kg-dw. Adapted from: Valette-Silver NJ, Lauenstein GG (1995). Radionuclide Concentrations in Bivalves Collected along the Coastal United States. Marine Pollution Bulletin 30, 320-331.
Table 9: Radionuclides in Bivalves – West Coast
Mussels and oysters of the United States. National Status and Trends Program, NOAA, 1990 data. Ref: Valette-Silver and Lauenstein, 1995. Data in Bq/kg dry-weight. West Coast Sr-90 Cs-137 Pu-238 Pu-239/40 Am-241
Ave 0.170 0.250 0.003 0.012 0.036 SD 0.470 0.100 0.003 0.008 0.031 # sampes 17 17 16 16 17 Median 0.050 0.270 0.002 0.011 0.024 Range 0.023-1.994 <dl -0.400 <dl -0.012 0.001-0.027 0.002-0.090 #>dl 17 12 14 16 17
Data set 0.027 0.400 0.003 0.008 0.012
0.031 0.360 0.002 0.005 0.070 0.061 0.295 0.003 0.002 0.007 0.050 < 0.002 0.001 0.005 0.069 0.189 0.002 0.027 0.087 0.023 0.112 < 0.011 0.019 0.051 < < 0.006 0.068 0.027 0.322 0.003 0.007 0.002
30
0.045 < 0.001 0.016 0.024 0.051 0.118 0.002 0.018 0.065 0.032 0.177 0.002 0.017 0.053 0.045 0.313 0.012 0.015 0.045 1.994 0.122 0.002 0.021 0.090 0.172 < NA NA 0.050 0.144 0.268 0.003 0.024 0.013 0.028 0.280 0.002 0.009 0.007 0.076 < 0.009 0.010 0.005
Note: usually 300g dry soft tissue(about 180-200 mussels) per composite sample per site. Adapted from: Valette-Silver NJ, Lauenstein GG (1995). Radionuclide Concentrations in Bivalves Collected along the Coastal United States. Marine Pollution Bulletin 30, 320-331.
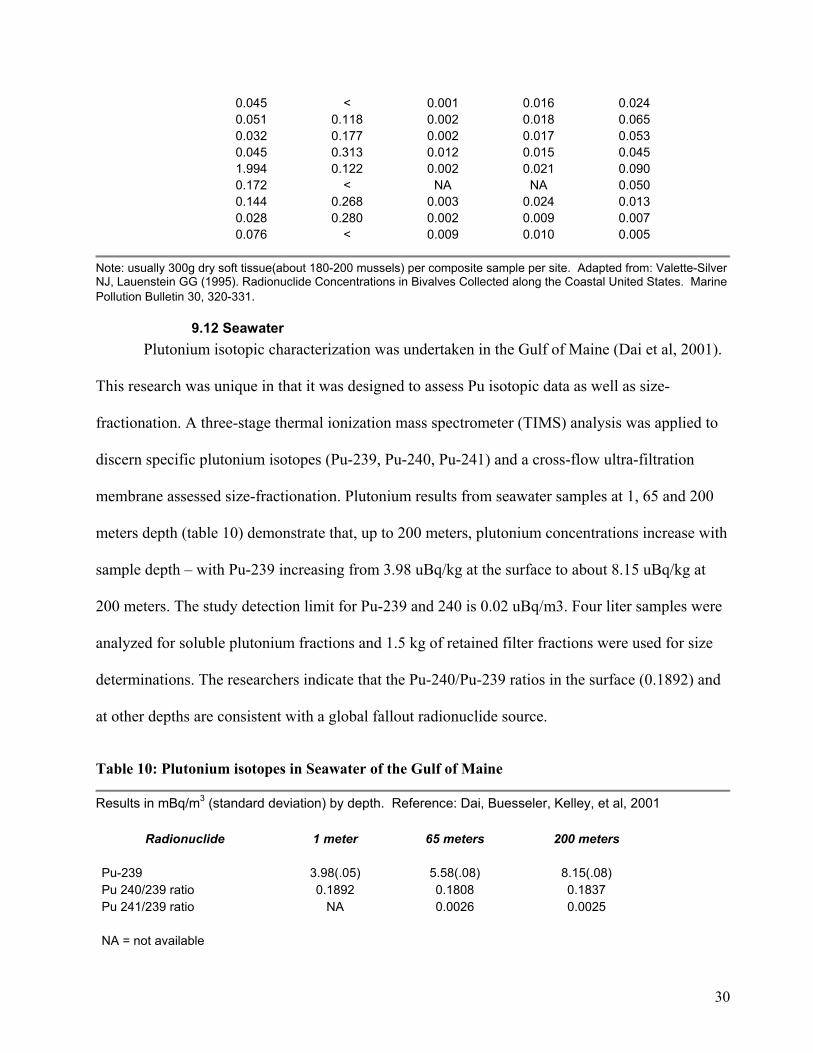
9.12 Seawater Plutonium isotopic characterization was undertaken in the Gulf of Maine (Dai et al, 2001).
This research was unique in that it was designed to assess Pu isotopic data as well as size-
fractionation. A three-stage thermal ionization mass spectrometer (TIMS) analysis was applied to
discern specific plutonium isotopes (Pu-239, Pu-240, Pu-241) and a cross-flow ultra-filtration
membrane assessed size-fractionation. Plutonium results from seawater samples at 1, 65 and 200
meters depth (table 10) demonstrate that, up to 200 meters, plutonium concentrations increase with
sample depth – with Pu-239 increasing from 3.98 uBq/kg at the surface to about 8.15 uBq/kg at
200 meters. The study detection limit for Pu-239 and 240 is 0.02 uBq/m3. Four liter samples were
analyzed for soluble plutonium fractions and 1.5 kg of retained filter fractions were used for size
determinations. The researchers indicate that the Pu-240/Pu-239 ratios in the surface (0.1892) and
at other depths are consistent with a global fallout radionuclide source.
Table 10: Plutonium isotopes in Seawater of the Gulf of Maine
Results in mBq/m3 (standard deviation) by depth. Reference: Dai, Buesseler, Kelley, et al, 2001
Radionuclide 1 meter 65 meters 200 meters
Pu-239 3.98(.05) 5.58(.08) 8.15(.08) Pu 240/239 ratio 0.1892 0.1808 0.1837 Pu 241/239 ratio NA 0.0026 0.0025
NA = not available

31
Dai, MH., Busseler KO, Kelley JM, et al. Size fractionated plutonium isotopes in a coastal environment. Journal of environmental radioactivity 53(2001) 9-25
9.2 Japan Marine Biota Concentrations Sea of Japan and NW Pacific Ocean
The Japan Chemical Analysis Center performs an annual radioactivity survey in Japan of a
wide range of media, including concentrations in tea, soil, fresh water, airborne dust, rain,
vegetables, milk, freshwater fish, and – most importantly for this review – seawater, sea sediment,
sea weed, sea fish and shellfish. The marine environment is assessed for Sr-90 and Cs-137. Biota
ample sizes are from 3 to 5 kg sea fish, and 3 to 5 kg of shellfish and seaweed. The Sr-90 and Cs-
137 data for sea fish (table 11, selected fish) are reported in the units of Bq/kg-wet. Data in the
original report (not shown here) are also computed as Bq/g Calcium for Sr-90 and Bq/g potassium
for Cs-137. Limits of detection limit data are not discussed in the JCAC reports.
Table 11: Cesium-137 and Strontium-90 in Sea Fish of Japan
Source: Radioactivity Survey Data in Japan. Japan Chemical Analysis Center. Reports 138 (2003) and 139 (2004). Data in Bq/kg-ww and (SD) Marine Fish 90Sr 90Sr 137Cs 137Cs
Report Year 2003 2004 2003 2004
Ammodyt.personatus (sand lance) .017(.007) .000(.005) .054(.008) .035(.007)
Branchiostegus sp. (tilefish) .010(.006) .013(.005) .12(.010) .12(.010)
Hexagrammos otakii (fat greenling) .010(.006) .000(.006) .10(.009) .13(.010)
Oncorhynchus keta (salmon) .006(.005) .01(.006) .084(.009) .074(.009)
Pleuronectidae (righteye flounder) Sea of Japan (ave) .004(.005) .002(.004) .094(.009) .068(.008) Pacific .003(.005) .016(.007) .077(.008) .054(.008)
Sardinops sp. (sardine) .005(.005) .000(.004) .038(.007) .052(.007)
Sebastes inermis (darkbanded rockfish) .007(.005) .014(.007) .13(.011) .11(.010)
Sebastiscus marm. (marbled rockfish) .020(.006) .039(.009) .051(.009) .079(.009)

32
Note: data adapted from Radioactivity Survey Data in Japan. Environmental and Dietary Materials. Japan Chemical Analysis Center, Chiba, Japan. Reports 138(2003) and 139 (2004).
The five types of shellfish included in the Japan Chemical Analysis Center Radioactivity
Surveys (table 12) of 2003 and 2004 are the Japanese littleneck (Tapes philippinarum), Yezo
scallop (Patinopecten yessoensis), Japanese oyster (Crassostrea gigas), blue mussel (Mytilus
edulis), and horned turban (Turbo Batillus cornutus).
The strontium values in the shellfish are low and generally not significantly different from
zero. Shellfish cesium-137 concentrations are higher than those of strontium, with the greatest
cesium values found in the Yezo scallop in both 2003 and 2004.
Table 12: Cesium-137 and Stronium-90 in Shellfish of Japan
Source: Radioactivity survey Data in Japan. Japan Chemical Analysis Center. Reports 138 (2003) and 139 (2004). Data in Bq/kg-ww and (SD). Marine Shellfish 90Sr 90Sr 137Cs 137Cs
Report Year 2003 2004 2003 2004
Crassostrea gigas (Japanese oyster) .000(.007) .017(.013) .010(.007) .01(.007) Mytilus edulis (blue mussel) .000(.005) .000(.006) .011(.005) .011(.005) Patinopecten yesso. (Yezo scallop) .005(.006) .006(.006) .019(.005) .024(.005) Tapes philippinarum (Japanese littleneck) .008(.008) .005(.005) .015(.006) .012(.005) Turbo (Batillus) corn. (horned turban) .013(.008) .008(.008) .018(.007) .02(.008)
Note: data adapted from Radioactivity Survey Data in Japan. Japan Chemical Analysis Center, Chiba, Japan. Reports 138(2003) and 139 (2004). Where data was collected from multiple sites, average values are reported.
Other environmental radiological monitoring efforts specifically assess the control of
potential local radiation sources. For example, a recent report (Shinohara, 2004) describes
concentrations of Sr-90, Zr/Nb-95, Ru-106, Cs-134, Cs-137, Ce-144, and Pu-239,240 in marine
fish, shellfish, and seaweed in the Pacific Ocean offshore from a Japanese reprocessing plant and
in distant control sites (see table 13). With the exception of cesium-137 in fish, Pu-239,240 in

33
seaweed, and both Pu-239,240 and Cs-137 in shellfish, the other radionuclides were below the
level of analytic detection in samples off-shore from the plant and in the control area samples. The
offshore and control sample concentrations (compared vertically in the table) are very similar.
Table 13: Cesium-137 and Pu-239, 240 Concentrations in Biota
Samples from the Pacific Ocean. Offshore from Tokai(Japan) Reprocessing Plant vs Comparison Site 20km further north. Data in Bq/kg-ww.
Fish Shellfish Seaweed
Cs-137 offshore Mean 0.11 0.058 < detect (variance) 0.0008 0.0006 # samples 40 80
control Mean 0.12 0.063 < detect (variance) 0.001 0.0006 # samples 40 40
Pu-239,40
offshore Mean < detect 0.0021 0.0036 (variance) 8.00E-08 2.20E-06 # samples 33 80
control Mean < detect 0.002 0.0034 (variance) 2.90E-09 2.20E-06 # samples 40 40
Reference: Shinhara K. Asessment of radiological effects on the regional environment de to the operation of the Tokai reprocessing Plant. Journal of Environmental Radioactivity 72(2004) 299-322.
Specific monitoring for strontium-90 and cesium-137 in the seaweed Undaria pinnatifida is
performed as part of the annual radioactivity survey of environmental and dietary materials by the
Japan Chemical Analysis Center. As can be noted from the data (table 14), the data are remarkably
stable for Sr-90, with the averages during the two years being essentially identical ( 0.024Bq/kg-
wet and 0.030 vs 0.031Bq/kg Ca). The Cs-137 data also was very consistent, though not to the
same extent.

34
Table 14: Radionuclides in Japanese Marine Seaweed
Strontium-90 and Cesium-137. Sample dates: April 2001-March 2003. Seaweed: Undaria pinnatifida. Data in Bq/kg wet, Bq/kg Ca & K. Strontium-90 Data Cesium-137 Data Bq/kg-wet Bq/kg Ca Bq/kg-wet Bq/kg K # Sampling sites/yr 9 9 9 9 April 2001-Mar 2002 Average 0.024 0.030 0.015 0.002 Standard Dev. .0153 0.020 0.008 0.001 April 2002-Mar 2003 Average 0.024 0.031 0.018 0.004 Standard Dev. 0.013 0.020 0.009 0.003
References: Japan Chemical Analysis Center, Radioactivity Survey Data in Japan environmental and dietary Material, reports 138 (2003) and 139 (2004).
9.22 Seawater A substantial amount of data has been collected on seawater in the Sea of Japan and in the
North Pacific near Japan (table 15). For the purposes of this review, we will focus on information
from the ASPAMARD (Asia-Pacific Marine Radioactivity Database), the HAM (Historical
Artificial Radionuclides in the Pacific Ocean and its Marginal Seas) database, the GLOMARD
(Global Marine Radioactivity) database, and annual surveillance reports (Radioactivity Survey
Data in Japan) from the Japan Chemical Analysis Center, and will also include information from
seven sampling cruises in the Japan Sea between 1997 and 2000 (Ito et al, 2003). While some
overlap in database information is to be expected, we have avoided redundancy from the Japan
Chemical Analysis Center data by only including the most recent two reports (2003 and 2004) –
timeframes not included in the other published databases.

35
Table 15: Surface Water Cesium-137 and Plutonium-239, 240
Surface Water Cesium-137 and Plutonium 239, 240: Sea of Japan and NW Pacific Ocean. Data from ASPAMARD, HAM, GLOMARD databases. Japan Chemical Analysis Center reports and Japan Sea cruise samples (lto et al, 2003).
137Cs 239+240Pu #samples mean SD #samples mean SD Bq/m3 mBq/m3 ASPAMARD 168 2.7 1 261 5.9* 0.8-1.4** (1995-2001) (# of sites) *median **92% GLOMARD (1996-2000) Sea of Japan 44 2.8 0.5 30 6.6 2.5 NW Pacific 30 2.4 0.5 6 3.8 2.4 HAM NW Pacific(1997) 2.1 0.9 2 1.5 Japan Chem Center - 2003 Report NW Pacific 9 1.74 0.41 Sea of Japan 5 2.04 0.38 - 2004 Report NW Pacific 9 1.91 0.48 Sea of Japan 5 2.1 0.29 Japan Sea Cruises (Ito et al, 2003) Northern Japan Sea 4 2.58 0.26 South Japan Sea 6 2.62 1.14 1 <.04 Total Japan Sea 10 2.6 0.89
HAM: Hirose K, Aoyama M. Present background levels of surface 137Cs and 239,240Pu concentrations in the Pacific. Journal of Environmental Radioacitivity 69(2003) 53-60. GLOMARD: Povinec P, Hirose K, Honda T et al. Spatial distribution of 3H, 90Sr, 137Cs and 239,240Pu in surface waters of the Pacific and Indian Oceans -GLOMARD database. Journal of Environmental Radioacitivity 76(2004)113-37. ASPAMARD: Duran EB, Povince PP, Fowler SW, et al. 137Cs and 239+240Pu levels in the Asia-Pacific regional seas. Journal of Environmental Radioacitivity 76 (2004) 139-160. Japan Sea Cruises: Ito T, Aramaki T, Kitamura T, et al. Anthropogenic radionuclides in the Japan Sea: their distributions and transport process. Journal of Environmental Radioactivity (2003):68, 249-267. Radioactivity Survey Data in Japan, Japan Chemical Analysis Center, reports 138,139.
The HAM database provides a substantial summary of published and governmental reports
regarding seawater monitoring of the North Pacific Ocean (primarily northwest) and its seas. The
HAM database was recently made available (personal communication: Aoyama, 2004) for
analysis and plotting (Vyas and Mun, 2004). Surface seawater Cesium-137 data from 1990-1998 is

36
geographically pictured for the Sea of Japan, the Sea of Okhotsk, and the Northern region of the
Pacific Ocean (figure 1) – applying a lower latitude range limit of 40 degrees.
Figure 1: Cesium-137 in the North Pacific Surface Water, HAM database
0 1,600 3,200800 Miles
Projection: Robinson World ProjectionData Source: HAM Database
using ArcGIS (ESRI, 2000)
- 137Cs (after 1990: Bq/m3)0.062 - 0.710
0.711 - 1.800
1.801 - 2.380
2.381 - 2.860
2.861 - 10.200
Spatial Distribution of 137Cs Concentrations (1990+)Data Source: HAM database, 1957-1998
It should be noted that the highest cesium-137 concentrations identified in HAM for the
Northern (above 40 degrees) Pacific region and its seas are in the Sea of Japan (up to 2.9-10.2
Bq/m3 ) and in the Pacific Ocean off the Northern coast of Japan. The database contains no
samples the represent the Aleutian Chain of islands, and few recent samples from the Sea of
Okhotsk. Similar sampling patterns exist for strontium-90 (figure 2) and for plutonium-239 and
240 (figure 3), not unexpected since voyages for sampling usually collect specimens for a broad
range of radionuclide assessments.
Figure 2: Strontium-90 in the North Pacific Surface Water, HAM database

37
0 1,600 3,200800 Miles
Projection: Robinson World ProjectionData Source: HAM Database
using ArcGIS (ESRI, 2000)
- 90Sr (after 1990: Bq/m3)0.045 - 0.330
0.331 - 1.150
1.151 - 1.500
1.501 - 1.830
1.831 - 4.800
Spatial Distribution of 90Sr Concentrations (1990+)Data Source: HAM database, 1957-1998
Figure 3: Plutonium 239 and 240 in the North Pacific Surface Water, HAM database
0 1,600 3,200800 Miles
Projection: Robinson World ProjectionData Source: HAM Database
using ArcGIS (ESRI, 2000)
- 239,240Pu (after 1990: Bq/m3)0.000002 - 0.000020
0.000021 - 0.000029
0.000030 - 0.000038
0.000039 - 0.003400
0.003401 - 0.037600
Spatial Distribution of 239,240Pu Concentrations (1990+)Data Source: HAM database, 1957-1998
A summary of average marine surface water concentrations for Cs-137, Sr-90, Pu-239 and 240,
and tritium – extracted from the WOMARS Project and from GLOMARD, is provided for two recent
time intervals (table 16). There is substantial consistency of values, with a suggestion of some
decreases in Sr-90 and Pu-139,240. Only one set of comparable tritium data is available from each time

38
period, and it shows lower concentrations, decreasing from 165 Bq/m3 in 1991-1995 in Upstream
Kuroshio Currents to 136 Bq/m3 in the more recent 1996-2000 period.
Table 16: Surface Water Average Radionuclide Values, Pacific Ocean, 1991-95; 1996-2000
Cs-137 Sr-90 Pu-239/40 Tritium Pacific Ocean Bq/m3 Bq/m3 mBq/m3 Bq/m3
1991-1995 Data Japan/East Sea 2.7 (0.5) 1.8 (0.4) 8.5 (5.8) 330 (70) Subarctic Pacific, N40+ 2.3 (0.6) 1.8 (2.7) 5.3 (5.0) 210 (70) Upstream, Kuroshio Currents, N25-40 2.7 (0.6) 1.7 (0.5) 5.5 (2.4) 165 (12) Downstream, Kuroshio Currents, N25-40 2.8 (0.5) 1.41 (0.07) 0.71(0.13) 177 (12) Upstream, N Equatorial/Calif Currents,N5-25 2.3 (0.3) 1.12 (0.15) 1.7 (0.7) 112 (17) Downstream, N Equatorial Current 2.7 (0.6) 1.61 (0.18) 3.4 (1.4) NA 1996-2000 Japan/East Sea 2.8 (0.5) 1.6 (0.3) 6.6 (2.5) NA Subarctic Pacific, N40+ 2.0 (0.5) 1.3 (0.3) 7.8 (8.7) NA Upstream, Kuroshio Currents, N25-40 2.4 (0.5) 1.6 (0.3) 3.8 (2.4) 136 (8) Downstream, Kuroshio Currents, N25-40 NA NA NA NA Upstream, N Equatorial/Calif. Currents, N5-25 NA NA NA NA Downstream, N Equatorial Current, N5-25 2.4 (0.4) 1.5 (0.09) 2.4 (0.7) 109 (7) ( ) = 1 standard deviation N = Degrees Latitude
Source of 1996-2000 data, WOMARS project, Povince, Livingston, Shima et al, 2003. Source of 1991-1995 data: GLOMARD database, Povinec, Hirose, Honda et al, 2004. Note: all data is decay-corrected to Jan 1, 2000
9.23 Sediment Data on sediments vary considerably by location of sampling, since local depositions can
influence concentrations, as well as whether surface or deeper core samples are assessed. In the
following table (table 17), a range of sediment data has been assembled for the North Asian Pacific
Ocean region (Povinec, Fowler et al, 2004).
Table 17: Radionuclides in Sediment Samples in North-Asian Pacific Ocean
All data is decay-corrected to March 2001 9ASPAMARD). Surface sediment (0 to 2cm) concentrations by latitude. Cesium-137 Data Plutonium-239/40 Data (Bq/kg dry w) (Bq/kg dry w) Range Median Range Median

39
Latitude 40-45N 0.6-23.4 1.7 0.1-2.7 0.2 35-40N 0.5-14.9 9.7 0.1-3.7 2.2 30-35N 1.4-4.5 1.8 0.1-0.4 0.2 25-30N 0.2-0.4 0.3 0.02-0.5 0.1 20-25N 0.1-3.9 1.4 NA NA 15-20N 0.9-1.9 1.2 NA NA 10-15N 0.6-3.4 1.2 0.03-0.1 0.1
Source: Duran, Povinec, Fowler, et al, 2004. ASPAMARD = Asia-Pacific Marine Radioactivity Database. Countries included = Australia, Bangladesh, China, India, Indonesia, Republic of Korea, Malaysia, Pakistan, Philippines, Sri Lanka, Thailand and Vietnam. NA = data not available.
Sediment data more specific for the Sea of Japan and for the North Pacific near the
Japanese coast are displayed in the following table (18).
Table 18: Radionuclides in Japanese Marine Sediments
Strontium-90 and Cesium-137 data. Sample dates: April 2001-March 2003 Sea of Japan Sr-90 Cs-137 April 2002-March 2003 # sample sites 5 5 Ave Conc (Bq/kg-dw) 0.638 6.45 April 2001-March 2002 # sample sites 5 5 Ave Conc (Bq/kg-dw) 0.396 2.08 N Pacific, Japan Coast April 2002-March 2003 # sample sites 9 9 Ave Conc (Bq/kg-dw) 0.043 1.10 April 2001-March 2002 # sample sites 9 9 Ave Conc (Bq/kg-dw) 0.043 1.31
References: Japan chemical analysis center, radioactivity survey Data in Japan. Reports 138 (Oct. 2003) and 139 (Aug. 2004).
9.3 Hong Kong Marine Biota Concentrations South China Sea

40
The Hong Kong Observatory performs annual environmental monitoring on sea fish,
shellfish and four species of seaweed (Ulva lactuca, enteromorpha prolifera, porphyra dentate, and
sargassum hemiphyllum) for radionuclides, including plutonium 239, tritium, strontium-90,
carbon-14, iodine-131, cesium-137 and potassium 40. Radionuclide monitoring data in 2002 and
2003 (table 16) show that Cs-137, Sr-90 and Tritium were all found at measurable concentrations
in Hong Kong area marine fish – with positive results of Cs-137 in the hair tail fish for both years
tested. No Pu-239 concentration was found above the detection limit, so it is omitted from table 19.
Table 19: Radionuclides in Marine Fish
Hong Kong Environmental Monitoring. Hong Kong Observatory, 2003-03. Data from samples with Measurable Activity. Fish Cs-137 Sr-90 Tritium (Bq/kg) (Bq/kg) (Bq/kg)
2003 Nemipterus japonicus 0.04 0.007 0.9 (Melon coat) Trichiurus haumela 0.1 (Hair tail) Platycephalus inducus 1.4 (Bartail flathead)
2002 Nemipterus japonicus 0.01 (Melon coat) Trichiurus haumela 0.1 0.014 (Hair tail) Platycephalus inducus 1.3 (Bartail flathead)
References: Li SW and Yeung KC, Hong Kong Observatory, Summary of Environmental Monitoring in Hong Kong 2003. Technical Report No. 23, 2004. Hong Kong Observatory. Environmental Radiation Monitoring in Hong Kong. Technical Report No. 22, Annual Report 2002. May 2003.

41
Radionuclide data in shellfish, gastropod and cuttlefish, as well as seaweed, are also
analyzed annually by the Hong Kong Observatory and data are summarized for 2003 (table 20).
Cesium-137 was not measurable in any of the seaweed or shellfish samples. Sr-90 was found at
higher levels in seaweed than in shellfish – reflecting the known differences in concentration
factors by organism for different elements (see Section 11.1: Concentration Factors).
Table 20: Hong Kong Environmental Radionuclide Monitoring Data
Hong Kong Observatory 2003. Average (range) in Seaweed & Shellfish Tritium Sr-90 Cs-137 Pu-239 K-40 Seaweed Bq/kg Bq/kg Bq/kg Bq/kg Bq/kg Ulva lactuca 0.118 (Sea lettuce) (.078-0.16) Enteromorpha prolifera 1.90 .046 (Sea hair) Porphyra dentate 0.279 (Red algae) Sargassum hemiphyllum 0.277 0.05 (Brown algae) (0.209-0.345) Shellfish/other Tapes philippinarum 1.00 0.012 (clam) Perna viridis 0.95 0.0065 (Green-lipped mussel) (0.02-0.1) (0.006-0.007) Portunus sanguinolentus 0.008 (Three-spotted crab) (0.005-0.010) Babylonia formosae 0.90 (Gastropod) Sepia spp 1.40 (Cuttlefish)
Reference: Hong Kong Observatory Technical Report No. 23, “Summary of environmental Monitoring in Hong Kong 2003, Li SW and Yeung KC.

42
9.32 Seawater All samples of seawater (and particulates suspended in seawater) assessed for Pu-239, Sr-
90, I-131 and Cs-137 were below the level of detection in the Hong Kong laboratories. Potassium-
40 concentrations were below detection limits in suspended particulates, but data on upper, middle
and lower level samples off of four Japanese island areas is provided (table 21).
Table 21: Potassium-40 in Hong Kong Seawater
Hong Kong Seawater Radionuclide Datasheet: HK Observatory. Technical Report No.22, Annual Report 2002. Bq/m3 Concentration. Seawater sample site K40 in: Upper Middle Lower Level Waglan Island 11,500 12,800 11,900 Basalt Island 11,400 10,800 12,300 Tai Long Wan 11,000 12,400 13,500 Port Island 10,400 12,900 11,700 Average 11,100 12,200 12,400 Overall Average: 11,900 Bq/m3
Reference: Hong Kong Observatory, Environmental Radiation Monitoring in Hong Kong. Technical Report No.22, Annual Report 2002, published May 2003.
9.33 Sediment The sediment concentrations of radionuclides are shown for intertidal upper and lower
layers and for the seabed in the Hong Kong marine environment (table 22). Where concentrations
were less than detection limits (designated by <), one half of the detection limit was used in
calculating average values of a data column.

43
Table 22: Hong Kong Environmental Radionuclide Monitoring.
Hong Kong environmental Radionuclide Monitoring. Hong Kong Observatory, 2002. Concentrations in intertidal and seabed sediments. Average concentrations in Bq/kg-dw (range). Intertidal Pu-239 K-40 Cs-137 upper-layer 0.22 531 0.50 0.07 523 0.90 0.18 510 0.70 <0.17 482 0.50 0.14 351 1.00 0.07. 316 0.90 0.06 361 1.20 <0.29 321 1.00 0.17 618 0.50 <0.11 568 0.40 <0.20 516 0.40 <0.15 533 0.50 Average 0.11 469 0.71 lower-layer Pu-239 K-40 Cs-137 <0,11 548 0.90 0,16 548 0.80 0.18 782 0.80 0.13 510 0.50 0.19 340 1.20 <0.08 353 1.00 <0.09 393 1.20 0.15 359 0.90 <0.26 576 0.40 <0.15 613 0.70 <0.20 503 0.40 <0.21 538 0.40 Average 0.11 505 0.77 Seabed Pu-239 K-40 Cs-137 0.57 299 0.80 0.66 325 1.00 0.50 418 0.70 <0.55 458 0.50 Average 0.50 375 0.75
Note: Averages with < detection limit are calculated using 0.5 of the specific detection limit.

44
Reference: Hong Kong Observatory, Environmental Monitoring Technical Report No.22, 2002.
9.4. Arctic and related Seas (Barents Sea, Norwegian Sea, Greenland Sea, Baffin Bay, Beaufort Sea, East Siberian Sea,
Chukchi Sea, Kara Sea, Pechora Sea)
The Arctic region has been, and continues to be assessed, because of its number of
anthropogenic sources of radionuclides that have contributed to, and could potentially contribute in
the future, to contamination of this area. The myriad of sources include waste releases from
Western European (Dounreay, Sellafield, Cap de la Hague) and Russian (Mayak) fuel reprocessing
plants, nuclear power plants (at least nine in the Arctic region: 2 Finland, 4 Sweden, 3 Russian)
and nuclear reactor dumping in the Kara Sea of nuclear submarine and icebreaker compartments
with (n=7) and without (n=6) spent nuclear fuel (Jennson et al, 2004). Radionuclide sources to the
Arctic region also include releases carried via rivers or bays from the Siberian Chemical Combine
and from the Mining and Chemical Industrial Complex of Zheleznogorsk, from the accidental
sinking of nuclear ocean vessels (Kursk, etc.) and aircraft (Thule accident), and from the accident
at Chernobyl. Overarching all of these potential sources has been the global impact of nuclear tests
– the largest of which was a 50 Mt atmospheric test at Novaya Zemlya in 1961.
9.41 Biota Various types of fish, as reported by the Arctic Monitoring and Assessment Programme
(Jensson et al, 2004), show similar concentrations of Cesium-137 – ranging from a low mean of
0.09 Bq/kg-ww in Dab to a high of slightly above 0.3 Bq/kg-ww in Shorthorn sculpin and
Flounder (table 23). It should be noted that Dab were mostly obtained from Icelandic waters with
generally low Cs-137 concentrations.

45
Table 23: Concentrations of Cesium-137 in Arctic Marine Fish
1995-2000 Data, in Bq/kg-ww Fish Type # samples ave conc. SD Bq/kg-ww Haddock (Melanogrammus aeglefinus) 65 0.25 0.11 Cod 394 0.22 0.08 (Gadus spp.) Shorthorn sculpin 10 0.31 0.16 (Myoxocephalus scorpius) Flounder 6 0.33 00.6 (Platichthys flesus) Capelin 3 0.16 0.08 (Mallotus villosus) Dab 247 0.09 0.03 (Limanda limanda)
Source: Jensson, Strand et al, AMAP, 2004
9.42 Seawater Cs-137 Concentrations of Cs-137 in surface seawater samples from the Norwegian Sea in
the year 2000 range from 1.7 to 8.5 Bq/m3 (Gafert et al, 2003). The concentrations appear to be
higher in the lower region of the Norwegian Sea (table 24). Cesium-137 concentrations from the
Arctic Ocean near the Norwegian territory of Svalbard are similar to those of the northern aspects
of the Norwegian Sea (table 23).
Technetium-99 concentrations are clearly lower in the Svalbard region of the Arctic Ocean
than in either region of the Norwegian Sea. It should be noted that Techneticium-99 results as a
beta decay product of 99Mo during nuclear reactions. It has a half-life of 213,000 years and over
200 TBq (note: T is “tera” or 1012 ) of it has been estimated to have been released to the
environment, with about 85% from nuclear fuel reprocessing plants and 15% from nuclear
weapons testing (Dowdall, Gwynn, Selnaes et al, 2003). The transport pathway of 99Tc from the

46
Enhanced Actinide Removal Plant (EARP) at Sellefield, UK to the Irish Sea, the North Sea and
then via the Norwegian Coastal Current to the Norwegian Sea and other Arctic waters has been
thought to take about three or four years of transit time (Brown et al, 1998). The Norwegian
Radiation Protection Authority has continued to monitor technetium as a priority marine pollutant.
Concentrations of Cs-137, Pu-239/40 and Sr-90 in seawater of many Northern European
marine environments are summarized in table 25.
Table 24: Norwegian and Arctic Surface Sea Water Data
Cesium-137 and Technetium-99, in Bq/m3. Samples from Year 2000 Norwegian Sea Arctic Sea Upper Lower Cesium-137 Average 3 6.1 2.8 Std Dev 0.8 2 1.2 n = 7 7 9 Technetium-99 Average 1.2 1.4 0.3 Std Dev 0.3 0.2 0.1 n = 7 8 6
Note: The Norwegian Sea “Upper” is between 65 and 70 N Latitude and 0 and 25 degrees Longitude. The Norwegian Sea”Lower” is between 60 and 65 N Latitude and 0 and 25 degrees Longitude. The Arctic Sea samples were above 70 N Latitude and 0 and 25 degrees Longitude. Reference: Gafvert T, Foyn L, Brungot AL, et al. Radioactivity in the Marine Environment 2000 and 2001, Results from the Norwegian Monitoring Programme (RAME), StralevernRapport 2003:8, Norwegian Radiation Protection Authority, 2003.
Table 25: Radionuclides in Surface Water, Northern European Seas
Data from the Murmansk Marine Biological Institute, Russia. Range of concentrations, Bq/m3, 1992-1994
Sea/Ocean Cesium-137 Plutonium239/40 Strontium 90 Norwegian Sea 3-28 Barents Sea 2-15 4-8 White Sea 11-15 10-11 Kara Sea 2-12 2-8 Laptev Sea 1-13 3.7-6.6 Greenland Sea 1.7-5.4* 2.1-7.1 1.0-2.0 Arctic Ocean 1-15 References: Matishov and Matishov, 2004

47
* Dahlgaard et al, 2004.
9.43 Sediment The sea sediment concentrations of Cesium-137 from the Svalbard and the Fram Strait
regions of the Norwegian Arctic Ocean are summarized in Bq/kg-dw in table 26. These samples,
which include surface and subsequent sequential one or two centimeter interval sections, were
collected between May and August of 2000. These samples do not demonstrate a particular pattern
of concentration gradient (direct or indirect) by sediment core depth.
Table 26: Cesium-137 Concentrations in Norwegian Arctic Ocean Sediments
Data collected in2000 and reported in Bq/kg-dw
Location Ocean Depth Sediment Depth Bq/kg-dw Ave; (SD) Fram Strait 2239 m 0-1 cm 6.7 (.3) 1-2 cm 7.7 (.5) 2-3 cm 7.7 (.5) Fram Strait 1284 m 0-1 cm 4.2 (.3) 1-2 cm 1.7 (.4) 2-3 cm 2.8 (.2) Fram Strait 173 0-1 cm 6.3 (.4) 1-2 cm 6.9 (.4) 2-3 cm 5.8 (.3) Svalbard ? 0-1 cm 2.5 (.1) 2-4 cm 2.3 (.2)
Reference: Gafvert T, Foyn L, Brungot AL et al. Radioactivity in the Marine Environment 2000 and 2001, Results from the Norwegian National Monitoring Programme (RAME), StralevernRapport 2003:8, Norwegian Radiation Protection Authority, 2003
Table 27: Radionuclides in Marine Sediments: N. European Seas
Radionuclides in Marine Sediments N. European Seas. Data from Murmansk Marine Biological Institute, Russia. Concentrations in Bq/kg-dw, 1990 decade.
Sea/Ocean 137 Cs 134Cs 239/240 Pu 238 Pu 90 Sr 41 K

48
Norwegian Sea 0.7-1.6 Barents Sea 0.2-11* 0.5-3.2 <.02-0.14 0.11-0.74 White Sea 1-60 0.9-1.5 1-4 Kara Sea 0.6-73.6 0.2-5.7 <0.02-0.1 0.5-3.5*** 12.8-21.4 Leptev Sea 1.6-13 Pechora Sea** 3.3-11.6 0.76-1.65
Reference: Matishov & Matishov 2004 *Barent Sea data excludes high concentrations found near Novaya Zemlya test areas, where concentrations reach 910 Bq/m2 **Pechora Sea data excludes concentrations within 100 km of Chernaya Bay, site of previous Soviet Union underwater nuclear tests. ***One of the 17 composite samples was less than detection level and is not included in this summary.
9.5 North Atlantic Region North Sea, Irish Sea, Celtic Sea, Baltic Sea, English Channel, North Atlantic.
Information on the North Atlantic Region reviewed in this section is substantial. The
following set of tables provides a summary of radionuclide concentrations, with data presented in
averages, ranges, or averages with standard deviations – depending upon the availability of data
for analyses.
9.51 Biota
The average cesium values (table 28) were highest in cod, at about 1.5 Bq/kg, while plaice,
mackerel and whiting concentrations were about the same, ranging from 0.3 to 0.5 Bq/kg. Most
fish composite values were above the limit of detection. Mollusks concentrations were generally
lower than those for cod, but similar to the other fish, while crustaceans values were somewhere
between cod and the other fish. It should be noted that the presented concentrations are slight
underestimates, in that the few non-detects were considered zero in the computations. This
approach was applied since the actual levels of detection were not available.

49
Fish cesium-137 concentrations, as derived from substantial (nearly 4400 fish) marine
surveys reported by the Norwegian Radiation Protection Authority (table 28b), show little
variation by most of the northern sites tested. The weighted (by pooled sample size) fish
concentrations in the Barents, North and Norwegian seas were 0.27, 0.24 and 0.35 Bq/kg-ww,
respectively. The fewer number of pooled samples from Skagerrak had concentrations three to four
times higher, at 1.08 Bq/kg. It should be noted that the percentage of non-detects was similar for
both the Barents and North Seas, at around 5%, considerably less than the 35% non-detects in
Norwegian Sea fish samples. All of the Skagerrak samples exceeded detection limits.
While the majority of the samples came from three types of fish - cod (n=61), haddock
(n=14) or saith (n=12) - wide variations in concentrations were not seen across the wider spectrum
of fish. The highest concentration, at 2.2 Bq/kg, in this data set was from a single pooled sample of
horse mackerel. The horse mackerel were from the Skagerrak and Kategatt areas, often influenced
by outflows of higher Baltic Sea cesium concentrations. Excluding single pooled sample results,
the highest concentrations (0.7 to 0.9 Bq/kg) were seen in sprat, whiting and Atlantic herring – and
each of these types of fish were distributed across three of the marine locations. Most of the other
fish concentrations ranged only between 0.1 and 0.3 Bq/kg.
Cod had the greatest proportion (42%) of the pooled samples. It was harvested from three
locations, the Barents, North and Norwegian Seas, and its cesium-137 concentration averaged 0.3
Bq/kg-ww. Cod appears to be a good indicator for fish biomonitoring, at least in northern
European waters, since it can be harvested in sufficient numbers, provides adequate sample mass
for radionuclide analyses, and because it reflects the mid to upper range of concentrations found in
other fish living in the same bodies of water from which it was collected. The upper cesium-137

50
concentrations found in cod from the Barents, North and Norwegian Seas were 0.40, 0.32 and 0.56
Bq/kg – values exceeded by very few other fish for those bodies of water.
Table 28: Cesium-137 Concentrations in Irish Sea Fish
Cesium-137 Concentrations in Irish Sea Fish, 2000-2001. Data in Bq/kg-ww Cod Plaice Mackerel Whiting # Composites 44 42 39 42 Average Conc. 1.52 0.34 0.31 0.47 Standard Dev. 1.49 0.28 0.56 0.43 # > detection 44 35 36 42 One extreme outlier value exists in each Mackerel and Whiting data set. Re-analysis of the same sets without the outliers finds: Analysis without single outlier/fish-type Mackerel Whiting # composites 38 41 Average Conc. 0.22 0.41 Standard Deviation 0.16 0.19
Data abstracted from: ryan TP, McMahon CA, Dowdall A, et al. Radioactivity monitoring of the Irish marine environment 2000 and 2001. The Radiological Protection Institute of Ireland (RPII), 2003.
Table 28a: Cesium-137 Concentrations in Irish Mollusks and Crustaceans, 2000-2001
Mollusks Crustaceans Bq/kg Bq/kg # Composites 18 24 Average Concentration 0.26 0.62 Standard Deviation 0.20 0.74 # below detection 1 5
Data summarized from: Ryan RP, McMahon CA, Dowdall A, et al. Radioactivity monitoring of the Irish marine environment 2000 and 2001. The radiological Protection Institute of Ireland (RPII), 2003.
Table 28b: Pooled Fish Samples Analyzed by the Norwegian Radiation Protection Authority
Number of Pooled Samples by Sea, Average Concentration and % Non-detect Cesium-137 measured in Bq/kg. Weighted Barents North Norwegian Skagerrak Total # Ave Conc* % nd Atlantic Salmon 2 2 4 0.28 0%

51
Atlantic Herring 2 2 3 7 0.62 0% Blue Whiting 3 3 0.27 67% Blackmouthed dogfish 1 1 0.69 0% Cat-fish 1 1 2 0.13 100% Cod 47 2 12 61 0.3 0% Dab 1 1 2 0.25 0% European plaice 1 1 2 0.15 50% Golden redfish 1 1 0.09 0% Greater argentine 1 1 0.14 100% Haddock 10 2 1 1 14 0.16 0% Horse mackerel 1 1 2.2 0% Lemon sole 1 1 1 3 0.21 33% Ling 1 1 0.65 0% Lumpsucker 1 1 0.1 100% Long rough dab 5 5 0.25 0% Mackerel 2 2 0.14 50% Norway pout 1 4 5 0.15 80% Norway redfish 2 1 3 0.15 33% Rabbitfish 2 2 0.2 100% Round ray 1 1 0.15 100% Saithe 7 1 4 12 0.3 16% Spotted catfish 1 1 0.2 0% Sprat 1 2 1 4 0.7 0% Torsk 2 2 0.28 0% Whiting 1 2 1 4 0.9 0% Witch 1 1 0.13 100% Total # Sample Pools 78 17 43 8 146 Wtd. Concen. Bq/kg 0.27 0.24 0.35 1.08 0.32 % Non-detects 5.10% 5.40% 34.90% 0% 13.70%
Note: the 146 pooled samples contained 4379 fish. Eleven other pooled samples with undefined number of fish were not included in this summary. Reference: Data extracted and analyzed from: Gafvert T, Foyn L, Brungot Al, et al. Radioactivity in the marine environment 2000 and 2001, Norwegian Radiation national Monitoring Programme, 2003.
9.52 Seawater
Table 29: Surface Sea Water Radionuclide Concentrations: N. European Seas and English Channel
Averages Estimates or ranges, 2000-2002
Cs-137 Sr-90 Pu-239/40 Tritium Tc-99 Am-241
Bq/m3 Bq/m3 mBq/m3 Bq/m3 Bq/m3 mBq/m3 English Channel, Goury,France 3.5 1.36 7.5 293 7 6 English Channel, general <4 2.0-10 3.0-40 60 North Sea General 2 to 8 5.0-30 3.0-40 3-4,000 5.0-10 Skagerak/Kateegat 15 to 60 <10.0 0.4-0.5

52
Western English Channel 1 to 3 to 30,000 Irish Sea and Scottish Waters 10 to 45 10 to 35 2.1 to 23,000 0.2-0.6 <1.4 - 5.4 Irish Sea: Wylfa area to 18,000
Sellafield Coast 200 2-4,000 160-560
Irish Sea: Coastline 2 to 35 up to 400 600-2000 nd - 23 44-500 Irish Sea: Offshore 9 to 35 100-700 14 - 30 10-110 Baltic Sea 50 Arctic/North Atlantic 5 <3 to <9 1 0.02-0.2
References: RIFE_8, 2003; SENES, 2003. NRPB, CEFAS and Enviros, 2004. MARINA II, 2004 (Arctic and North Atlantic Oceans, Baltic Sea, Skagerrak and Kattegat – upper range data); and RPII, 2003. Note:background tritium in continental waters before nuclear explosion era, 200-900 Bq/m3 (ref: UNSCEAR, 1982). Sr-90 values of 200-400 were annual meansnear nuclear reprocessing plant BNFL. I-129 in Baltic Sea, averages 3mB/m3. Tc-99 North Atlantic background is considered to be 0.005 Bq/m3. MARINA II, Annex B Pu-238 in English Channel, Goury, France: 4mBq/ m3 at Irish Sea and Scotland: 0.5mBq/m3 . PU-241 in English Channel, Goury, France: 0.2 Bq/ m3
9.53 Sediment
Table 30: Irish Sea Sediment Cesium-137 Concentration, 2000-2001
Data in Bq/kg, dry weight Coastline Sediments Offshore Sediments 2000 2001 2000 2001 # samples 17 14 9 3 Average 5.9 7.6 29.6 54.7 SD 4.4 3.6 32.6 21.9
Reference: Ryan et al, Radiological Protection Institute of Ireland (RPII) April, 2003. 9.6 Comprehensive Overview of Radionuclides in Marine Fish The concentrations of cesium-137 in fish has been, as noted in the previous sections, rather extensively studied in various marine environments. Table 30a summarizes the data, by type of fish, within ten marine locations within the Northern Hemisphere for which substantial data has been gathered. The first eight locations all have reasonably similar concentrations within fish, with data on cod being represented in six of the eight locations and having a rather tight two-fold range in average concentrations from 0.2 to 0.38 Bq/kg-ww. In contrast, much higher average cesium-137 concentrations in cod, 6.44 to 8.86 Bq/kg-ww, are found in both the Irish and Baltic seas – areas that have been more impacted by nuclear reprocessing facilities (Sellafield for the Irish Sea) and by fallout from Chernobyl (Baltic Sea).

53
Table 30a: Cesium-137 concentrations in representative marine fish Cesium-137 Representative Marine Fish Concentrations (Bq/kg-ww) Data primarily from 1999 through 2003 Single concentration numbers are average values Location/Sea Species Concentration # (pooled) Reference Japan Tilefish 0.12 2 Japan Chemical Analysis Greenling 0.12 2 Center, 2003 Flounder 0.07 12 Rockfish 0.09 4 Mackerel (various) 0.12 18 Arctic Sculpin 0.3 10 Jensson et al, 2004 Flounder 0.3 6 Matishov&Matishov, 2004 Cod 0.2 394 Haddock 0.3 65 Hong Kong Melon Coat 0.04 Li and Yeung, 2003 Hair Tail 0.1
Barents Sea Cod 0.29 53 Gafvert et al, 2003 Haddock 0.2 10 CEFAS, 2003&2004 Ryan et al, 2003 North Sea Cod 0.38 21 CEFAS, 2003 & 2004 Haddock 0.2 10 Gafvert et al, 2003 Plaice 0.21 19 Norwegian Cod 0.32 20 Gafvert et al, 2003 Saithe 0.27 to 0.64 CEFAS, 2003& 2004 Mackerel 0.14 4 Ryan et al, 2003 N. Atlantic Cod 0.28 3 CEFAS, 2003&2004 Plaice 0.36 3 Gafvert et a;. 2003 Haddock 0.47 3 Mackerel 0.09 5 Channel Cod 0.2 8 CEFAS, 2003&2004 Plaice 0.06 16 Mackerel 0.19 8 Irish Cod 6.44 75 Ryan et al, 2003 Plaice 3.77 60 CEFAS, 2003&2004 Mackerel 0.31 39 Flounder 11.0 19 Haddock 1.1 10 Baltic Cod 8.86 7 CEFAS, 2003&2004

54
Information of the concentrations of other radionuclides in marine fish, as well as the US FDA minimum reporting levels and derived intervention levels (DILs) and international CODEX recommended limits, are shown in table 30b. The radionuclide concentrations of many of the northern hemispheric locations are summarized under one heading and are contrasted with findings from the somewhat more contaminated (yet still acceptable for commercial fishing) Irish Sea. While concentrations of individual radionuclides in fish are not easily compared to general food guidelines, which often are set on a group of radionuclides, it is apparent that the average concentrations found are nearly all cases only a trace percent of acceptable values. The concentrations in fish that equate with estimated cancer morbidity risks of from one in 10,000 to one in a million to consumers of 100 kg of fish per year are noted in table 30b. For example, an average concentration of cesium-137 in fish of 14 Bq/kg-ww, consumed at 100 kg per year, might present a one in ten thousand risk of increased cancer morbidity. The fish concentrations of cesium-137 in the northern hemisphere are, with the possible exception of the Irish Sea, 50 to 300 times lower than 14 Bq/kg. More information on procedures for estimating cancer risks is described in the next section. Table 30b: comparative concentrations of radionuclides in marine fish Key Values for Radionuclides in Marine Fish All Concentrations in Bq/kg-ww Cancer morb risk at Bq/kg in fish 100 Kg fish eaten/yr
Radionuclide Northern
Hemisphere Irish Sea
FDA Minimum reporting
levels FDA DIL Codex CA 10-4 CA 10-6 Cs-137 .04 to .33 0.31 to 11 5 1200e 1,000b 14 0.14 Sr-90 .007 to.01 .003 to.027 0.1 160 100c 8 0.08 Tc-99 .05 (crab) 0.05 to 5.8 10,000d 132 1.32 0.75 (mus) 2.2 to 41.5 (lobster) I-129 .005 to 1.6 100c 3 0.03 Am-241 0.0012 .0001 to .23 200 2a 1a 4 0.04 U-238 .008 to.015 6 0.06 Pu-238 8.5 E-6 to .0001 to .02 2a 1a 3 0.03 5.4 E-5 Pu-239/40 .0003 to .07 1.3 E-5 2a 1a 3 0.03

55
U-235 0.0035 to 100c 0.0046 Notes: a = totals for Am + Pu groups e = Cs-134, Cs-137
b = totals for S-35, C0-60, Sr-89, Ru-103, Cs-134, Cs-137, Ce-144 and Ir-192
c = totals for Sr-90, Ru-106, I-129, !-131, U-235 d = totals for H-3, C-14, Tc-99 FDA minimum reporting levels are the minimum concentrations reported in FDA food surveys for the noted radionuclides. Lower values are reported as zero. FDA DIL: FDA derived intervention levels (Bq/kg), are guidance levels for radionuclides in food that is used domestically in the United States and for foods imported into the United States. These concentrations are developed based upon the most susceptible age groups and are approximately equivalent to a 1 in 4400 cancer mortality risk over a lifetime. They assume a shorter term exposure (one or a few years) Codex: The Codex alimentarus is the proposed international guideline (WHO and the Food and Agriculture Organization of the United Nations) for radionuclides in food. These are food safety values, intended to screen food sources as acceptable for consumption for at least a one year timeframe. Cancer risks are lifetime estimates of cancer morbidity, assuming heavy seafood consumption of 100 kg/year (average values for general populations are 14 kg/year).
10.0 Human Risk Assessments: Ingestion of Radionuclides in Marine Biota
The comprehensive assessment of human risk from radionuclides in the marine
environment would take into consideration potential external exposure pathways (i.e., dose rate
and time spent near external sources, such as beaches or contaminated fishermens’ nets), inhalation
of resuspended contaminated soil and sediment, and - the focus of this review - ingestion of marine
foodstuff, including fish, mollusks and crustaceans. In order to assess reasonable estimates of
population seafood ingestion dose and cancer risks, it is necessary to have dietary consumption
data from site-specific surveys for the seafood types under consideration. Data is required for both
the general seafood consuming population as well as for potential critical groups, i.e., those likely
to have the highest rates of seafood ingestion. In addition, an average value is needed for
radionuclide concentrations for each type of radionuclide by each category of seafood consumed.

56
Average radionuclide consumption values can then be computed per food category and summated
according to the dietary patterns of the typical and high rate seafood consumer – across the time
period being considered (usually per year). Conversion from Bq/kg consumed for each
radionuclide measured is converted to dose in Sv/Bq or, if more convenient in data display or use
in uSv/Bq, by application of dose coefficient factors (DCFs) as developed by ICRP (ICRP, 1996).
The series of steps involved in the development of public radiation dose estimates (and
risks) from the ingestion of radionuclides in marine foodstuff (Figure Y) depict the various types
of data that are required to accomplish this task. Some degree of uncertainty is introduced in nearly
every step of the dose assessment process, and attempts to minimize or manage it are numerous,
including the appropriate design of the assessment study, the sampling process, the laboratory
analyses, the definition of the major pathways of exposure for the public – including design of
dietary surveys, minimizing errors in radiation dosimetry and the application of procedures for
data analyses. Some radionuclide sample analyses might result in non-detected concentrations, and
different approaches exist on how to handle such results, ranging from assuming zero, mid-point of
detection limit or detection limit for non-detected samples. Each approach can be used, and,
depending upon the scenario, can be justified. There is a tendency to err in the direction of
providing an additional margin of pubic health protection by somewhat over-estimating exposure
(and risk) by assigning some value (either 50% or 100% of the non-detect value) when a few
samples of a sample set are non-detects.
FIGURE Y (TO BE DEVELOPED)
10.1 Marine Seafood Ingestion Risk Assessment – Examples
10.11 United Kingdom A substantial set of information exists on UK seafood consumption and radionuclide
concentrations. The following tables (tables 31 and 32) show the components and results of the

57
calculation of radionuclide dose in heavy seafood consumers in NE Ireland. As noted in the tables,
these heavy seafood consumers eat 73 Kg of fish and 3.65 kg of both crustaceans and of mollusks
per year. These values, while quite high, are not the highest seen in surveys of UK populations (see
Appendix 3).
Table 31:Radionuclide Dose Calculation for Heavy Seafood Consumers
North East Ireland, 2000. Heavy Consumer Diet: Fish, 73Kg; Crustaceans, 3.65Kg; Molluscs, 3.65 Kg Radionuclide Seafood Ave Activity Conc Bq/yr DCF uSv/yr Bq/kg uSv/Bq Technetium-99 Fish 0.4 29.2 6.40E-04 0.002 Crustaceans 85 310.25 6.40E-04 0.199 Molluscs 24 87.6 6.40E-04 0.056 Cesium-137 Fish 0.7 51.1 1.30E-02 0.664 Crustaceans 1 3.65 1.30E-02 0.047 Molluscs 0.4 1.46 1.30E-02 0.019 Plutonium-238 Fish 0.0001 0.0073 2.30E-01 0.007 Crustaceans 0.0026 0.0095 2.30E-01 0.002 Molluscs 0.016 0.0584 2.30E-01 0.013 Plutonium-239+240 Fish 0.0002 0.013 2.50E-01 0.003 Crustaceans 0.014 0.051 2.50E-01 0.013 Molluscs 0.095 0.347 2.50E-01 0.087 Americium-241 Fish 0.0002 0.015 2.00E-01 0.003 Crustaceans 0.022 0.08 2.00E-01 0.016 Molluscs 0.043 0.157 2.00E-01 0.031 Annual Dose, uSv 1.162
Calculated from data in: Ryan et al. Radioactivity monitoring of the Irish marine environment, 2000 and 2001, The Radiological Protection Institute of Ireland, 2003. Table 32: Radionuclides in North East Ireland Seafood for Heavy Consumers
Data Summary by Radionuclide and Seafood. Data in uSy per year. Fish Crustacea Molluscs Totals % Total
99 Tc 0.002 0.199 0.056 0.257 22.10% 137 Cs 0.664 0.047 0.019 0.73 62.80% 238 Pu 0.007 0.002 0.013 0.022 1.90%
239,240Pu 0.003 0.013 0.087 0.103 8.90% 241 Am 0.003 0.016 0.031 0.05 4.30%

58
Totals 0.679 0.277 0.206 1.162 % Totals 58.40% 23.80% 17.70% 100%
Calculated from data in: Ryan et al, Radiological Protection Institute of Ireland, 2003.
10.2 Natural vs Anthropogenic Radionuclides: North East Irish Sea Dose Estimate
In order to estimate total annual radionuclide consumption from seafood for a population, it
is necessary to discern the dietary intake of the component seafoods. The Radiological Protection
Institute of Ireland uses, for its own risk assessments, two generic seafood eating models: the
typical seafood consumer (40 g of fish, 2.5 g crustaceans and 2.5 g mollusks per day) and the
heavy seafood consumer (200 g of fish, 10 g of crustaceans and 10 g of mollusks per day ) (Ryan
et al, 2003). Converted to annual intake, the data becomes: typical consumer (14.8 kg/yr fish; 0.9
kg crustaceans and 0.9 kg mollusks) and heavy seafood consumer (73 kg/ yr fish; 3.65 kg
crustaceans and 3.65 kg mollusks). The following set of tables (tables 33-36) summarizes
estimates of natural radionuclide dose from consumption of seafood in NE Ireland, utilizing the
described “typical” and “heavy” consumer patterns. It should be noted that there are estimates for
seafood dietary intake for several countries and regions, with a few sites of the UK summarized in
Appendix 3.
10.21 Typical Consumption Pattern: Fish, Crustaceans, Molluscs
Table 33: Natural Radionuclide Dose Ingested by Typical Consumer of Fish
Based on RIFE diet survey of NE Ireland. Radionuclide Concentrations from the RIFE-8 Study
Fish: consumption at 14.6 Kg/yr Bq/kg Bq/yr uSv/Bq uSv/yr %total uSv 210Pb 0.025 0.365 6.91E-01 0.252 4.71 210Po 0.28 4.088 1.2 4.906 91.79 226Ra 0.04 0.584 2.80E-01 0.164 3.06 228Th 0.005 0.073 1.43E-01 0.01 0.19 230Th 0.001 0.015 2.10E-01 0.003 0.06 232Th 0.001 0.015 2.30E-01 0.003 0.06 234U 0.005 0.073 4.90E-02 0.004 0.07

59
238U 0.004 0.058 4.84E-02 0.003 0.06 Totals 5.271 5.345 100
Table 34 Natural Radionuclides in Seafood: Typical Consumption, Crustacean
Based on RIFE diet survey of NE Ireland. Radionuclide Concentrations from the RIFE-8 study. Crustacean: consumption at 2.5 Kg/yr
Bq/kg Bq/yr uSv/Bq uSv/yr %total uSv 210Pb 0.08 0.2 6.91E-01 0.138 0.87 210Po 5.2 13 1.2 15.6 98.89 226Ra 0.03 0.075 2.80E-01 0.021 0.13 228Th 0.01 0.025 1.43E-01 0.004 0.02 230Th 0.003 0.008 2.10E-01 0.002 0.01 232Th 0.003 0.003 2.30E-01 0.001 0 234U 0.04 0.1 4.90E-02 0.005 0.03 238U 0.035 0.088 4.84E-02 0.004 0.02 Totals 13.499 15.775 99.97
Table 35 Natural Radionuclides in Seafood: Typical Consumption, Mollusk
Based on RIFE diet survey of NE Ireland. Radionuclide Concentrations from the RIFE-8 study.
Mollusk: consumption at 2.5 kg/yr Bq/kg Bq/yr uSv/Bq uSv/yr %total uSv 210Pb 0.69 1.725 6.91E-01 1.192 3.96 210Po 9.4 23.5 1.2 28.2 93.78 226Ra 0.08 0.2 2.80E-01 0.056 0.19 228Th 0.37 0.925 1.43E-01 0.132 0.44 230Th 0.19 0.475 2.10E-01 0.1 0.33 232Th 0.28 0.7 2.30E-01 0.161 0.54 234U 0.99 2.475 4.90E-02 0.121 0.4 238U 0.89 2.225 4.84E-02 0.108 0.36 Totals 12.89 32.225 30.07 100
Table 36 Natural Radionuclides in Seafood: Typical Consumption, Total
Based on RIFE diet survey of NE Ireland. Radionuclide Concentrations from the RIFE-9 study. Fish Crustacea Mollusks Total % of Total uSv/yr uSv/yr uSv/yr uSv/yr 210Pb 0.252 0.138 1.192 1.582 3.09 210Po 4.906 15.6 28.2 48.706 95.15

60
226Ra 0.164 0.021 0.056 0.241 0.47 228Th 0.01 0.004 0.132 0.146 0.29 230Th 0.003 0.002 0.1 0.105 0.21 232Th 0.003 0.001 0.161 0.165 0.32 234U 0.004 0.005 0.121 0.13 0.25 238U 0.003 0.004 0.108 0.115 0.22 Totals 5.345 15.775 30.07 51.19 100
10.22 Heavy Seafood Consumer: Fish, Crustaceans and Mollusks The process by which an estimation of the committed effective radionuclide dose for the
heavy seafood consumer is determined is identical to that applied previously to describe the
Typical Consumer. The only difference is a larger quantity of seafood consumed, both in total and
by food type. By applying the NE Ireland consumption estimates for seafood, as defined by the
Radiological Protection Institute of Ireland (Ryan et al, 2003), to the average activity concentration
(in Bq/kg) of each radionuclide in fish, crustaceans and mollusks, one arrives at the radionuclide
and food-specific Bq/yr contribution. Then applying the dose conversion factor (in uSv/Bq), a total
uSv/yr dose for each radionuclide and seafood category is obtained, as previously shown. of the
Polonium-210 contributes 94.5% of the total natural radionuclide dose in heavy seafood consumers
in North East Ireland (table 37).
Table 37: Annual Consumption of Radionuclides by the Heavy Seafood Consumer
North East Ireland, 2000-2001, Average Annual Diet: Fish, 73kg; Crustaceans, 3.65kg; Mollusks, 3.65kg. Committed Effective Dose in uSv per Year.
Fish Crustacea Molluscs Totals 210 Pb 1.26 0.2 1.74 3.2 210 Po 24.53 22.78 41.17 88.48 226 Ra 0.82 0.03 0.08 0.93 228 Th 0.05 0.01 0.19 0.25 230 Th 0.015 0.002 0.146 0.163 232 Th 0.017 0.001 0.235 0.253 234 U 0.018 0.007 0.177 0.202 238 U 0.014 0.006 0.156 0.176
Totals 26.724 23.036 43.894 93.654

61
Data received from: Ryan et al, Radioactivity monitoring of the Irish marine environment, 2000 and 2001; The Radiological Protection Institute of Ireland (RPII-03/3), April, 2003.
10.23 Comparison: Natural and Anthropogenic Radionuclide Doses and Risks There are several approaches by which one may assess the relative importance of man-
made radionuclides in the human diet. One approach, of course, is human risk assessment –
usually focusing on cancer incidence or cancer mortality. That approach is reviewed in a
subsequent section. Another method is comparative. That is, it seeks to determine what proportion
of the total burden of radionuclides in the diet come from man-made sources versus the dose that
nature serves us. If that proportion of the total dose evolving from our own activities is very low,
then in the “scheme of things” it would not seem very important as a current contributor to the
overall radionuclide dietary concern. The next table (table 38) condenses and summarizes
information that has already been provided in this report, but with the intent of directly comparing
nature to man as primary radionuclide contributors to our food supply. The data is again derived
from the NE Ireland population, since information on dietary intake, natural and man made
radionuclide concentrations is readily available.
Table 38: Comparison: Natural and Anthropogenic Radionuclides
Dietary Doses in Heavy Seafood Consumers. North East Ireland, 2000 Natural Source Anthropogenic Source Total uSv Major Radionuclide Total uSv Major Radionuclide Fish 26.72 210 Po (24.5 uSv) 0.68 137 Cs (0.66 uSv) Crustacean 23.04 210 Po (22.8 uSv) 0.28 99 Tc (0.20 uSv) Mollusks 43.89 210 Po (41.2 uSv) 0.21 239,240Pu (.09 uSv) Total 93.65 1.17
Data derived from: Ryan et al, Radiological Protection Institute of Ireland, 2003.
As can be readily seen from the previous table, natural sources of radionuclides vastly
predominate the radiation load of the seafood diet of heavy seafood consumers in Ireland. Natural

62
levels total nearly 100 times greater than man-made sources. This is particularly important for the
target site, since the Irish Sea has been the recipient of radionuclide pollutant loads from Sellafield,
and has greater anthropogenic concentrations of radionuclides than the Arctic and North Pacific
Oceans, as well as several important seas of the northern hemispheres.
10.24 Cancer Mortality Risks of Radionuclides in Seafood: ICRP vs EPA The degree of cancer mortality risk associated with the consumption of seafood is
commonly estimated through application of a methodology advocated by the International
Commission on Radiological Protection (ICRP, 1991). In this approach, the total committed
effective dose (TCED), in Sv or uSv, is computed for the typical and heavy consumer of the
product. The dose is the average activity concentration of each radionuclide (in Bq/kg) in a food
times the annual quantity consumption of the food in question (kg/yr) times the dose conversion
factor for the radionuclide (Sv/Bq). The product is the number of Seiverts consumed in that food
product per year for that radionuclide. The summation across all radionuclides for all food
products considered (i.e., fish, crustaceans and mollusks) result in the total committed effective
dose for that set of food products.
We will continue with the example of the typical and heavy seafood consumer model of
NE Ireland that was developed in previous sections (10.11-10.23). As previously shown (table 38),
the NE Ireland heavy seafood consumer has an annual total committed effective dose of 93.65 uSv
from eating naturally occurring radionuclides in seafood and a total of about 1.17 uSv from
anthropogenic radionuclide contaminants in the same seafood. ICRP has defined the cancer
mortality risk of about 4.5 to 5.0 E-02 per Sv consumed (ICRP, 1991; Ryan et al, 2003). This level
of risk, which is based on the use of an effective dose, assumes that “the equivalent dose is fairly
uniform over the whole body” and it does not deal with possible influences of competing causes of

63
death – which could be of relevance in radionuclides with long biological and physical half lives.
However, regardless of these modest limitations, the ICRP approach is the international approach
used for estimating radiogenic cancer risks. By applying the cancer mortality risk per Sv to the
estimated number of Sv consumed in seafood, the incremental cancer risk from seafood can be
computed. The results of this computation, based upon a one year heavy diet of seafood in NE
Ireland containing a background level of natural radionuclides, is an estimate of overall
incremental risk of approximately 5.5 cancer deaths per million heavy seafood consumers over
their predicted lifetimes (table 39). Nearly 80% of the cancer mortality risk from natural
radionuclide components is attributed to Polonium-210, followed by about 16% from Uranium-
238. If this diet were consumed annually, then an accumulation of natural radionuclides would
result (tempered by biological and physical half-life considerations) such that the lifetime cancer
risk would increase.
Table 39:Cancer Mortality Risks of Heavy Seafood Consumers, NE Ireland (2000-2001)
Risks of Natural Radionuclides Consumed, Using ICRP Publication 60 (1991). Risk is a product of “effective dose” and “fatality probability coefficient” Fish Crustacea Mollusks Totals CA death Total CA uSv/yr uSv/yr uSv/yr uSv/yr risk/uSv risk
Pb-210 1.26 0.2 1.74 3.2 5.00E-08 1.60E-07 Po-210 24.53 22.78 41.17 88.48 5.00E-08 4.42E-06 Ra-226 0.82 0.03 0.08 0.93 5.00E-08 4.65E-08 Th-228 0.05 0.01 0.19 0.25 5.00E-08 1.25E-08 Th-230 0.015 0.002 0.146 0.163 5.00E-08 8.15E-09 Th-232 0.017 0.001 0.235 0.253 5.00E-08 1.27E-08 U-234 0.018 0.007 0.177 0.202 5.00E-08 1.01E-08 U-238 0.014 0.006 0.156 0.176 5.00E-08 8.80E-07 Totals 26.724 23.036 43.894 93.654 5.55E-06
Risks computed assuming cancer mortality risk of 5E-08 per uSv (or 5E-02 per uSv), and multiplying the effective dose components (or the sum of the components as the total effective committed dose) by the cancer probability coefficient (cancer mortality risk estimate). International Commission on Radiological Protection (ICRP), 1991. 1990 recommendations of the International Commission on Radiological Protection. Annals of the ICRP, 21 (1-3), Publication No. 60

64
International Commission on Radiological Protection (ICRP), 1996. Conversion Age-dependent doses to members of the public from intakes of radionuclides: Part 5, compilation of ingestion and inhalation coefficients. Annals of the ICRP, 26(1), Publication No.72
It is instructive to apply an alternative cancer mortality risk approach to the exact same NE
Ireland heavy seafood consumer population to note the degree of variability in results. The US
Environmental Protection Agency (USEPA) developed a somewhat different approach to
estimating environmental cancer risks. In its Federal Guidance Report No. 13, titled Cancer Risk
Coefficients for Environmental Exposure to Radionuclides (EPA, 1999), the Agency has
developed risk coefficients for ingestion of radionuclides in food. The food consumption patterns,
age and gender demographics, and information on age-gender mortality by major causes were
considered in estimating causes of death that would compete with potential radiogenic mortality.
This approach has also incorporated some newer data on the non-uniform distribution of thorium-
232 in vivo, as well as more recently developed low-LET radio-biologic effect estimates for
leukemia and breast cancer. In the EPA dietary intake model, however, the Agency assumes that
there is 100% contamination of the total food supply with the radionuclide, and therefore 1.2 kg of
contaminated food are ingested daily by the population. This assumption of a 438 kg annual
ingestion of contaminated foodstuff contrasts with the total heavy consumer of radionuclides in
seafood for NE Ireland, where a total of about 80 kg (73 kg fish and 7 kg of crustaceans and
mollusks) are consumed.
Table 40 shows the application of the EPA model to NE Ireland heavy seafood consumers.
Notice that the cancer mortality risks are provided per Bq of the specific radionuclide consumed.
The differences in the total degree of cancer mortality risk between the EPA and ICRP approaches
are not that substantial, with the EPA risk being about 40% lower – but not that different
considering the variations likely in international demographics, survivorship and competing causes
of death.

65
Table 40: Cancer Mortality Risks of Heavy Seafood Consumers, NE Ireland Data
Risks of Natural Radionuclides Consumed, Using EPA Coeffcients. Risks computed per Bq of Radionuclide Consumed. Fish Crustacea Mollusks Total CA death Total Ca Bq/yr Bq/yr Bq/yr Bq/yr risk/Bq risk
Pb-210 1.8 0.292 2.519 4.611 2.31E-08 1.07E-07 Po-210 20.44 18.98 34.31 73.73 4.44E-08 3.27E-06 Ra-226 2.92 0.11 0.292 3.322 9.56E-09 3.18E-08 Th-228 0.365 0.037 1.351 1.753 2.46E-09 4.31E-09 Th-230 0.075 0.012 0.694 0.781 2.16E-09 1.69E-09 Th-232 0.075 0.004 1.022 1.101 2.45E-09 2.70E-09 U-234 0.365 0.146 3.614 4.125 1.66E-09 6.84E-09 U-238 0.29 0.128 3.249 3.667 1.51E-09 5.54E-09 Totals 93.09 3.43E-06
Risks computed using coefficients in: EPA Cancer Risk Coefficients for Environmental Exposure to Radionuclides, Federal Guidance Report No. 13, September, 1999 (EPA 402-R-99-001).
Of interest is the relatively low cancer mortality risk attributable to anthropogenic
radionuclides in the seafood diet compared natural ones. While mortality risks of 3.4 (EPA model)
to 5.6 (ICRP model) in a million heavy seafood consumers per year are estimated from natural
radionuclides, the risks of the same ingested food from man-made radionuclides are only about 1%
of the natural radionuclides, ranging from 6 to 7 per hundred million per year (table 41).
Table 41: Cancer Mortality Risks of Heavy Seafood Consumers, NE Ireland
Anthropogenic Radionuclide Risks: epa vs ICRP Models. Comparison of EPA and ICRP Cancer Mortality Risks. EPA CA Mortality ICRP CA Mortality
Bq/yr Deaths/Bq Risk uSv/yr Risk Tc-99 427.1 6.17E-11 2.63E-08 0.257 1.29E-08 Cs-137 56.2 6.88E-10 3.87E-08 0.73 3.65E-08 Pu-238 0.1 3.50E-09 2.80E-10 0.022 1.10E-09 Pu-239+40 0.4 3.63E-09 1.48E-09 0.103 5.14E-09 Am-241 0.3 2.56E-09 6.45E-10 0.05 2.50E-09 Total CA Mortality Risk: 6.74E-08 1.162 5.81E-08
References: Federal Guidance Report No. 13, September, 1999 (EPA 402-R-99-001). International Commission on Radiological Protection (ICRP), 1991. 1990 recommendations of the International Commission on Radiological Protection. Annals of the ICRP, 21 (1-3), Publication No. 60.

66
International Commission on Radiological Protection (ICRP), 1996. Age-dependent doses to members of the public from intakes of radionuclides: Part 5, compilation of ingestion and inhalation coefficients. Annals of the ICRP, 26 (1), Publication No. 72.
11.0 Ecological Risk Assessments from Marine Radionuclides
There has been a recent recognition that the previous model regarding environmental
protection, i.e., the “belief that the standard of environmental control needed to protect humans
will ensure that other species are not put at risk” (Coppleston et al, 2004; ICRP, 1991) is not
necessarily a protective approach for the ecological environment. In this section we will only
briefly review selected aspects of this complex issue, including the preferential sequestration of
environmental radionuclides in certain biota (i.e., concentration factors), the selection of
representative marine biota around which data can be developed and protective approaches
developed, the debate regarding what to measure (and protect) as metrics of ecological health, and
a summary of a recent European evaluation of the scientific literature on radionuclide marine
ecotoxicology – in the quest for “acceptable exposure limits”.
11.1 Concentration Factors – indicators of biological uptake Radionuclides in marine water columns tend to concentrate to varying degrees in
organisms living in such columns. The degree of preferential passage (transfer and uptake) of
dissolved or particulate-linked radionuclides from water columns to biota is characterized, at least
to some extend, by the Concentration Factor (CF) concept. The CF for a marine organism is the
ratio of the concentration of a radionuclide in that organism to its concentration in its marine water
environment under conditions of equilibrium. In natural settings, the state of equilibrium is usually
assumed – since it can best be assured only under artificial laboratory conditions. The CF, while
widely used, does have a number of limitations. A recent review cited several criticisms of the
approach, including that the CF does not provide insight on how biological uptake occurs (i.e.,
mechanisms or processes), has limited supporting data for many radionuclide/organism

67
combinations, and is less supported for estimating higher trophic-level organisms since it is
difficult to characterize complex food chain accumulation with a single ratio (FASSET,2003).
Furthermore, the CF approach can be human-centric or eco-centric, that is, it can focus on
concentration considerations most important to human health (i.e., concentrations in human-edible
sections of human-edible organisms) or considerations most important to other components of the
ecosystem that are not directly a part of the human food chain.
A recent summary provides an excellent overview of CFs by generic category of marine
organism (FASSET, 2003). Some data extracted from that work are shown in the following table
(table 42). Concentrations of 10,000 to over 100,000 fold exist in at least one of the phytoplankton,
macoalgea, zooplankton, mollusks or crustacean families for several radionuclides, including Pu,
Am, Po, Tc, and Pb. In contrast, the concentration factor for strontium is 10 or less in all of the
categories of organism, and the elements cesium and uranium are reported to have concentration
factors less than 100, also in all categories. Some elements have wide ranges of concentration,
depending upon the organism. For example, iodine concentrates over 1000 fold in macroalgae and
in zooplankton, but is noted concentrated to a great extent in such marine biota as mollusks,
crustaceans or fish.
Table 42: Marine Organism concentration Factors of Radionuclides
IAEA Techdoc 247: FASSET, 2003 CF: > 105 >104,<105 >103,<104 >102,<103 >10, <102 10 or less Phytoplankton Pu, Am Pb,Po I Cs,Tc,U Sr Macroalgae Tc I,Am,Pu Pb,Po Cs,U Sr Zooplankton Po I,,Am,Pu Pb Cs,U,Tc Sr Mollusca Pb,Po Pu Am,Tc Cs,U Sr,I Crustaceans Pb,Po Am,Pu,Tc Cs Sr,I,U

68
Fish Po Pb Am,Pu,Tc, Cs Sr,I,U
Data adapted from FASSET, Deliverable 5, Appendix 2, October, 2003.
It is important to consider the potential for certain radionuclides to exhibit a preferential
concentration within specific organ systems – since such data could provide information useful for
the early markers of contamination. For example, Tc-99 is found at concentrations 10 to 1000
times higher in the green gland of the European lobster than in its muscle (FASSET, 2003).
Measures of Tc-99 in this organ could, therefore, provide a more sensitive indicator of
environmental contamination than might data from whole lobsters or edible muscle samples. Some
data, from studies on organisms in their natural environments, on comparative organ
concentrations for selected radionuclides in certain marine organisms are noted in table 43.
Table 43: Organ Concentration Factors for Radionuclides in European Marine Organisms
Organ and Radionuclide Specific Concentration Factors. CF= concentration organ/seawater Muscle Hepatopancreas Shell Bone or Exoskeleton Lobster Tc=5000 Tc=1400 Tc=1100 Crab Tc=20 Tc=160 Shrimp Sr=15 Po=2E+4 Sr=25 Po=3E+3 Molluscs Cs=3 to10 Po=7E+4 Cs=2 to 5 Po=2E+3 Po=1E+4 Pu=800 Pu=2E+3 Po=3E+4 Fish Cs=100 Po=3E+5 Sr=4 Seabird Cs=400 Cs=500
Data summarized from: FASSET, Deliverable 5, Appendix 2, October, 2003.

69
An additional set of information has been compiled by FASSET for experimental studies
undertaken in controlled environments. The advantages of such studies include assuring that
equilibrium conditions are met and that the biota survive in relatively non-competitive conditions,
there is the disadvantage of not being able to simulate “real life” exposure complexes (currents,
sediments, organic loads, etc.) nor typical ecologic food chains characteristic of a region.
However, the results of such studies are still of value and are summarized in the next table.
Table 44: Concentration Factors for marine biota from Experimental Studies
Whole Muscle Hepatopancreas Shell Exoskeleton Algae (brown) Am=380 Cs=4 Tc=10500 Crab Am=145 Am=5 Am=5 Am=240 Pu=6.5 Pu=2 Pu=70 Shrimp Po=150 P0=40 Po=640 Po=290 Pb=675 Pb=40 Pb=610 Pb=1775 Mollusks Am=265 Np=14 Np=47 Cs=8 I=5 I=3 Fish Cs=3
FASSET, Deliverable 5, Appendix 2, 2003.
Information from CF estimates can be used in both directions, that is, if actual sampling
data is available on biota for specific radionuclides, then estimates of marine water concentrations
can be made by applying the CF. Conversely, if the only sampling data available is on seawater
radionuclide concentrations, then CFs may be useful to estimate the range of concentrations that
might be expected in various types of marine life – taking into account the various caveats
previously discussed about the CF. To be sure, there are a number of factors that may influence the
actual CF, including specific biota, temperature and dissolved organic matter in seawater, region of

70
the marine environment and other issues. Despite these complications, there is still wide use of the
CF in marine investigations, supplemented by major advances in marine ecosystem modeling of
release, transport and uptake mechanisms.
11.2 Reference Marine Biota
For human radiation protection, there is the concept of the reference man (or woman),
which is used to develop dosimetric models, comparative data, and risk assessments. There has
been a major interest in developing an analogous concept, reference organisms, to be developed
and applied in order to coordinate the collection of comparative data and to assess our
deffectiveness at protecting the environment. An early step in the process of defining the extent
and consequence of radionuclide exposure to marine biota, is to standardize, for comparative
purposes, a relatively small set of organisms that are typically found in major marine environments
and have, from an exposure perspective, “radioecological sensitivity” (Strand et al, FASSET
Deliverable 1, 2001). FASSET uses the term “radioecological sensitivity” as an indication that
certain organisms are indicators of high exposure to radionuclides due to either their proximity to
contaminated sediment (i.e., the organisms habitat and feeding habits), their ability to
bioconcentrate radionuclides (increase internal exposure, i.e., dose), or their top predator position
in the foodchain which leads to biomagnification (i.e., increasing concentrations higher up the
foodchain) of radionuclides. This information, coupled with ecological relevance and the
availability of dose-response relationships, have formed the basis of the development of a set of
reference organisms (table 45). Because of the focus of our review, only information relevant to
the marine environment has been considered from the FASSET reports.

71
Table 45: Environmental Reference Organisms as indicators of Marine Radiation
Rationale for inclusion as priority Marine Organisms Water Sediment External High Bioconcentration Column Conc. Bacteria Yes alpha part. Worm Yes beta-gam potential Bivalve Molluscs Yes beta-gam 106Ru, 210Po, 239Pu,241Am Gastropod Molluscs " " " " Crustaceans Yes beta-gam 99Tc, 210Po Phytoplankton (microalgae) Yes 210Po, 226Ra, 239Pu Zooplankton Yes 210Po Macroalgae(seaweed) Yes 99Tc, 106Ru, 129I Fish Yes Yes beta-gam 137Cs Plus biomagnification Vascular plants Yes beta-gam 226Ra, 238U Mammals Yes Yes Particle reactives + alphas Wading Birds Yes Yes beta-gam Particle reactives + alphas
Reference: Adapted from FASSET, Deliverable 1: Identification of candidate reference organisms from a radiation exposure pathways perspective, (Strand et al, ed) November 2001.
FASSET researchers have reviewed environmental dosimetry (organisms with high dose
rates), exposure pathways (maximally exposed organisms for specific radionuclides in certain
marine environments) and assessment of environmental effects (radiosensitivity, ecological
sensitivity and importance) to develop a set of reference organisms for the marine (and other)
environment. They limited their focus to a subset of twenty radionuclides and their principal
radioisotopes (table 46), selected because of the type of their radiation emission, their
environmental mobility and biological uptake, their importance from a regulatory standpoint
(hazardous waste, etc.), and because there is sufficient data available for assessment purposes.

72
Table 46: Key Radionuclides considered in determination of Reference Organisms
Mammal
Radionuclide Mobility Radiation Biologic Key Radioisotopes (element group) half life half life*
H High 12 y days Tritium C High 5.6E3 y days 14C K High 1.3E9 y weeks 40K Cl Moderate 3.01E5 y 36Cl Ni Low 96 y 63Ni 7.5E4 y 59Ni
Sr High 50.5 d years 89Sr 28.5 y 90Sr
Nb Low 2.03E4 y 94Nb Tc High 2.13E5 y days 99Tc Ru High 368 d days 106Ru I High 1.57E7 y wks-mos 129I 8.04 d 131I
Cs High 2.06 y wks-mos 134Cs 30 y 137Cs 2.0E5 y 135Cs
Po High 138 d weeks 210Po Pb High 22 y years 210Pb Ra Moderate 1.6E3 y years 226Ra
Th (Actinide series) Very low 18.7 d years 227Th 1.9 y 228Th 7.7E4 y 230Th 25.5 h 231Th 1.4E10 y 232Th 24.1 d 234Th
U (Actinide series) Low-mod. 2.45E5 y months 234U 7.04E8 y 235U 4.47E9 y 238U
Pu (Actinide series) Very low 88 y years 238Pu 2.4E5 y 239Pu 6.5E3 y 240Pu 14.4 y 241Pu
Am (Actinide series) Very low 4.32E2 y years 241Am Np (Actinide series) Very low 2.1E6 y years 237Np Cm (Actinide series) Very low 163 d years 242Cm
28.5 y 243Cm 18.1 y 244Cm

73
*for the element, not specific for the isotope Source: FASSET, Deliverable 1: Identification of candidate reference organisms from a radiation exposure pathways perspective. (Strand et al, eds), November 2001.
11.3 Marine biota ecological metrics: What to Measure?
11.4 Marine biota radio-ecotoxicology: Current Status
This section summarizes the key findings of a recent comprehensive review of the literature
under the European Commission’s Framework for Assessment of Environmental Impact
(FASSET), included in the FASSET Radiation Effects Database or FRED (FASSET, 2004). The
data set included acute and chronic experimental studies addressing morbidity, mortality, reduced
reproductive success and mutation in 16 wildlife groups – including fish, crustaceans, mollusks,
aquatic invertebrates, aquatic plants, zooplankton, birds, amphibians, mammals, and others. Of
particular relevance to the current review were the chronic and acute studies on fish. A total of 110
studies were represented in the chronic fish study database (an over-count, since a study – for the
purposes of this report – was recorded separately for each of one to four endpoints that it might
address). Sixty-nine of those studies specifically assessed dose-response data, while 41 studied
background incidence of the events. Only the morbidity and reproductive capacity studies covered
a wide range of dose-rates, while mutation studies were primarily at high dose-levels and very few
studies were available for chronic mortality studies (table 46a).
Table 46a: Chronic Fish Radiotoxicity Studies Summarized in FASSET Toxicity Database
Number of Studies Reported in FASSET Dose-rate (uGy/hr) Morbidity Mortality Reproductive Mutation Totals Background 9 4 21 7 41 <99.9 2 0 6 0 8 100-199.9 2 1 2 1 6 200-499.9 1 0 5 0 6 500- 1 0 5 0 6

74
999.9 1,000-1,999.9 1 0 6 0 7 2,000-4,999 3 0 4 1 8 5,000-9,999 2 0 6 2 10 >10,000 4 0 10 4 18 Totals 25 5 65 15 110
Reference: FASSET, Deliverable 4, Radiation Effects on Plants and Animals. June 2, 2003. (adapted from)
Chronic irradiation of fish at rates 100 to 1000 uGy/h have been found to reduce measures
of sperm generation, testicular mass, fecundity (i.e., embryo survivorship into an entity living
separate from its parents) and spawning (table 46b). Depletion of spermatogonia results when dose
rates of 5000 to 10,000 uG/h are applied.
Table 46b: Effects of Chronic Irradiation on Fish Toxicity
Summary: Effects of chronic Irradiation on Fish. Studies with Gamma Radiation Exposure Reproduction Endpoint Dose-rate (uGy/h) Species Outcomes Noted
1E2 to1E3 Plaice;Medaka:Roach Reduced sperm, testes mass, fecundity, and delayed spawning
1-5E3 Eelpout, Rainbow Trout, Plaice, Medaka, Guppy,
Reduced sperm, testes mass, fertility, male courtship, spermatogonia
5E3-1E4 Medaka Depletion of spermatogonia 1-5E4 Medaka, Guppy Sterility, vertebral anomalies, larvacidal Morbidity Endpoint 1-5E3 Medaka(?) Reduced immune response Mortality Endpoint >5E4 Guppy Parental irradiation - no offspring impact
Reference: FASSET, Final Report. May 2004 (Section 4).
To help place these dose-rates into some perspective, the typical human receives somewhere
between 0.3 and 0.5 uG/h from all sources of radiation, including terrestrial, cosmic, medical and
other sources. The FASSET report suggests that a no-adverse-effect level has been characterized

75
for some key endpoints in fish. For example, “chronic exposures at dose rates up to 4 mGy h-1 of
developing embryos (most sensitive stage) will not have significant effects on subsequent growth”
and, while based upon rather limited studies, that “dose rates < 4mGy h-1 at any life stage are
unlikely to affect survival” (FASSET, 2004). The FASSET report also indicates that there is “little
consistent, significant evidence for effects on reproductive capacity at dose rates <0.2 mGy h-1 “,
but that there is, as in other vertebrates, probably no threshold for some endpoints – such as genetic
toxicity markers. It should be noted that the 4 mGy/hour no-observed-effect levels described for
embryonic growth and for survival (of any life stage) is a substantial absorbed dose. It is
equivalent to 400 mrad / hour, or, on a chronic annual basis is 350 rad. Furthermore, there is little
evidence for significant fish reproductive capacity adverse effects below 0.2 mGy hr-1, which if
continued for one year is equivalent to about 17.5 rad.
12.0 Implications and Conclusions This review documents the average radionuclide concentrations and their degree of
variation from recent studies of the marine environment (including biota) of the northern
hemisphere. For example, average concentrations of cesium-137 in mollusks demonstrate about a
twenty-fold range, from a low of 1.4 to 1.7E-05 from samples from the USA Atlantic Coast and
the Sea of Japan to values of about 2.6E-04 from those in the Irish Sea, while fish populations,
whose mobility might allow greater integration of dose from multiple sources, have slightly less
variability (tables 8, 12, 28a). Knowledge of the average concentrations and their degree of
variation, either by geographical location or temporally at the same location, should support
investigators in their quest to distinguish perturbations of “background” values from those that
might occur from locally contaminated conditions. Furthermore, this type of data will assist in
determining whether locally found values are consistent with those found in other marine

76
environments/biota that are deemed acceptable as commercial and subsistence sources of human
seafood.
A second finding addresses the degree of human health risk that one might expect from
varying degrees of contamination of the marine environment with radionuclides. A very useful
example is the expected human risk associated with consumption of marine biota from the Irish
Sea, which has substantially higher contamination with Cs-137 and Tc-99 due to the reprocessing
facility at Sellefield than does the north Pacific and many other large bodies of marine
environments. It is important to note that with the current levels of Irish Sea contamination (the
concentrations have dropped over the last two decades) the human health risks are estimated to be
very low - less than 1 in 10 million - even in the high seafood consumer populations. Furthermore,
the annual dietary doses (over 90 uSv) of a typical heavy seafood consumer from radiation of
natural sources (polonium and other natural radionuclides), dwarfs the contributions from
anthropogenic sources (about 1 uSv). This information should be useful in the broad interpretation
of results from specific special studies or surveillance from other locations (such as the Amchitka
study and others) – and should provide data and concepts useful in communications with the
public. It should not, however, provide license for increasing the radionuclide load in marine
waters.
Finally, marine monitoring systems need to be designed to detect radionuclide
contamination at levels sufficient to protect the public health. This does not mean that every study
must be designed and supported to detect the lowest possible concentrations. To be sure, there
have been great advances in low level measurements, such as the new and unique International
Atomic Energy Agency’s Underground Counting Laboratory which is designed at the depth of the
equivalent of 30 meters underwater, has double lead shielding, anticosmic plastic scintillation

77
detectors, an anticompton gamma-spectrometer and a low-background liquid scintillation
spectrometer Quantulus. Most environmental radiation research and monitoring programs do not
require the extraordinary degree of sensitivity, sophistication and expense incorporated into the
IAEA laboratory. However, modern, effective environmental radiation assessments and
monitoring systems should be able to detect the concentration levels in biota that, when coupled
with population consumption patterns, could present potential doses and risks relevant to the
public’s health and/or to adherence to food regulations. Dose levels of contamination that could
reach risks of public health concern (such as between 1E-4 to 1E-6 risk of cancer) should be
detectable, as also should concentrations relevant to international food radiation safety standards.
Surveillance or studies must be able to determine if radionuclide concentrations in seafood
harvested at a location are, or are not, acceptable to be sold in the international commercial
marketplace. And finally, the risks of the most potentially exposed populations – such as
subsistence harvesters – need to be carefully assessed and be acceptable.
The current report has demonstrated that the reviewed programs are sufficient to detect
cesium-137 concentrations at levels substantially below the new WHO and FAO recommended
international food standards. In addition, the detection limits for Cs-137 demonstrated in modern
laboratory systems (including those in the current Amchitka study) are sufficient to protect even
the high consuming members of the public, to potential human health risks (between one-in-ten
thousand and one-in-a million) from current cesium-137 and other anthropogenic radionuclides in
marine seafood. Protective regulations and data on ecological risks from radiation are less well
defined. The current movement in international environmental organizations to recognize the need
for, and to develop, guidelines for representative marine organisms is welcome and much needed.
A recent comprehensive review of radionuclide toxicology information for marine organisms

78
(FASSET, Deliverable 4, 2003) indicates that the rates of radiation exposure found to increase
risks to key markers of toxicity, i.e., morbidity, mortality, reproductive capacity or mutation, tend
to be orders of magnitude greater than the concentrations currently found in marine biota (as
reviewed in this document). As future studies are accomplished on more marine organisms, and
the ability to interpret ecological information expands beyond the individual organism, we will be
better equipped to interpret with greater conviction the broader ecological implications of
radionuclides in our marine environment.

79
13.0 References
Aarkrog, A., Baxter, M.S., Bettencourt, A.O. et al. 1997. A Comparison of Doses from 137Cs and 210Po in Marine Food: A Major International Study. Journal of Environmental Radioactivity.34:69-90. Aoyama, M., Hirose, K. 2004. Artificial Radionuclides Database in the Pacific Ocean: HAM Database. The Scientific World Journal.4:1-16. Aoyama, M., Hirose, K. 2003. Temporal variation of 137Cs water column inventory in the North Pacific since the 1960s. Journal of Environmental Radioactivity.69:107-117. Betti, M., de las Heras, L.A., Janssens, A., et al. 2004. Results of the European Commission Marina II Study Part II – effects of discharges of naturally occurring radioactive material. Journal of Environmental Radioactivity.74:255-277. BNFL. 2002;2003. Monitoring our environment: Discharges and Monitoring of the Environment in the UK: Annual Report 2002. http://www.bnfl.com/discahrgesreport2002/22.htm. BNFL. 2004. Discharges and Monitoring of the Environment in the UK Annual Report. http://www.bnfl.com/dischargesreport2002/3.htm. Buesseler, K. 1997. The Isotopic Signature of Fallout Plutonium in the North Pacific. Journal of Environmental Radioactivity.36:69-83. CEFAS, 2003. Radioactivity in Food and the Environment (RIFE-8), 2002. The Centre for Environment, Fisheries & Aquaculture Science (UK), for the Environment Agency, Environment and Heritage Service, Food Standards Agency, and the Scottish Environment Protection Agency. CEFAS, 2004. Radioactivity in Food and the Environment (RIFE-9), 2003. The Centre for Environment, Fisheries & Aquaculture Science (UK), for the Environment Agency, Environment and Heritage Service, Food Standards Agency, and the Scottish Environment Protection Agency. Codex, 2004 (see FAO/WHO, 2004). Cooper, L.W., Larsen, I.L., O”Hara, T.M. et al. 2000. Radionuclide Contaminant Burdens in Arctic Marine Mammals Harvested During Subsistence Hunting. Arctic.53:174-182. Copplestone, D., Jackson, D., Hartnoll, R.G. et al. 2004. Seasonal variations in activity concentrations of Tc-99 and Cs-137 in the edible meat fraction of crabs and lobsters from the central Irish Sea. Journal of Environmental Radioactivity.73:29-48. Copplestone, D., Howard, B.J., Brechignac, F. 2004. The ecological relevance of current approaches for environmental protection from exposure to ionizing radiation. Journal of Environmental Radioactivity.74:31-41.

80
Currie, L.A. 1968. Limits for Qualitative Detection and Quantitative Determination: Application to Radiochemistry. Anal. Chem.40:586-593. Dasher, D., Hanson, W., Read, S. et al. 2002. An assessment of the reported leakage of anthropogenic radionuclides from the unhderground nuclear test sites at Amchitka Island, Alaska, USA to the surface environment. Journal of Environmental Radioactivity.60:165-187. Dahlgaard, H., Eriksson, M., Nielsen, S.P, Hoensen, H.P. 2004. Levels and trends of radioactive contaminants in the Greenland environment. Science of the Total Environment.331:53-67. Dahlgaard, H., Eriksson, M., Ilus, E., et al. 2001. Plutonium in the marine environment at Thule, NW-Greenland after a nuclear weapons accident. From: Plutonium in the Environment. Kudo, A. (editor). Eslevier Science Ltd. Dai, M.H., Buesseler, K.O., Kelley, J.M., et al. 2001. Size-fractionated plutonium isotopes in a coastal environment. Journal of Environmental Radioactivity.53:9-25. Davistownmuseum. RADNET: Information about source points of anthropogenic radioactivity: A Freedom of Nuclear Information Resource. http://www.davistownmuseum.org/cbm/Rad3.html. Duran, E.B., Povinec, P.P., Fowler, S.W., Airey, P.L., and Hong, G.H. 2004.137Cs and 239+240Pu levels in the Asia-Pacific regional seas. Journal of Environmental Radioactivity.76:139-160. FAO/WHO. 2004. codex alimentarius commission. Food and Agriculture Organization (FAO) of the United Nations and the World Health Organization (WHO). Joint FAO/WHO Food Standards Programme. www.codexalimentarius.net/web/archives/jsp. FASSET, Deliverable 5, Appendix 2, 2003. Handbook for Assessment of the Exposure of Biota to Ionising Radiation from Radionuclides in the Environment. Brown, J., Strand, P., Hosseini, A., Borretzen, P. (editors). Norwegian Radiation Protection Authority, for the EC 5th Framework Programme. FASSET. 2004. Framework for Assessment of Environmental Impact (FASSET), Final Report. A project within the EC 5th Framework Programme. www.fasset.org. FASSET(a), 2004. Deliverable 4: Radiation Effects on Plants and Animals. Framework for Assessment of Environmental Impact (FASSET). Woodhead, D., and Zinger, I. (editors), June, 2003. A project within the EC 5th Framework Programme. FDA, 1998. Accidental Radioactive Contamination of Human Food and Animal Feeds: Recommendations for State and Local Agencies. U.S. Food and Drug Administration. http://www.fda.gov/cdrh/dmqrp/84.htm.

81
FDA, 2004. Guidance for FDA Staff: Guidance Levels for Radionuclides in Domestic and Imported Foods. http://www.fda.gov/ora/compliance_ref/cpg/cpgfod/cpg560-750.html. Fetter, S. 1993. Nuclear Archaeology: Verifying Declarations of Fissile-Material Production. Science & Global Security.3:237-259. Frechou, C. and Calmet, D. 2003. 129I in the environment of the La Hague nuclear fuel reprocessing plant – from sea to land. Journal of Environmental Radioactivity.70:43-59. Gafvert, T., Foyn, L., Brungot, A.L., Kolstad, A.K., Lind, B., Christensen, G.C., Stralberg, E., Drefvelin, J., Rudjord, W.L. Radioactivity in the Marine Environment 2000 and 2001. 2003. Results from the Norwegian National Monitoring Programme (RAME). StralevernRapport 2003:8. Osteras:Norwegian Radiation Protection Authority. Gafvert, T., Foyn, L., Brungot, A.L., et al. 2004. Radioactivity in the Marine Environment 2002: Results from the Norwegian Marine Monitoring Programme (RAME). StralevernRapport 2004:10. Norwegian Radiation Protection Authority, Osteras. Gerland, S., Lind, B., Dowdall, M. et al. 2003. Tc-99 in seawater in the West Spitsbergen Current and adjacent seas. Journal of Environmental Radioactivity.69:119-127. Godoy, J.M., Carvalho, Z.L., Fernandes, C., et al. 2003. 137Cs in marine samples from the Brazilian southeastern coastal region. Journal of Environmental Radioactivity.70:193-198. Gwynn, J.P., Dowdall, M. and Lind, B. 2004. The Radiological Environment of Svalbard. StralevernRapport 2004:2. Osteras: Norwegian Radiation Protection Authority. Health Physics Society. 1996. Performance criteria for radiobioassay. An American National Standard. New York: American National Standards Institute; ANSI/HPS N13.30-1996. Hirose, K., Miyao,T., Aoyama, M., Igarashi, Y. 2002. Plutonium isotopes in the Sea of Japan. Journal of Radioanalytical and Nuclear Chemistry.252:293-299. Hirose, K. and Aoyama, M. 2003. Analysis of 137Cs and 239,240Pu concentrations in surface waters of the Pacific Ocean. Deep-Sea Research II,50:2675-2700. Hirose, K. and Aoyama, M. 2003a. Present background levels of surface 137Cs and 239,240Pu concentrations in the Pacific. Journal of Environmental Radioactivity.69:53-60. Hong Kong Observatory, 1999, 2000, 2001, 2002. Environmental Radiation Monitoring in Hong Kong. Technical Reports No. 19-22. Hosseini, A., Brown, J., Thorring, H. and Borretzen, P. Environmental impact assessment in Arctic environments. 2005. StralevernRapport 2005:5. Osteras: Norwegian Radiation Protection Authority.

82
Hou, S.L., Dahlgaard, H., Nielsen, S.P. 2000. Iodine-129 Time Series in Danish, Norwegian and Northwest Greenland Coast and the Baltic Sea by Seaweed. Estuareine, Coastal and Shelf Science.51:571-584. IAEA. 2000. Global Marine Radioactivity Database (GLOMARD). IAEA-TECDOC-1146. Vienna, Austria. IAEA. 2003. Radionuclide Content in Commodities not requiring Regulation for Purposes of Radiation Protection. Draft Safety Guide, DS161. International Atomic Energy Agency, Vienna. IAEA (International Atomic Energy Agency). 1998. Measures to Strenghten International Co-operation in Nuclear, Radiation and Waste Safety: ©Study of the Radiological Situation at the Atolls of Mururoa and Fangataufa. GC(42)/INF/3. International Atomic Energy Agency General Conference, Forty-second regular session, Item 12 of the provisional agenda. IAEA. 2004. Sediment distribution coefficients and concentration factors for biota in the marine environment. Technical Reports Series No. 422. Vienna: IAEA. IAEA (International Atomic Energy Agency). In press. Sediment KdS and Concentration Factors for Radionuclides in the Marine Environment, Technical Reports Series No. 247 Revised, International Atomic Energy Agency, Vienna. ICRP, 1996. International Commission on Radiological Protection. Age Dependent doses to members of the public from intakes of radionuclides: Part 5, compilation of ingestion and inhalation coefficients. Annals of the ICRP, 26(1), Publication No. 72. ICRP, 1991. International Commission on Radiological Protection, 1990. Recommendation of the International Commission on Radiological Protection. Annals of the ICRP, 21 (1-3), Publication No. 60. ICRP. 2003. The evolution of the system of radiological protection: the justification for new ICRP recommendations. Journal of Radiological Protection.23:129-142. ICRP. 2003a. A framework for assessing the impact of ionizing radiation on non-human species. ICRP Publication 91. Annals ICRP.33:201-266. ICRP.2005. 2005 Recommendations of the International Commission on Radiological Protection: Summary of Recommendations. http://www.icrp.org/docs/2005_recs _CONSULTATION_Draft1.pdf. Ito, T., Aramaki, T., Kitamura, T. et al. 2003. Anthropogenic radionuclides in the Japan Sea: their distributions and transport processes. Journal of Environmental Radioactivity.68:249-267. Japan Chemical Analysis Center. 2003. Radioactivity Survey Data in Japan: Environmental and Dietary Materials. Report No. 138. Chiba, Japan.

83
Japan Chemical Analysis Center. 2004. Radioactivity Survey Data in Japan: Environmental and Dietary Materials. Report No. 139. Chiba, Japan. Jensson, H.., Strand P., Tsaturov Y., and Reiersen, L. 2004. AMAP Asssessment 2002: Radioactivity in the Arctic. Arctic Monitoring and Assessment Programme (AMAP), Oslo, Norway. Jones, D.S. 2000. Radiological Benchmarks for Effects on Aquatic Biota at the Oak Ridge Reservation. Human and Ecological Risk Assessment.6:789-807. Jones, D., Domotor, S., Higley, K., et al. 2003. Principles and issues in radiological ecological risk assessment. Journal of Environmental Radioactivity.66:19-39. Jones, D.S., Scofield, P.A. 2003. Implementation and Validation of a DOE Standardized Screening Method for Evaluating Radiation Impacts to Biota at Long-Term Stewardship Sites. ORNL/TM-2003/76. Jones, K., Simmonds, J., Jones, A., et al. 2004. Distinguishing between impacts of current and historic radioactive discharges to sea from UK nuclear sites. Department for Environment, Food and Rural Affairs (DEFRA), Commissioned Research for Radioactive Substances Division. DEFRA Report No. DEFRA/RAS/03.001. Kelley, J.M., Bond, L.A., Beasley, T.M. 1999. Global distribution of Pu isotopes and 237Np. The Science of the Total Environment.237:483-500. Kenna, T.C. 2002. Determination of plutonium isotopes and neptunium-237 in environmental samples by inductively coupled plasma mass spectrometry with total dissolution. Journal of Analytical Atomic Spectrometry.17:1471-1479. Kim, C.K., Kim, C.S., Change, B.U., et al. 2004. Plutonium isotopes in seas around the Korean Peninsula. The Science of the Total Environment.318:197-209. Koide, M., Goldberg, E.D., Herron, M.M. and Langway, C.C, Jr. 1977. Transuranic depositional history in South Greenland. Nature.269:237-139. Koide, M., Bertine, K.K., Chow, T.J., Goldberg, E.D. 1985. The Pu-240/Pu-239 ratio, a potential geochronometer. Earth Planet Science Letters.72:1-8. Kronfeld-Goharani, U. 2003. Cleanup of Cold War Legacies: The Ongoing Nuclear Contamination of the Arctic Region. International Newtwork of Engineers and Scientists Against Proliferation (inesap), Briefing Paper, Issue 11, October 2003. Kryshev, A.I., Sazykina, T.G., Kryshev, I.I., Strand, P., Brown, J.E. 2001. Radioecological modelling and the computer codes for calculations of doses to marine biota and man in the Arctic. Environmental Modelling & Software.16:697-709.

84
Larsson, 2004. (See FASSET, 2004). Li, S.W. and Yeung, K.C. Summary of Environmental Radiation Monitoring in Hong Kong, 2003. Hong Kong Observatory Technical Report No. 23. Lindahl, P., Roos, P., Holm, E., Dahlgaard, H. 2005. Studies of Np and Pu in the marine environment of Swedish-Danish waters and the North Atlantic Ocean. Journal of Environmental Radioactivity.82:285-301. Livingston, H.D. 2004. Marine Radioactivity. Elsevier (pub), Amsterdam. Livingston, H.D., Povinec, P.P., Ito, T. Togawa, O. 2001. The behaviour of plutonium in the Pacific Ocean. In: Plutonium in the Environment. A. Kodo (editor). Elsevier Science Ltd. Livingston, H.D., Povinec, P.P. 2002. A Millennium Perspective on the Contribution of Global Fallout Radionuclides to Ocean Science. Health Physics.82:656-668. Lowe, V.P.W. 1991. Radionuclides and the Birds at Ravenglass. Environmental Pollution.70:1-26. MARINA II. 2004. Update of the MARINA project on the radiological exposure of the European Community from radioactivity in North European marine waters. Annex B: Environmental Data. European Commission. http:/./europa.eu.int/comm./energy/nuclear/radioprotection/doc/studies/rp132/annex_6_en.pdf. Matishov, D.G. and Matishov, G.G. 2004. Radioecology in Northern European Seas. Springer (pub), Berlin. Mun, Y. and Vyas, V.M. Exploratory Data Analyses of Radionuclides in Northern Pacific Ocean (Cs-137, Sr-90, and Pu-239,240). 2004. Environmental and Occupational Health Sciences Institute, Piscataway, NJ, USA. Norwegian Radiation Protection Authority. 2004. Radioactivity in the Marine Environment 2002: Results from the Norwegian Marine Monitoring Programme (RAME). StralevernRapport 2004:10. Pentreath, R.J. and Woodhead, D.S. 2001. A system for protecting the environment from ionizing radiation: selecting reference fauna and flora, and the possible dose modesl and environmental geometries that could be applied to them. Science of the Total Environment.277:33-43. Personal communication. Aoyama, 2004. Povinec, P.P., Hirose, K., Honda, T., Ito, T., Scott, E.M., Togawa, O. 2004. Spatial distribution of 3H, 90Sr, 137Cs and 239,240Pu in surfact waters of the Pacific and Indian Oceans – GLOMARD database. Journal of Environmental Radioactivity.76:113-137. Powers, C.W. et al. 2003. Amchitka Independent Assessment Science Plan: Prepared for the Interagency Amchitka Policy Group. CRESP (pub), June, 2003.

85
RAME, 2003. Radioactivity in the Marine Environment 2000 and 2001. Results from the Norwegian National Monitoring Programme (RAME). Norwegian Radiation Protection Authority. Stralevern Rapport 2003:8. RAME, 2004. (See Norwegian Radiation Protection Authority. 2004). Rigaud, D. 2003. A Proposed Method to Determine the Decision Level for Radioactivity Measurements. Health Physics.85:140-149. RPII. 2003. Radioactivity monitoring of the Irish marine environment 2000 and 2001. The Radiological Protection Institute of Ireland. RPII-03/3 (Ryan, T.P. et al). RPII. 2004. Environmental Radiation Marine Monitoring Programme. http://www.rpii.ie/radiation/data/2002/start.html. Ryan, T.P., Dowdall, A.M., Long, S. et al. 1999. Plutonium and americium in fish, shellfish and seaweed in the Irish environment and their contribution to dose. Journal of Environmental Radioactivity.44:349-369. Ryan, T.P, McMahon, C.A., Dowdall, A., et al. 2003. Radioactivity monitoring of the Irish marine environment 2000 and 2001. The Radiological Protection Institute of Ireland (RPII). Sazykina, T.G., Kryshev, A.I. 2003. EPIC database on the effects of chronic radiation in fish: Russion/FSU data. 2003. Journal of Environmental Radioactivity.68:65-87. SENES, 2003. Assessment of Marine Biota Doses Arising From the Radioactive Sea Discharges of the COGEMA La Hague Facility. Final Report. Volume I – Executive Summary and Consensus Appraisal of the Study; Volume II – Main Report; Volume III – Appendices. SENES Consultants Limited. Seymour, A.H. and Nelson, V.A. 1977. Radionuclides in Air, Water and Biota. In: The Environment of Amchitka Island, Alaska (Merritt, M. and Fuller, R.G. – eds). Technical Information Center (publisher). Energy Research and Development Administration. Shinorara, K. 2004. Assessment of radiological effects on the regional environment due to the operation of the Tokai Reprocessing Plant. Journal of Environmental Radioactivity.72:299-322. Strand, P., Beresford, N., Avila, R., Jones, S., and Larsson, C-M. 2001. FASSET (Framework for Assessment of Environmental Impact), Deliverable 1: Identification of candidate reference organisms from a radiation exposure pathways perspective. EC 5th Framework Programme. Strom, D.J. 1998. False Alarms, True Alarms, and Statistics: Correct Usage of Decision Level and Minimum Detectable Amount. Continuing Education Lecture, Health Physics Society.

86
Tkalin, A.V., Lishavskaya, T.S. and Shulkin, V.M. 1998. Radionuclides and Trace Metals in Mussels and Bottom Sediments Around Vladivostok, Russia. Marine Pollution Butlletin.36:551-554. USEPA. 1999. Cancer Risk Coefficients for Environmental Exposure to Radionuclides. Federal Guidance Report No. 13 (EPA 402-R-99-001). USFDA. 2001. Total Diet Study Statistics on Radionuclide Results. U.S. Food and Drug Administration. http://www.cfsan.fda.gov/~1rd/pestadd.html. USFDA, 2004 (see FDA, 2004) USFDA, 2004a. Supporting Document for Guidance Levels for Radionuclides in Domestic and Imported Foods. U.S. Food and Drug Administration. http://www.cfsan.fda.gov/~dms/nucleve2.html. Valette-Silver, N.J. and Lauenstein, G.G. 1995.Radionuclide Concentrations in Bivalves Collected Along the Coastal United States. Marine Pollution Bulletin.30:320-331. Watson, W.S., Sumner, D.J., Baker, J.R. et al. Radionuclides in seals and porpoises in the coastal waters around UK. 1999. The Science of the Total Environment.234:1-13. Woodhead, D.S. 2003. A possible approach for the assessment of radiation effects on populations of wild organisms in radionuclide-contaminated environments? Journal of Environmental Radioactivity.66:181-213. Yamada, M., Aono, T., Hirano, S. 1999. 239+240Pu and 137Cs concentrations in fish, cephalopods, crustaceans, shellfish, and algae collected around the Japanese coast in the early 1990s. The Science of the Total Environment.239:131-142.
Appendix 1: Bodies of Water and Associated Countries
Table 47: Bodies of Water and Associated Countries
Body of Water Bordering Countries Arctic Ocean/Seas Baffin Bay Greenland, Canada

87
Beaufort Sea Canada, United States Chukchi Sea Russia, United States East Siberian Sea Russia Greenland Sea Greenland Kara Sea Russia Laptev Sea Russia Pechora Sea Russia White Sea Russia Norwegian Sea Norway, Iceland, Scotland Atlantic Ocean/Seas
Baltic Sea Sweden (Gulf of Bothnia: Finland & Sweden), Finland, Russia, Estonia, Latvia, Lithuania, Poland, Germany, Denmark.
Celtic Sea England, Ireland, Wales English Channel England, France, Belgium Hudson Bay Canada Irish Sea England, Ireland, Wales Labrador Sea Canada North Sea Norway, England, Scotland, Denmark, Germany, Netherlands, Belgium U.S Atlantic Coast United States Pacific Ocean/Seas Bering Sea United States, Russia East China Sea Japan, China, South Korea, North Korea Okhotsk Sea Japan, Russia Sea of Japan Japan, South Korea, North Korea, Russia/Siberia N.Pacific, Japan Japan N.Pacific, U.S. United States Yellow Sea China, South Korea
Appendix 2: Radionuclide Ratios as Indicators of Source Most marine environments have, to one degree or another, received radionuclide intrusion
from local, regional and global conditions. While absolute concentrations of each radionuclide are
necessary to assess the magnitude of contamination and its trends, the source of the contamination
may be elucidated through the assessment of certain ratios (isotopic or elemental) – and shifts in
those ratios over time may have significance regarding the relative importance (emergence or
fading) of one source versus another. It is for these reasons that radionuclide ratios have been used
by many investigators and agencies as potential indicators of the source - regardless of whether the
analyses be of atmospheric, terrestrial or marine environments.

88
Analyses of aerosols, ice core and soil samples indicate that the global fallout mean value
for 240Pu/239Pu is about 0.18 (Hirose, Igarashi et al, 2003). The fallout ratios from different nuclear
test sites vary, however, with ratios of 0.21 to 0.36 in the soil of the Pacific Test Site in the Bikini
Atolls being substantially different from the 0.035 ratios of the Russian Semipalatinsk and U.S.
Nevada Test Sites. While ratios may be a tool or indicator of recent sources of plutonium,
interpretation of these types of ratios may be “a very complex affair”, even when investigating
relatively “simple” situations, such as the range of sedimentary residues at the marine site of a
single accident (Dahlgaard et al, 2001).
While all marine environments (more so in the northern hemisphere) have sustained
radionuclide pollution from global fallout, and many (particularly European) waterways have
received Chernobyl depositions, some bodies of water are impacted more intensely by close
sources and/or those that are channeled across substantial distances through currents or other
mechanisms. Nearly every sea, ocean or bay in the northern hemisphere has some anthropogenic
radionuclide contamination – and all have natural radionuclides.
The Barents and Kara Sea components of the Arctic Ocean have been influenced by
contamination from Russian industry emissions emptied to Siberian rivers, by releases from
nuclear reprocessing facilities in Western Europe and potentially from dumped radioactive wastes
and sunken nuclear submarines and icebreakers in the Kara Sea (Sazykina and Kryshev, 1997).
The Irish Sea has been most impacted by the radionuclides from the Sellafield nuclear
reprocessing plant located in Cumbria, UK. – with the plutonium and americium contamination
from Sellafield estimated at well over 100 times that accumulated from atmospheric nuclear test
fallout (Ryan et al, 1999). The French Channel’s most important source of radionuclides has been
the water and gaseous discharges from the La Hague nuclear fuel reprocessing facility (Frechou

89
and Calmet, 2003). The Sea of Japan radionuclide contamination is thought to be primarily from
global fallout, although several studies have been undertaken regarding potential releases from
previously dumped radioactive wastes by the former USSR in the northern section of the Sea in the
Peter the Great Bay area (Hirose, Miyao et al, 2002; Livingson, Povinec et al, 2001). The key
anthropogenic sources to the Pacific Ocean and its marginal seas are from global and close-in
nuclear test fallout – with some less degree of nuclear facility releases (Hirose and Aoyama, 2003).
Radionuclide ratio data has been used to plot trends and to assess potential contributions of
sources to environmental media contamination. It should be noted that the feasibility of using
radionuclide and isotopic ratios depends upon the ability to detect the contaminants in analyzed
samples. This is not always feasible, given the low concentrations expected in certain media for
certain radionuclides. The following table (table 48) provides some of the reported marine
radionuclide ratios and the interpretation of the findings provided in the original publications.
Table 48: Radionuclide Ratios in Marine Environment and their Implications
Contrast Refer. Media Water site Ratio Interpretation 129I / 127I Frechou Seaweed Europe Postulated & Calmet French Channel <1E-08 Global fallout 2003 >1E-07 Industrial discharge Actual C. crispus (low value) 7E-07 to Industrial discharge F. humbricalis (high value) 3.00E-05 (La Hague processing plant) 240Pu/239Pu Buesseler Coral N Pacific <0.19 Global fallout 1997 >0.20 Close-in fallout
Surface N Pacific 0.18-0.19 Global fallout sediment >0.20 Close-in fallout Dahlgaard et al, 2004 238Pu/239,240Pu Sediment Baffin Bay 0.014 Thule accident site

90
241Am/239,240Pu Sediment Baffin Bay 0.13 241Am/239,240Pu Molluscs Baffin Bay 0.63 241Am/239,240Pu Crustacea Baffin Bay 0.22 Dahlgaard et al, 2001 240Pu/239Pu atoms Sediment Baffin Bay .027-.057 Thule accident site Sediment Global estimate 0.18 Global fallout Sediment Irish Sea 0.25 Sellafield discharges 238Pu/239,40Pu Ryan et al Seaweed NE Irish Sea 0.19 Sellafield 1999 W Irish Sea 0.17 Sellafield Global = 0.033
The long-lived plutonium isotopes, 239Pu and 240Pu, have been used as isotopic metrics of
nuclear-weapons fallout, with their proportionate presence in the marine environment reflecting at
least partly the type of weapon tested, i.e., its yield and its design, as well as whether the test was
atmospheric or surface-based (Buesseler, 1997). For example, surface-based testing on atolls in the
Pacific would incorporate calcium hydroxide from the coral matrix. Upon re-entry into the sea, the
calcium component of the calcium hydroxide-plutonium complex would interact with seawater
magnesium ions “to form a shell of insoluble magnesium hydroxide on the fallout particle”
(Buesseler, 1997). This is in clear distinction from global fallout from atmospheric tests, where
there is no interaction with compounds on the earth’s surface. In atmospheric tests, “Pu is carried
by sub-micron-sized particles that are composed primarily of iron-oxides” (Buesseler, 1997). It can
therefore be noted that the physical/chemical forms of plutonium residing in marine waters will
differ based upon whether they originated from atoll-land based tests (i.e., Pacific Proving
Grounds) or from atmospheric based tests. The 240Pu/239Pu ratio is increased (>0.20 ratio) in the
relatively insoluble Pacific Proving Grounds fallout compared to that of the more soluble
stratospheric global fallout (0.18-0.19 ratio) (Buesseler, 1997). The influence of type of fallout and
its relative insolubility have resulted in increased 240Pu/239Pu ratios in sediments and subsurface
waters in the Pacific Proving Grounds area in the NW Pacific.

91
In 1968 a US B52, carrying four atomic bombs, crashed in frozen Baffin Bay after leaving
from Thule Air Base in Northwest Greenland. This tragic incident provided investigators specific
research material (see Table 48) by which the diagnostic or attributive value of radionuclide ratios
could be assessed in an environmental setting (Dahlgaard, Eriksson, et al, 2001). The site was last
sampled in 1997. It is interesting to note that plutonium in the surface sediment (0-3 cm) was not
readily taken up by inhabiting benthic organisms such as bivalves, snails and starfish, with biotic
concentrations one or two orders of magnitude lower in those organisms than in the surface
sediment. Furthermore, little transfer of plutonium occurred to surface waters or to brown algae,
Fucus disticus. The ratios of 240Pu/239Pu varied over two fold, from 0.027 to 0.057. This degree of
variation indicated to the investigators that the plutonium originated from at least two different
sources and suggests the complexity of assigning source apportionment even in relatively
uncomplicated crash scenarios. Also involved in such analyses is the dynamic nature and ingrowth
from relatively short-lived radionuclides. The 241Pu isotope has a half-life of only 14.4 years and
decays to 241Am. Thus, the ratios present at the time of the crash, nearly 30 years prior to the
1997 sampling, would be influenced by half-life considerations – one of the more predictable
components of such complex assessments of marine source attribution.
Assessment of plutonium ratios in the Irish Sea and its biota have been made to determine
the degree and direction of contaminant influence of the Sellafield nuclear fuel reprocessing plant.
The Sellafield outfall pipe has been estimated to have discharged, between 1952 and 1992, 271 kg
of plutonium and 4.25 kg of americium to the Irish Sea (Ryan, Dowdall, et al, 1999). Seaweed
such Fucus vesiculosus, has been studied to determine both the geographical distribution of
plutonium in the Irish Sea as well as source attribution. Seaweed from the Irish Sea coast has been
assessed for 238 Pu and 239,240Pu four times over a 10 to15 year time frame, permitting an analysis

92
of trends. The 238Pu/239,240Pu ratios, as well as their absolute values, were assessed. While the
activity concentrations of plutonium have generally decreased, the 238Pu/239,240Pu ratios have
either remained high (0.218 and 0.19 in NE Coast for 1986 and 1996) or have risen (0.05 to 0.17
on West Coast) in seaweed from the Irish Sea. The investigators concluded form this data that “an
increasing fraction of plutonium available to Fucus vesiculosus is currently of Sellafield origin”
(Ryan, Dowdall, et al, 1999). Ratio data was clearly important in forming such judgments, since
the decreasing total plutonium activity concentrations may not have suggested such an attribution.
Appendix 3:UK Dietary Survey Data for Seafood Consumption (RIFE-8)
Table 49: UK Dietary Survey Data for Seafood Consumption (RIFE-8)
Site of Survey Date Fish(kg.yr) Crustaceans(kg/yr) Mollusc(kg/yr)s Bradwell 1999 44 3.1 6.5 Channel Islands 1997 62 30 60 Chapelcross 2000 20 12 3 Dunreay 1999 19 14 2.2 Dungeness 1999 59 17 15 Hartlepool 2002 32 15 12 Heysham 2001 36 18 19 Hinkley Point 2000 43 9.8 1.8 Hunterston 2001 29 22 2 Isle of man ? 100 20 20 Norther Ireland 2000 99 34 7.7 North Wales ? 100 20 20 Rosyth 1999 21 6.6 5.6 Sellafield (fishing comm.) 2002 51 16 29 Sizewell 2001 40 8.4 6.4 Springfields 2000 42 15 10 Torness 2001 41 17 5.9 Winfrith 1987 77 26 3.9 Wylfa 1988 94 23 1.8
Reference: CEFIS, Radioactivity in Food and the Environment, Appendix 4, 2002 (RIFE-8)

93
Appendix 4
5.0 Radionuclide Measures
Key Environmental Radiation Units
The units of measurement frequently applied in radionuclide monitoring programs
constitute a scientific jargon that is not fully understood by the public. This section is meant to
provide a brief description and interpretation of the commonly used units in order to aid the
general reader to better understand the monitoring data presented in this report. This review
focuses on the major international units (SI) of measure for ionizing radiation – the becquerel (Bq),
gray (Gy) and sievert (Sv) – all of which are used in marine environmental studies. We also define
the units frequently used in U.S. studies, including the curie (Ci), rad and rem. A comparison of
the terms is outlined in table 1.
Table 1: Major International and U.S. Units of Radiation Measurement
Measure International Unit(SI) U.S. Unit Conversion(SI/US)
Radioactivity Becquerel Curie(Ci) 3.7 billion Bq per Ci 1 Bq=27 pCi Aborted dose Gray(Gy) rad 1 Gy=100 rad
0.01 Gy=10mgy=1rad 1 uGy=0.1 mrad Radiation dose equivalent Sievert(Sv) rem 1Sv=100 rem 0.01 Sv=10mSv=1 rem 1 uSv= 0.1mrem

94
The becquerel (Bq) unit is the international unit of radioactivity and is not specific to the
type of radioactivity. It simply describes the gross amount of radioactivity emitted from – and
therefore indicative of radiation within - a sample as measured by the amount of radioactive decay
detected in one second. One Bq of radioactive material produces 1 atomic-disintegration or
transition per second. The Bq is a small unit compared to the U.S. metric, the curie (Ci). One Ci
is the amount of radioactive material needed to generate 37 billion disintegrations (i.e., 3.7E 10
disintegrations) per second, or the number of disintegrations produced in one second by one gram
of radium. Therefore, one Ci is equal to 37 billion Bq. The Bq unit is a useful metric for describing
the low level radioactivity typically found in environmental monitoring studies of the marine
environment. Radioactivity in marine biota is usually reported in Bq per kg wet-weight (ww)
sample, i.e., Bq / kg-ww. Sample results for seawater are usually reported in Bq per volume, i.e.,
Bq/m3 or its equivalent of mBq / ml. Sediment radiation, which could vary a great deal by water
content, is usually characterized by unit dry-weight (dw), i.e., Bq/kg-dw.
The gray (Gy) international metric indicates the radiation absorbed dose. It is a measure of
the amount of energy that whatever is being emitted imparts on the recipient. The physics
equivalence of 1 Gy is 1 Joule of energy absorbed per kilogram in the receptors tissue. In marine
environmental studies, where absorbed doses are typically low, the centi-gray (cGy) or micro-gray
(uGy) units are often used.
The sievert (Sv) is the radiation dose equivalent and is designed to address the potential for
imparting biological effects. It is obtained after standardizing the absorbed dose (Gy) by the
relative biologic effectiveness (RBE) or quality factor (QF) for the type of radiation. The Sv
measure results from multiplying the Gy dose by the RBE for the specific type of radiation
involved. One Sv is the amount of radiation, after adjusting for radiation type, equal to the

95
biological effect of 1 Gy of gamma rays. An RBE of 1 is used for gamma rays and beta particle
positrons, while it can be up to 20 for alpha particles, depending upon energy levels. The Sv
integrates the type of radiation and its dose (Gy) into equivalent biological units of impact. Thus,
when one attempts to characterize biological risk from radiation exposure, the Sv - or fractional
units of the Sv, such as the uSv - is the ultimate unit of interest. The Sv equivalent in United States
units is 100 rem.
The British Broadcasting Company (BBC) has provided an illustrative boxing analogy to
contrast what is intended by the three international radiation measures (BBC, 2004). It depicts, for
the public, the qualitative differences between Bq, Gy and Sv as:
Bq: “ a measure of how many punches are thrown without regard to whether they are
roundhouses, hooks, jabs, or even if they connect at all.”
Gy: “a unit that measures whether the punch is a strong uppercut or just a little jab.
However, the gray wouldn’t show the cumulative effect of something like 100 jabs to the exact
same spot on the cheekbone versus one hard punch to the solar plexus”
Sv: “useful in determining the likelihood that (the boxer) might suffer some long-term
damage as a result of this pummeling.” “In short, a Sv is the most useful but complicated and
subjective unit for measuring radiation effects on people.”