a revealed preference analysis of phd students...
TRANSCRIPT
1
A Revealed Preference Analysis of PhD Students’ Choices Over Employment
Outcomes
By ANNAMARIA CONTI and FABIANA VISENTIN1,2
Abstract
We develop a revealed preference approach to elicit science and engineering
PhDs’ preferences over employment outcomes, exploiting cohort size variations.
Depending on whether pecuniary and non-pecuniary rewards are sticky or not,
increments in the PhDs’ cohort size decrease either the availability of their ideal
employment categories or the related compensations. In both cases, the PhDs’
preferred employment categories are revealed to be the ones that are relatively
less chosen when the PhDs’ cohort is large and relatively more so when it is
small. Examining two major European universities, we find that PhDs equally
value employment in highly-ranked universities and R&D-intensive companies.
Moreover, these employment categories are preferred to low-ranked universities,
non-R&D-intensive firms, and public administration. There is preference
heterogeneity across PhDs depending on their research field.
Keywords: Revealed Preferences, Employment Choices, PhD Students, Cohort Size Effects
JEL Codes: I2, I23, J2, J6
1 Conti: Scheller College of Business and RCEA, Georgia Institute of Technology, 800 West Peachtree Street,
Atlanta, GA 30308, USA. Phone Number: 404-713-6133. Email: [email protected]. Visentin:
Chair in Economics and Management of Innovation, École Polytechnique Fédérale de Lausanne, ODY 1.18, Station
5, Lausanne, Switzerland, 1015. Phone Number: +41-021-6930038. Email: [email protected]. 2 We are indebted to Paula Stephan and Peter Thompson for their invaluable advice. We also thank Michele Cincera,
Eric Crane, Maryann Feldman, Gianni de Fraja, Dominique Foray, Jacques Mairesse, Pierpaolo Parrotta, Mike
Pellens, Michele Pezzoni, Mike Roach, Henry Sauerman, Jerry Thursby, Marie Thursby, Reinhilde Veugelers, and
seminar participants at the University of Leuven, Free University of Brussels, University of Lausanne, EPFL,
Imperial College, SKEMA Business School, and 2014 GSU Barcelona conference.

2
1. Introduction
The organization of PhD programs around the world has been subject to increased policy
debate. At issue is whether universities produce too many PhDs, given the limited availability of
permanent academic positions (Stephan, 2012a)3. One key step for assessing the optimal size of a
PhD program is understanding the PhDs’ preferences with regard to career outcomes. Whether or
not PhD programs are oversized may depend on the students’ evaluations of careers outside of
academia, which can offset the reduced availability of tenure-track positions. More generally, it
also depends on whether PhDs’ preferences are consistent with the training they received during
their PhD program. In fact, the large amount of resources that governments spend on PhD
programs is based on the assumption that PhDs will work in positions that facilitate knowledge
transfer and provide returns to those governments. Our study contributes to this ongoing debate
by developing a novel revealed preference approach to elicit PhDs’ preferences over
employment choices while exploiting cohort size variations. We implement this approach using
a fine-grained dataset of science and engineering PhDs who graduated from two major European
universities during 1999-2009.
PhDs form preferences for certain employment categories based on the history of
pecuniary and non-pecuniary compensation offers. Once they are in the job market, they begin
by applying for their most preferred employment categories and then consider applying for the
least preferred ones. If compensations are sticky, which is the most compelling assumption given
our empirical context, variations in the PhDs’ cohort size act as a revealing preference
mechanism by affecting the probability that PhDs are offered their ideal employment. Ceteris
paribus, when the PhDs’ cohort size increases, applications for their ideal categories rise,
reducing the probability that the PhDs are employed in these categories relative to the other
categories available in their choice set. If compensations are regulated by labor market
conditions (Oyer, 2006; Stephan and Ma, 2006), variations in the PhDs’ cohort size impact the
attractiveness of their ideal employment categories by affecting the associated expected
compensations. Ceteris paribus, when the PhDs’ cohort size increases, applications for their
ideal categories rise, reducing the associated expected compensation and making other categories
3 See also Conti and Liu (Forthcoming a), Conti and Liu (Forthcoming b), Stephan (2012b), Cyranoski et al. (2011),
Stephan (2007), and Freeman et al. (2001).
3
relatively more attractive. If students are forward-looking and anticipate the consequences of
PhD cohort size increases, they would increase their applications for their less preferred
employment categories when graduating from a large cohort. In all cases, the PhDs’ ideal
categories are the ones that are less frequently observed when the students’ cohort is large and
more frequently so when the cohort size is small.
We apply our revealed preference method to a sample of 2,345 students who obtained
their PhD degree from the Swedish Chalmers University of Technology (Chalmers) and the
Swiss Federal Institute of Technology in Lausanne (EPFL). These universities have a number of
characteristics in common: they are leading universities in their own countries, they specialize in
science and engineering disciplines, and they are actively involved with the industrial sector.
Using multiple sources, we collected detailed information on the PhDs’ careers. The richness of
our data allows us to go beyond the dichotomous distinction between employment in universities
and that in the industrial sector (Stephan, 1996). For instance, we rank universities and research
centers according to their publications4. We also observe positions in public administration,
schools, and teaching colleges5. Within industry we distinguish between employment in R&D-
intensive companies, non-R&D-intensive companies, and startups. This fine-grained
categorization is an important contribution to the existing literature. Undoubtedly, within
industry and also within academia, there is an ample spectrum of employment possibilities which
differ in a number of significant respects (Sauermann and Stephan, 2013).
We analyze a set of exhaustive and mutually exclusive employment categories among
which PhDs can choose, just after graduation. We estimate a series of multinomial logit models
which relate the PhDs’ employment outcomes to their cohort size and other controls. We have an
unusually large set of background variables that allow us to account for factors that may be
correlated with the PhDs’ cohort size and with their employment attainments. For instance, we
include measures for labor demand conditions at graduation, given that they may influence a
student’s selection into a given PhD cohort. Moreover, we have fine-grained measures of
4 Unless otherwise specified, we shall include in the “university” category universities as well as research centers.
5 We shall include in the “public administration” category occupations in schools and teaching colleges. In what
follows, we will use the term “administration” to refer to public administration.

4
students’ research skills and orientation, as well as information about their pre-enrollment
working experience. We also control for supervisors’ characteristics, including their publication
or patent output.
We find that when cohort size is large, PhDs are less likely to be employed in R&D-
intensive companies or in highly-ranked universities, as opposed to working in low-ranked
universities, non-R&D-intensive companies, startups, and the administration. Thus, we deduce
that R&D-intensive companies and highly-ranked universities are the most preferred
employment options. This preference ordering is consistent with the transitivity axiom of
preference relations, given that positions in R&D-intensive companies and in highly-ranked
universities are preferred to the same employment alternatives. Moreover, and again in line with
the transitivity axiom, employment in low-ranked universities is not preferred to positions in
non-R&D-intensive companies, startups, and the administration. These results are robust across a
number of specifications in which, amongst others, we deal with the possible endogeneity of
cohort size.
These findings challenge the traditional wisdom that PhDs are unconditionally inclined
towards the academic realm and less prone to compromise with the industry norms (Dasgupta
and David, 1994). Rather, they illustrate that the research quality of universities and the
closeness of companies to the academic modus operandi play a fundamental role in the students’
choice between industry and academia. Interestingly, students appear to be indifferent between
employment in low-ranked universities and non-R&D-intensive firms, suggesting that the non-
pecuniary benefits offered by the former offset the higher wages typically provided by the latter.
When we analyze PhDs in engineering and in basic sciences separately, we find some
preference heterogeneity. Specifically, we find that the attractiveness of employment in highly-
ranked universities and in R&D-intensive firms declines more steeply with the cohort size for
PhDs in engineering compared to those in basic sciences. This result suggests that the
opportunity costs of choosing these employment alternatives increase faster, following a cohort
expansion, for engineering students when compared to students in basic sciences.
Our results provide a fundamental contribution to the literature on PhDs’ preferences
over employment outcomes. Sauermann and Roach (2012) surveyed a sample of US PhDs in
5
basic sciences asking the respondents to rate a number of employment options. They find that
academic research careers are highly regarded by their survey participants and supervisors play
an important role by encouraging these career choices. Compared to their stated preference
approach, our methodology provides three key advantages. First, it does not suffer from well-
known shortcomings intrinsic to inferring information about PhDs’ preferences from survey
answers. To cite a few drawbacks, survey responses are sensitive to the way questions are
formulated (Beshears et al., 2008). Respondents also have a tendency to express views that they
think are in line with the survey organizers’ opinions (Zizzo, 2010)6 or with socially acceptable
positions. Another source of bias comes from the fact that the respondents are aware their
preferences are being investigated7. Finally, survey participants may simply not have the
incentive to truthfully express their preference ordering (Bertrand & Mullainathan, 2001). The
second advantage of our approach is that, due to the richness of our background variables, the
revealed preference ordering we obtain is not confounded by factors such as individuals’ gender,
nationality, abilities, and supervisors’ characteristics. These aspects have been found to play an
important role in shaping PhDs’ preferences (Fox and Stephan, 2001). The last advantage is that,
in contrast to Sauermann and Roach (2012), we examine a more detailed employment choice set
that distinguishes between R&D and non-R&D-intensive companies and between highly-ranked
and low-ranked research institutions. In related papers, Stern (2004) and Sauermann and Roach
(2014) evaluate the determinants of the stated wage premium that senior scientists or PhDs
require to be employed in non-research-intensive firms, as opposed to research-intensive ones.
Moreover, Agarwal and Ohyama (2012) and Pellens et al. (2013) examine the optimal sorting of
PhDs into labor market outcomes according to their stated preferences. They find that students
with ex-ante preferences for non-pecuniary rewards are more likely to sort into academia. Our
work is the first to consider labor market conditions as a lever to infer PhDs’ preferences.
The remainder of the paper is as follows. Section two presents a conceptual framework to
guide our empirical analysis. Section three describes the empirical context. Section four
discusses the empirical method. Section five presents the results and Section six the robustness
6 This phenomenon is known as “experimenter demand effect”.
7 This phenomenon is known as “observer effect”.
6
checks. Section seven explores preference heterogeneity between students in basic sciences and
engineering. Section eight concludes.
2. Conceptual Framework
We propose a simple conceptual framework to guide the empirical analysis on the PhDs’
revealed preferences. The mechanisms we describe in this section are a straightforward
application of the weak axiom of revealed preference to the context of occupational choices.
During their doctoral program, PhDs form their occupational preferences using the
information they have available. We define the PhDs’ ideal employment categories as the ones
that are the students’ most preferred based on the history of pecuniary and non-pecuniary
compensation offers.
When they are about to graduate, PhDs enter the job market and evaluate the different job
alternatives. They must ultimately choose an employment category among a set of exhaustive
and mutually exclusive available categories. The students make their decision by comparing the
amount of consumption (C) they can afford, given the compensation (Rj) they are offered under
each employment category j. A standard budget constraint applies whereby the students’ level of
consumption cannot exceed the compensation they receive for their work8. In this setting, C is
consumption of a composite bundle, which includes, among others, intangible goods such as peer
recognition in the scientists’ community (Stephan, 1996; Dasgupta and David, 1994). Rj
encompasses pecuniary rewards as well as non-pecuniary benefits, including permission to
publish research work or time for puzzle-solving projects (Sauerman and Roach, 2014).
In this context, PhDs’ preferences over employment outcomes can be revealed from their
employment choices under different states of their cohort. In developing our reasoning we
distinguish between the case in which compensations are sticky and the case in which they are
free to adjust to variations in labor market conditions. We believe that the first case is the most
compelling given the empirical context we analyze. Indeed, compensations in Switzerland and
Sweden are highly regulated compared to those offered in the US (Blau and Kahn, 2002;
Tremblay et al., 2008).
8 Without loss of insight, the PhDs’ wealth is set to zero.

7
Once they are in the job market, we expect that PhDs begin by applying for their most
preferred employment categories and then consider applying for the least preferred ones.
Throughout, we shall assume that the demand for PhDs outside of their ideal categories is large
enough to absorb any residual PhD supply after the PhDs’ ideal categories have been offered.
This is a very sensible assumption if one considers that outside of PhDs’ ideal categories there is
a large variety of employment possibilities, for which the PhDs’ problem-solving skills are well-
suited (Noordam and Gosling, 2006; Noordam and Gosling, 2008; Stephan, 2012a).
Let us examine the case in which Rj is sticky. Given our setting, the PhDs’ ideal
categories are the ones that are filled first. Only once they are filled do PhDs start accepting
positions in the remaining categories. This implies that, ceteris paribus, following a PhD cohort
size expansion, the probability that the PhDs’ are employed in their ideal categories relative to
the other categories available in the PhDs’ choice set decreases, making these ideal categories
less frequently observed. The opposite occurs when the PhD cohort size decreases. In this case,
the probability that the PhDs are employed in their ideal categories increases, making these
categories more frequently observed.
If Rj is flexible, variations in the students’ cohort size can still be used as a revealing
preference mechanism. In this case, ceteris paribus, an increase in the PhDs’ cohort size induces
an increment in the applications for their ideal categories, causing an increase in the labor supply
for these categories and a reduction in the related compensation. As a result, other employment
categories become relatively more attractive and, thus, are more frequently chosen.
Analogous conclusions are reached if PhDs are forward-looking and anticipate the
consequences of a cohort size increase. Then, PhDs would increase their applications for their
less-preferred employment categories when graduating from a large cohort.
To conclude this section, we note that for the PhDs’ revealed preference ordering to be
rational it must comply with the transitivity property in addition to satisfying the weak axiom of
revealed preference9. Compliance with the transitivity property prevents a PhD who chooses
employment category A, when facing the set of alternatives {A,B}, and category B, when facing
9 See Mas-Colell et al. (1995), Chapter 1.

8
{B,C}, from choosing C, when confronted with {A,C}. In the empirical analysis, we shall
demonstrate that the transitivity property is, indeed, satisfied.
3. Context
We used data from EPFL and Chalmers because these universities have a number of
important aspects in common. First, they are leading institutes of technology in their own
countries. Second, they hold high positions in a number of European university rankings.
According to the 2013 Leiden ranking of European universities, both EPFL and Chalmers are
ranked within the top 50 institutions10. Moreover, according to the same ranking, these
universities hold a high score for their collaborations with the industrial sector. As mentioned in
a recent article which appeared in Science, EPFL and Chalmers are also major recipients of
European Commission grants, which are awarded for research projects that often involve
industrial partners11. Their intense collaboration with industry is not surprising given that each of
these universities is surrounded by a dense cluster of companies. Finally, EPFL and Chalmers
host doctoral programs with similar characteristics. At both schools, a PhD program lasts four
years, and extensions, as well as dropouts, are rare. PhD applicants are selected by their
prospective supervisor, rather than by the university or a given department, and work with that
supervisor for the duration of their program (Conti et al., 2014).
To construct our sample, we obtained from EPFL and Chalmers the lists of PhDs who
had graduated during the 1999-2009 period. This amounts to 1,290 individuals from Chalmers
and 2,061 individuals from EPFL. We then collected information on the PhDs through extensive
searches on their websites, their supervisors’ websites, their publicly available dissertations, and
their LinkedIn profiles. When the individuals’ CVs were incomplete, we used sources such as the
publication database Scopus, to determine their affiliations. We only retained PhDs for whom we
had complete career information. These individuals represent 70 percent of the initial sample: 68
percent from Chalmers and 71 percent from EPFL.
10 Additional information is available at http://www.leidenranking.com/ranking.
11 http://news.sciencemag.org/people-events/2013/01/graphene-and-brain-modeling-project-win-billion-euro-
science-contest.

9
Of the total sample, 62 percent had graduated from EPFL, while the rest from Chalmers.
When classified by discipline, 42 percent had graduated in basic sciences (physics, chemistry,
mathematics, and life sciences), whereas 58 percent were in engineering. During their PhD, 84
percent of the individuals had only one supervisor assigned. For those who had more than one
supervisor assigned, we conducted extensive searches to identify their main supervisor. From
Scopus, we collected students’ publications, including conference proceedings, from the moment
they enrolled in a doctoral program until two years after graduation12. Chalmers students had
published an average of 6.5 articles each during their PhD (median number =5), while EPFL
students had published an average of 6.7 papers (median number =5). The students’ mean
publication count is 6.4 for engineering and 6.8 for basic sciences.
We now present descriptive statistics for the PhDs’ 459 supervisors. The average number
of papers a supervisor had published in the five years prior to their students’ enrollment is 26 at
EPFL and 18 at Chalmers. Fifteen percent of the supervisors were granted at least one US patent
in the five years prior to a student’s entry into their PhD program. The percentage is 17 for EPFL
supervisors and 13 for Chalmers supervisors. Thirty percent of the supervisors at EPFL and 26
percent at Chalmers, had worked in the industry sector prior to their current appointment or had
founded technology startups.
Next, we provide information about the positions that our PhDs had attained just after
graduating. The distribution of PhDs’ first position after graduation, segmented by institution, is
illustrated in Figure 1. It reveals that the career patterns at these universities are similar.
Approximately 54 percent of the graduates had found positions in academia. The vast majority of
them, 93 percent, had started as postdocs. Moreover, a considerable percentage of graduates, 24,
had continued to be affiliated with their original institution. Regarding the other employment
categories, 34 percent of the total PhDs were initially employed in the industrial sector
(excluding startups), 6 percent in startups, mainly as founders, and 6 percent in the
administration.
12 We posit that there are lags between the end of a PhD’s research project and the publication of its results.

10
Figure 1: Distribution of PhDs’ first employment after graduation, by institution
<Insert Figure 1 about here>
To distinguish between R&D-intensive and non-R&D-intensive companies, we collected
information about the US patents that these companies were granted during the 1999-2009
period, as well as information about their publications. A company was identified as R&D-
intensive if it was in the last percentile of the distribution of similar-size companies, in terms of
their patent or publication counts13. We used publication data, in addition to patent data, because
there are some companies that publish more than they patent. Ideally, we would have used the
companies’ R&D expenditure, but these data was available only in a small percentage of the
cases. Based on this classification, 10 percent of PhDs were initially employed in R&D-intensive
companies. In Appendix B, we discuss robustness checks that modify the cutoff initially
employed.
Having distinguished between PhDs in engineering and basic sciences, the percentage of
individuals who attained a first position in a university is 61 in basic sciences and 49 in
engineering. Furthermore, the percentage of PhDs who attained a first position in an R&D-
intensive company is 8 in basic sciences and 10 in engineering. Finally, 19 percent of the PhDs
in basic sciences and 29 percent of those in engineering were employed in non-R&D-intensive
firms after graduation.
4. Econometric Methodology
To derive PhDs’ preferences over career outcomes, we estimate a multinomial logit model that
relates the probability that PhD i attains an employment category j, to a measure for the student’s
cohort size and to a set of controls. The equation we estimate is:
Pr(yi=j|xi)=exp(𝐱𝒊𝛃𝒋)
∑ exp(𝐱𝒊𝛃𝒋)𝑀𝑗=1
(1)
13 Companies were partitioned into large, medium, and small size. According to Eurostat, small size companies have
less than fifty employees; medium size companies have an employee number larger than 49 and smaller than 250.
Finally, large companies have more than 249 employees. Our revealed preference ordering holds even when we do
not normalize the companies’ research output with their size.
11
where j=1,2,3,…,k…,M, Pr(yi=j|xi) is the probability that PhD i attains employment category j,
given xi, 𝒙𝒊 is vector of characteristics of individual i, and 𝜷𝒋 is the vector of coefficients
pertaining to employment category j. As we mentioned earlier, variations in the PhDs’ cohort
size impact Pr(yi=j|xi) by either affecting the relative availability of the PhDs’ ideal categories,
when compensations are sticky, or by affecting the compensation level, when the latter depends
on labor market conditions. Regardless of the prevailing mechanism, the weak axiom of revealed
preference predicts that the PhDs’ ideal categories must be the ones that are less frequently
observed when the students’ cohort is large and more frequently so when the cohort size is small.
We examine a PhD’s first position, following graduation, and consider six mutually
exclusive employment categories. The six categories are: i) low-ranked universities and research
centers, ii) highly-ranked universities and research centers, iii) non-R&D-intensive companies,
iv) R&D-intensive firms, v) technology startups, and vi) administration, schools, and teaching
colleges14.
To classify universities into highly-ranked and low-ranked, we used their publication
counts distinguishing by research field15. Universities are categorized as highly-ranked if they
are in the last quartile for their number of articles published in the same field as PhD i.
Individuals who had pursued their postdoc careers in the same institution from which they had
graduated (24 percent of the sample) are classified in the low-ranked-university category. This
choice results from discussions with the universities’ administrative staff, which revealed that
promising PhDs are strongly encouraged to spend at least some time in another institution. In
the case of EPFL, PhDs who continue to be affiliated with this institution during their postdoc
are constrained from applying for tenure positions16. With this classification, 13 percent of the
post-graduation positions are in highly-ranked universities, while 41 percent are in the low-
ranked universities. There may be two exceptions to the fact that careers at EPFL and Chalmers
14 Because we have yearly data, we do not observe unemployment periods. However, discussions with both
universities’ administrators revealed that these periods typically last less than six months.
15 Publication information was retrieved from Scopus for the last decade. The fields considered are: physics,
mathematics, chemistry, material science, computer science, and engineering.
16 As an example, one of the authors was prevented from applying for a tenure-track position offered by EPFL, on
the grounds that he/she had obtained his/her PhD from this university.

12
should be included in the low-ranked university category. The first exception, in the case of
EPFL, is when a PhD is employed in a different research group than the one of her supervisor.
The second exception, which regards Chalmers, is when a PhD is hired as faculty right after
graduation17. In a complementary analysis, we include these exceptions in the category of
highly-ranked universities. In Appendix B, we also estimate models in which we consider
positions at Chalmers and EPFL as a separate category. Figure 2 compares the three alternative
criteria just described.
Figure 2. Alternative classification criteria for highly-ranked and low-ranked universities
<Insert Figure 2 about here>
Notes: We illustrate the criteria used to classify positions at EPFL and Chalmers. Criterion 1: We include in the
low-ranked-university category PhDs who had pursued their postdoc careers in the same institution from which they
had graduated. Criterion 2: We include in the highly-ranked-university category EPFL PhD graduates who were
employed in a different research group than the one of their supervisor’s and Chalmers PhDs who were hired as
faculty, at Chalmers, right after graduation. Criterion 3: We classify positions at Chalmers or EPFL as a distinct
category.
Our measure for a PhD’s cohort size, which we denote as PhD Cohort Sizeit, is defined as
the count of students who graduated in year t in the same field as i. The fields we consider are
basic sciences and engineering18. This variable includes only those PhDs who are potential
competitors to i in the job market. In the case of EPFL, PhD Cohort Sizeit includes students who
had graduated from EPFL as well as students from the Swiss Federal Institute of Technology in
Zurich (ETHZ). In the case of Chalmers, we include PhDs from Chalmers and from the Swedish
Royal Institute of Technology (KTH), which offers very similar doctoral programs as those
offered by Chalmers. Our cohort definition does not encompass PhDs who graduated outside of
Sweden or Switzerland. The reason is that there are important labor entry barriers in both of
these countries, which raise the costs of hiring foreign PhDs. In Sweden, the most important
barrier is represented by the language. The Swedish language is only spoken in Sweden and it is
17 This last practice was more frequent in the early years of our sample than in the most recent ones.
18 We conducted a robustness check in which we further classify the engineering field into small-scale engineering
(mechanical engineering, electrical engineering, and micro engineering) and large-scale engineering (civil
engineering). The results are invariant.
13
rarely studied as a foreign language in other countries. Non-European Union PhDs face an
additional obstacle. In order for them to be hired, Swedish employers must demonstrate that no
other European Union citizen had their skills. This last argument applies also to Switzerland.
Moreover, Switzerland has in place a system of quotas for European citizens, and it is easier to
obtain a working visa if a European student received her PhD degree from a Swiss university.
One concern for those PhDs who search for employment outside of their graduation countries is
that the relevant cohort size may not be the one of their graduation affiliation. However, the
majority of PhDs who are employed abroad remain in the academic sector and are typically
supported by grants from their graduation country. In Appendix B, we present a number of
robustness checks in which we adopt a broader measure of a PhD’s domestic cohort, we control
for nearby cohorts, and we add measures for the size of out-of-graduation-country PhD cohorts.
Figure 3 represents the size of PhD cohorts over time, distinguishing by university and by field.
Figure 3. Size of PhD cohorts over time by university and by field
<Insert Figure 3 about here>
Similar to a cobweb model, we expect a PhD’s cohort size to be predetermined for three
main reasons19. The first is that a PhD’s cohort at graduation is formed four years prior to the
PhD’s graduation date. We noted in the sample description section that the dropout rates are very
low at both universities and that the doctoral program duration is fixed. These characteristics
ensure that a student’s cohort size at enrollment is almost the same as the one at graduation and
that students do not adjust their exit from their PhD based on the labor demand conditions at the
time they are expected to graduate. The second reason is that Sweden and Switzerland are small
open economies that depend on larger countries’ economic conditions, which cannot be easily
predicted by PhD applicants ahead of time. Specifically, during our sample period, we capture
two recessions, one at the beginning of the 2000’s and the other in 2009, as well as two
economic cycles. The third reason is that individuals might plausibly decide to start a PhD
because they are driven by a puzzle-solving joy rather than by future wage conditions (Dasgupta
and David, 1994).
19 Blume-Kohout and Clack (2013) examine enrollment in US PhD programs and find strong support for the cobweb
expectation model as opposed to the forward expectation model by Ryoo and Rosen (2004).
14
We still include in equation (1) a number of measures of employment demand conditions
at graduation to help ensure that our effects are the result of cohort size changes and not also the
outcome of labor demand variations20. Because Sweden and Switzerland are small open
economies, the measures that we use can plausibly be considered as independent of a PhD’s
cohort size in these countries. We include a categorical variable that assumes values that increase
with the GDP growth of a student’s graduation country. GDP variations may affect some
students’ employment categories more than others. Additionally, we control for the availability
of postdoctoral positions at a PhD’s graduation university, using the number of professors
affiliated with EPFL and Chalmers in the field in which the student specializes. We can plausibly
expect that the larger this number is, the higher is the availability of postdoc positions. Because
PhDs may seek postdoctoral positions abroad, especially in the US, we built a measure for the
availability of these positions. The measure is defined as the difference between the number of
postdocs hired, in a given year, by US research institutions and the number of US students who,
in that year, obtained their PhD in the same field as graduate i21. To control for the availability of
positions in R&D-intensive companies, we used the number of patent applications filed from
Sweden and Switzerland at the EPO in the same year in which i had graduated. Ideally, we
would have used measures for the countries’ R&D spending, but, unfortunately, these measures
are not available for the entire period we observe. While our measures for labor demand
conditions are not perfect, simulations available upon request show that large variations in labor
demand omitted aspects are required to alter the preference ordering we find in the next section.
Equation (1) includes a detailed set of PhDs’ characteristics that may affect their
employment choices. We control for an individual’s gender, age, whether she worked prior to
beginning her doctoral program, and whether she comes from a foreign country. Among the
foreign PhDs, we distinguish between those from EU-15 countries and the remainder. As
mentioned earlier, employment constraints for the first PhD category are less stringent than for
the second. We follow Balsmeier and Pellens (2014) and use the PhD’s publication count as a
proxy for her research talent. We built an indicator variable that equals 1 if an individual was
20 Similarly, Oreopoulos et al. (2012) control for students’ cohort characteristics when estimating the impact of labor
demand conditions at graduation on the students’ employment outcomes.
21 Information on the number of postdocs hired by US research institutions is available from the National Science
Foundation: http://www.nsf.gov/statistics/nsf13331/.
15
granted at least one patent (4 percent of the total sample), had published articles with industrial
partners (7 percent), or had worked with a company while attending her PhD program (10
percent). This composite index, which is equal to 1 in 17 percent of the sample, is a proxy for the
degree to which a PhD’s research can be used in industrial applications.
We also include measures for a PhD’s supervisor’s characteristics. We built measures for
the productivity and status of a supervisor, as well as proxies for her connections with the
industrial sector. Specifically, we control for a supervisor’s five-year pre-sample count of
publications and patents, whether the supervisor had ever worked in industry, and whether she
had been involved in European projects with industrial partners.
We control for university-field fixed effects to account for characteristics that are specific
to a given university-field. The fields that we consider are engineering and basic sciences.
Finally, we use graduation-year fixed effects to control for global economic trends. Given the
presence of university-field fixed effects and graduation-year fixed effects, the coefficient of
PhD Cohort Sizeit measures changes in employment attainments resulting from university-field-
graduation-year specific variations in the PhDs’ cohort size. Descriptive statistics are in Table 1
and details on the variables’ definition are in Appendix A.
Conditional on the controls that we include in equation (1), variations in a PhD’s cohort
size could result from two main sources. The first consists of variations in the number of
applicants to a PhD program. As an example, the EPFL doctoral school provided us with
aggregated data on the number of applicants for the period 2007-2013. These data show that the
total number of applicants has increased over time, mainly because of foreign applicants. The
second source consists of exogenous variations in the number of available doctoral positions.
These variations are not driven by over-time changes in the quality of a hosting university or in
labor demand conditions, which we control for. They could be triggered, for instance, by the
appointment of a new dean or a university president.

16
Table 1: Descriptive statistics
<Insert Table 1 about here>
Notes: N=2,345.
5. Results
Table 2 presents the results from estimating equation (1) for a PhD’s initial position after
graduation. The base outcome is represented by employment in low-ranked universities. The
coefficients we report are relative risk ratios. Ratios greater than one imply that an increase in the
regressor leads to a higher probability that outcome j is chosen over the base outcome r, with the
opposite for ratios less than one. The relative risk ratios for the other base outcomes, which are
positions in highly-ranked universities, non-R&D-intensive firms, R&D-intensive firms, and
administration, are obtained as follows: exp(βj,p|q)=exp(βj,p|r)/exp(βj,q|r), where p, q, and r are
employment categories and p≠r. We cluster standard errors at the level of the PhDs’ supervisors
to account for intra-group correlation22.
As shown, when a PhDs’ cohort size is large, their odds of being employed in an R&D-
intensive company decrease relative to working in either a low-ranked university, a non-R&D-
intensive company, a startup, or the administration. Adding 10 members to the students’ cohort
decreases their odds of being employed in an R&D-intensive company by a factor of 0.85
relative to working in a low-ranked university or in a startup, and by a factor of 0.87 relative to
working in a non-R&D-intensive company or in the administration. When we use positions in
highly-ranked universities as a reference category, the impact of the PhDs’ cohort size on their
odds of being employed in an R&D-intensive company is not significant. Additionally, the
students’ cohort size does not significantly affect their odds of attaining positions in low-ranked
universities relative to being employed in either non-R&D-intensive companies, startups, or the
administration. From these findings, we infer that occupations in R&D-intensive companies are
preferred to positions in other employment categories except those in highly-ranked universities.
Moreover, positions in low-ranked universities are not preferred to occupations in either non-
R&D-intensive companies, startups, or the administration.
22 We obtain very similar results when we cluster standard errors at the university-field level.

17
As we mentioned earlier, for our preference ranking to be rational, it must comply with
the transitivity axiom of preference relations. Thus, we need to verify that if PhDs evaluate
positions in R&D-intensive companies and those in highly-ranked universities equally, then they
prefer positions in highly-ranked universities to employment in non-R&D-intensive companies,
startups, and the administration. Results in Table 2 show that the PhDs’ cohort size has a
negative and significant impact on their odds of working in highly-ranked universities, relative to
working in non-R&D-intensive companies, low-ranked universities, or the administration. The
negative impact on the likelihood of working in highly-ranked universities relative to startups is
not statistically significant. The likely reason is that the startup category contains relatively few
observations. Hence, estimations using this category as reference are less precise. In robustness
checks presented in Appendix B, we distinguish between R&D-intensive and non-R&D-
intensive startups. We then combine the R&D-intensive startups with the R&D-intensive firms to
create a new R&D-intensive-firm category. We do the same with the non-R&D-intensive
startups and construct a new non-R&D-intensive-firm category. With this alternative
classification we obtain that, relative to positions in highly-ranked universities, the effect of a
student’s cohort size on the odds of being employed in R&D-intensive firms remains
insignificant and the effect on the odds of being employed in non-R&D-intensive firms continues
to be positive and significant23.
The highlighted results are presented in Figure 4 where we plot the predicted
probabilities for each employment category as a function of the PhDs’ cohort size. The
likelihood of employment in highly-ranked universities and in R&D-intensive-firms decreases
with cohort size. Conversely, the likelihood of employment in low-ranked universities, non-
R&D-intensive firms, startups, and administration increases.
Concerning the controls, we highlight some interesting results. For instance, foreign
PhDs, especially those from outside of the EU-15, are less likely to work in administration, while
women are more likely to be employed in this category. Moreover, women are more likely to
attain positions in universities, regardless of their rank, than positions in non-R&D-intensive
companies. Older PhDs are less likely to be employed in highly-ranked universities, as opposed
23 We also analyzed the two universities, separately. While the results on the coefficients’ signs remain the same, the
significance is lowered due to the reduced sample size.

18
to low-ranked universities and administration. A student’s publication count positively affects
the likelihood of employment in universities, regardless of their rank, relative to industry
employment. This positive effect is strongest for highly-ranked universities. Moreover, it is
larger when university employment is compared to employment in non-R&D-intensive firms
rather than to employment in the R&D-intensive ones. Individuals with prior experience in
industry or who had pursued more applied research during their PhD are more likely to work in
the industrial sector than being employed in universities. PhDs whose supervisors were granted
patents are more likely to be employed in R&D-intensive companies. Concerning our proxies for
the availability of positions at a student’s graduation, the higher a graduation country’s GDP
growth is, the more likely the student is to be employed in R&D-intensive-companies and
technology startups, relative to low-ranked universities and non-R&D-intensive firms. Similarly,
a country’s patent application stock positively affects the odds of employment in R&D-intensive
companies relative to employment in non-R&D-intensive companies.
Figure 4: Predicted probabilities for each employment category
<Insert Figure 4 about here>
Table 2: Multinomial logit results for PhDs' employment attainments, after graduation
<Insert Table 2 about here>
Notes: Coefficients are relative risk ratios. N=2,345. Robust standard errors (in parentheses) are clustered around
supervisors. ***, **,*: Significantly different from zero at the 1%, 5%, 10% confidence levels. When changing base
outcome, the corresponding relative risk ratios can be obtained as follows: exp(βj,p|q)=exp(βj,p|r)/exp(βj,q|r), where
p, q, and r are employment categories and p≠r.
For our multinomial logit model to correctly estimate the odds associated with the PhDs’
occupational attainments, it must exhibit the Independence of Irrelevant Alternatives property
(Luce, 1959). To verify that this property is satisfied, we performed a Hausman test of the
hypothesis that the parameter estimates obtained on a subset of alternatives do not significantly
differ from those obtained with the full set of alternatives (Hausman and McFadden, 1984).
Thus, we compared the coefficients in the original model to the ones we would have obtained by
eliminating one employment category at a time, and tested that the difference in the coefficients
19
is not significantly different from zero. In all instances, we could not reject the null hypothesis
that the coefficients are the same with p-values greater than 0.52.
It may be more appropriate to include in the highly-ranked-university category Chalmers
PhDs who were hired as faculty in their own university and EPFL graduates who had stayed at
their own affiliation, but had moved to a different research group than their supervisor’s. By
doing so, we move 63 students – 49 from Chalmers and 14 from EPFL – to the highly-ranked-
university category. The results are in Table 3. For the sake of brevity, we only show the
coefficients of interest. We only present the results using as a base outcome employment in low-
ranked universities. Expectedly, they remain very similar to those presented in Table 2. The only
exception is that the impact of cohort size on the likelihood that a PhD is employed in a highly-
ranked university rather than in the administration is now insignificant, while before it was
marginally significant. This outcome is likely due to the fact that the administration category is
very small.
To conclude this section, we note that the goal of our study was to infer the preferences
of an average PhD over career outcomes, holding constant a very large number of PhD and
supervisor characteristics. One possible limitation of our approach is that the cohort size
measure we use is systematically related to some remaining omitted PhDs’ characteristics that
could also affect the jobs that are available to them. However, given the richness of our dataset,
we feel confident that we have controlled for the most relevant PhD characteristics that could
affect their preferences. Thus, any omitted aspect should not modify the preference ranking we
currently find. Reassuringly, discussions we had with several EPFL and Chalmers PhDs,
supervisors, and administrative staff confirmed that the ordering we find is very much consistent
with the preference ordering they inferred based on their experience.

20
Table 3: Multinomial logit results for PhDs' employment attainments, after graduation. We
include in the highly-ranked-university category Chalmers PhDs who were hired as faculty
in their own university and EPFL PhDs who had stayed at their own affiliation, but had
moved to a different research group than their supervisor’s
<Insert Table 3 about here>
Notes: See notes in Table 2. We used the same controls as in Table 2.
6. Robustness checks
Despite the fact that we were able to include in our sample a large percentage of the PhDs
who had graduated from Chalmers and EPFL during 1999-2009, a possibility is that our
estimates are inconsistent because of sample selection bias. To address this concern, we estimate
a logit regression model in which we relate the probability of being included in the sample to a
PhD’s cohort size and a number of other characteristics that we were able to observe for both in-
sample and out-of-sample individuals. The results are in Table 4, where the coefficients reported
are odds ratios. Robust standard errors are clustered around PhDs who graduated from the same
university-department24. While older students, foreign students, women, students with common
last names, and students with few publications are significantly less likely to appear in our
sample, the coefficient of PhD Cohort Sizeit is not significantly different from zero.
Reassuringly, this result indicates that our interest variable is not systematically correlated with
the probability that a PhD is included in the sample.
In robustness checks, available upon request, we estimate a two-step Heckman selection
model for the probability that a PhD is employed in her preferred employment categories, i.e.
highly-ranked universities and R&D-intensive firms. As in Table 4, the probability of being
included in the sample is modeled as a function of whether a PhD’s last name appears more than
once in our sample, given that it is difficult to identify biographical information for PhDs with a
common last name. The latter variable is unlikely to be correlated with the PhDs’ employment
choices, providing a foundation to the validity of the exclusion restriction imposed. We use the
same controls as the ones in Table 4. In the career outcome equation, we include all the controls
24 We could not cluster standard errors around supervisors because in some instances this information was
unavailable.
21
used in equation (1) and the Mills’ ratio resulting from the selection equation. Standard errors are
clustered around PhDs from the same university-research field. The Mills’ ratio is insignificantly
different from zero, suggesting that the selection and the employment outcome equations could
be treated as independent. Importantly, the coefficient of a PhD’s cohort size, once we include
the Mills’ ratio, is very similar to the one without including the Mills’ ratio, supporting the
validity of the estimates in Table 2.
Table 4: Logit results for the inclusion of PhDs in our sample
<Insert Table 4 about here>
Notes: Coefficients are odds ratios. N=3,351. Robust standard errors (in parentheses) are clustered around PhDs who
graduated from the same university-department. ***, **,*: Significantly different from zero at the 1%, 5%, 10%
confidence levels.
Notwithstanding the arguments we made earlier, PhD Cohort Sizeit may be endogenous if
prospective PhD applicants are forward-looking and take future labor demand conditions into
account in their decision to enroll for a PhD. To address this concern, we closely follow
Oreopoulos et al. (2012) and adopt two strategies. First, we estimate a reduced form in which we
limit the sample to those students who started their PhD in the predicted year, based on the mean
elapsed time between a student’s master’s degree and her PhD start year. The mean is computed
at the university-field level. The selection of these students into their cohort should not be
correlated with labor demand conditions at graduation. In fact, their entry year into the PhD
program is estimated based on a sub-population average calculated over the entire sample period.
The second strategy consists of instrumenting our cohort size variable with cohort size measures
in the students’ predicted year of entry. Specifically, we use as instruments the count of US PhDs
(by field) who graduated in the predicted entry year and the count of Swedish or Swiss PhDs (by
field) who graduated in the same year. We also include non-linear terms. We use information
about US PhDs because it could be that individuals apply to a wide range of universities when
they consider starting a PhD. The predicted year of entry is a valid instrument for the actual year
if it is uncorrelated with labor demand conditions at graduation, if it has no direct effect beyond a
student’s cohort size, and if it correlates with this latter variable. We believe the exclusion
restrictions are valid, since the cohorts that we use as instruments were formed eight years, on
average, prior to a PhD’s graduation. Given the large variations in relevant economic indicators

22
during our sample period, it is hard for individuals to forecast future economic conditions eight
years ahead of time. Because we found earlier that PhDs prefer positions in highly-ranked
universities and in R&D-intensive firms to all the other employment categories, we construct a
dummy that equals 1 if a student was employed in one of her two preferred categories and 0
otherwise. This dummy is our dependent variable for the results in Table 5. Column I displays
the linear probability model estimates for the entire sample of PhDs. Column II presents the
reduced form results. Column III shows the instrumental variable (IV) estimates. We adopt the
same distinction between employment in highly-ranked and low-ranked universities as in Table
2. However, analyses available upon request show that, by using the classification adopted in
Table 3, the results are invariant. Expectedly, the reduced form estimates of PhD Cohort Sizeit
are very similar to the OLS estimates. While the magnitude of the coefficient tends to be larger,
its sign and significance remain the same. As for the IV approach, the first-stage coefficients are
highly significant and the coefficient of the instrumented variable is almost identical to the one in
the reduced form. In checking for the weakness of the instruments, we find that the F-statistics
on excluded instruments is 17, which is well above the standard rule-of-thumb of 10.
Importantly, we implemented the Davidson and McKinnon’s (1981) test for the endogeneity of
our PhD Cohort Sizeit variable and found that we could not reject the null hypothesis that PhD
Cohort Sizeit is exogenous, with a p-value of 0.32. Based on this last result, in what follows, we
report the more intuitive multinomial logit estimates.
Table 5: Reduced form and IV estimates for PhDs' employment attainments
<Insert Table 5 about here>
Notes: The dependent variable is a dummy that equals 1 if a PhD is employed in a highly-ranked university or in an
R&D-intensive firm. In the IV model, we instrument the PhDs' cohort size with cohort size measures at their
predicted entry year in the PhD program, based on the university-field mean elapsed time between the students'
master’s degree and their PhD start year. As instruments we use the cohort size of US PhDs (including non-linear
terms) and our cohort size variable measured in the PhDs' predicted start year (including non-linear terms). Robust
standard errors (in parentheses) are clustered around the PhDs' supervisor. ***, **,*: Significantly different from
zero at the 1%, 5%, 10% confidence levels.
23
7. Distinguishing between engineering and basic sciences
We now investigate whether the PhDs’ preferences previously identified vary across
students in basic sciences and engineering. We reproduce the same analysis as in Table 2,
distinguishing between PhDs in basic sciences and those in engineering. The results are in Table
6. Irrespective of the field analyzed, a PhD’s cohort size negatively affects the odds of
employment in highly-ranked universities and R&D-intensive firms relative to employment in
low-ranked universities and non-R&D-intensive firms. However, there are differences, across
fields, in terms of the rate at which the most preferred employment categories are attained,
following a cohort expansion. These differences emerge very clearly from Figure 5, which plots
the predicted probability of attaining positions in the ideal employment categories relative to the
other categories as a function of a student’s cohort size. As shown, the slope of the predicted
probability curve for engineering students is steeper than the one for the students in basic
sciences. These findings suggest that the opportunity costs of working in the ideal categories
increase more steeply, following a cohort expansion, for engineering students than for the ones in
basic sciences.
Table 6: Multinomial logit results for PhDs' employment attainments, after
graduation. We report results for PhDs in basic sciences and engineering, separately
<Insert Table 6 about here>
Notes: See notes in Table 2. N basic sciences: 993. N engineering: 1,352.
Figure 5: Predicted probability of attaining positions in the ideal employment categories
relative to the other categories, by field
<Insert Figure 5 about here>

24
8. Concluding remarks
Conventional wisdom suggests that individuals who invest in PhD degrees do so because
they wish to pursue academic careers. However, empirical evidence supporting this view is
sparse and affected by a number of shortcomings. Indeed, understanding PhDs’ preferences is a
challenging task, especially because students may refrain from expressing opinions that are not
aligned with those of their supervisors or the rest of their research group. A key contribution of
this article is to develop a novel revealed preference method to elicit PhDs’ preferences over
employment outcomes, exploiting variations in their cohort size. Our approach offers
fundamental advantages over survey methods because it does not suffer from untruthful or
inaccurate response, sensitivity of answers to the way survey questions are formulated, observer
effects, or experimenter demand effects.
PhDs’ preferences for available employment categories are based on the history of
compensation offers in those categories. If compensations are sticky, increments in the students’
cohort size reduce the probability that their ideal positions are available in their choice set. If
compensations are allowed to adjust to variations in labor market conditions, then increases in
the PhDs’ cohort size reduce the rewards offered in their ideal categories, making them less
attractive. If students are forward-looking and anticipate the consequences of PhD cohort size
increases, they would increase their applications for the less preferred employment categories
when graduating from large cohorts. Empirically, these mechanisms imply that the PhDs’ ideal
categories are the ones that an external examiner observes less frequently when a cohort is large
and more frequently when the cohort size is small.
We apply our revealed preference analysis to a large sample of PhDs that graduated from
two major European universities. Devoting careful attention to factors that could be correlated
with cohort size and employment outcomes, we show that the choice set over which PhDs
express their preferences is more complex than the simple university-industry dichotomy.
Indeed, we find that students equally value positions in highly-ranked academic institutions and
those in R&D-intensive firms and prefer them above all the other employment outcomes.
Furthermore, they are indifferent between employment in low-ranked universities and in non-
R&D-intensive firms and consider these occupation categories to be as valuable as employment
in startups and administration.

25
There is some preference heterogeneity across individuals depending on their research
field. Specifically, the attractiveness of employment in highly-ranked universities and in R&D-
intensive firms declines more steeply with the cohort size for PhDs in engineering than it does
for those in basic sciences. This result suggests that the opportunity costs of working in the most
preferred categories, in response to a cohort expansion, increase faster for engineering students
than for those in basic sciences. It is, thus, consistent with anecdotal evidence that the spectrum
of employment opportunities for engineering students is larger than the one for students in basic
sciences.
In the policy debate surrounding the optimal size of PhD programs, proponents argue that
there is an imbalance between the supply of PhDs and the availability of permanent academic
positions. The preference ordering we found clearly indicates that, in assessing whether PhD
programs are over-sized, it is important to also consider the availability of employment in R&D-
intensive firms. More generally, to the extent that PhDs contribute to knowledge production and
diffusion, governments may consider implementing policies that reduce the frictions between
PhDs’ supply and occupational demand in the students’ ideal employment categories.
We applied our novel methodology to the context of PhDs. However, our revealed
preference analysis can be extended to infer the ideal categories of other workforce typologies,
including college graduates. In fact, variations in labor market conditions either affect
individuals’ availability of employment options or the compensations offered by these options,
allowing an external observer to deduce their preference ranking over these alternatives.
We inferred PhDs’ preferences, using data from two major European universities.
Although focused on a small sample, our setting possesses several traits in common with the
other Swiss and Swedish institutes of technology, the Swiss Federal Institute of Technology in
Zurich and the Swedish Royal Institute of Technology. It also shares important similarities with
other European institutes of technology, such as the Polytechnic University of Turin, the
Eindhoven University of Technology, and the Karlsruhe Institute of Technology. Future research
could extend our analysis to universities that pursue less applied research. The universities we
studied as well as the ones we just mentioned are elite institutions. While this is a limitation of
our study, we stress that one of the main reasons why scholars and policy makers are interested
in understanding PhD preferences over career outcomes is because PhDs are fundamental means

26
of knowledge diffusion to the rest of society. Elite universities are a critical source of knowledge
and PhDs from these universities potentially generate the greatest spillovers for the rest of
society. The labor markets we analyze may not be representative of the ones for the rest of
Europe. While this is a possible limitation of our study, we note that the area around Chalmers
and the one around EPFL host industry clusters that, in many respects, are similar to the ones in
other European countries. For instance, the region of Chalmers, which is specialized in the
automotive and telecommunication industries, is comparable to regions, such as Piedmont, Italy,
or Espoo, Finland, where Fiat and Nokia are located, respectively. The region of EPFL, which is
specialized in chemistry and nanotechnology, is comparable to other European regions, like
South Holland or the Belgian Flemish-Bramant, which host Unilever and a large network of
medium-sized nanotechnology companies, respectively. Future research could extend our
analysis to universities that are not surrounded by clusters of R&D-intensive companies.

27
References
Agarwal, Rajshree, and Atsushi Ohyama. 2013. "Industry or academia, basic or applied? Career
choices and earnings trajectories of scientists." Management Science 59 (4): 950-970.
Balsmeier, Benjamin, and Pellens, Maikel. 2014. Who makes, who breaks: Which scientists stay
in academe?. Economics Letters, 122(2): 229-232.
Bertrand, Marianne, and Sendhil Mullainathan. 2001. "Do people mean what they say?
Implications for subjective survey data." American Economic Review 91 (2): 67-72.
Beshears, John, James J. Choi, David Laibson, and Brigitte C. Madrian. 2008. "How are
preferences revealed?." Journal of Public Economics 92 (8): 1787-1794.
Blau, Francine D., and Lawerence M. Kahn. 2002. At home and abroad: US labor market
performance in international perspective. Russell Sage Foundation.
Blume-Kohout, Margaret E., and John W. Clack. 2013. "Are Graduate Students Rational?
Evidence from the Market for Biomedical Scientists." PloS one 8 (12): e82759.
Conti, Annamaria, Olgert Denas, and Fabiana Visentin. 2014. “Knoweldge specialization in PhD
student groups.” IEEE Transactions on Engineering Management 61 (1): 52-67.
Conti, Annamaria, and Christopher Liu. Forthcoming a. “The (Changing) Knowledge Production
Function: Evidence from the MIT Department of Biology for 1970-2000.” In The Changing
Frontier: Rethinking Science and Innovation Policy, edited by Jaffe, Adam, and Benjamin,
Jones, NBER Volume.
Conti, Annamaria, and Christopher Liu. Forthcoming b. “Bringing the lab back in: Personnel
composition and scientific output at the MIT Department of Biology.” Research Policy.
Cyranoski, David, Natasha Gilbert, Heidi Ledford, Anjali Nayar, and Mohammed Yahia. 2011.
"Education: the PhD factory." Nature 472 (7343): 276-279.
Dasgupta, Partha, and Paul A. David. 1994. "Toward a new economics of science." Research
Policy 23 (5): 487-521.
Davidson, Russell, and James G. MacKinnon. 1981. "Several tests for model specification in the
presence of alternative hypotheses." Econometrica, 49 (3): 781-793.
Fox, Mary Frank, and Paula E. Stephan. 2001. "Careers of young scientists: Preferences,
prospects and realities by gender and field." Social Studies of Science 31 (1): 109-122.
Freeman, Richard, Eric Weinstein, Elizabeth Marincola, Janet Rosenbaum, and Frank Solomon.
2001. "Competition and careers in biosciences." Science 294 (5550): 2293-2294.

28
Hausman, Jerry, and Daniel McFadden. 1984. "Specification tests for the multinomial logit
model." Econometrica 52 (5): 1219-1240.
Kahn, Lisa B. 2010. "The long-term labor market consequences of graduating from college in a
bad economy." Labour Economics 17 (2): 303-316.
Mas-Colell, Andreu, Michael D. Whinston, and Jerry R. Green. 1995. Microeconomic Theory,
New York: Oxford University Press.
Gosling, Patricia, and Bart Noordam. 2006. Mastering Your PhD. Springer-Verlag Berlin
Heidelberg.
Noordam, Bart, and Patricia Gosling. 2008. “Mastering Your Ph.D.: A Career in Management
Consulting.” Science Careers. DOI: 10.1126/science.caredit.a0800077.
Oreopoulos, Philip, Till von Wachter, and Andrew Heisz. 2012. "The short-and long-term career
effects of graduating in a recession." American Economic Journal: Applied Economics 4 (1):
1-29.
Oyer, Paul. 2006. “Initial labor market conditions and long-term outcomes for economists.” The
Journal of Economic Perspectives 20 (3): 143-160.
Pellens, Maikel, Sam Arts, and Reinhilde Veugelers. 2013. “Taste for science and job (mis)
match of industrial researchers.” KU Leuven Working Paper.
Ryoo, Jaewoo, and Sherwin Rosen. 2004. “The engineering labor market.” Journal of Political
Economy 112 (S1): 110-140.
Sauermann, Henry, and Michael Roach. 2012. "Science PhD career preferences: levels, changes,
and advisor encouragement." PLoS One 7 (5): e36307.
Sauermann, Henry, and Michael Roach. 2014. “Not all scientists pay to be scientists: PhDs’
preferences for publishing in industrial employment.” Research Policy 43 (1): 32-47.
Sauermann, Henry, and Paula Stephan. 2013. “Conflicting logics? A multidimensional view of
industrial and academic science.” Organization Science 24 (3): 889-909.
Stephan, Paula E. 1996. “The economics of science.” Journal of Economic Literature 24: 1199-
1235.
Stephan, Paula E., and Jennifer Ma. 2005. “The increased frequency and duration of the
postdoctorate career stage.” American Economic Review 92 (5): 71-75.

29
Stephan, Paula E. 2007. “Wrapping it up in a person: the mobility patterns of new PhDs.” In
Innovation Policy and the Economy, edited by Jaffe Adam, Josh Lerner and Scott Stern, MIT
Press.
Stephan, Paula E. 2012a. How Economics Shapes Science, Harvard University Press.
Stephan, Paula E. 2012b. “Research Efficiency: Perverse Incentives.” Nature 484: 29-31.
Stern, Scott. 2004. “Do scientists pay to be scientists?.” Management Science 50 (6): 835-853.
Tremblay, K., Basri, E., & Arnal, E. 2008. Tertiary education for the knowledge society (Vol. 1).
Paris: OECD.
Zizzo, John, D. 2010. "Experimenter demand effects in economic experiments.” Experimental
Economics 13 (1): 75-98.
30
Appendix A: Variables’ description
Table A1: Details on the variables' construction
<Insert Table A1 about here>
Appendix B: Additional robustness checks
In this appendix we briefly discuss the results of a number of robustness checks that we
performed. We typically adopt the same distinction between employment in highly-ranked and
low-ranked universities as in Table 2. However, analyses available upon request show that, by
using the classification adopted in Table 3, the results are invariant.
Excluding female PhDs from the sample
One reason for excluding female PhDs is that we do not observe whether women had
taken maternity leaves during their PhD program. Maternity leaves may allow women to
postpone their entry into the job market and self-select into cohorts of smaller size, which, in
turn, could favor the attainment of their most preferred positions25. In Table B1, the results for
the sample of male PhDs remain very similar to those presented in Table 2.
Table B1: Multinomial logit results for PhDs' employment attainments, after graduation.
We exclude female PhDs
<Insert Table B1 about here>
Notes: Coefficients are relative risk ratios. N=1,851. Robust standard errors (in parentheses) are clustered around
supervisors. ***, **,*: Significantly different from zero at the 1%, 5%, 10% confidence levels. The econometric
specification reported includes graduation-year and university-field fixed effects. We used the same controls as in
Table 2.
Controlling for the average quality of a PhD’s cohort
A possible concern is that the relationship between a PhD’s cohort size and her
occupational attainments is confounded by the average quality of the student’s cohort. To
25 In Sweden (but not in Switzerland) men, as well as women, are allowed to take parental leave. However, statistics
show that, at least for the period we observe, the percentage of parental leave days taken by men is much lower than
the percentage taken by women. For more information, please refer to http://rsa.revues.org/456.

31
address this worry, we include, as a control, the average publication count produced by the
student’s cohort. The results are in Table B2. The PhDs’ preference ordering does not vary
relative to the one illustrated in Table 2.
Table B2. Multinomial logit results for PhDs' employment attainments, after graduation.
We control for the average quality of PhD i's cohort, using the average cohort publication
count
<Insert Table B2 about here>
Notes: N=2,345. See Notes in B1.
Using an alternative measure of a PhD’s cohort size
A possible concern is that our definition of PhD cohort size misses some potential competitors of
PhD i for a given position j. As a robustness check, we now repeat the analysis in Table 2, using
a broader definition of a PhD’s cohort size. For EPFL PhDs in basic sciences, the newly defined
cohort size includes science PhDs who graduated from the entire population of Swiss
universities. In the case of EPFL engineering PhDs, their cohort size still includes EPFL and
ETH PhDs who graduated in the same field. This is because EPFL and ETH are the only Swiss
universities that offer PhD degrees in engineering. Regarding Chalmers, we redefine a PhD’s
cohort size by including PhD graduates from Lund and Uppsala universities, distinguishing
between basic sciences and engineering. These universities represent, respectively, the first and
third largest suppliers of science and engineering PhDs in Sweden. Data on Lund and Uppsala
universities’ PhD graduates was made available to us by their doctoral offices. Unfortunately,
reliable information on PhDs from the remaining Swedish universities was not available. The
results of this robustness check are reported in Table B3. As shown, variations in the newly
defined cohort size measure reveal the same PhD preference ordering over career outcomes as
the one revealed by variations in our original cohort size measure.

32
Table B3: Multinomial logit results for PhDs' employment attainments, after graduation.
We use a broader measure of a PhD’s cohort size
<Insert Table B3 about here>
Notes: N=2,345. See Notes in B1.
Controlling for the cohort size of PhDs who graduated in the years t-1 and t-2 in the same field
as PhD i
A possibility is that PhDs’ career choices are affected by their cohort size as well as by the size
of nearby cohorts. As a robustness check, in Table B4, we control for the cohort size of PhDs
who graduated in the years t-1 and t-2 in the same field as PhD i. With the inclusion of this
control, the magnitude of the odds ratios for PhD i’s cohort size decreases slightly, as expected,
but the preference ordering over career outcomes remains invariant.
Table B4: Multinomial logit results for PhDs' employment attainments, after graduation.
We include the cumulated number of PhDs who graduated in the two previous cohorts.
<Insert Table B4 about here>
Notes: N=2,345. See Notes in B1.
Controlling for the size of the PhD cohort outside of PhD i’s graduation country
A possibility mentioned earlier is that a PhD’s relevant cohort also includes PhDs from
other countries. As a robustness check, we include the count of PhDs who had graduated in the
US in the same year as i. Ideally, we would have also included the count of PhDs who graduated
in Europe. While this information is unavailable, we note that the majority of PhDs who move
abroad typically take postdoctoral positions in the US. The results are in Table B5 and show that
the preference ranking does not change.

33
Table B5: Multinomial logit results for PhDs' employment attainments, after graduation.
We control for the size of the PhD cohort outside of individual i’s graduation country. We
use the count of PhDs who had graduated in the US in the same year as i
<Insert Table B5 about here>
Notes: N=2,345. See Notes in B1.
Including all faculty positions in the category of employment in highly-ranked universities
Next, we include all PhDs’ faculty positions, after graduation, in the category of
employment in highly-ranked universities. These positions are covered by 83 students in our
sample. The results are presented in Table B6. The main results continue to hold. The relative
risk ratio for employment in highly-ranked universities relative to low-ranked universities is now
significant at the 5 percent confidence level, while before it was significant at the 1 percent level.
This outcome is not unexpected. In fact, the majority of the PhDs who were employed as
professors, after graduation, had joined low-ranked universities. These universities were
typically located in developing countries.
Table B6: Multinomial logit results for PhDs' employment attainments, after graduation.
We include faculty positions in the highly-ranked-university category
<Insert Table B6 about here>
Notes: N=2,345. See Notes in B1.
Breaking the low-ranked university category into positions at Chalmers and EPFL and into
positions in low-ranked universities
A possible concern is that post-graduation positions at Chalmers and EPFL are
intrinsically different from positions in low-ranked universities. For instance, it may be that
PhDs prefer to pursue postdocs in their graduation institution until positions in other employment
categories become available. To explore this venue, we divide the low-ranked-university
category into positions at Chalmers and EPFL and into positions in low-ranked universities. The
results are in Table B7. The base outcome is represented by low-ranked universities. When a
PhD’s cohort size is large, the likelihood of employment at EPFL or Chalmers and in highly-
ranked universities is lower, relative to employment in low-ranked universities. This result

34
suggests that PhDs may prefer temporary postdoc positions in their graduation university rather
than being employed in low-ranked universities. The impact of a PhD’s cohort size on the
likelihood of being employed in highly-ranked universities relative to being employed at EPFL
or Chalmers is negative, as expected, but it is not statistically significant. However, in
regressions available upon request, we show that once we exclude female students from the
sample, the negative impact becomes statistically significant. Taken together, these last results
suggest that female rather than male PhDs tend to use postdoc positions in their graduation
university as a means of exploring alternative employment possibilities in the future.
Table B7: Multinomial logit results for PhDs' employment attainments. We create two
separate categories for positions at Chalmers and EPFL and for positions in low-ranked
universities
<Insert Table B7 about here>
Notes: N=2,345. See Notes in B1.
Additional robustness checks
In Table B8, startups are classified into R&D and non-R&D-intensive. Accordingly, we
collected information about their publications and the US patents that they were granted as of
January 2014. We considered as R&D-intensive those startups that had at least one publication
or a patent. We then included R&D-intensive startups in the category of R&D-intensive firms
and the remaining startups in the category of non-R&D-intensive firms.
In Table B9, firms are categorized as R&D-intensive and non-R&D-intensive by
comparing them to other firms that belong to the same sector and size class. Using information
from the Million Dollar and Amadeus databases, we assigned our companies to the following
sectors: i) computer equipment, electronic, and other equipment; ii) transportation equipment; iii)
measuring, analyzing, and controlling instruments; iv) metal products; v) food and tobacco
products, and chemicals; vi) construction; vii) mining; viii) retail trade; ix) finance, insurance,

35
and real estate; x) wholesale trade and services26. With the new classification, the percentage of
R&D-intensive companies decreases from 10 to 9.
Table B10 shows regression results, having categorized a company as R&D-intensive if it
is in the last quartile of the distribution of similar-size companies, in terms of their patent or their
publication count. With this categorization, the percentage of R&D-intensive companies
increases from 10 to 14.
In Table B11, we modify the classification of universities into highly-ranked and low-
ranked. In fact, one possible concern is that our categorization of universities may reflect their
size rather than their quality, given that, as a criterion, we used their publication count. Thus, we
built an alternative classification using, this time, the Leiden ranking of universities, which
weighs measures of a university’s success with its size. Specifically, we classify a university as
highly-ranked if it is in the top 100 universities, for student i’s specialization field, according to
the Leiden ranking. In the case of research centers, because there are no official rankings
available, we computed for each of them the ratio of publications over authors. In this way, we
weight their publication count with a proxy of their size. We then consider as highly-ranked
research centers the ones in the last percentile of the distribution, in terms of the above-
mentioned ratio. This new classification is similar to the old one. Excluding post-graduation
positions at EPFL and Chalmers, the percentage of PhDs who are employed in low-ranked
universities (and research centers) is now 20, while before it was 17. Similarly, the percentage of
PhDs who are employed in highly-ranked universities (and research centers) is now 11, while
before it was 14.
Table B12 presents regression results derived from adopting a more detailed
categorization of university-field fixed effects. Specifically, we distinguish between physics,
chemistry, mathematics, life sciences, material sciences, mechanical engineering, electrical
engineering, micro engineering, and civil engineering.
26 We closely followed the Standard Industrial Classification (SIC). Hence, category i) corresponds to the SIC
categories D35-D36. Category ii) corresponds to D37. Category iii) corresponds to D38. Category iv) corresponds to
D32-D34. Category v) corresponds to D20-D31. Category vi) corresponds to C. Category vii) corresponds to B.
Category viii) corresponds to G. Category ix) corresponds to H. Category x) corresponds to F and I.

36
The results from these robustness checks are very similar to the ones in Table 2.
Table B8: Multinomial logit results for PhDs' employment attainments, after graduation.
We include R&D-intensive startups in the category of R&D-intensive firms and non-R&D-
intensive startups in the category of non-R&D-intensive firms
<Insert Table B8 about here>
Notes: N=2,345. See Notes in B1. R&D-intensive startups are the ones with at least one publication or patent.
Conversely, non-R&D-intensive startups are the ones without a publication or patent.
Table B9: Multinomial logit results for PhDs' employment attainments, after graduation.
We categorize firms into R&D-intensive and non-R&D-intensive by comparing them to the
other firms that belong to the same sector and size class
<Insert Table B9 about here>
Notes: N=2,345. See Notes in B1. A company c is classified as R&D-intensive if it is in the last percentile for its
patent count or its publication count. The comparison group is made of companies in the same sector and with a size
similar to c.
Table B10: Multinomial logit results for PhDs' employment attainments, after graduation.
We categorize a company as R&D-intensive if it is in the last quartile of the distribution of
companies with a similar size, in terms of patent or publication counts
<Insert Table B10 about here>
Notes: See Notes in B1.
Table B11: Multinomial logit results for PhDs' employment attainments, after graduation.
We modify the classification of highly-ranked universities
<Insert Table B11 about here>
Notes: N=2,345. See Notes in B1. We classify a university as highly-ranked if it is in the top 100 universities, for
PhD i’s specialization field, according to the Leiden ranking. We classify research centers as highly-ranked based on
their ratio of publications over authors. Specifically, we consider as highly-ranked research centers the ones in the
last percentile for their above-mentioned ratio.

37
Table B12: Multinomial logit results for PhDs' employment attainments, after graduation.
We include more detailed university-field fixed effects
<Insert Table B12 about here>
Notes: N=2,345. See Notes in B1. We consider the following fields: physics, chemistry, mathematics, life sciences,
mechanical engineering, electrical engineering, micro engineering, civil engineering, and material science.

38
Table 1: Descriptive statistics
Variable Mean Std.Dev. Min Max
PhD cohort size 232.28 70.74 63.00 338.00
Employment conditions at graduation
GDP growth, at graduation 1.90 1.01 0.00 3.00
Net supply of postdoc positions in the US 5,826.62 9,283.69 -2,841.00 18,222.00
# Professors in graduation's country 108.74 41.97 46.00 184.00
# Graduation country's EPO patent
applications 3,345.00 605.23 2,316.00 4,170.00
US PhD cohort size 9325.42 3525.99 5082 15572
PhD characteristics
Domestic student (reference category) 0.56 0.50 0.00 1.00
EU-15 nationality 0.27 0.44 0.00 1.00
Non-EU-15 nationality 0.17 0.38 0.00 1.00
Age 30.51 2.88 25.00 51.00
Female 0.21 0.41 0.00 1.00
# Publications during PhD 6.59 6.10 0.00 50.00
Involved in applied projects during PhD 0.17 0.38 0.00 1.00
Worked prior to PhD 0.13 0.34 0.00 1.00
Supervisor characteristics
Pre-sample publications 32.88 29.05 0.00 209.00
Patenting activity 0.37 0.69 0.00 2.00
With prior working experience in industry 0.33 0.47 0.00 1.00
Involved in EU projects with industrial
partners 0.19 0.39 0.00 1.00
Instruments
PhD cohort size at predicted entry year 188.81 56.73 47.00 338.00
US PhD cohort size at predicted entry year 8,411.96 3,087.93 4,894.00 14,601.00
Note: N=2,345.

39
Table 2: Multinomial logit results for PhDs' employment attainments, after graduation
I II III IV V VI
Low-ranked
universities
or research
centers
Highly-ranked
universities or
research centers
Non-R&D-intensive
firms R&D-intensive firms Technology startups
Administration,
schools, teaching
colleges
Main variable
BA
SE
OU
TC
OM
E
PhD cohort size (rescaled dividing by 10) 0.888*** (0.039) 0.977 (0.037) 0.849*** (0.039) 1.001 (0.066) 0.982 (0.047)
Employment conditions at graduation
GDP growth, at graduation 1.099 (0.207) 1.126 (0.151) 1.601*** (0.291) 1.891** (0.611) 1.042 (0.214)
Net supply of postdoc positions in the US 1.000 (0.000) 1.000 (0.000) 1.000 (0.000) 1.000 (0.000) 1.000 (0.000)
# Professors in graduation's country 1.029** (0.014) 1.017 (0.011) 1.021 (0.014) 1.003 (0.019) 1.004 (0.016)
# Graduation country's EPO patent
applications 1.000 (0.001) 1.000 (0.001) 1.001 (0.001) 0.999 (0.001) 1.002 (0.001)
PhD characteristics
EU-15 nationality 0.821 (0.149) 0.802 (0.109) 0.952 (0.205) 0.786 (0.174) 0.615** (0.148)
Non-EU-15 nationality 0.899 (0.179) 0.496*** (0.095) 0.745 (0.174) 0.452** (0.152) 0.370*** (0.111)
Age 0.923** (0.033) 0.913*** (0.020) 0.965 (0.027) 0.967 (0.035) 1.032 (0.027)
Female 0.859 (0.139) 0.610*** (0.093) 0.857 (0.175) 0.380*** (0.125) 1.422* (0.271)
# Publications during PhD (in natural log) 1.214* (0.131) 0.466*** (0.036) 0.612*** (0.065) 0.731*** (0.087) 0.533*** (0.067)
Involved in applied projects during the PhD 1.121 (0.278) 2.992*** (0.494) 3.836*** (0.767) 3.191*** (0.819) 1.747* (0.512)
Worked prior to beginning a PhD 0.603* (0.163) 2.228*** (0.373) 1.833** (0.453) 1.434 (0.401) 0.836 (0.265)
Supervisor characteristics
Pre-sample publications (in natural log) 1.093 (0.117) 1.093 (0.078) 1.429*** (0.146) 1.123 (0.143) 1.018 (0.119)
Patenting activity 0.943 (0.103) 0.940 (0.090) 1.257* (0.148) 1.075 (0.145) 0.895 (0.135)
With prior working experience in industry 1.036 (0.199) 1.491*** (0.230) 1.525** (0.306) 1.260 (0.281) 0.812 (0.182)
Involved in EU projects with industrial
partners 0.995 (0.205) 0.732* (0.126) 0.993 (0.213) 1.104 (0.254) 1.239 (0.268)
Graduation-year fixed effects YES YES
YES
YES
YES
University-field fixed effects YES YES
YES
YES
YES

40
Notes: Coefficients are relative risk ratios. N=2,345. Robust standard errors (in parentheses) are clustered around supervisors. ***, **,*: Significantly different
from zero at the 1%, 5%, 10% confidence levels. When changing base outcome, the corresponding relative risk ratios can be obtained as follows:
exp(βj,p|q)=exp(βj,p|r)/exp(βj,q|r), where p, q, and r are employment categories and p≠r.
Table 3: Multinomial logit results for PhDs' employment attainments, after graduation. We include in the highly-ranked-
institutions category Chalmers PhDs who were hired as faculty in their own university and EPFL PhDs who had stayed at
their own affiliation, but had moved to a different research group than their supervisor’s
I II III IV V VI
Low-ranked
universities
or research
centers
Highly-ranked
universities or
research centers
Non-R&D-
intensive firms
R&D-intensive
firms
Technology
startups
Administration,
schools,
teaching
colleges
PhD cohort size
(rescaled dividing by 10)
BASE
OUTCOME 0.907** 0.979 0.851*** 1.003 0.985
(0.036) (0.037) (0.039) (0.066) (0.048)
Other controls
YES YES YES YES YES
Notes: See notes in Table2. We used the same controls as in Table 2.
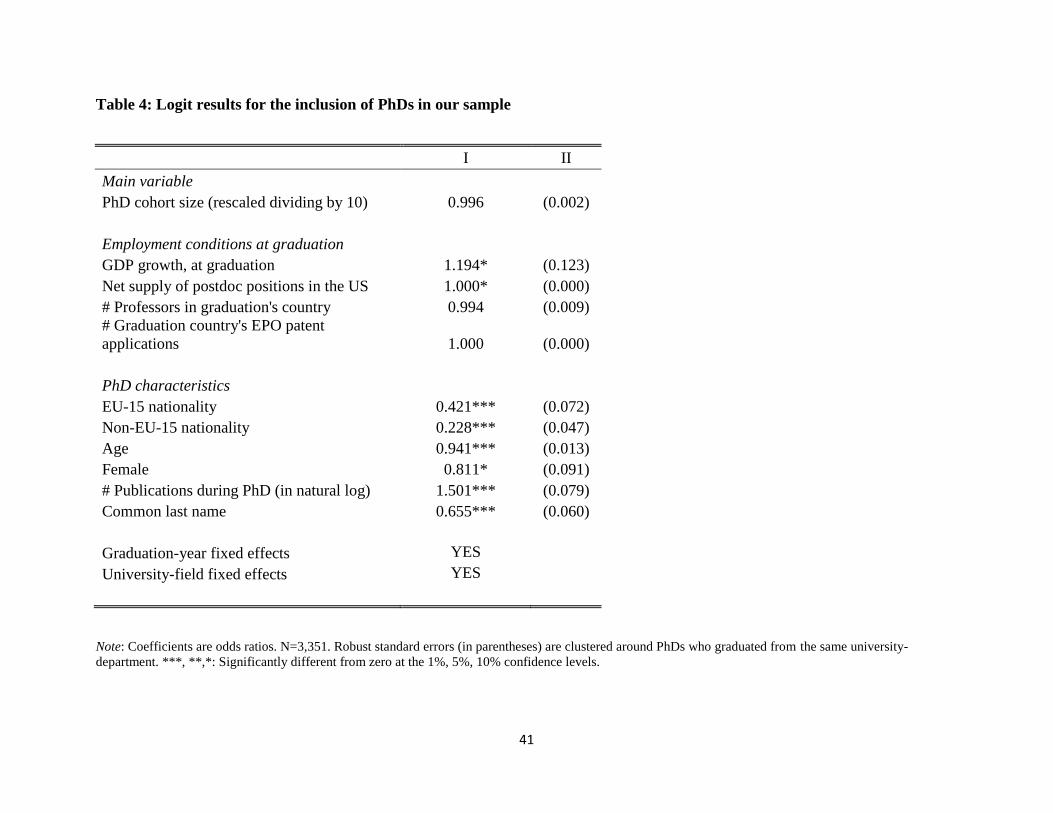
41
Table 4: Logit results for the inclusion of PhDs in our sample
I II
Main variable
PhD cohort size (rescaled dividing by 10) 0.996 (0.002)
Employment conditions at graduation
GDP growth, at graduation 1.194* (0.123)
Net supply of postdoc positions in the US 1.000* (0.000)
# Professors in graduation's country 0.994 (0.009)
# Graduation country's EPO patent
applications 1.000 (0.000)
PhD characteristics
EU-15 nationality 0.421*** (0.072)
Non-EU-15 nationality 0.228*** (0.047)
Age 0.941*** (0.013)
Female 0.811* (0.091)
# Publications during PhD (in natural log) 1.501*** (0.079)
Common last name 0.655*** (0.060)
Graduation-year fixed effects YES
University-field fixed effects YES
Note: Coefficients are odds ratios. N=3,351. Robust standard errors (in parentheses) are clustered around PhDs who graduated from the same university-
department. ***, **,*: Significantly different from zero at the 1%, 5%, 10% confidence levels.

42
Table 5: Reduced form and IV estimates for PhDs' employment attainments
Specification
I II III
OLS OLS (Reduced Form) IV
First-stage Coefficients
US PhD cohort size, at predicted entry year
0.006*** (0.001)
(US PhD cohort size, at predicted entry
year)^2
-0.000*** (0.000)
(US PhD cohort size, at predicted entry
year)^3
0.000*** (0.000)
PhD cohort size, at predicted entry year
-0.085*** (0.024)
(PhD cohort size, at predicted entry year)^2
0.000*** (0.000)
(PhD cohort size, at predicted entry year)^3
-0.000* (0.000)
Main variable
PhD cohort size (rescaled dividing by 10) -0.021*** (0.005) -0.038*** (0.010) -0.040** (0.020)
Employment conditions at graduation
GDP growth, at graduation 0.018 (0.018) 0.001 (0.039) 0.018 (0.018)
Net supply of postdoc positions in the US -0.000 (0.000) -0.000** (0.000) -0.000 (0.000)
# Professors in graduation's country 0.003* (0.001) 0.008*** (0.003) 0.006* (0.003)
# Graduation country's EPO patent
applications 0.000* (0.000) -0.000 (0.000) 0.000 (0.000)
PhD characteristics
EU-15 nationality -0.000 (0.024) -0.008 (0.055) -0.002 (0.024)
Non-EU-15 nationality 0.027 (0.027) 0.039 (0.060) 0.029 (0.028)
Age -0.004 (0.003) -0.015 (0.009) -0.004 (0.003)
Female 0.004 (0.021) -0.033 (0.042) 0.004 (0.021)
# Publications during PhD (in natural log) 0.035*** (0.011) 0.030 (0.022) 0.035*** (0.011)
Involved in applied projects during the PhD 0.041* (0.023) 0.017 (0.048) 0.041* (0.022)
Worked prior to beginning a PhD -0.024 (0.028) -0.089* (0.048) -0.025 (0.027)

43
Supervisor characteristics
Pre-sample publications (in natural log) 0.024** (0.011) 0.014 (0.021) 0.025** (0.011)
Patenting activity 0.018 (0.015) 0.100*** (0.028) 0.019 (0.015)
With prior working experience in industry 0.017 (0.024) -0.061 (0.040) 0.011 (0.024)
Involved in EU projects with industrial
partners 0.009 (0.026) 0.018 (0.044) 0.013 (0.026)
Graduation-year fixed effects YES YES YES
University-field fixed effects YES YES YES
# Observations 2,345 568 2,345
R-Squared 0.064 0.097 0.058
Notes: The dependent variable is a dummy that equals 1 if a PhD is employed in a highly-ranked university or in an R&D-intensive firm. In the IV model, we
instrument the PhDs' cohort size with cohort size measures at their predicted entry year in the PhD program, based on the university-field mean elapsed time
between the students' master’s degree and their PhD start year. As instruments we use the cohort size of US PhDs (including non-linear terms) and our cohort
size variable measured in the PhDs' predicted start year (including non-linear terms). Robust standard errors (in parentheses) are clustered around the PhDs'
supervisor. ***, **,*: Significantly different from zero at the 1%, 5%, 10% confidence levels.

44
Table 6: Multinomial logit results for PhDs' employment attainments, after graduation. We report results for PhDs in basic
sciences and engineering, separately
BASIC SCIENCES
I II III IV V VI
Low-ranked
universities or
research centers
Highly-ranked
universities or
research centers
Non-R&D-
intensive firms
R&D-intensive
firms
Technology
startups
Public
administration,
schools, teaching
colleges
PhD cohort size
(rescaled dividing by 10) BASE OUTCOME
0.839*** 0.982 0.779*** 1.083 0.893
(0.054) (0.060) (0.060) (0.143) (0.078)
Other controls YES YES YES YES YES
ENGINEERING
VII VIII IX X XI XII
Low-ranked
universities or
research centers
Highly-ranked
universities or
research centers
Non-R&D-
intensive firms
R&D-intensive
firms
Technology
startups
Public
administration,
schools, teaching
colleges
PhD cohort size
(rescaled dividing by 10) BASE OUTCOME
0.787** 1.007 0.781*** 1.141 1.118
(0.094) (0.068) (0.074) (0.191) (0.130)
Other controls YES YES YES YES YES
Notes: See notes in Table 2. N basic science: 993. N engineering: 1,352.

45
Appendix A: Variables’ description
Table A1: Details on the variables' construction
Variable Description Source
PhD cohort size
# of PhDs who graduated in the same year and in the same field as PhD i. These
students were enrolled with either EPFL or ETH, if i is from EPFL, and with
Chalmers or KTH, if i is from Chalmers
Universities' websites and
countries' Statistical Offices
Employment conditions at graduation
GDP growth at graduation
Categorical variable assuming values that increase with the GDP growth of PhD i's
graduation country, with 0 indicating a recession period and 3 indicating an high-
growth period. For Sweden, the variable is =0 in the years 2008-2009, =1 in 2001, =2
in 2002, 2003, 2005, and 2007, =3 in 1999, 2000, 2004, and 2006. For Switzerland,
the variable is =0 in 2009, =1 in 2002 and 2003, =2 in 1999, 2001, 2004, 2005, and
2008, =3 in 2000, 2006, and 2007
World Bank
Net supply of postdoc positions in
the US
Difference between the # of postdocs hired, during i's graduation year, by US
research institutions and the # of US students who, in that year, obtained their PhD in
the same field as i
NSF (Survey of Graduate
Students and Postdoctorates in
Science and Engineering)
# Professors in graduation's
country
# of professors affiliated with EPFL or Chalmers, during PhD i's graduation year, for
the field in which i is specialized
Universities' websites and
countries' Statistical Offices
# Graduation country's EPO
patent applications
# of patent applications that Sweden and Switzerland had filed at the European Patent
Office during i's graduation year OECD
US PhD cohort size # of US PhDs who graduated in the same year and in the same field as PhD i
NSF (Survey of Graduate
Students and Postdoctorates in
Science and Engineering)
Employment conditions at predicted year of entry
PhD cohort size # Swedish or Swiss PhDs (by field) who graduated in PhD i's predicted year of entry Universities' websites and
countries' Statistical Offices
US PhD cohort size # of US PhDs (by field) who graduated in PhD i's predicted year of entry
NSF (Survey of Graduate
Students and Postdoctorates in
Science and Engineering)

46
Table A1: Details on the variables' construction (continued)
Variable Description Source
PhD characteristics
Domestic student (reference
category)
=1 if a PhD obtained her master's degree in Switzerland (for EPFL PhDs) or in
Sweden (for Chalmers PhDs)
PhDs' CVs (including those
reported in the PhDs'
dissertations)
EU-15 nationality =1 if a PhD obtained her master's degree from a EU-15 country PhDs' CVs
Non-EU-15 nationality =1 if a PhD obtained her master's degree from a foreign country that is not part of
the EU-15 PhDs' CVs
Age PhD age at graduation PhDs' CVs
Female =1 if a PhD is female PhDs' CVs
# Publications during PhD PhD’s publication count Scopus
Involved in applied projects
during PhD
=1 if a PhD was granted at least one patent, had published articles with industrial
partners, or had worked with a company during her PhD
Thomson Reuters, Scopus,
PhDs' CVs
Worked prior to PhD =1 if a PhD worked prior to her PhD PhDs' CVs
Supervisor characteristics
Pre-sample publications Supervisor's # of articles published in the 5 years prior to individual i's arrival Scopus
Patenting activity
=0 if a supervisor was not granted any patent in the 5 years prior to i's arrival, =1
if she was granted a # of patents > than 0 and < than 3, and =2 if she was granted
more than 2 patents
Thomson Reuters
With prior working experience
in industry =1 if a supervisor had worked in industry prior to her current appointment
Supervisors' CVs (available
online)
Involved in EU projects with
industrial partners
=1 if a supervisor was involved in European projects with industrial partners in
the 5 years prior to i's arrival
European Commission
CORDIS website
Instruments
PhD cohort size at predicted
entry year
# of PhDs who graduated in the predicted entry year and in the same field as PhD
i. These students were enrolled with either EPFL or ETH, if i is from EPFL, and
with Chalmers or KTH, if i is from Chalmers
Universities' websites and
countries' Statistical Offices
US PhD cohort size at predicted
entry year
# of US PhDs who graduated in the predicted entry year and in the same field as
PhD i
NSF (Survey of Graduate
Students and Postdoctorates in
Science and Engineering)
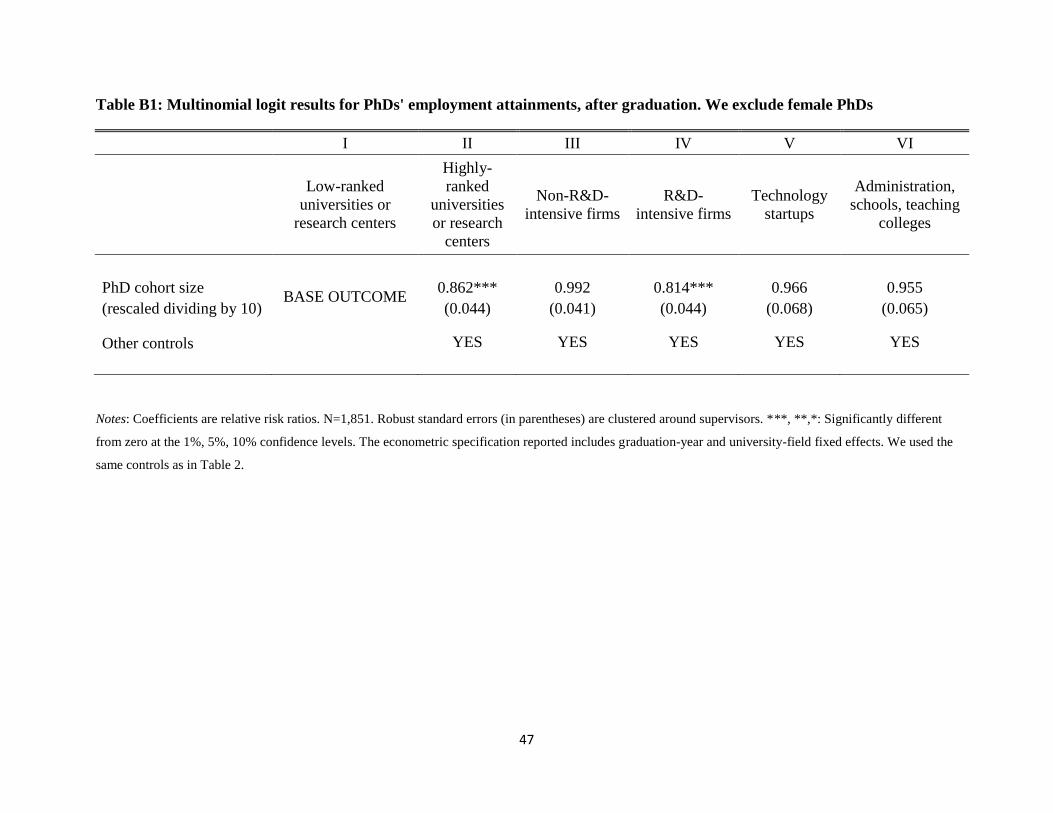
47
Table B1: Multinomial logit results for PhDs' employment attainments, after graduation. We exclude female PhDs
I II III IV V VI
Low-ranked
universities or
research centers
Highly-
ranked
universities
or research
centers
Non-R&D-
intensive firms
R&D-
intensive firms
Technology
startups
Administration,
schools, teaching
colleges
PhD cohort size
BASE OUTCOME 0.862*** 0.992 0.814*** 0.966 0.955
(rescaled dividing by 10) (0.044) (0.041) (0.044) (0.068) (0.065)
Other controls
YES YES YES YES YES
Notes: Coefficients are relative risk ratios. N=1,851. Robust standard errors (in parentheses) are clustered around supervisors. ***, **,*: Significantly different
from zero at the 1%, 5%, 10% confidence levels. The econometric specification reported includes graduation-year and university-field fixed effects. We used the
same controls as in Table 2.
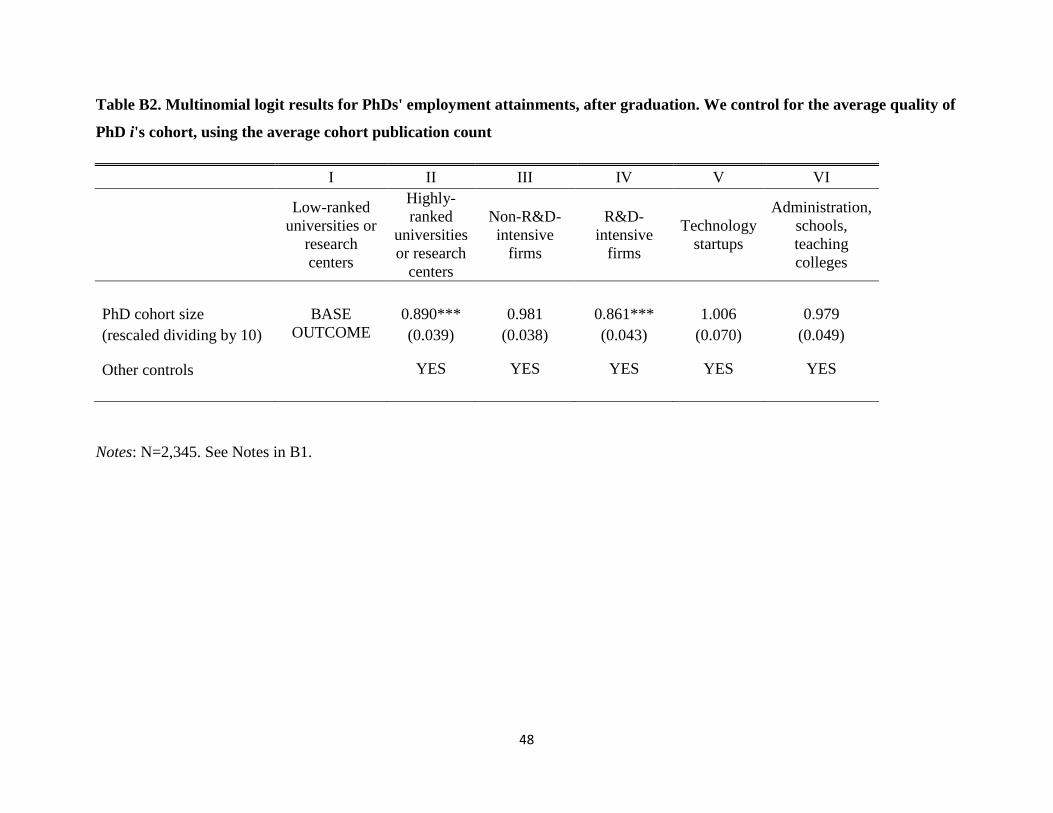
48
Table B2. Multinomial logit results for PhDs' employment attainments, after graduation. We control for the average quality of
PhD i's cohort, using the average cohort publication count
I II III IV V VI
Low-ranked
universities or
research
centers
Highly-
ranked
universities
or research
centers
Non-R&D-
intensive
firms
R&D-
intensive
firms
Technology
startups
Administration,
schools,
teaching
colleges
PhD cohort size BASE
OUTCOME
0.890*** 0.981 0.861*** 1.006 0.979
(rescaled dividing by 10) (0.039) (0.038) (0.043) (0.070) (0.049)
Other controls
YES YES YES YES YES
Notes: N=2,345. See Notes in B1.
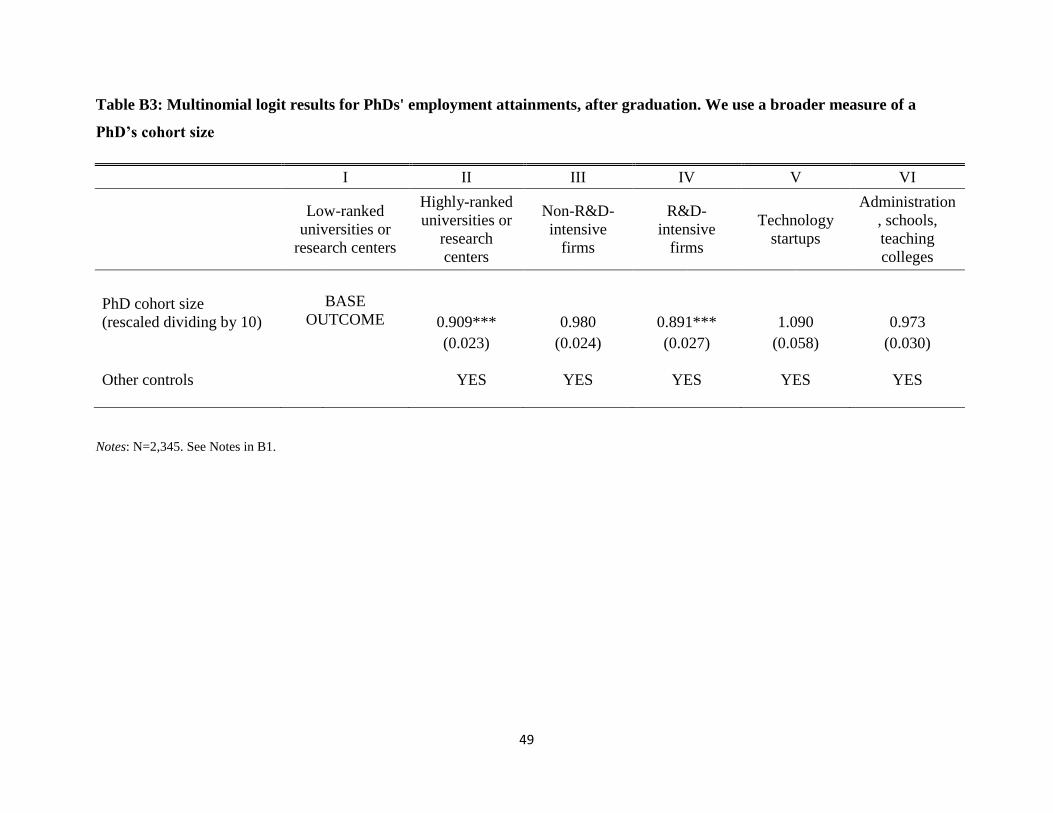
49
Table B3: Multinomial logit results for PhDs' employment attainments, after graduation. We use a broader measure of a
PhD’s cohort size
I II III IV V VI
Low-ranked
universities or
research centers
Highly-ranked
universities or
research
centers
Non-R&D-
intensive
firms
R&D-
intensive
firms
Technology
startups
Administration
, schools,
teaching
colleges
PhD cohort size
(rescaled dividing by 10)
BASE
OUTCOME 0.909*** 0.980 0.891*** 1.090 0.973
(0.023) (0.024) (0.027) (0.058) (0.030)
Other controls
YES YES YES YES YES
Notes: N=2,345. See Notes in B1.
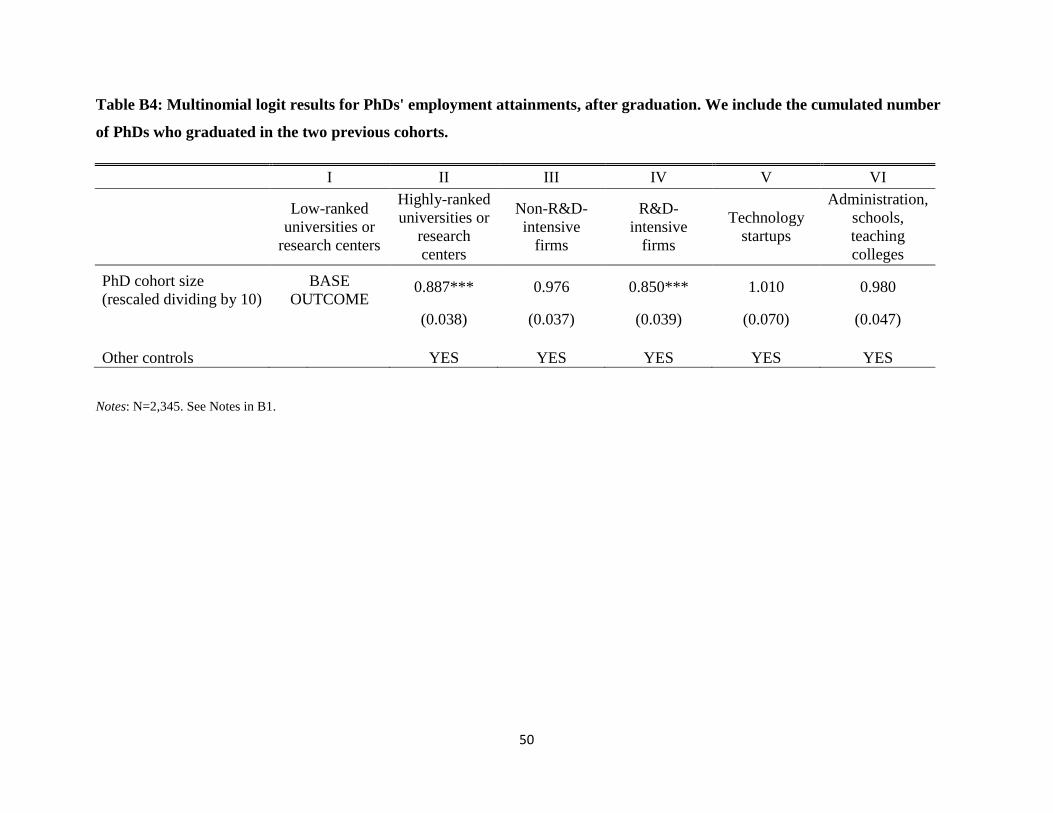
50
Table B4: Multinomial logit results for PhDs' employment attainments, after graduation. We include the cumulated number
of PhDs who graduated in the two previous cohorts.
I II III IV V VI
Low-ranked
universities or
research centers
Highly-ranked
universities or
research
centers
Non-R&D-
intensive
firms
R&D-
intensive
firms
Technology
startups
Administration,
schools,
teaching
colleges
PhD cohort size
(rescaled dividing by 10)
BASE
OUTCOME 0.887*** 0.976 0.850*** 1.010 0.980
(0.038) (0.037) (0.039) (0.070) (0.047)
Other controls
YES
YES
YES
YES
YES
Notes: N=2,345. See Notes in B1.

51
Table B5: Multinomial logit results for PhDs' employment attainments, after graduation. We control for the size of the PhD
cohort outside of individual i’s graduation country. We use the count of PhDs who had graduated in the US in the same year
as i
I II III IV V VI
Low-ranked
universities or
research
centers
Highly-
ranked
universities
or research
centers
Non-R&D-
intensive
firms
R&D-
intensive
firms
Technology
startups
Administration,
schools,
teaching
colleges
PhD cohort size BASE
OUTCOME
0.892*** 0.975 0.829*** 1.034 0.983
(rescaled dividing by 10) (0.039) (0.037) (0.040) (0.071) (0.048)
Other controls
YES YES YES YES YES
Notes: N=2,345. See Notes in B1.

52
Table B6: Multinomial logit results for PhDs' employment attainments, after graduation. We include faculty positions in the
highly-ranked-university category
I II III IV V VI
Low-ranked
universities or
research
centers(excluding
faculty positions)
Highly-
ranked
universities
or research
centers
(including
faculty
positions)
Non-R&D-
intensive
firms
R&D-
intensive
firms
Technology
startups
Administration,
schools,
teaching
colleges
PhD cohort size
(rescaled dividing by 10)
BASE
OUTCOME 0.914** 0.981 0.847*** 1.019 0.986
(0.034) (0.037) (0.038) (0.068) (0.048)
Other controls
YES YES YES YES YES
Notes: N=2,345. See Notes in B1.
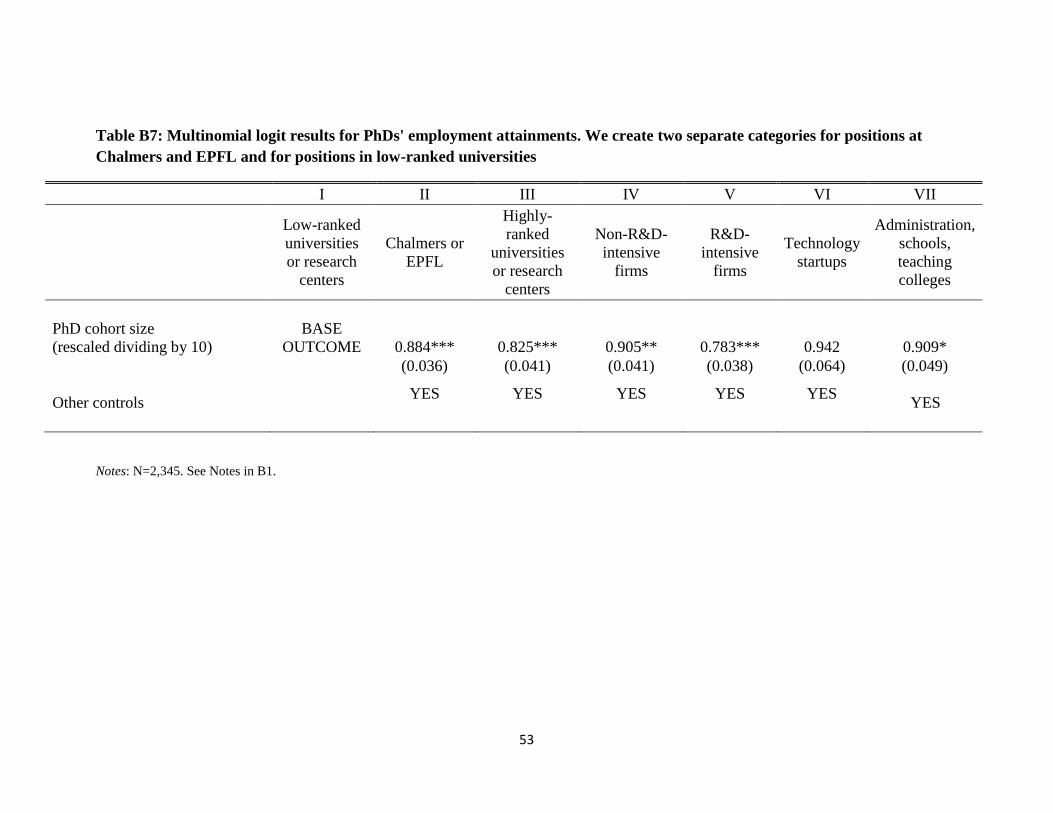
53
Table B7: Multinomial logit results for PhDs' employment attainments. We create two separate categories for positions at
Chalmers and EPFL and for positions in low-ranked universities
I II III IV V VI VII
Low-ranked
universities
or research
centers
Chalmers or
EPFL
Highly-
ranked
universities
or research
centers
Non-R&D-
intensive
firms
R&D-
intensive
firms
Technology
startups
Administration,
schools,
teaching
colleges
PhD cohort size
(rescaled dividing by 10)
BASE
OUTCOME 0.884*** 0.825*** 0.905** 0.783*** 0.942 0.909*
(0.036) (0.041) (0.041) (0.038) (0.064) (0.049)
Other controls
YES YES YES YES YES YES
Notes: N=2,345. See Notes in B1.

54
Table B8: Multinomial logit results for PhDs' employment attainments, after graduation. We include R&D-intensive startups
in the category of R&D-intensive firms and non-R&D-intensive startups in the category of non-R&D-intensive firms
I II III IV V
Low-ranked
universities or
research centers
Highly-ranked
universities or
research centers
Non-R&D-
intensive firms
and technology
startups neither
patenting, nor
publishing
R&D-intensive
firms and
technology
startups active in
patenting and/or
publishing
Administration,
schools,
teaching
colleges
PhD cohort size
(rescaled dividing by 10)
BASE
OUTCOME 0.888*** 0.989 0.872*** 0.983
(0.039) (0.035) (0.037) (0.048)
Other controls YES YES YES YES
Notes: N=2,345. See Notes in B1. R&D-intensive startups are the ones with at least one publication or patent. Conversely, non-R&D-intensive startups are the
ones without a publication or patent.
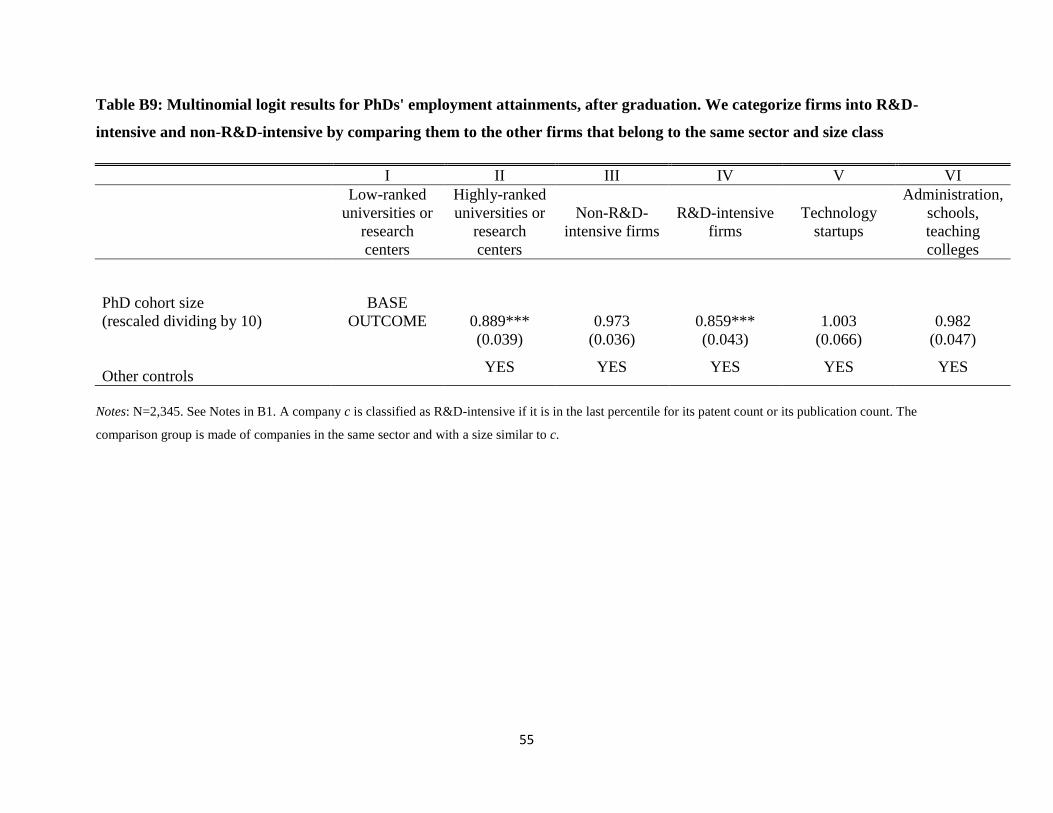
55
Table B9: Multinomial logit results for PhDs' employment attainments, after graduation. We categorize firms into R&D-
intensive and non-R&D-intensive by comparing them to the other firms that belong to the same sector and size class
I II III IV V VI
Low-ranked
universities or
research
centers
Highly-ranked
universities or
research
centers
Non-R&D-
intensive firms
R&D-intensive
firms
Technology
startups
Administration,
schools,
teaching
colleges
PhD cohort size
(rescaled dividing by 10)
BASE
OUTCOME 0.889*** 0.973 0.859*** 1.003 0.982
(0.039) (0.036) (0.043) (0.066) (0.047)
Other controls
YES YES YES YES YES
Notes: N=2,345. See Notes in B1. A company c is classified as R&D-intensive if it is in the last percentile for its patent count or its publication count. The
comparison group is made of companies in the same sector and with a size similar to c.

56
Table B10: Multinomial logit results for PhDs' employment attainments, after graduation. We categorize a company as R&D-
intensive if it is in the last quartile of the distribution of companies with a similar size, in terms of patent or publication counts
I II III IV V VI
Low-ranked
universities or
research
centers
Highly-ranked
universities or
research
centers
Non-R&D-
intensive firms
R&D-intensive
firms
Technology
startups
Administration,
schools,
teaching
colleges
PhD cohort size
(rescaled dividing by 10)
BASE
OUTCOME 0.889*** 0.980 0.886*** 1.002 0.982
(0.039) (0.038) (0.036) (0.065) (0.047)
Other controls YES YES YES YES YES
Notes: See Notes in B1.

57
Table B11: Multinomial logit results for PhDs' employment attainments, after graduation. We modify the classification of
highly-ranked universities
I II III IV V VI
Low-ranked
universities or
research
centers
Highly-ranked
universities or
research
centers
Non-R&D-
intensive firms
R&D-intensive
firms
Technology
startups
Administration,
schools,
teaching
colleges
PhD cohort size
(rescaled dividing by 10)
BASE
OUTCOME 0.907** 0.989 0.859*** 1.013 0.994
(0.043) (0.037) (0.038) (0.066) (0.048)
Other controls YES YES YES YES YES
Notes: N=2,345. See Notes in B1. We classify a university as highly-ranked if it is in the top 100 universities, for PhD i’s specialization field, according to the
Leiden ranking. We classify research centers as highly-ranked based on their ratio of publications over authors. Specifically, we consider as highly-ranked
research centers the ones in the last percentile for their above-mentioned ratio.

58
Table B12: Multinomial logit results for PhDs' employment attainments, after graduation. We include more detailed
university-field fixed effects
I II III IV V VI
Low-ranked
universities or
research
centers
Highly-ranked
universities or
research
centers
Non-R&D-
intensive firms
R&D-intensive
firms
Technology
startups
Administration,
schools,
teaching
colleges
PhD cohort size
(rescaled dividing by 10)
BASE
OUTCOME 0.886*** 0.965 0.842*** 1.027 0.981
(0.039) (0.036) (0.039) (0.065) (0.049)
Other controls YES YES YES YES YES
Notes: N=2,345. See Notes in B1. We consider the following fields: physics, chemistry, mathematics, life sciences, mechanical engineering, electrical
engineering, micro engineering, civil engineering, and material science.

59
Figure 1: Distribution of PhDs’ first employment after graduation, by institution
Fre
qu
enci
es
Employment categories
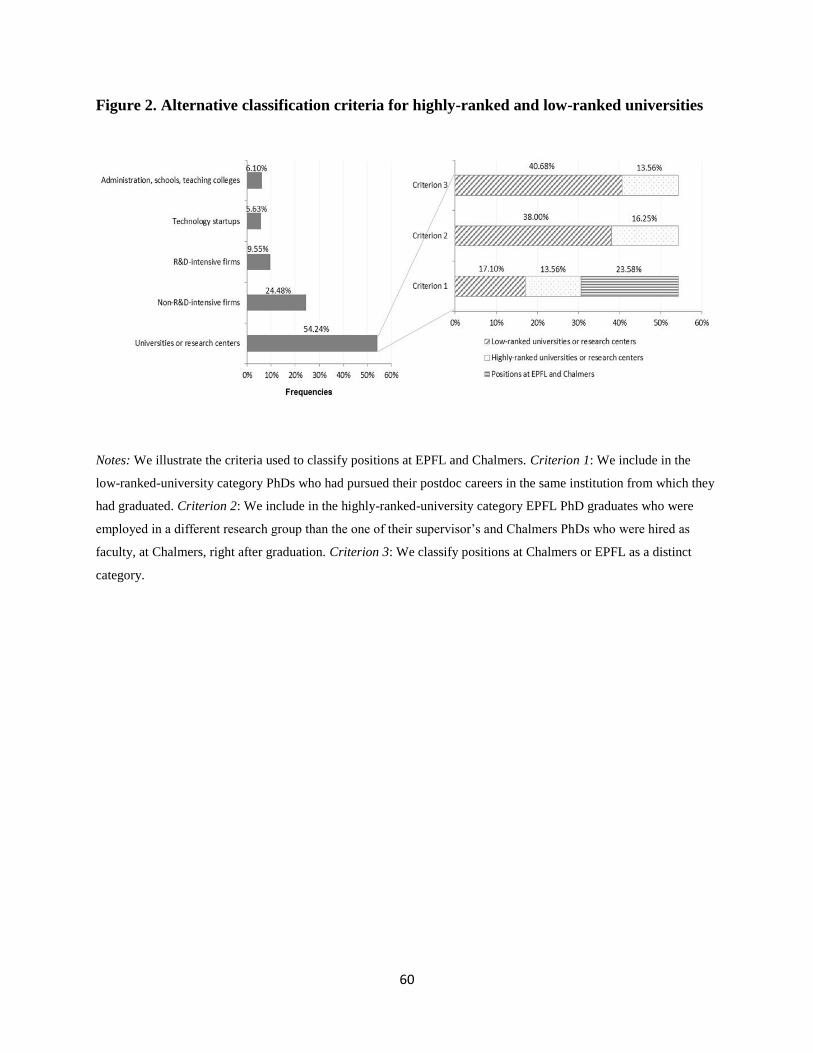
60
Figure 2. Alternative classification criteria for highly-ranked and low-ranked universities
Notes: We illustrate the criteria used to classify positions at EPFL and Chalmers. Criterion 1: We include in the
low-ranked-university category PhDs who had pursued their postdoc careers in the same institution from which they
had graduated. Criterion 2: We include in the highly-ranked-university category EPFL PhD graduates who were
employed in a different research group than the one of their supervisor’s and Chalmers PhDs who were hired as
faculty, at Chalmers, right after graduation. Criterion 3: We classify positions at Chalmers or EPFL as a distinct
category.
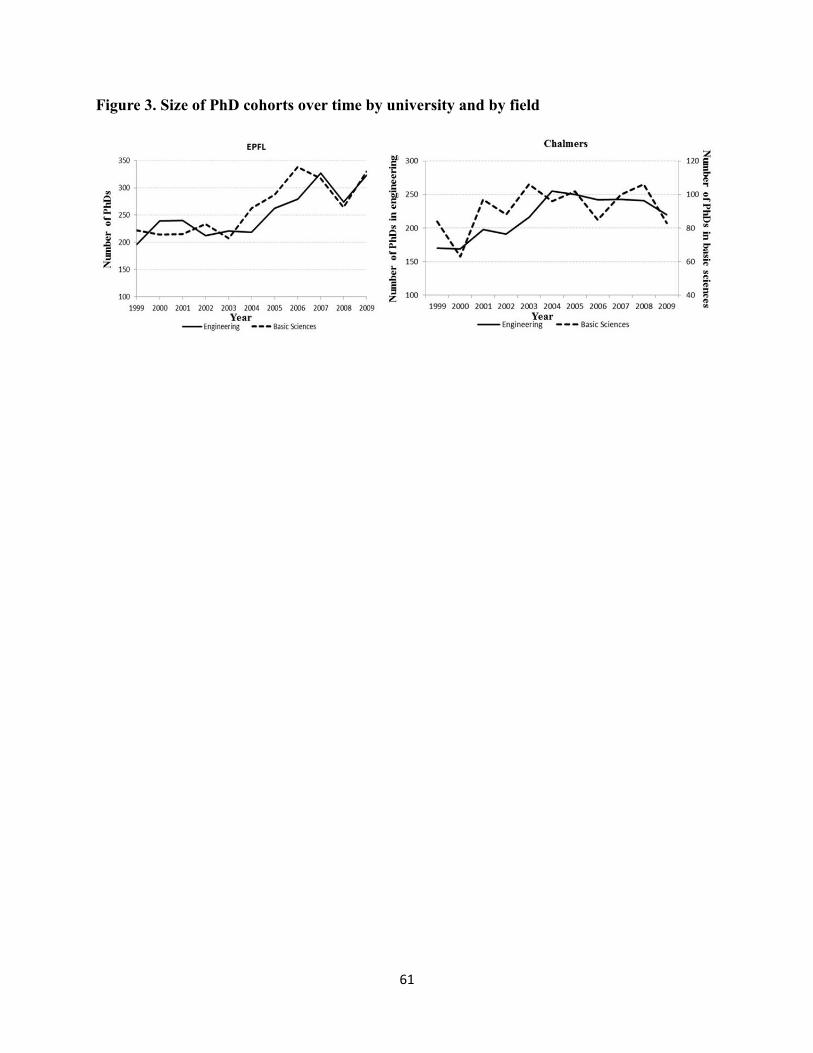
61
Figure 3. Size of PhD cohorts over time by university and by field

62
Figure 4: Predicted probabilities for each employment category
Pre
dic
ted
pro
ba
bil
ity
PhD cohort size (divided by 10)

63
Figure 5: Predicted probability of attaining positions in the ideal employment categories
relative to the other categories, by field
PhD cohort size (divided by 10)
Pre
dic
ted
pro
ba
bil
ity