a retrospective analysis of in-patient …
TRANSCRIPT

A RETROSPECTIVE ANALYSIS OF IN-PATIENT
TEMPOROMANDIBULAR DISORDERS
By
Hassan S.M Hazazi
A Dissertation Submitted In Partial Fulfillment of the Requirements for
The Degree of Doctor of Philosophy in Biomedical Informatics
Department of Health Informatics School of Health Related Professions
Rutgers, the State University of New Jersey
September 2014
Final Dissertation Approval Form
BY
Dissertation Committee:
Approved by the Dissertation Committee: _____________________________________ Date ___________ _____________________________________ Date ___________ ____________________________________ Date ___________ _____________________________________ Date ___________ _____________________________________ Date ___________ _____________________________________ Date ___________

ABSTRACT
Disorders of Temporomandibular Joint (including capsulitis of TMJ, degenerative arthritis, internal derangement, dislocation, myofacial pain, ankyloses, headache, sleep disorders, trigeminal neuralgia, Cranio-maxillofacial trauma, and other related TMJ diseases) are some of the leading causes of chronic pain.
The serious personal consequences of severe, constant facial, head and neck pain from these disorders make these problems a major social issue. One of the greatest challenges facing health care systems internationally is meeting the health needs of their populations with the available resources especially for In-patient.
This study explored the association of temporomandibular joint complexity with socio-demographic variables, multi-disciplinary management of the TMD during patient hospitalization and selected co-morbidities characteristics based on the 2003 to 2010 nationwide inpatient sample (NIS) of the health care cost and utilization project (HCUP) provided by the agency for health care research and quality (AHRQ) data for TMD In-patients between 2 and 97 years old.
There is a strong positive correlation between temporomandibular disorders and hypertension and a weaker but nonetheless positive correlation between temporomandibular disorders and diabetes, temporomandibular disorders and depression, and temporomandibular disorders and weight.
The finding of this study support the hypotheses that Socio-demographic factors (age, race, disposition of patient, primary expected payer, patient location, gender, source, length of stay, and median income) affect incidence of TMD and hospital stays, Co-morbidities exist that are significantly related to TMD incidence and hospitalization costs.
Results of eight years nationwide epidemiological estimates of hospitalizations attributed to temporomandibular joint disorders in the United States demonstrate changes in socio-demonstrate and hospital related factors.
Also eight-year trend analysis of hospitalizations for temporomandibular disorders showed that mean length of stay between (3.06 - 3.25) while per year charge increased.
2
ACKNOWLEDGMENTS
It is with my sincerest gratitude that I take this opportunity to thank those, without whom, this PhD Dissertation would not have been possible. I am truly and deeply indebted to so many people that there is no way to acknowledge them all. I sincerely hope that everyone who knows that they have contributed towards the achievement of my goals feels the satisfaction that they have helped.
Firstly, I thank my director, Chairman, and primary supervisor, Prof.Syed Haque, PhD; PhD whose encouragement, supervision and guidance from the preliminary to the concluding level of this work has been endless. His continuous support throughout this PhD journey was helpful and appreciated. He selflessly gave up so much of his time reviewing my work, and for that I am forever grateful. Dr.Haque is so much more than just the perfect supervisor; He has been a mentor, teacher and friend.
Special thanks go to my secondary supervisor, Dr.Shankar Srinivasan, for guiding me when I wrote my dissertation. He has always been at hand to listen and give advice and has shown me different ways to approach a research problem and the need to be persistent to accomplish any goal. I am truly fortunate to have been able to enjoy and benefit from such a relationship.
I thank Professor Scott Diehl for his support throughout my work in his laboratory at the Oral Biology Department, Rutgers Dental School. It has been a great privilege to have the opportunity to learn about Dental Genetics, Gene therapy and epidemiology from working closely with Professor Diehl’s research team.
Also Special thanks go to Professor Dr.Mital for sharing his wisdom on the subject and for so graciously giving up his time to give comment develop the educational components for this research and statistical analysis.
I am deeply indebted to Prof. Eli Eliav for his support and kindness during the fellowships and I am very thankful to Dr.Mohammed Alazhari, for being a great volunteer.
I would also like to thank Prof.Jasim Albandar for his very fine touch to the topic, and for hosting me at the Temple Dental School.
3

My thanks go to the many people at UQUDENT, and SHRP School and Dental School of Rutgers University who helped and encouraged me during my time here.
I offer my regards and blessings to all of those who helped me in any respect during the completion of this research, and would like to thank my great friend Riaz and Ombali, who has been a backbone of support. Without your encouragement and sometimes distractions, this work would never have been completed.
Last but not least, I thank my family, especially my mother, for their unconditional support and encouragement to pursue my interests and for believing in me, and my Special wife Razan Alhalawani for listening to my complaints and frustrations, and being such wonderful company throughout my time in United States. Truly, without her love and support, I would not be as happy as I am now.
Thank you all for being a part of my life.
4

TABLE OF CONTENTS Abstract ……………………………………………………………………….….……...2
Acknowledgment……………………………………………………………….……..…3
Table of Contents…………………………………………………………………….. …5
LIST OF TABLES ………………………………………………………………………7
LIST OF FIGURES ……………………………………………………………………..9
I INTRODUCTION ……………………………………………………………..11
Background of the Problem………………………………………………….....11
Epidemiology and Statistics of TMD………………………………………......12
Pathophysiology ……………………………………………………………......13
Types of Temporomandibular Disorders ………………………………………15
Anatomy of temporomandibular Joint ………………………………………....16
Evaluation of temporomandibular joint ……………………………………..…18
Examination of temporomandibular joint ……………………………………...19
Diagnosis of temporomandibular joint ………………………………………...20
Treatment of temporomandibular joint ………………………………………...21
Research goal and Hypothesis of the study ……...…………………………….23
II REVIEW OF RELATED LITERATURE……………………………………...26
III METHODS …………………………………………………………………….30
Description of database ……………………………………………………….. 30
Data user agreement ……………………………………………………………33
Outcome Variables ……………………………………………………………..33
Independent Variables ……………………………………………………….....33
Analytical Approach – Descriptive statistics ………………………………….34
Outcome of the study …………………………………………………………39
5

IV RESULTS………………………………………………………………………....41
V DISCUSSION ………………………………………………………………. ...85
VI SUMMARY AND CONCLUSIONS …………………………………………..89
REFERENCES ...……………………………………………………………………....92
6
LIST OF TABLES Page Table 1: shows prevalence rate of TMD- related orofacial pain ……………………....29 Table 2: Numbers of observation for each datasets ……………………………….…..36 Table 3: The data for each year by primary diagnosis …………………………………41 Table 4: Characteristics of hospitalizations for TMD all years 2003-2010 ……………47 Table 5: Hospitalization for TMD by TMD related diagnosis ………………………...56 Table 6: AIDS comorbidity measure with and without TMD …………………………60 Table 7: Deficiency anemia comorbidity measure with/without TMD …………..……60 Table 8: Rheumatoid arthritis/collagen vascular diseases comorbidity ……………......61 Table 9: Chronic blood loss anemia comorbidity ………………………………………61 Table 10: Congestive heart failure comorbidity ………………………………….…….62 Table 11: Chronic pulmonary disease comorbidity …………………………………….62 Table 12: Coagulopathy comorbidity ……………………………………………..……63 Table 13: Depression comorbidity …………………………………………..…………63 Table14: Diabetes/Diabetes with chronic complications comorbidity ...……………….64 Table 15: Drug abuse comorbidity ……………………………………………..………64 Table 16: Hypertension comorbidity ……………………………………………..…….65 Table 17: Hypothyroidism comorbidity ………………………………………………..65 Table 18: Liver disease comorbidity ………………………………………………… 66 Table 19: Lymphoma comorbidity ………………………………………..………… 66 Table 20: Fluid and electrolyte disorders comorbidity ……………………………….67
7

Table 21: Metastatic Cancer comorbidity …………………………………………….67 Table 22: Other neurological disorders comorbidity ………………………………...68 Table 23: Obesity comorbidity ………………………………………………………68 Table 24: Paralysis comorbidity ……………………………………………………..69 Table 25: Psychoses comorbidity ……………………………………………………69 Table 26: Pulmonary circulation disorders comorbidity …………………………….70 Table 27: Renal Failure….…………………………………………………………….70 Table 27: Solid tumor without metastasis ……………………………………………71 Table 28: Peptic ulcer disease excluding bleeding …………………………………..71 Table 29: Valvular disease comorbidity ………………………………………………72 Table 30: Weight loss comorbidity ……………………………………………………72
8

LIST OF FIGURES Page Figure 1: Temporomandibular Joint …………………………………………………13 Figure 2: Basic anatomy of Temporomandibular Joint ……………………………...18 Figure 3: Components of Temporomandibular Joint ……………………………..…19 Figure 4: Etiologic Variables of TMD ……………………………………………....26 Figure 5: Hospitalizations for TMD by year ………………………………………...48 Figure 6: Hospitalizations for TMD by sex ……………………………………….…49 Figure 7: Hospitalizations for TMD by race ………………………………………...50 Figure 8: Hospitalizations for TMD by disposition at discharge …………………...51 Figure 9: Hospitalizations for TMD by disposition at discharge …………………...52 Figure 10: Hospitalizations for TMD by primary payer …………………………….53 Figure 11: Hospitalizations for TMD by secondary payer ………………………….54 Figure 12: Hospitalizations for TMD by TMD related diagnosis …………………..56 Figure 13: Hospitalizations for TMD by comorbidity with TMD ………………….57 Figure 14: Hospitalizations for TMD by comorbidity without TMD ………………59 Figure 15: Hospitalizations for TMD by source …………………………………….73 Figure 16: Hospitalizations for TMD by type ……………………………………….74 Figure 17: Hospitalizations for TMD by week ……………………………………...75 Figure 18: Hospitalizations for TMD by risk mortality subclass …………………...76 Figure 19: Hospitalizations for TMD by disease stage mortality level ……………..77 Figure 20: Hospitalizations for TMD by hospital location ……………………..….78
9
Figure 21: Hospitalizations for TMD by state……………………………………….79 Figure 22: Incidence and population diversity.……………………………………….80 Figure 23: State and prevalence ………………………………………………………81 Figure 24: Population age ranges and % prevalence…………………………………..82 Figure 25: Mean length of stay………………………………………………………...83 Figure 26: Mean hospital charge……………………………………………………….84 Figure 27: Median Household income by patient Zip code……………………………85
10
Chapter I
INTRODUCTION
Background Of the problem
What is temporomandibular disorder?
The conundrum of the temporomandibular disorders (TMD) first appeared in the literature in 1887, and has since been a confusing disorder with different terminology and lists of associated symptoms. Also It had different abbreviations; such as TMJ, TMJD, MPDS, MDS, CMD and TMD (1). Finally, Bell (1982) introduced the term temporomandibular disorder (TMD) which has, since then, become widely used (2).
Temporomandibular disorders (TMD) are a group of related disorders with considerable prevalence and costs. They represent a major cause of non-dental pain in the head, neck and face region and are considered a subclass of musculoskeletal and neuromuscular disorders that involve the temporomandibular joint (TMJ), the masticatory muscles, and all associated tissues (3-15).
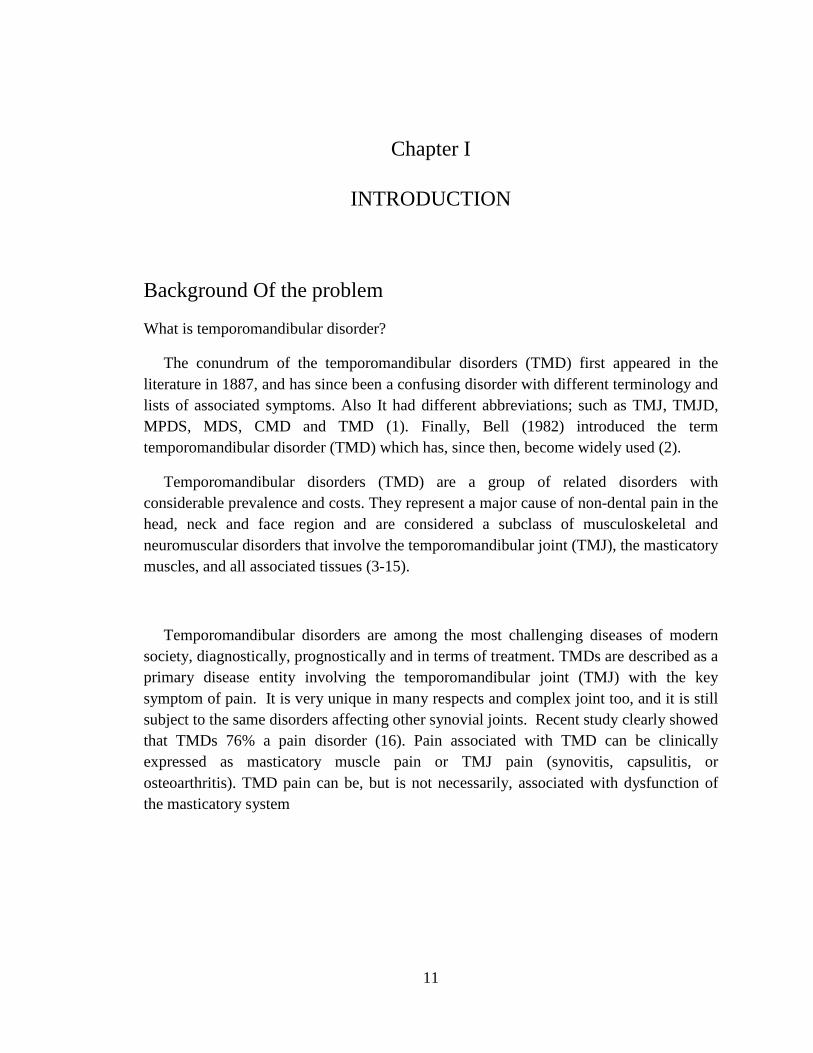
Temporomandibular disorders are among the most challenging diseases of modern society, diagnostically, prognostically and in terms of treatment. TMDs are described as a primary disease entity involving the temporomandibular joint (TMJ) with the key symptom of pain. It is very unique in many respects and complex joint too, and it is still subject to the same disorders affecting other synovial joints. Recent study clearly showed that TMDs 76% a pain disorder (16). Pain associated with TMD can be clinically expressed as masticatory muscle pain or TMJ pain (synovitis, capsulitis, or osteoarthritis). TMD pain can be, but is not necessarily, associated with dysfunction of the masticatory system
11
Figure.1.Temporomandibular Joint (Source; National Institute of Dental
and Craniofacial Research 2014)
12
Epidemiology and Statistics of TMD
TMD- related has been reported in between 5% and 15% in the U.S.A according to the National Institute of Dental and Craniofacial Research (NIDCR), one of the faculties of the National Institutes of Health (NIH).
The prevalence rates of TMD disorders are well distributed throughout a broad spectrum age range of 20-60 and peaking between 20-40 years. Nationally speaking, some states have a much higher incidence than others raising the question of whether it’s geography or the larger population of these states that reflect that higher incidence rate.
TMD disorders are at least twice as prevalent in women as men, while only 1.4 -7% seeks treatment (4 times more females); Progression to severe and/or chronic pain is associated with greater psychosocial distress, sleep disturbances, and comorbidities. TMD-related can affect daily activities, physical, psychosocial functioning, and quality of life. And women using either supplemental estrogen or oral contraceptives are more likely to seek treatment for these conditions so researchers are exploring a possible link between female hormones and TMJ disorders.
Pathophysiology
Many aspects of the etiology of TMD are unclear. But there is definite support for a biopsychosocial and multifactorial background, illustrating the complex interaction between biological mechanisms, psychological states and traits, environmental conditions, and macro- and microtrauma.
In masticatory muscle pain (MMP), experts propose a complex interaction between environmental, emotional, behavioral, and physical factors, including overloading parafunctions such as clenching during waking hours and bruxism during sleep, micro- trauma, and release of inflammatory mediators and neuropeptides in muscles, which can sensitize the peripheral and central nervous systems. In conjunction with altered pain-regulating mechanisms (also influenced by female hormones), such factors may lead to localized or more generalized muscle pain, which is associated with comorbidities (6-15)
Recent articles have highlighted the cultural effects of persistent TMD pain on patient behavior, as well as genetic factors (COMT gene haplotypes) (14).
13

Much co-morbidity are present in TMD in-patients studied and the numbers don’t necessarily correlate, which warrants further study with more depth to investigate any underlying relationship between these conditions. Many conditions may mask and co-exist with TMJ Disorders.
Meanwhile, a variety of symptoms may be linked to TMJ disorders. Pain, particularly in the chewing muscles and/or jaw joint, is the most common symptom.
Other likely symptoms include:
Radiating pain in the face, jaw, or neck.
Jaw muscle stiffness.
Limited movement or locking of the jaw.
A change in the way the upper and lower teeth fit together
painful clicking, popping or grating in the jaw joint opening/closing
the mouth.
For many people, symptoms seem to start without obvious reason.
Naturally, trauma to the jaw or temporomandibular joint plays a role in some TMJ disorders. But for most jaw joint and muscle problems, scientists don’t know the causes.
Having said that, some perceived causes are;
Autoimmune disease
Infection
Injury
Dental procedures
Arthritis
Stretching the jaw for breathing tube
A gene variant
Hormonal e.g. women of child bearing age and premenopausal.
Environmental e.g. habitual gum chewing or sustained jaw position
14
For most people, pain in the area of the jaw joint or muscles does not signal a serious problem. Generally, discomfort from these conditions is occasional and temporary, often occurring in cycles. The pain eventually goes away with little or no treatment.
Patients can therefore misinterpret and assign the pain to sinuses or migraine headaches. Some people, however, develop significant, long-term symptoms that affect their quality of life.
Complex cases are often marked by prolonged, persistent and severe pain; jaw dysfunction; co-existing conditions; and diminished quality of life. Such cases require a team of experts from various fields, such as dentist, orofacial pain specialist, oral surgeon, neurology, rheumatology, pain management and others, to diagnose and treat this condition.
Researchers from the National Institute of Dental and Craniofacial Research (NIDCR), generally agree that TMD conditions fall into three main categories:
1. Myofascial pain involves discomfort or pain in the muscles that control jaw function.
2. Internal derangement of the joint involves a displaced disc, dislocated jaw, or injury to the condyle.
3. Arthritis refers to a group of degenerative/inflammatory joint disorders that can affect the temporomandibular joint.
A person may have one or more of these conditions at the same time.
Types of Temporomandibular Disorders
A clear differential diagnosis for TMD is necessary, especially when a surgical consideration is possible.
15
TMJ joints disorder include disc displacement disorders, arthritic or degenerative changes and neoplasm. Other conditions affecting the temporomandibular joints include congenital disorders, inflammatory conditions and systemic disease.
There are three signs of a temporomandibular disorder;
1. Pain of lower jaw function 2. Limitation of lower jaw movements 3. Joint sounds.
Can be one, two, or all three conditions when present, may indicate either signs of a chronic adaptation of the anatomy structure of the joint. Mostly no need for treatment interventions, or symptoms of dysfunction which may limit the activities of daily life due to pain or a limited ability to masticate muscle.
While pain of the masticatory system can arise from the muscles of mastication or can be referred to the craniofacial region from musculoskeletal structures (3).
Examination of the masticatory muscles will detect myofacial trigger points and muscle tenderness, which can also produce referral patterns to the region of the temporomandibular joints. Also myositis or muscle inflammation, often result from local trauma or infection. Myospasm describes an involuntary muscle contraction. The patient with myospasm may present with a restricted mandibular range of motion that must be differentiated from an internal derangement of the joint, as this condition can also restrict mandibular movement (19-20).
By time, masticatory muscles experiencing chronic contraction or other local myopathies may develop myfibrotic contracture. This may not be a painful condition, but will also limit the mandibular range of motion. For this reason, a differential diagnosis requires a very detailed history and evaluation (18).
Anatomy of temporomandibular Joint
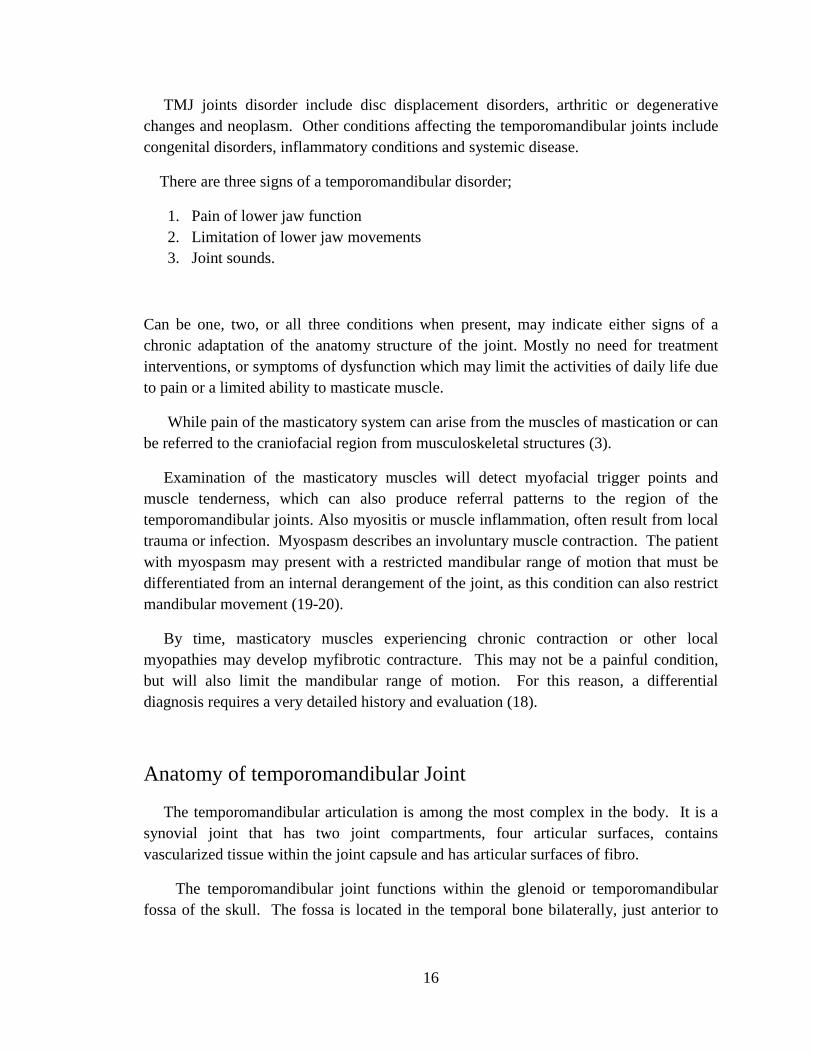
The temporomandibular articulation is among the most complex in the body. It is a synovial joint that has two joint compartments, four articular surfaces, contains vascularized tissue within the joint capsule and has articular surfaces of fibro.
The temporomandibular joint functions within the glenoid or temporomandibular fossa of the skull. The fossa is located in the temporal bone bilaterally, just anterior to
16

the external auditory meatus. The TMJ fossa is not so much of a precise socket, but more of a depression in the base of the skull within the mandibular condyle functions.
The mandibular condyle is a spheroidal structure capable of a wide range of anterior, posterior and lateral movements. The fibrocartilagenous articular surfaces of the condyle and fossa function against the fibrous interarticular disc that is interposed between these two structures.
The disc is attached to the mandibular condyle by lateral and medial collateral ligaments and blends into the capsule anteriorly. Posteriorly, the disc attaches to the complex retrodiscal tissues. While the disc is avascular and non-innervated, the retrodiscal tissue is highly vascularized and richly innervated.
The temporomandibular joint is a synovial join; by definition, it is encapsulated and stress bearing. The disc and its circumferential attachments separate the joint into an upper and lower joint space. The disc-condyle complex and mandibular fossa are enclosed within the capsular ligament that is lined by synovial tissue with collateral ligaments blending into the capsule. The Temporomandibular joint lateral ligament complex arises from the articular eminence and attaches to the posterior aspect of the nest of the condyle (21-24).
17

Figure.2. Basic anatomy of Temporomandibular Joint (source: TMJ association)
18
Figure.3. Components of Temporomandibular Joint (source: clinical outline)
Evaluation of temporomandibular joint
Evaluation is very important to diagnose the temporomandibular joint disorders properly. The goal of any treatment regimen regarding injury to, or dysfunction of, a joint is the restoration of function and decrease in pain.
The approach to management of a temporomandibular joint injury or dysfunction is no different from any other joint. Regardless of the etiology, pain, dysfunctional movements and sounds during function characterize a temporomandibular disorder.
Trauma may have been the precipitating event leading to the onset of the patient’s complaints, there may be perpetuating factors, which result in lengthier and less productive treatment if not recognized and eliminated.
Therefore; the first goal in implementing a well-defined management on the identification of contributing factors. This should include addressing physical, emotional and psychological factors.
19
A comprehensive evaluation must include a detailed history which reviews:
• The chief complaint
• The history of the present illness
• The patient’s medical and dental histories
• The findings of the clinical examination
An evaluation of the muscles of mastication and the supporting muscles of the neck and shoulders
The conditions found within the oral cavity which might be contributing to the patient’s pain complaints
Myofunctional and/or parafunctional habits
Mandibular range of motion measurements
Auscultation of the temporomandibular joints during movement
Radiologic findings
Examination of temporomandibular joint
As musculoskeletal disorders are the most common sources of craniofacial pain, All patients should be screened for TMD and other craniofacial pain disorders during a general examination.
Examination of the temporomandibular joints includes:
• Measurement of mandibular range of motion
• Evaluation of mandibular gait
• Auscultation
• Palpation
20

Diagnosis of temporomandibular joint
Many TMD and facial Pain specialists say that temporomandibular joint “related” disorders can and must be differentially diagnosed, with highly specialized evaluations to specify diagnoses that might include the following:
• Myalgia
• Myofascitis
• Articular disc disorder (Disc dislocation)
• Inflammatory arthritis
• Muscle spasm
• Hyoid Bone Syndrome
• Posterior capsulitis
• Omohyoid Syndrome
• Temporal tendonitis (short head and long head)
• Rheumatoid arthritis
• Hemarthrosis
• Stylomandibular Ligament Sprain
• Reflex sympathetic dystrophy
• Degenerative arthritis
• Anterior displacement of TMJ disc without reduction
• Anterior displacement of TMJ disc with reduction
• Osteocavitational Necrosis
• Osteochondritis
• And numerous other conditions.
21
Treatment of temporomandibular joint
Management aims at providing the optimal circumstances for healing and adaptation to
take place. Noninvasive, reversible therapies that fit in the biopsychosocial approach
include:
- Education of the patient, active self-care, follow-up
- Physical therapy, physical self-regulation programs
- Intraoral occlusal appliances
- Medication (analgesics, nonsteroidal anti-inflammatory drugs)
In patients with chronic TMD, these therapies must be accompanied by:
- Psychological support, e.g., cognitive-behavioral therapy, relaxation therapy
- Surgery, But before doing surgery, must have:
1. Documented TMJ internal derangement that is
2. The result of a structural disorder
3. Pain and/or dysfunction are a disability
4. Prior unsuccessful nonsurgical treatment
5. Prior management of habits, concurrent active medical or dental problems
6. Informed consent
Diagnostic Criteria of TMD
The Guidelines of the American Academy of Orofacial Pain (2013) and the Diagnostic
Criteria (DC-TMD, 2013-2014) suggest the following criteria:
MMP: A complaint of muscle pain in the jaw, in the temple, in the ear, or in front of the
ear that is affected by jaw movement, function, or parafunction. Replication of this
22

familiar pain occurs with provocation testing of the masticatory muscles (i.e., palpation
of the temporalis or masseter muscle(s); OR with maximum unassisted or assisted
opening. Limitation of mandibular movement(s) secondary to pain may be present.
TMJ arthralgia: A complaint of joint pain that is affected by jaw movement, function, or
parafunction. Replication of this familiar pain occurs with provocation testing of the TMJ
(i.e., palpation of the lateral pole or around the lateral pole) OR with maximum
unassisted or assisted opening, right or left lateral movements, or protrusive movements.
Psychosocial factors are rated by means of a pain drawing for pain locations and
comorbidities, the Graded Chronic Pain Scale (GCPS) for pain intensity and physical
function, the Jaw Function Limitation Scale (JFLS) short-form for limited function, the
Patient History Questionnaire-4 (PHQ-4) for depression and anxiety, and the Oral
Behavior Checklist for parafunction (9).
Research Significance, goal and Hypothesis of the study
Study Significance
The growing prevalence of TMD and the significant direct and indirect costs
associated with this condition need more attention especially at emergency department
and In-patient. Because TMJ disorders causation is complex and multifactorial,
understanding the dynamics of other conditions, interactions and manifestation of a
disease is essential to enhance the ability to diagnose and treat the condition.
Hence, there is an urgent need to address these issues via a retrospective analysis of
existing data from HCUP in-patients to identify high risk populations throughout the
United States.
There is a need to investigate the likely causes and recognize common co-morbidities in
order to develop an optimal treatment plan that is safe and effective with a preventative
approach to reduce prevalence and long term damage from chronic recurring pain which
may become debilitating and accumulate direct and indirect costs including but not
limited to recurring hospital stays.
23

Research Goal
Evaluate associations of socio-demographic and co-morbidity characteristics for
TMD In-patient using NIS-HCUP data
Our hypothesis:
1. Socio-demographic factors (age, gender, median income, ethnicity) affect
incidence of TMD and hospital stays
2. Co-morbidities exist that are significantly related to TMD incidence and
hospitalization costs
3. Hospitalization trend of TMD
If we study and analyze TMD statistics and demographics in the USA we can
understand and appreciate its prevalence in order to;
A. Investigate and establish optimum treatment for patients and develop measures
and guidelines for healthcare providers at in-patient settings.
B. Strategize for long term preventative care and reduce direct and indirect costs
associated with TMD including hospital stay and loss of productivity
C. Improve the quality of life for those affected and reduce oral health disparities
Objective
The study aims to:
1. Examines 8 years hospitalization patterns and changes in TMJD in united states
2. look at national statistics of patients with TMD from populations of United states
that participate with HCUP and in light of better understanding the significant
predictors for TMJD from selected demographics, prevalence, comorbidities
disease, genetics risk factors and preventive strategies of in-patient
temporomandibular joint disorders
24
Limitations
• There is no recent data from 2010-2014 so that more samples can be collected or
studied.
• There is no data on recurrence to establish how effective treatments are such that
patients do not have to be readmitted. If patients keep coming back then their
condition is not controlled and a more appropriate treatment for long term effects
is necessary.
• Number of missing data specially in 2006 Data
• Different CPT Code used for TMD by clinician
• Patients are lost to follow up once they are discharged and therefore are not
continued to be monitored for chronic TMD.
• the numbers for recurrence rates are not known which makes it difficult to know
the success of the treatments offered
• Patients are lost to follow up once they are discharged and therefore are not
continued to be monitored for chronic TMD.
• The examining physician specialty is also unknown and may therefore cause a
very high probability of misdiagnosis depending on whether the physician is a
Neurologist, ENT Specialist etc.
• During their hospital visit, those inpatients are unlikely to be seen by a TMD
Specialist since these physicians are not stationed at ER or in ward
• guidelines for TMD not available at the ER and in-patients
• There are no follow up visits to prevent further deterioration and improve
preventative care.
25

Chapter II
REVIEW OF RELATED LITERATURE
Temporomandibular joint disorders (TMD)
Etiology, Risk factors, Epidemiology and Economics for TMD TMJ is often a unique joint and complex nature and affected by many factors. It is a
general belief that the etiology of TMD is multicausal although it is still many aspects of
the etiology of TMD are unclear. But they are related to different etiologic factors and
comorbid conditions (25).these factors can be (Anatomic, Physiologic, Neurologic,
Psychologic, Behavioral, and Genetic). A certain etiologic cause, under different
circumstances, can play the major role of either one or all mentioned factors (26). Every
patient has some unique characteristics which are typical of their body.
Figure.4. Etiologic Variables of TMD
Anatomy Parafunction
Sleep Disorders Occlusion
Nutrition Gender
Depression Posture
Stress Trauma
Pain Coping
26
Age and gender differences:
Age and gender differences play a role in the TMD epidemic. In a study that examined
the age and sex distribution of 3,428 TMD patients presenting at a Seattle based HMO of
360,000enrollees, results showed that a mean ages of the women and men were 34.2
years and 33.8 years, respectively of those seeking treatment, 85.4% were women.
Anxiety and stress:
There is strong evidence that female effects of anxiety more than male, because of
Gender Differences, Decreased pain threshold, Decreased pain tolerance, Disrupted self-
control strategies, Increased EMG, and Increased pain behavior. Links have been
identified between guilt, grief, emotional and depressive stress syndromes and
immunologic status. (27, 33, 34)
Hormones:
Hormonal Influences on pain modulation which Greater pain sensitivity during menstrual
cycle, at ovulation, and following menses. In addition, functional estrogen receptors have
been identified in the female TM joint but not been found in the male TMJ. It is likely
that sex hormones profoundly influence several cell activities associated with remodeling
or degenerative processes in the temporomandibular joint (28-32)
Occlusion:
Occlusion is the relationship between dental arches in a bite. In the past, there was a
belief that occlusal factors are among the most causes which contribute to the
pathological condition of temporomandibular joint and masticatory muscles but there is
insufficient evidence to support this claim. An association has been reported in literature
between open bite, posterior crossbite, and deep bite and the occurrence of TMD.
occlusion not an exclusive etiologic factor of TMD but generally it contributes to them
(35,36)
Trauma:
27
Trauma (microtrauma and macrotrauma) considered among the important factors in
development of TMD. Caused by a traffic accident, sport injury and other types of
trauma. Macrotrauma is often mentioned by patients while microtrauma usually
unnoticed so that the patient does not mention it, which can be missing fact in
diagnostics. The most common sources of microtrauma are hypoxic-reperfusion injuries,
bruxism and orthopedic instability (3,37)
Economics:
Studies proved that TMDs are affects 10-36 million adults in the U.S., with 17.8 million
working days lost per year due to head pain for every 150 million working adults and
50% of this head pain is related to orofacial pain disorders Which resulting in billions of
dollars in financial loss (38-41). Prevalence of TMD is between 5% and 15% in the
U.S.A according to the National Institute of Dental and Craniofacial Research (NIDCR),
one of the faculties of the National Institutes of Health (NIH). The serious personal
consequences of sever, constant facial, head and neck pain from temporomandibular
disorders make these problems a major social issue. If recognition and treatment of these
disorders are inadequate or inappropriate, the patient impact can be tragic and the costs
are great (42,43).
Pain and TMD:
Recent studies showed that TMD 76% impacted by pain. 57% suffered from chronic or
recurrent pain, Small variation between age groups 4 of 10 chronic pain sufferers
reported significant life adjustments (Research America! September 4, 2003)
22% Of Population suffered from craniofacial pain more than once in the previous 6
months, and 6% of the populations suffer from TMD and or face pain in a 6 month period
(44), also Study done by UNC Pain center shows Primary Pain Complaints by Body
Region:
• 43%Head, Face, and Neck region
• 23% back and lower extremities
• and 34% Other
28
75% of the general populations have at least one sign of TMJ dysfunction. (Joint
noise, joint tenderness, etc.), and 33% have at least one symptom (face pain, joint pain,
etc.), also Epidemiologic studies show that 60-65 of the U.S. population have some
degree of malocclusion. (Henry A. Gremillion)
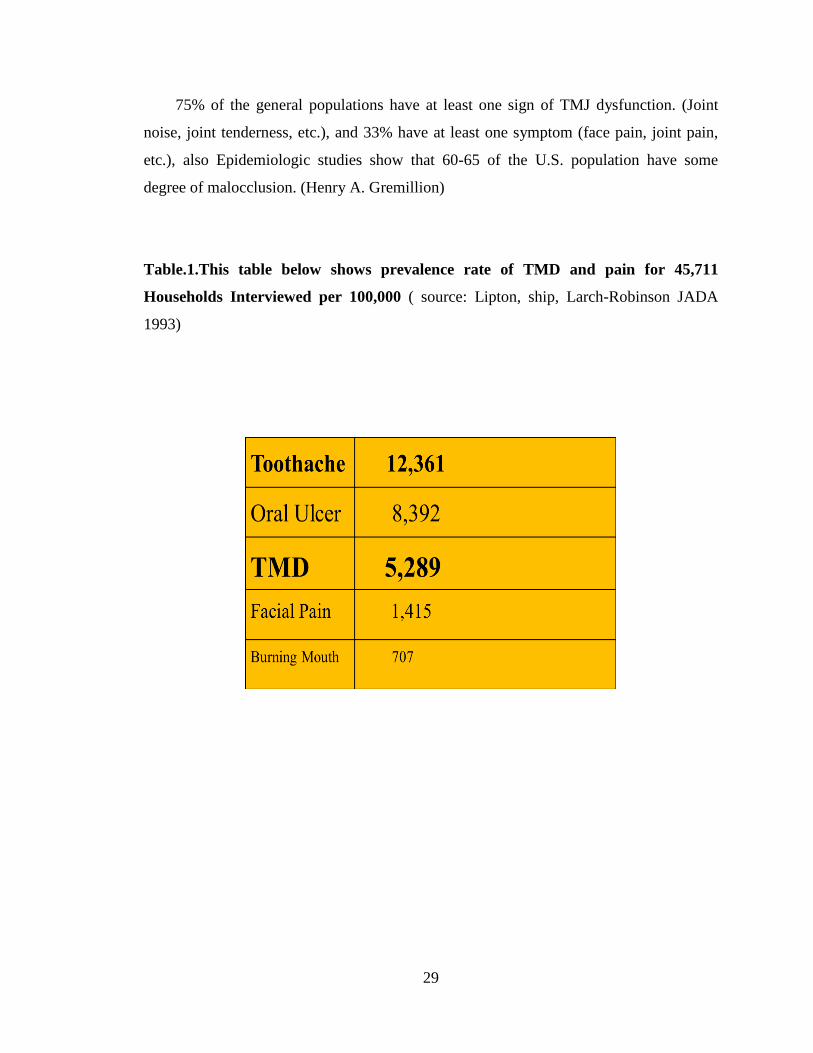
Table.1.This table below shows prevalence rate of TMD and pain for 45,711
Households Interviewed per 100,000 ( source: Lipton, ship, Larch-Robinson JADA
1993)
29
Chapter III
METHODOLOGY
Study Design, Methodology and Limitations
Description of database
The data for this project is taken from The Nationwide Inpatient Sample (NIS), which
is part of the Healthcare Cost and Utilization Project (HCUP), sponsored by the Agency
for Healthcare Research and Quality (AHRQ), formerly the Agency for Health Care
Policy and Research. The Healthcare Cost and Utilization Project (HCUP) is developed
through a Federal-state-industry partnership.
HCUP includes the largest collection of longitudinal hospital care data in the United
States, with all-payer, encounter-level information beginning in 1988. HCUP database is
collective effort of state data organizations, hospital associates, private data organizations
and federal government. These databases allow researchers to study health policy issues
ranging from cost and quality of health services, medical practice patterns, and access to
health care programs, and outcome of treatments at the national, state or local market
levels to improve health care delivery.
The NIS is largest hospital inpatient stay publicly available database. This database
are used by researchers and policymakers to identify, track and analyze national trends in
health care utilization, access, charges, quality, and outcomes.
This database includes 5 to 8 million hospital stays from about 1,000 hospitals
sampled to approximate a 20-percent stratified sample of U.S. community hospitals
defined by the AHA to be “all non-Federal, short-term, general, and other specialty
hospitals, excluding hospital units of institutions.”
30
The NIS database is available yearly, beginning with 1988. The NIS is a stratified
probability sample of hospitals in the frame, with sampling probabilities proportional to
the number of U.S. community hospitals in each stratum. The sample is limited by
availability of inpatient data from the states participating in HCUP and all the discharge
from sampled hospitals is included in database.
The NIS includes Inpatient stay records and charge information for all patients
including payer information from discharge abstracts. For Medicare, the NIS includes
Medicare Advantage patients, a population that is missing from Medicare claims data.
The NIS can be linked directly to hospital-level data from the American Hospital
Association (AHA) Annual Survey Database (Health Forum, LLC © 2007) and to
county-level data from the Health Resources and Services Administration Bureau of
Health Professions’ Area Resource File (ARF), except in those States that do not allow
the release of hospital identifiers.
The large sample size and nationally representative sample of NIS database gives
opportunity to analyze data for rare conditions, such as specific types of cancer;
uncommon treatments, such as organ transplantation; and special patient populations,
such as the uninsured.
To maintain the representative of the target universe sample, the stratification strategy is
changed over time. The main base strata for the samples are geographic region, hospital
ownership, urban/rural location, and teaching status. The strata for sample are reduced
from 108 to 60 in span of years as the sampling states numbers are changed over time.
The NIS sample was comprised of eight states when started while the latest NIS sample
is drawn from 22 states. In these years some data elements were dropped, some were
added, for some data elements, the coding was changed .NIS data is open to user after
signing data user agreement.
These yearly databases contain more than 100 clinical and nonclinical data
31

elements for each hospital stay, including:
• Primary and secondary diagnoses and procedures
• Admission and discharge status
• Patient demographic characteristics (e.g., sex, age, race, median household
income for ZIP Code)
• Hospital characteristics (e.g., ownership, size, teaching status)
• Expected payment source
• Total charges
• Discharge status
• Length of stay
• Severity and comorbidity measures.
For this analysis purpose we used data from 2003 to 2010. The NIS is nationally
representative of all hospitalizations of the years that were examined: 2003 through 2010.
We asked for data related to temporomandibular disorders, TMD musculoskeletal and
neurovascular disease data for the research purpose. In the HCUP inpatient databases, the
first listed diagnosis (DX1) is the principal diagnosis. Diagnoses are compared to a list of
ICD-9-CM codes valid for the discharge date. We combined received eight years data
from 2003 to 2010.
All ICD-9-CM and CPT Code with a primary diagnosis of temporomandibular joint
disorders (International Classification of Diseases, 9th Revision,4th edition, clinical
modifications, volumes 1 and 2, practice management information corporation, LA,
2005.)
32

Clinical Modification (ICD-9-CM) codes, TMJ disorder (524.69), Muscle spasm(728.85),
Other disorder-muscle, leg, fascia(728.9), Myofascitis(729.1), Dislocation(830.1),
Cervical strain injury(847.0), Cervicalgia(723.1), Capsulities of TMJ(726.90), Ligament
lax, and Hypermobility(728.4), Interstitial Myositis(728.81), Rupture of Muscle-non-
traumatic(728.83), Tension type headache(307.81), Migraine with aura(346.00),
Migraine without aura(346.10), Cluster headache(346.20), Ankylosis(524.61),
Rheumatoid arthritis(714.0), Degenerative arthritis(715.98), Traumatic
arthropathy(716.18), Recurrent dislocation(718.38), Internal derangement(718.98)
Data user agreement
We received data for secondary data analysis for this project from NIS in on DVD drive
after signing a copy of this data use agreement and completing the online Data Use
Agreement Training Course.
Outcome variables
The main outcome variables were length of stay, hospital charges, in-hospital mortality, and disposition at discharge.
33
Independent variables
The primary independent variable of interest was year of hospitalization (2003-2010) in examining the trends in discharge patterns. included socio-demographic characteristics (age, gender, and race or ethnicity), type of temporomandibular disorders (Muscle spasm, Myofascitis, Dislocation, Cervical strain injury, Cervicalgia, etc…), insurance status (Medicare, Medicaid, private insurance, uninsured, and other insurance plans including other government programs), disposition at discharge (routine, transfer to another hospital, transfer to other facilities including skilled nursing facility, intermediate care facility, another type of facility, home health care, discharged against advice, died, and unknown destination), and the presence of comorbid conditions. Hospital-level factors hospital location (urban and rural), and hospital region (Northeast, Midwest, South, and West).
Analytical approach - Descriptive statistics
Descriptive statistics were used to summarize the characteristics of hospitalizations attributed to temporomandibular disorders in 2003-20010 in the United States
• Length of stay • Age in years at admission • Hospital charge • Disposition at discharge, mortality, comorbidity diseases and TMD
Table 1 shows the numbers of observation for each datasets received for each year. Table 2 shows the data for each year by primary diagnosis.
34

Table.2. Observations per year
Year Numbers of observations
2003 9479
2004 9781
2005 8842
2006 8638
2007 8172
2008 7816
2009 7108
2010 7191
35

Table.3. Data by TMD and Related Diagnosis for each year
Table of DX1 by current year
DX1(Principal
diagnosis) Current year
Frequency
Percent
Row Pct
Col Pct
2003 2004 2005 2006 2007 2008 2009 2010 Total
Tension type
headache
473
0.71
13.53
4.99
482
0.72
13.79
4.93
486
0.73
13.90
5.50
471
0.70
13.47
5.45
442
0.66
12.64
5.41
397
0.59
11.36
5.08
356
0.53
10.18
5.01
389
0.58
11.13
5.41
3496
5.22
Migraine with
aura
287
0.43
10.06
3.03
309
0.46
10.83
3.16
304
0.45
10.65
3.44
326
0.49
11.42
3.77
289
0.43
10.13
3.54
312
0.47
10.93
3.99
547
0.82
19.17
7.70
480
0.72
16.82
6.68
2854
4.26
Migraine
without aura
351
0.52
15.38
3.70
368
0.55
16.13
3.76
313
0.47
13.72
3.54
339
0.51
14.86
3.92
329
0.49
14.42
4.03
327
0.49
14.33
4.18
133
0.20
5.83
1.87
122
0.18
5.35
1.70
2282
3.40
Cluster
headache
461
0.69
13.74
4.86
427
0.64
12.73
4.37
479
0.71
14.28
5.42
475
0.71
14.16
5.50
524
0.78
15.62
6.41
404
0.60
12.04
5.17
291
0.43
8.67
4.09
294
0.44
8.76
4.09
3355
5.01
36
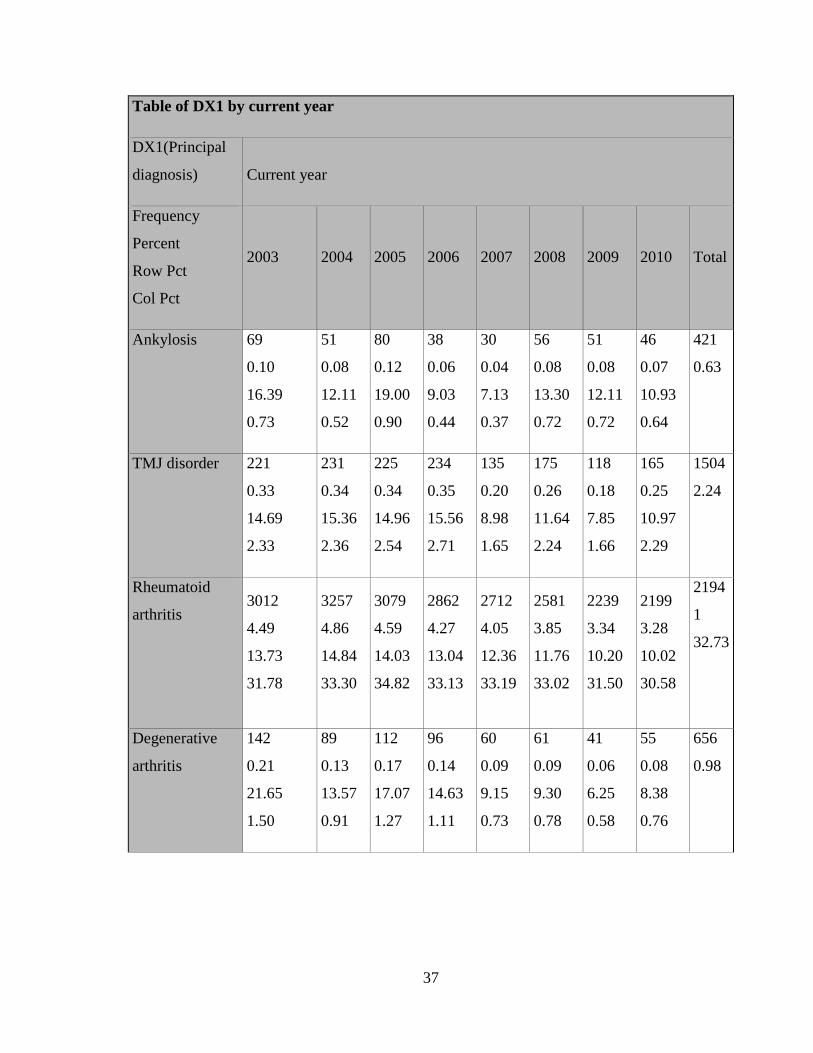
Table of DX1 by current year
DX1(Principal
diagnosis) Current year
Frequency
Percent
Row Pct
Col Pct
2003 2004 2005 2006 2007 2008 2009 2010 Total
Ankylosis 69
0.10
16.39
0.73
51
0.08
12.11
0.52
80
0.12
19.00
0.90
38
0.06
9.03
0.44
30
0.04
7.13
0.37
56
0.08
13.30
0.72
51
0.08
12.11
0.72
46
0.07
10.93
0.64
421
0.63
TMJ disorder 221
0.33
14.69
2.33
231
0.34
15.36
2.36
225
0.34
14.96
2.54
234
0.35
15.56
2.71
135
0.20
8.98
1.65
175
0.26
11.64
2.24
118
0.18
7.85
1.66
165
0.25
10.97
2.29
1504
2.24
Rheumatoid
arthritis 3012
4.49
13.73
31.78
3257
4.86
14.84
33.30
3079
4.59
14.03
34.82
2862
4.27
13.04
33.13
2712
4.05
12.36
33.19
2581
3.85
11.76
33.02
2239
3.34
10.20
31.50
2199
3.28
10.02
30.58
2194
1
32.73
Degenerative
arthritis
142
0.21
21.65
1.50
89
0.13
13.57
0.91
112
0.17
17.07
1.27
96
0.14
14.63
1.11
60
0.09
9.15
0.73
61
0.09
9.30
0.78
41
0.06
6.25
0.58
55
0.08
8.38
0.76
656
0.98
37
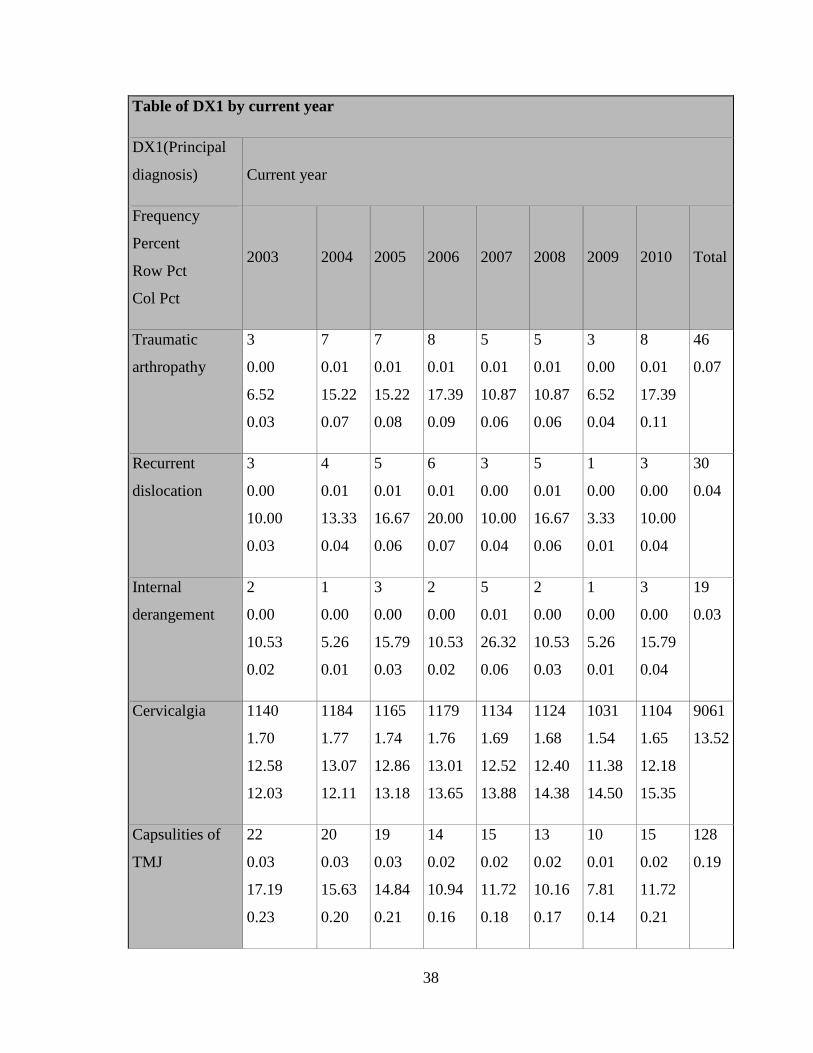
Table of DX1 by current year
DX1(Principal
diagnosis) Current year
Frequency
Percent
Row Pct
Col Pct
2003 2004 2005 2006 2007 2008 2009 2010 Total
Traumatic
arthropathy
3
0.00
6.52
0.03
7
0.01
15.22
0.07
7
0.01
15.22
0.08
8
0.01
17.39
0.09
5
0.01
10.87
0.06
5
0.01
10.87
0.06
3
0.00
6.52
0.04
8
0.01
17.39
0.11
46
0.07
Recurrent
dislocation
3
0.00
10.00
0.03
4
0.01
13.33
0.04
5
0.01
16.67
0.06
6
0.01
20.00
0.07
3
0.00
10.00
0.04
5
0.01
16.67
0.06
1
0.00
3.33
0.01
3
0.00
10.00
0.04
30
0.04
Internal
derangement
2
0.00
10.53
0.02
1
0.00
5.26
0.01
3
0.00
15.79
0.03
2
0.00
10.53
0.02
5
0.01
26.32
0.06
2
0.00
10.53
0.03
1
0.00
5.26
0.01
3
0.00
15.79
0.04
19
0.03
Cervicalgia 1140
1.70
12.58
12.03
1184
1.77
13.07
12.11
1165
1.74
12.86
13.18
1179
1.76
13.01
13.65
1134
1.69
12.52
13.88
1124
1.68
12.40
14.38
1031
1.54
11.38
14.50
1104
1.65
12.18
15.35
9061
13.52
Capsulities of
TMJ
22
0.03
17.19
0.23
20
0.03
15.63
0.20
19
0.03
14.84
0.21
14
0.02
10.94
0.16
15
0.02
11.72
0.18
13
0.02
10.16
0.17
10
0.01
7.81
0.14
15
0.02
11.72
0.21
128
0.19
38
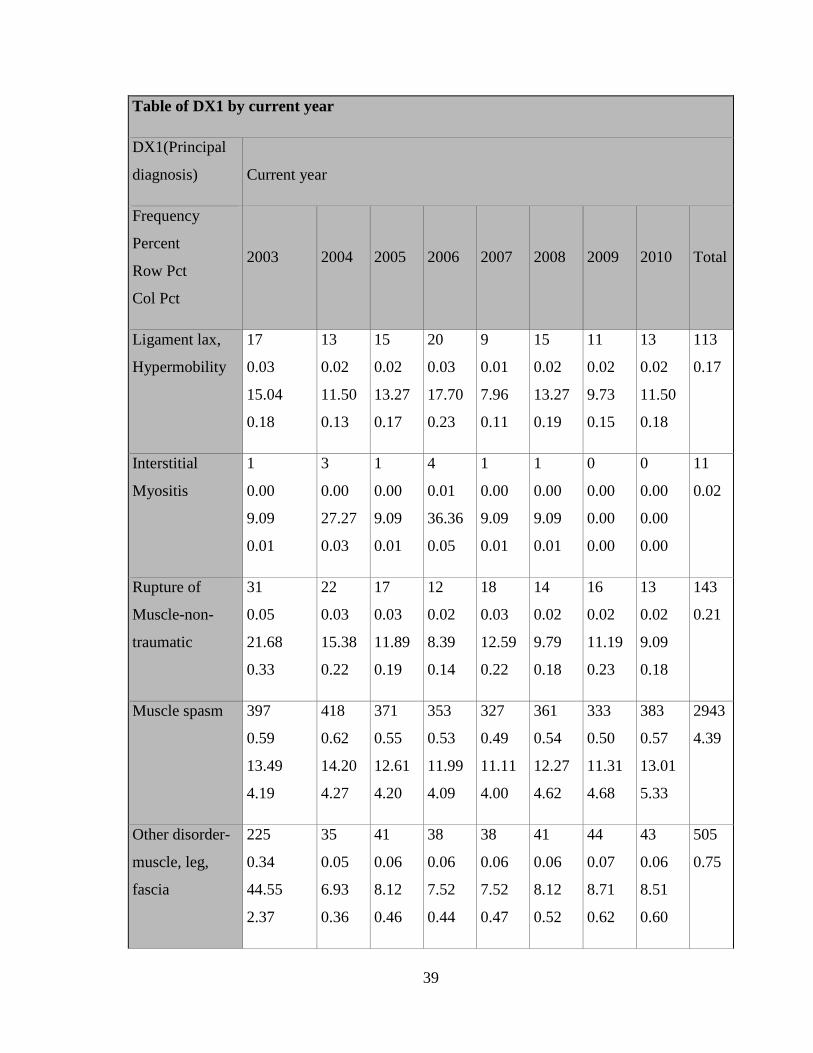
Table of DX1 by current year
DX1(Principal
diagnosis) Current year
Frequency
Percent
Row Pct
Col Pct
2003 2004 2005 2006 2007 2008 2009 2010 Total
Ligament lax,
Hypermobility
17
0.03
15.04
0.18
13
0.02
11.50
0.13
15
0.02
13.27
0.17
20
0.03
17.70
0.23
9
0.01
7.96
0.11
15
0.02
13.27
0.19
11
0.02
9.73
0.15
13
0.02
11.50
0.18
113
0.17
Interstitial
Myositis
1
0.00
9.09
0.01
3
0.00
27.27
0.03
1
0.00
9.09
0.01
4
0.01
36.36
0.05
1
0.00
9.09
0.01
1
0.00
9.09
0.01
0
0.00
0.00
0.00
0
0.00
0.00
0.00
11
0.02
Rupture of
Muscle-non-
traumatic
31
0.05
21.68
0.33
22
0.03
15.38
0.22
17
0.03
11.89
0.19
12
0.02
8.39
0.14
18
0.03
12.59
0.22
14
0.02
9.79
0.18
16
0.02
11.19
0.23
13
0.02
9.09
0.18
143
0.21
Muscle spasm 397
0.59
13.49
4.19
418
0.62
14.20
4.27
371
0.55
12.61
4.20
353
0.53
11.99
4.09
327
0.49
11.11
4.00
361
0.54
12.27
4.62
333
0.50
11.31
4.68
383
0.57
13.01
5.33
2943
4.39
Other disorder-
muscle, leg,
fascia
225
0.34
44.55
2.37
35
0.05
6.93
0.36
41
0.06
8.12
0.46
38
0.06
7.52
0.44
38
0.06
7.52
0.47
41
0.06
8.12
0.52
44
0.07
8.71
0.62
43
0.06
8.51
0.60
505
0.75
39

Table of DX1 by current year
DX1(Principal
diagnosis) Current year
Frequency
Percent
Row Pct
Col Pct
2003 2004 2005 2006 2007 2008 2009 2010 Total
Myofascitis 1638
2.44
14.95
17.28
1528
2.28
13.95
15.62
1376
2.05
12.56
15.56
1338
2.00
12.21
15.49
1361
2.03
12.42
16.65
1265
1.89
11.55
16.18
1261
1.88
11.51
17.74
1187
1.77
10.84
16.51
1095
4
16.34
Dislocation 0
0.00
0.00
0.00
1
0.00
14.29
0.01
0
0.00
0.00
0.00
2
0.00
28.57
0.02
0
0.00
0.00
0.00
0
0.00
0.00
0.00
3
0.00
42.86
0.04
1
0.00
14.29
0.01
7
0.01
Cervical strain
injury
984
1.47
15.00
10.38
1331
1.99
20.30
13.61
744
1.11
11.34
8.41
821
1.22
12.52
9.50
735
1.10
11.21
8.99
657
0.98
10.02
8.41
618
0.92
9.42
8.69
668
1.00
10.19
9.29
6558
9.78
Total
9479
14.14
9781
14.59
8842
13.19
8638
12.89
8172
12.19
7816
11.66
7108
10.60
7191
10.73
6702
7
100.0
0
40
Outcomes of the Study
As our main goal was to find demographic predictors for the TMJ disorder, we select our
sample for the patients whose primary diagnosis was TMJ disorder. Our final analytic
sample size for this research purpose is 1504 of temporomandibular disorder, and 67027
total of TMD including the disease associated with TMD. This sample size would be
enough to study demographic variables that are related to TMJ disorders. As this database
also includes the information for up-to 25 disease codes, we will be able to study other
prevalent disease with TMJ disorders. This database also allows us to study present any
comorbidity measures related to TMJ disorder.
We are planning to use SAS9.3 to do all our analysis. The large, nationally
representative data will help us to get insight depth to understand factors that play major
role for TMJ disorder and ultimately will facilitate the treatment part of disease. This data
also includes the information regarding numbers of days of admission and total charges
we will be able to study the financial burden related to disease.
41

Chapter IV
RESULT
Description of all years from 2003 to 2010
Characteristics of hospitalizations for Temporomandibular disorders of all years
combined are summarized in table. The total number of hospitalizations was 67,027 over
the eight year period. The majority of all hospitalizations were female (68.9%), and the
overall mean age was 41.05 years (standard deviation of the mean 18.48). Data on race or
ethnicity were missing in 23.0% of all hospitalizations since some states did not provide
information on race. Among those for which race information was available, whites
accounted for the most of the hospitalizations (51.6%), followed by blacks (12.1%),
Hispanic (9.0%), other (2.4%), Asian/Pacific Islanders (1.4%), and Native Americans
(0.5%). Primary diagnoses or the temporomandibular disorders type at hospitalization, in
the order of most frequently occurring location, involved Rheumatoid arthritis (32.73%),
Myofascitis (16.34%), Cervicalgia (13.52%), cervical strain injury (9.78%), Tension type
Headache (5.22%), Cluster headache (5.1%), Muscle spasm (4.39%), Migraine with aura
(4.26), Migraine without aura (3.40), and the primary temporomandibular joint disorder
(2.24). The two largest payers were Medicare (37.8%) and private insurance (39.2%), and
the remaining hospitalizations were covered by Medicaid (11.7%) and other insurance
plans (4.1%). About 6.4% of hospitalizations were uninsured or self-pay. The majority of
hospitalizations were routinely discharged (74.4%), while others were followed by
transferred to other facilities (13.3%), home health care (10.1%), transferred to another
short-term hospital (0.9%), and discharged against advice (0.9%). In-hospital mortality
occurred in 101 hospitalizations (0.2% of all hospitalizations) over the eight-year period.
The majority of the hospitalizations occurred in large metropolitan hospitals (26.7%),
42
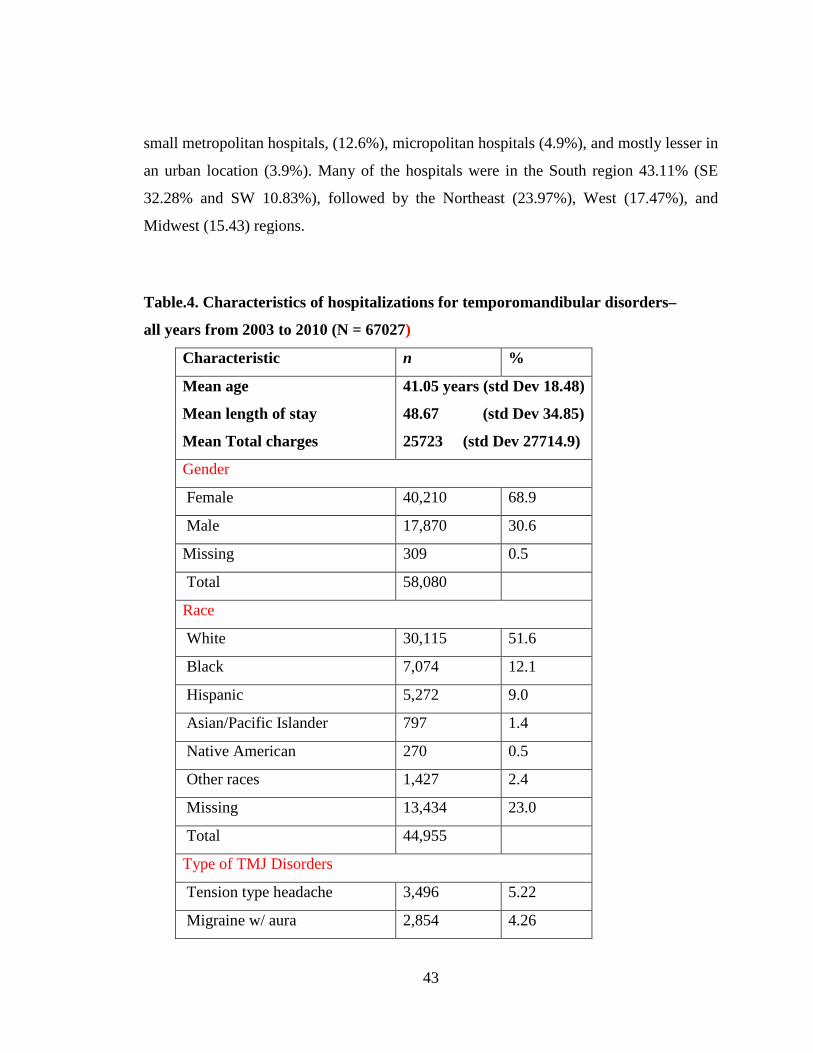
small metropolitan hospitals, (12.6%), micropolitan hospitals (4.9%), and mostly lesser in
an urban location (3.9%). Many of the hospitals were in the South region 43.11% (SE
32.28% and SW 10.83%), followed by the Northeast (23.97%), West (17.47%), and
Midwest (15.43) regions.
Table.4. Characteristics of hospitalizations for temporomandibular disorders–
all years from 2003 to 2010 (N = 67027)
Characteristic n %
Mean age
Mean length of stay
Mean Total charges
41.05 years (std Dev 18.48)
48.67 (std Dev 34.85)
25723 (std Dev 27714.9)
Gender
Female 40,210 68.9
Male 17,870 30.6
Missing 309 0.5
Total 58,080
Race
White 30,115 51.6
Black 7,074 12.1
Hispanic 5,272 9.0
Asian/Pacific Islander 797 1.4
Native American 270 0.5
Other races 1,427 2.4
Missing 13,434 23.0
Total 44,955
Type of TMJ Disorders
Tension type headache 3,496 5.22
Migraine w/ aura 2,854 4.26
43

Migraine w/o aura 2,282 3.40
Cluster headache 3,355 5.01
Ankyloses 421 0.63
TMJ disorders 1,504 2.24
Rheumatoid arthritis
Degenerative arthritis
Traumatic arthropathy
Recurrent Dislocation
Internal derangement
Cervicalgia
Capsulitis of TMJ
Ligament lax, Hypermobility
Myositis
Rupture muscle-non traumatic
Muscle spasm
Other disorder(muscle,leg,fasci)
Myofascitis
Dislocation
Cervical strain injury
2,1941
656
46
30
19
9,061
128
113
11
143
2943
505
10,954
7
6,558
32.73
0.98
0.07
0.04
0.03
13.52
0.19
0.17
0.02
0.21
4.39
0.75
16.34
0.01
9.78
Total 67,027
Insurance
Medicare 22,080 37.8
Medicaid 6,843 11.7
Private insurance 22,877 39.2
Other insurance 2,389 4.1
Uninsured or self-pay 3,747 6.4
No charges 326 0.6
Missing 127 0.2
Total 58,262
44
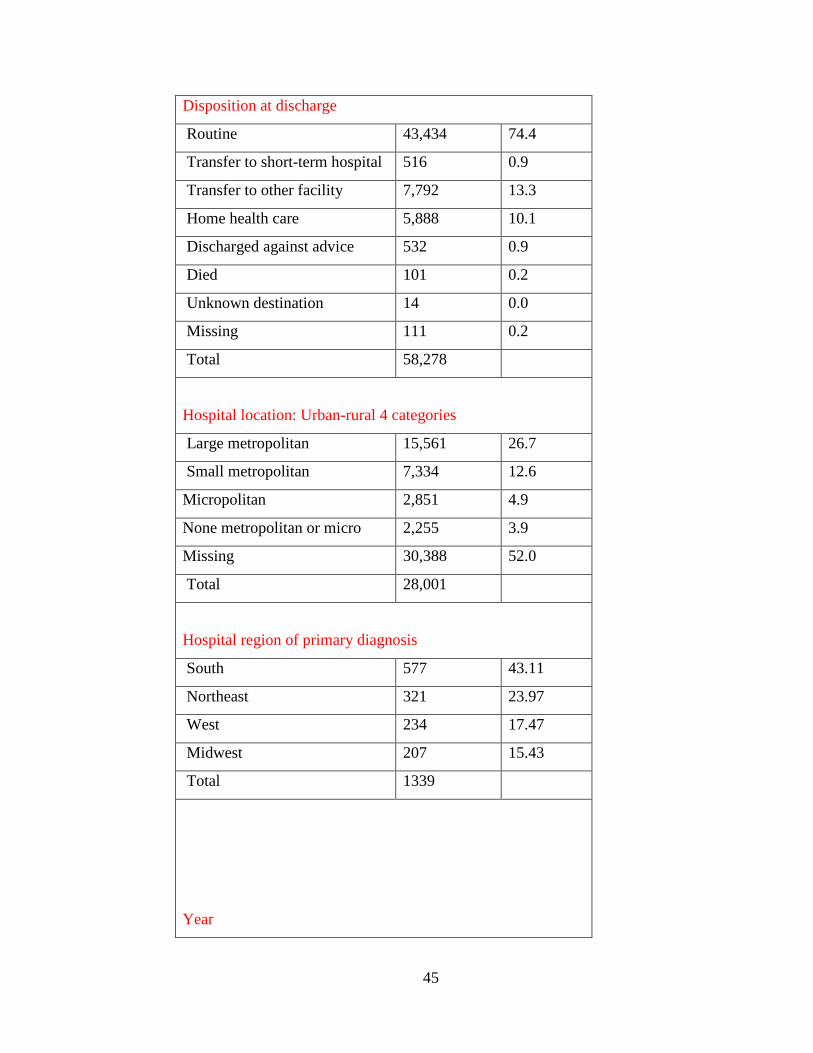
Disposition at discharge
Routine 43,434 74.4
Transfer to short-term hospital 516 0.9
Transfer to other facility 7,792 13.3
Home health care 5,888 10.1
Discharged against advice 532 0.9
Died 101 0.2
Unknown destination 14 0.0
Missing 111 0.2
Total 58,278
Hospital location: Urban-rural 4 categories
Large metropolitan 15,561 26.7
Small metropolitan 7,334 12.6
Micropolitan 2,851 4.9
None metropolitan or micro 2,255 3.9
Missing 30,388 52.0
Total 28,001
Hospital region of primary diagnosis
South 577 43.11
Northeast 321 23.97
West 234 17.47
Midwest 207 15.43
Total 1339
Year
45

2003 9,479
2004 9,781
2005 8,842
2006 8,638
2007 8,172
2008 7,816
2009 7,108
2010 7,191
Total 67,027
Eight-year trends
The trends of hospitalization-level factors are shown in Figures below. The number of
hospitalizations decreased in general and ranged from 9,479 in 2003 to 7,191 in 2010.
The female to male ratio 2:1steadily from 2003 to 2010. Whites accounted for the
majority of the hospitalizations 51.6% overall the years.
46

Figure.5. Hospitalizations for Temporomandibular Disorders by year.
Eight-year trends
The trends of hospitalization-level factors are shown on Figures. The number of
hospitalizations decreased in general and ranged from 9,479 in 2003 to 7,191 in 2010.
The female to male ratio 2:1steadily from 2003 to 2010. Whites accounted for the
majority of the hospitalizations 51.6% overall the years.
47
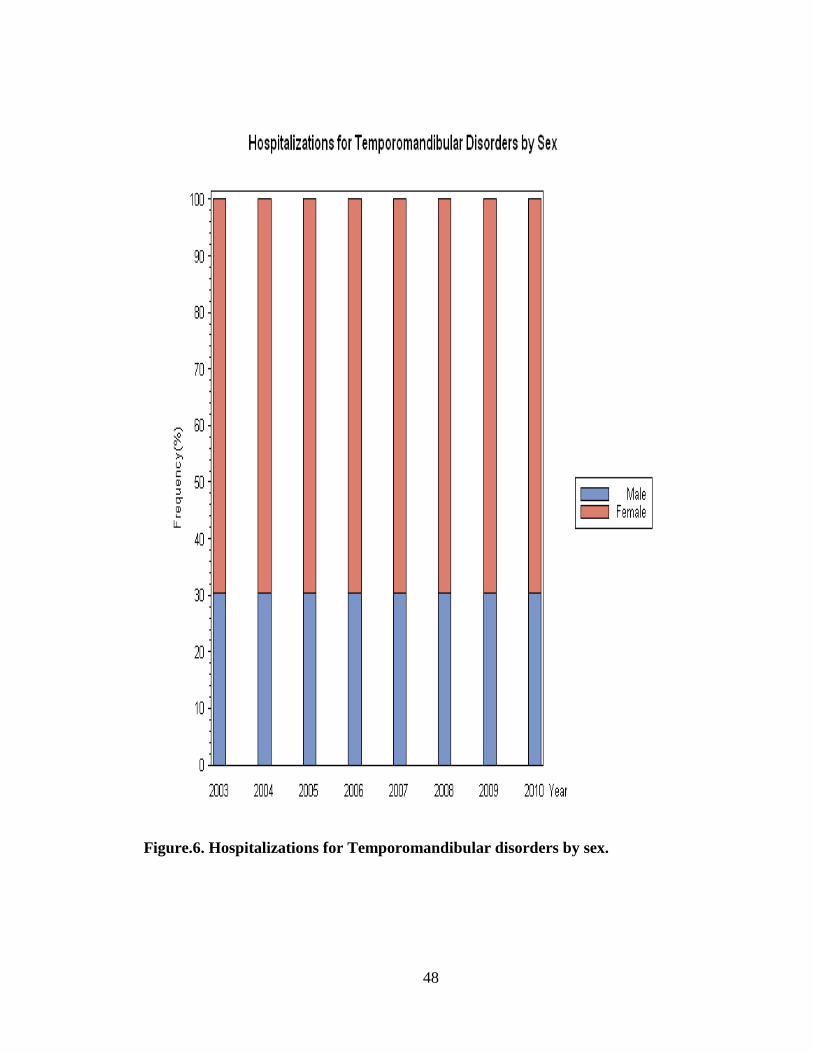
Figure.6. Hospitalizations for Temporomandibular disorders by sex.
48
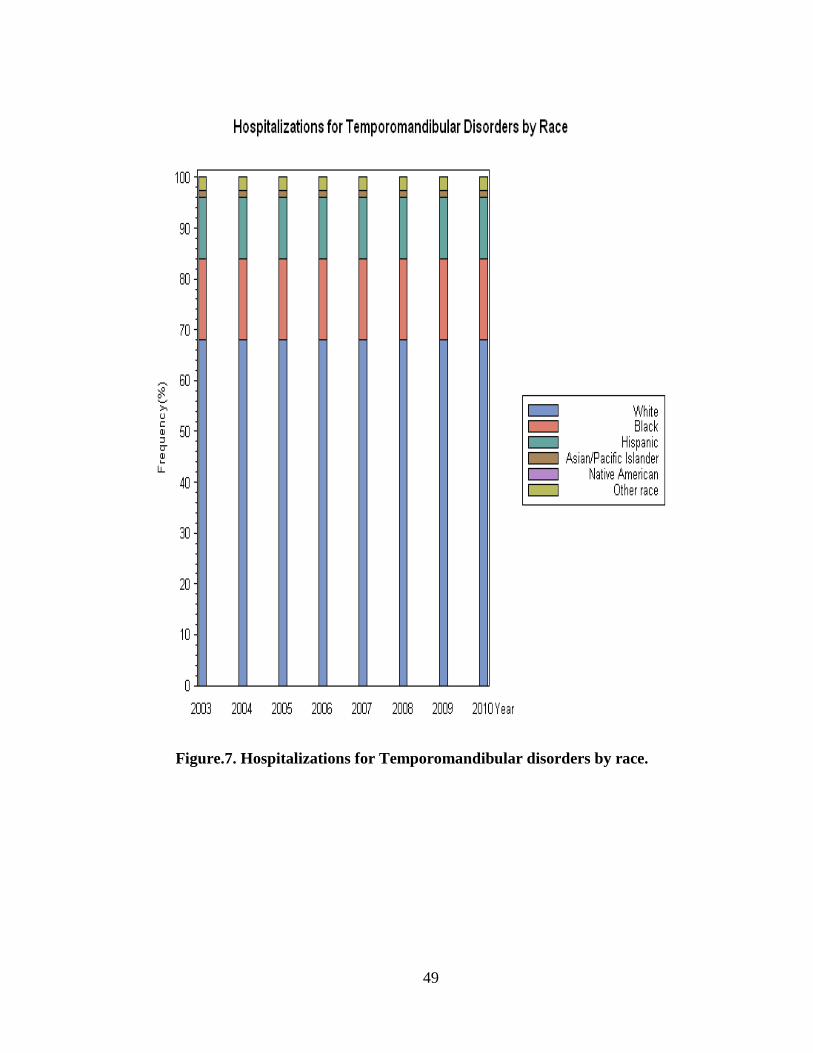
Figure.7. Hospitalizations for Temporomandibular disorders by race.
49
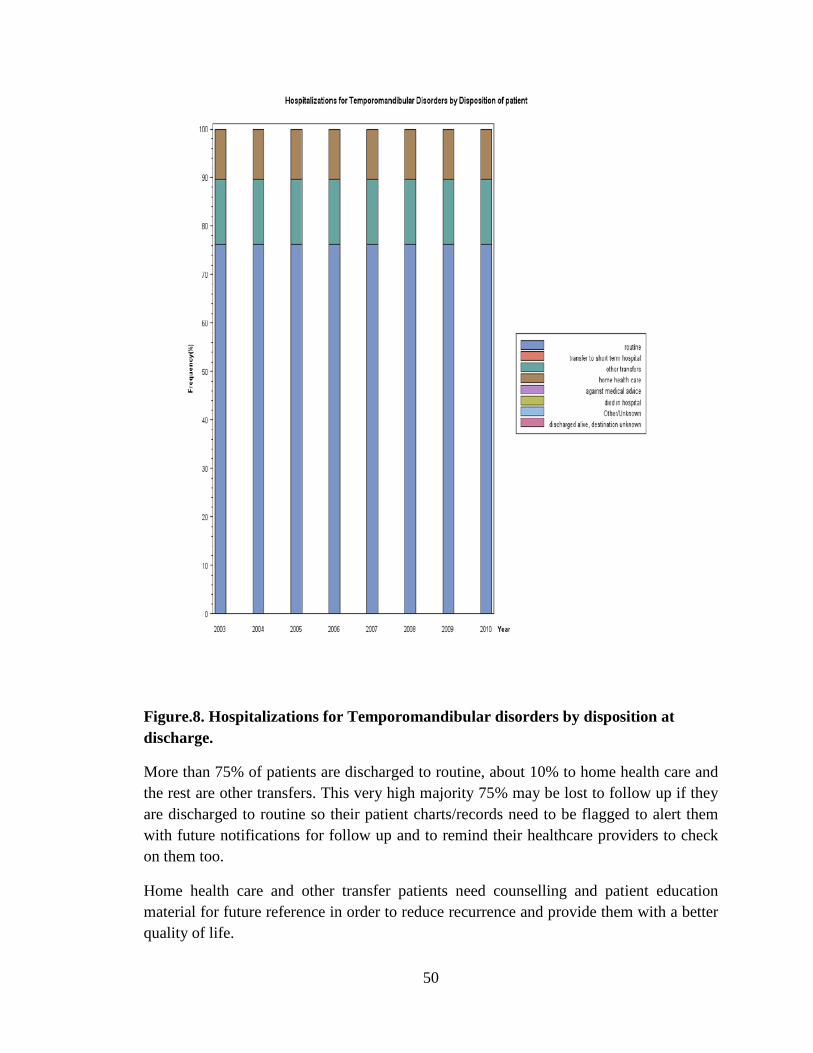
Figure.8. Hospitalizations for Temporomandibular disorders by disposition at discharge.
More than 75% of patients are discharged to routine, about 10% to home health care and the rest are other transfers. This very high majority 75% may be lost to follow up if they are discharged to routine so their patient charts/records need to be flagged to alert them with future notifications for follow up and to remind their healthcare providers to check on them too.
Home health care and other transfer patients need counselling and patient education material for future reference in order to reduce recurrence and provide them with a better quality of life.
50

Figure.9. Hospitalizations for Temporomandibular disorders by disposition at discharge.
The majority of patients are discharged to routine, about 10% to home health care, a small proportion to skilled nursing facilities and the rest are other rehabilitation facilities or other transfers. This very high majority discharged to routine may be lost to follow up so their patient charts/records need to be flagged to alert them with future notifications for follow up and to remind their healthcare providers to check on them too.
Skilled nursing facilities and home health care providers all need TMD educational material too because TMD is a complex disorder with many variables and it needs diligent attention by healthcare providers as well as patients in order to avoid future episodes, reduce chronic pain and improve patients quality of life.
51

Figure.10. Hospitalizations for Temporomandibular disorders by primary expected payer.
52
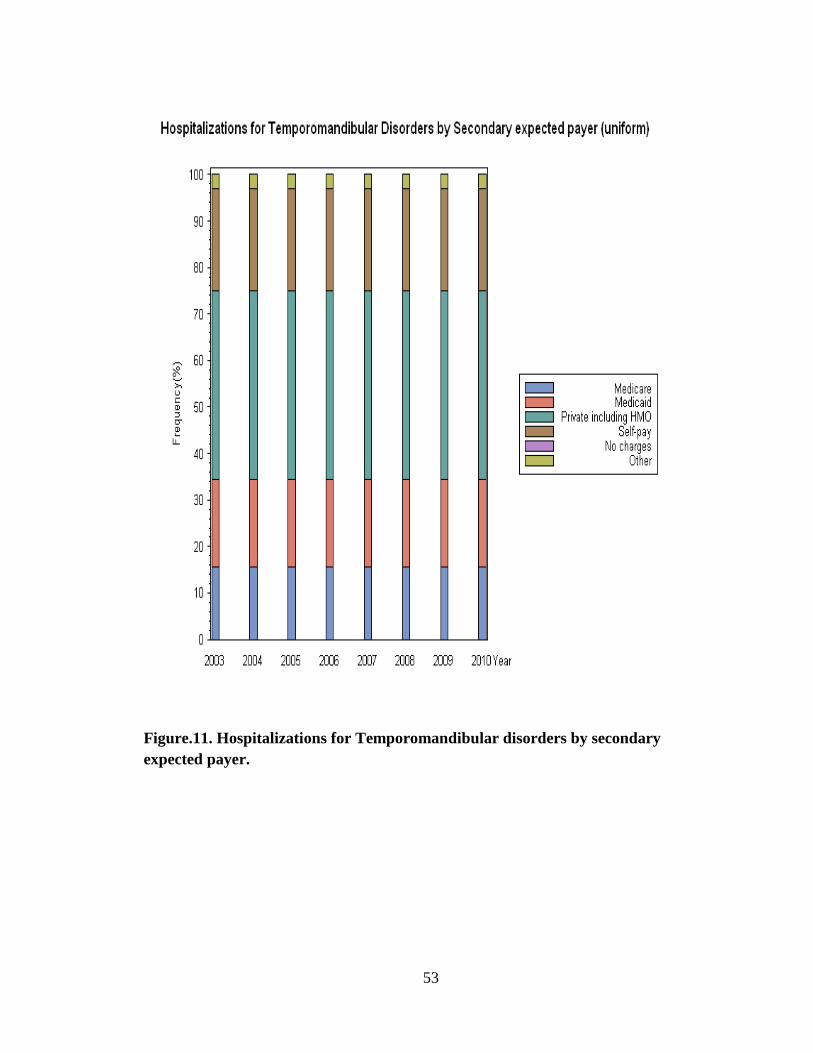
Figure.11. Hospitalizations for Temporomandibular disorders by secondary expected payer.
53

Privately insured patients form the majority of TMD inpatients even as secondary expected payers, more than self-paying inpatients. This indicates that these patients are unaware of their condition early on and are left to wander until an acute event leads them into ER. This also shows the misdiagnosis and or confused diagnosis masked by related disorders and the lack of TMD Specialists at ER and Inpatient settings. It further confirms the need to have TMD guidelines available at ER and inpatient settings and with multidisciplinary Specialists who handle pain management and other TMD related disorders.
Figure.12. Hospitalizations for Temporomandibular disorders by TMD
related diagnosis.
0500
100015002000250030003500
2003 2004 2005 2006 2007 2008 2009 2010
TMD Related Diagnosis in frequency per year 2003-2010
Tens Head Mig Aura Mig wo Au Clus Head Musc Spas
Cv Strain Myofascitis Cvglia TMJD Rheum Art
54

As seen on the chart above pain is one of the main disorders related to
temporomandibular disorder; Tension Type Headache, Migraine with and without aura,
and Cluster Headaches are prominently associated with TMD. Since causes of headaches
are more difficult to distinguish their frequency of occurrence remains on somewhat the
same level slightly increasing or decreasing over the years. A more specifically related
type of pain such as Cervical Strain Injury, Cervicalgia, and Myofascitis occurs in higher
frequency in relation to TMD as is expected. Cervical Strain Injury was highest in 2004
but tapered down lower than Cervicalgia and Myofascitis, perhaps with better control of
all three conditions.
Table.5. Hospitalizations for Temporomandibular disorders by TMD related diagnosis.
55

However, the highest frequency of occurrence is of Rheumatoid Arthritis, which is only
expected of late phase RA from clinical experience. Since AR patients are more aware of
their condition and its related disorders they are more likely to seek medical care for
TMD.
TMD is the lowest frequency on the chart above which could be attributed to its
misdiagnosis or that it is so masked by other disorders it is difficult to spot or treat. This
could also be considered the result of the lack of TMD Specialists at inpatient settings.
Figure.13. Comorbidity Measure with Temporomandibular Disorders-
all Years hospitalizations from 2003 to 2010
56

This chart shows comorbidities with TMD versus the next chart which shows comorbidities without TMD. Hypertension represented by the olive green part of the pipe is the major comorbidity consistently from 2003-2010. The yellow section demonstrates Chronic Pulmonary Disease, the maroon pipe section is Depression and the leaf green is uncomplicated Diabetes and the bright red on the left is deficiency Anemias.
This clearly indicates that hypertension plays a major role in TMD, in contrast to previous literature which states no correlation between hypertension and TMD. Hypertension and stress are directly related and stress is one of the main factors associated with TMD patients.
Chronic Pulmonary Disease patients tend to use their mouth to breathe in compensation for their difficulty in breathing through their regular airways. This compensation could in long terms affect their TMJ.
Depression is also associated with stress which could contribute to TMD. Weight loss, Uncomplicated Diabetes and deficiency Anemias seem to also play a role in TMD. Further investigation is warranted to understand how all these conditions are related and what could be done to alleviate further suffering leading to TMD.
57

Figure.14. Comorbidity Measure without Temporomandibular Disorders
– all Years hospitalizations from 2003 to 2010
58
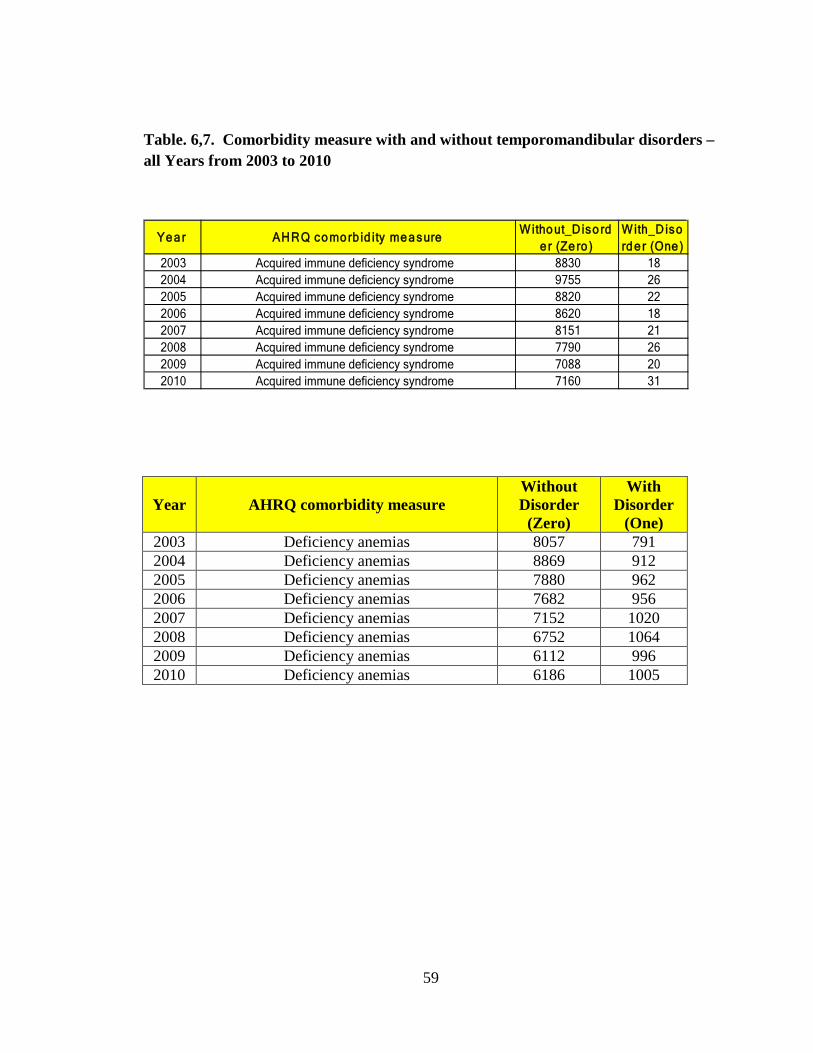
Table. 6,7. Comorbidity measure with and without temporomandibular disorders – all Years from 2003 to 2010
Year AHRQ comorbidity measure Without Disorder
(Zero)
With Disorder
(One) 2003 Deficiency anemias 8057 791 2004 Deficiency anemias 8869 912 2005 Deficiency anemias 7880 962 2006 Deficiency anemias 7682 956 2007 Deficiency anemias 7152 1020 2008 Deficiency anemias 6752 1064 2009 Deficiency anemias 6112 996 2010 Deficiency anemias 6186 1005
Ye a r AHRQ co mo rb id ity me a sureWitho ut_Diso rd
e r (Ze ro )With_Disord e r (One )
2003 Acquired immune deficiency syndrome 8830 182004 Acquired immune deficiency syndrome 9755 262005 Acquired immune deficiency syndrome 8820 222006 Acquired immune deficiency syndrome 8620 182007 Acquired immune deficiency syndrome 8151 212008 Acquired immune deficiency syndrome 7790 262009 Acquired immune deficiency syndrome 7088 202010 Acquired immune deficiency syndrome 7160 31
59
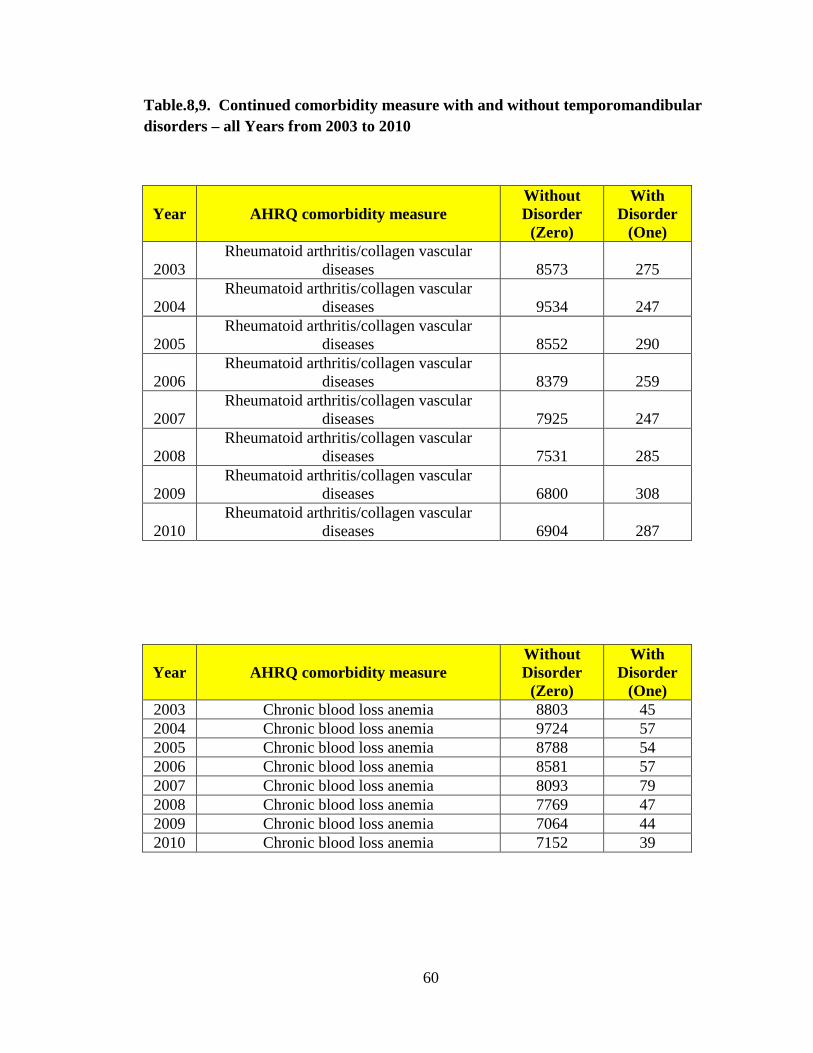
Table.8,9. Continued comorbidity measure with and without temporomandibular disorders – all Years from 2003 to 2010
Year AHRQ comorbidity measure Without Disorder
(Zero)
With Disorder
(One)
2003 Rheumatoid arthritis/collagen vascular
diseases 8573 275
2004 Rheumatoid arthritis/collagen vascular
diseases 9534 247
2005 Rheumatoid arthritis/collagen vascular
diseases 8552 290
2006 Rheumatoid arthritis/collagen vascular
diseases 8379 259
2007 Rheumatoid arthritis/collagen vascular
diseases 7925 247
2008 Rheumatoid arthritis/collagen vascular
diseases 7531 285
2009 Rheumatoid arthritis/collagen vascular
diseases 6800 308
2010 Rheumatoid arthritis/collagen vascular
diseases 6904 287
Year AHRQ comorbidity measure Without Disorder
(Zero)
With Disorder
(One) 2003 Chronic blood loss anemia 8803 45 2004 Chronic blood loss anemia 9724 57 2005 Chronic blood loss anemia 8788 54 2006 Chronic blood loss anemia 8581 57 2007 Chronic blood loss anemia 8093 79 2008 Chronic blood loss anemia 7769 47 2009 Chronic blood loss anemia 7064 44 2010 Chronic blood loss anemia 7152 39
60
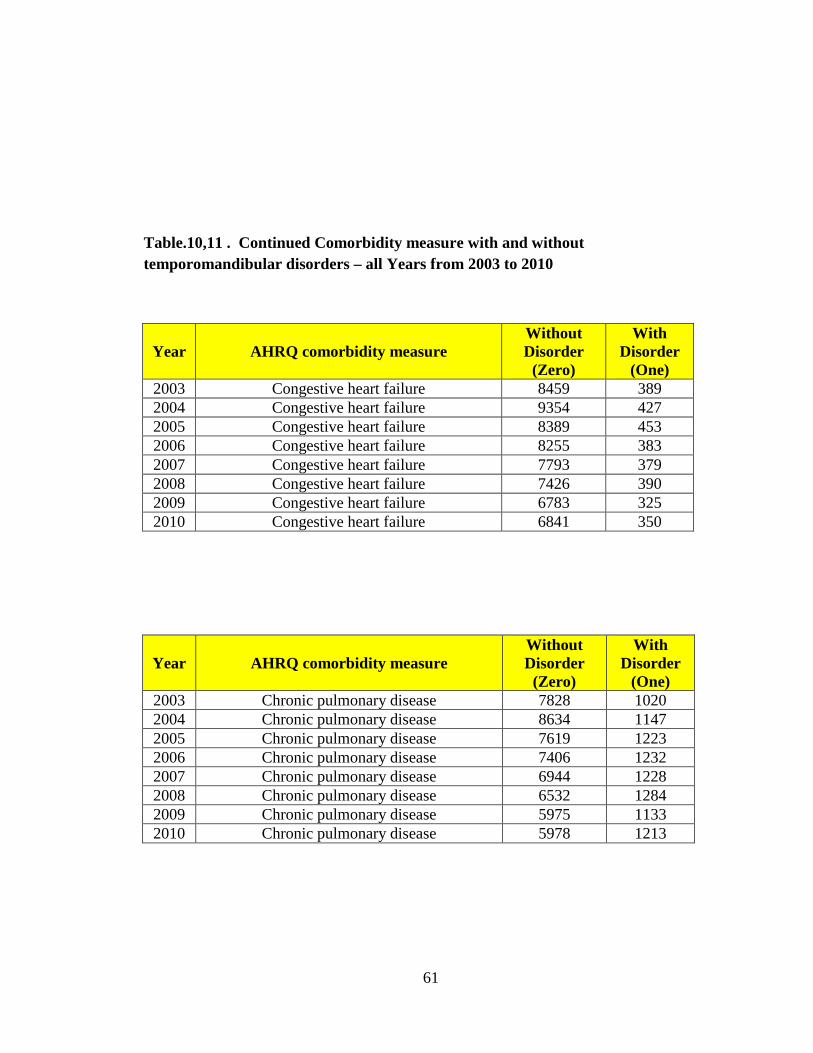
Table.10,11 . Continued Comorbidity measure with and without temporomandibular disorders – all Years from 2003 to 2010
Year AHRQ comorbidity measure Without Disorder
(Zero)
With Disorder
(One) 2003 Congestive heart failure 8459 389 2004 Congestive heart failure 9354 427 2005 Congestive heart failure 8389 453 2006 Congestive heart failure 8255 383 2007 Congestive heart failure 7793 379 2008 Congestive heart failure 7426 390 2009 Congestive heart failure 6783 325 2010 Congestive heart failure 6841 350
Year AHRQ comorbidity measure Without Disorder
(Zero)
With Disorder
(One) 2003 Chronic pulmonary disease 7828 1020 2004 Chronic pulmonary disease 8634 1147 2005 Chronic pulmonary disease 7619 1223 2006 Chronic pulmonary disease 7406 1232 2007 Chronic pulmonary disease 6944 1228 2008 Chronic pulmonary disease 6532 1284 2009 Chronic pulmonary disease 5975 1133 2010 Chronic pulmonary disease 5978 1213
61

Table.12,13. Continued comorbidity measure with and without temporomandibular disorders – all Years from 2003 to 2010
Year AHRQ comorbidity measure Without Disorder
(Zero)
With Disorder
(One) 2003 Coagulopathy 8761 87 2004 Coagulopathy 9694 87 2005 Coagulopathy 8746 96 2006 Coagulopathy 8548 90 2007 Coagulopathy 8073 99 2008 Coagulopathy 7696 120 2009 Coagulopathy 6986 122 2010 Coagulopathy 7047 144
Year AHRQ comorbidity measure Without Disorder
(Zero)
With Disorder
(One) 2003 Depression 7935 913 2004 Depression 8765 1016 2005 Depression 7822 1020 2006 Depression 7567 1071 2007 Depression 7106 1066 2008 Depression 6792 1024 2009 Depression 6225 883 2010 Depression 6138 1053
62
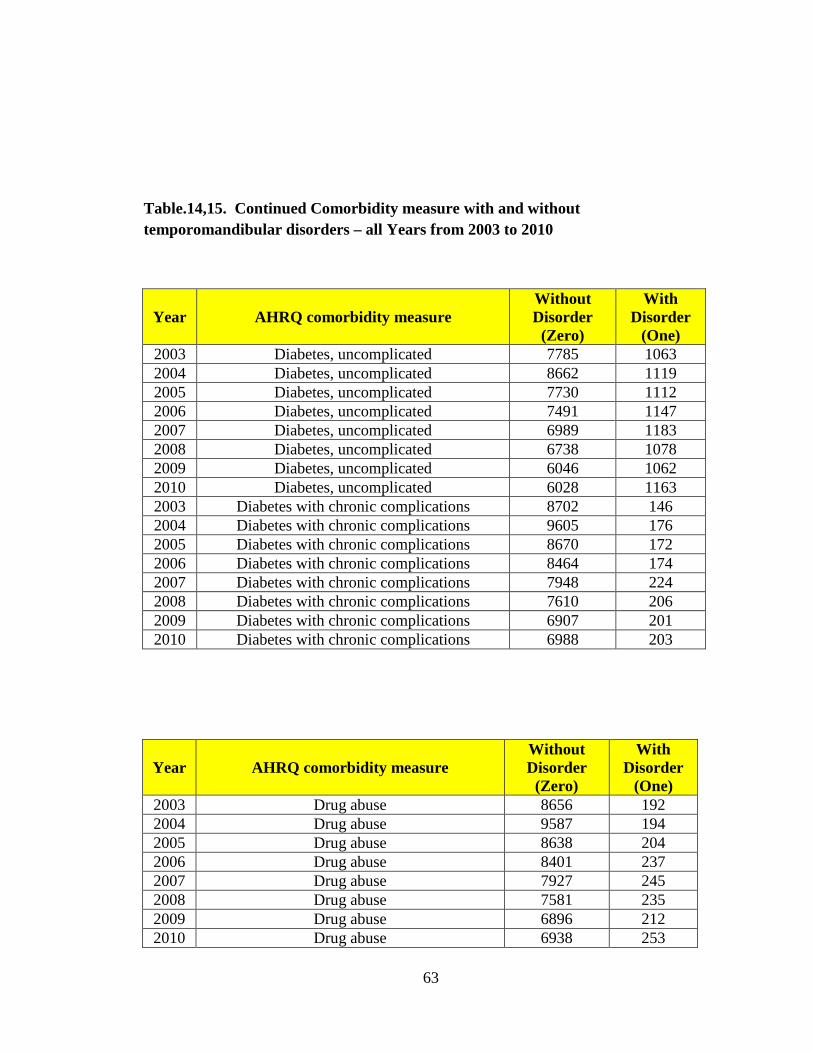
Table.14,15. Continued Comorbidity measure with and without temporomandibular disorders – all Years from 2003 to 2010
Year AHRQ comorbidity measure Without Disorder
(Zero)
With Disorder
(One) 2003 Diabetes, uncomplicated 7785 1063 2004 Diabetes, uncomplicated 8662 1119 2005 Diabetes, uncomplicated 7730 1112 2006 Diabetes, uncomplicated 7491 1147 2007 Diabetes, uncomplicated 6989 1183 2008 Diabetes, uncomplicated 6738 1078 2009 Diabetes, uncomplicated 6046 1062 2010 Diabetes, uncomplicated 6028 1163 2003 Diabetes with chronic complications 8702 146 2004 Diabetes with chronic complications 9605 176 2005 Diabetes with chronic complications 8670 172 2006 Diabetes with chronic complications 8464 174 2007 Diabetes with chronic complications 7948 224 2008 Diabetes with chronic complications 7610 206 2009 Diabetes with chronic complications 6907 201 2010 Diabetes with chronic complications 6988 203
Year AHRQ comorbidity measure Without Disorder
(Zero)
With Disorder
(One) 2003 Drug abuse 8656 192 2004 Drug abuse 9587 194 2005 Drug abuse 8638 204 2006 Drug abuse 8401 237 2007 Drug abuse 7927 245 2008 Drug abuse 7581 235 2009 Drug abuse 6896 212 2010 Drug abuse 6938 253
63

Table.16,17. Continued Comorbidity measure with and without temporomandibular disorders – all Years from 2003 to 2010
Year AHRQ comorbidity measure Without Disorder
(Zero)
With Disorder
(One)
2003 Hypertension (combine uncomplicated and
complicated) 5672 3176
2004 Hypertension (combine uncomplicated and
complicated) 6234 3547
2005 Hypertension (combine uncomplicated and
complicated) 5333 3509
2006 Hypertension (combine uncomplicated and
complicated) 5224 3414
2007 Hypertension (combine uncomplicated and
complicated) 4697 3475
2008 Hypertension (combine uncomplicated and
complicated) 4318 3498
2009 Hypertension (combine uncomplicated and
complicated) 3935 3173
2010 Hypertension (combine uncomplicated and
complicated) 3869 3322
Year AHRQ comorbidity measure Without Disorder
(Zero)
With Disorder
(One) 2003 Hypothyroidism 8116 732 2004 Hypothyroidism 8976 805 2005 Hypothyroidism 7976 866 2006 Hypothyroidism 7804 834 2007 Hypothyroidism 7344 828 2008 Hypothyroidism 6909 907 2009 Hypothyroidism 6332 776 2010 Hypothyroidism 6353 838
64

Table.18,19. Continued Comorbidity measure with and without temporomandibular disorders – all Years from 2003 to 2010
Year AHRQ comorbidity measure Without Disorder
(Zero)
With Disorder
(One) 2003 Liver disease 8739 109 2004 Liver disease 9670 111 2005 Liver disease 8733 109 2006 Liver disease 8528 110 2007 Liver disease 8054 118 2008 Liver disease 7707 109 2009 Liver disease 6997 111 2010 Liver disease 7073 118
Year AHRQ comorbidity measure Without Disorder
(Zero)
With Disorder
(One) 2003 Lymphoma 8818 30 2004 Lymphoma 9757 24 2005 Lymphoma 8812 30 2006 Lymphoma 8611 27 2007 Lymphoma 8144 28 2008 Lymphoma 7778 38 2009 Lymphoma 7089 19 2010 Lymphoma 7158 33
65
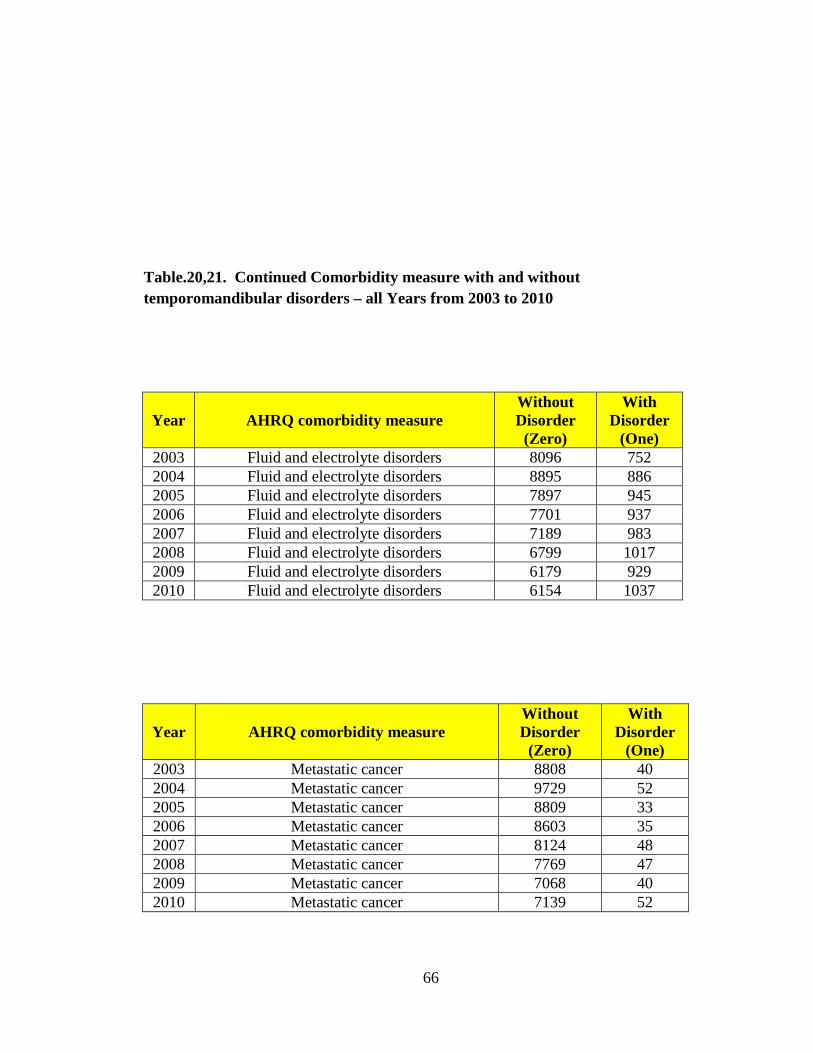
Table.20,21. Continued Comorbidity measure with and without temporomandibular disorders – all Years from 2003 to 2010
Year AHRQ comorbidity measure Without Disorder
(Zero)
With Disorder
(One) 2003 Fluid and electrolyte disorders 8096 752 2004 Fluid and electrolyte disorders 8895 886 2005 Fluid and electrolyte disorders 7897 945 2006 Fluid and electrolyte disorders 7701 937 2007 Fluid and electrolyte disorders 7189 983 2008 Fluid and electrolyte disorders 6799 1017 2009 Fluid and electrolyte disorders 6179 929 2010 Fluid and electrolyte disorders 6154 1037
Year AHRQ comorbidity measure Without Disorder
(Zero)
With Disorder
(One) 2003 Metastatic cancer 8808 40 2004 Metastatic cancer 9729 52 2005 Metastatic cancer 8809 33 2006 Metastatic cancer 8603 35 2007 Metastatic cancer 8124 48 2008 Metastatic cancer 7769 47 2009 Metastatic cancer 7068 40 2010 Metastatic cancer 7139 52
66

Table.22,23. Continued Comorbidity measure with and without temporomandibular disorders – all Years from 2003 to 2010
Year AHRQ comorbidity measure Without Disorder
(Zero)
With Disorder
(One) 2003 Other neurological disorders 8540 308 2004 Other neurological disorders 9478 303 2005 Other neurological disorders 8520 322 2006 Other neurological disorders 8341 297 2007 Other neurological disorders 7826 346 2008 Other neurological disorders 7469 347 2009 Other neurological disorders 6738 370 2010 Other neurological disorders 6793 398
Year AHRQ comorbidity measure Without Disorder
(Zero)
With Disorder
(One) 2003 Obesity 8414 434 2004 Obesity 9258 523 2005 Obesity 8300 542 2006 Obesity 8060 578 2007 Obesity 7547 625 2008 Obesity 7186 630 2009 Obesity 6497 611 2010 Obesity 6504 687
67

Table.24,25. Continued Comorbidity measure with and without temporomandibular disorders – all Years from 2003 to 2010
Year AHRQ comorbidity measure Without Disorder
(Zero)
With Disorder
(One) 2003 Paralysis 8656 192 2004 Paralysis 9575 206 2005 Paralysis 8645 197 2006 Paralysis 8457 181 2007 Paralysis 8013 159 2008 Paralysis 7654 162 2009 Paralysis 6956 152 2010 Paralysis 7017 174
Year AHRQ comorbidity measure Without Disorder
(Zero)
With Disorder
(One) 2003 Psychoses 8593 255 2004 Psychoses 9518 263 2005 Psychoses 8557 285 2006 Psychoses 8332 306 2007 Psychoses 7885 287 2008 Psychoses 7488 328 2009 Psychoses 6808 300 2010 Psychoses 6850 341
68

Table.26,27. Continued Comorbidity measure with and without temporomandibular disorders – all Years from 2003 to 2010
Year AHRQ comorbidity measure Without Disorder
(Zero)
With Disorder
(One) 2003 Pulmonary circulation disorders 8809 39 2004 Pulmonary circulation disorders 9736 45 2005 Pulmonary circulation disorders 8798 44 2006 Pulmonary circulation disorders 8577 61 2007 Pulmonary circulation disorders 8116 56 2008 Pulmonary circulation disorders 7741 75 2009 Pulmonary circulation disorders 7005 103
Year AHRQ comorbidity measure Without Disorder
(Zero)
With Disorder
(One) 2003 Renal failure 8716 132 2004 Renal failure 9600 181 2005 Renal failure 8634 208 2006 Renal failure 8316 322 2007 Renal failure 7851 321 2008 Renal failure 7441 375 2009 Renal failure 6690 418 2010 Renal failure 6804 387
69
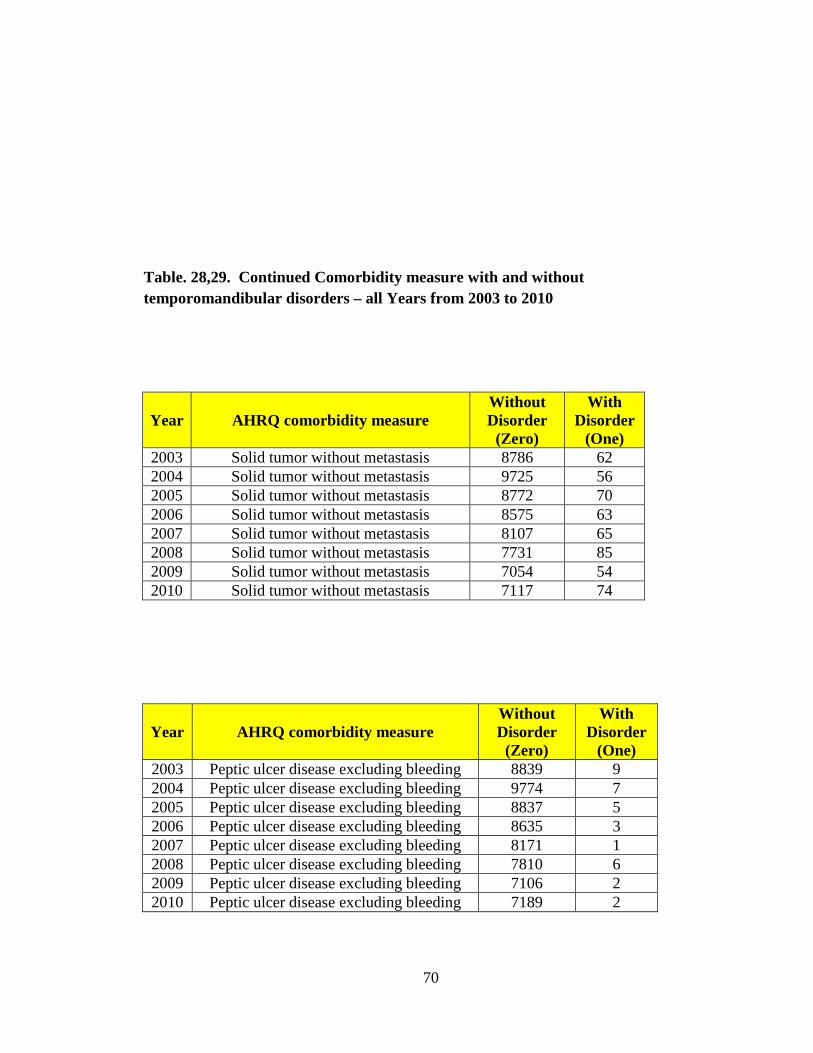
Table. 28,29. Continued Comorbidity measure with and without temporomandibular disorders – all Years from 2003 to 2010
Year AHRQ comorbidity measure Without Disorder
(Zero)
With Disorder
(One) 2003 Solid tumor without metastasis 8786 62 2004 Solid tumor without metastasis 9725 56 2005 Solid tumor without metastasis 8772 70 2006 Solid tumor without metastasis 8575 63 2007 Solid tumor without metastasis 8107 65 2008 Solid tumor without metastasis 7731 85 2009 Solid tumor without metastasis 7054 54 2010 Solid tumor without metastasis 7117 74
Year AHRQ comorbidity measure Without Disorder
(Zero)
With Disorder
(One) 2003 Peptic ulcer disease excluding bleeding 8839 9 2004 Peptic ulcer disease excluding bleeding 9774 7 2005 Peptic ulcer disease excluding bleeding 8837 5 2006 Peptic ulcer disease excluding bleeding 8635 3 2007 Peptic ulcer disease excluding bleeding 8171 1 2008 Peptic ulcer disease excluding bleeding 7810 6 2009 Peptic ulcer disease excluding bleeding 7106 2 2010 Peptic ulcer disease excluding bleeding 7189 2
70
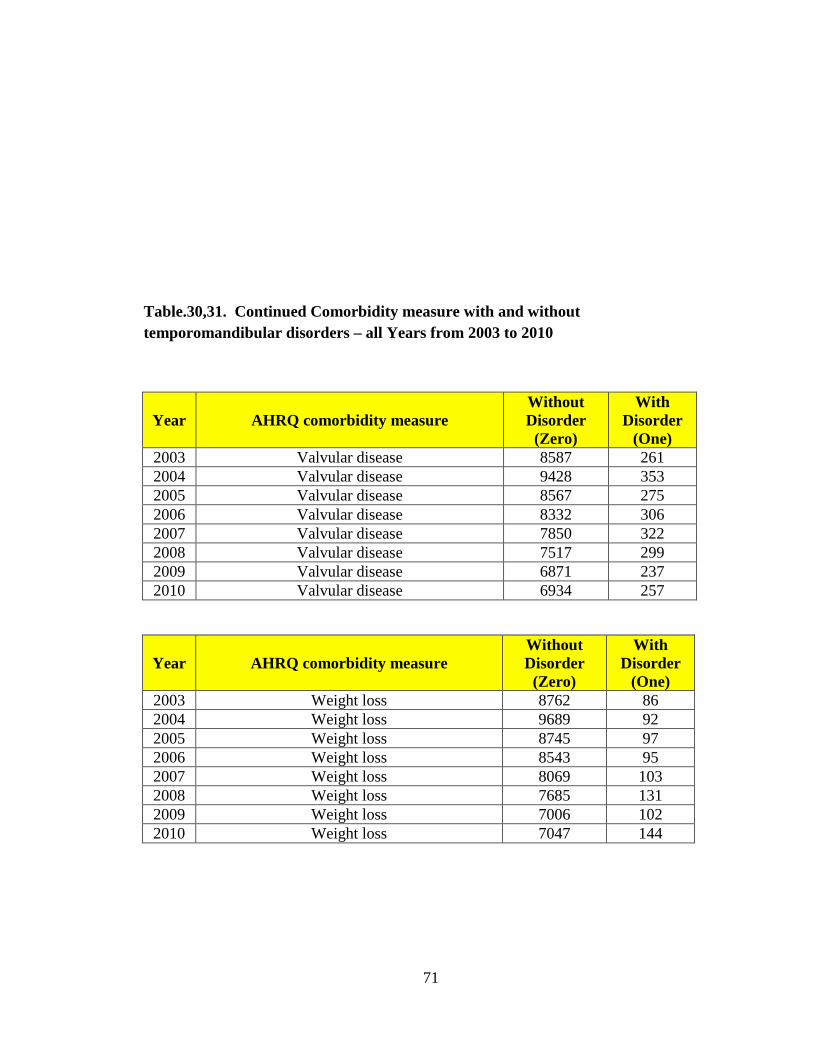
Table.30,31. Continued Comorbidity measure with and without temporomandibular disorders – all Years from 2003 to 2010
Year AHRQ comorbidity measure Without Disorder
(Zero)
With Disorder
(One) 2003 Valvular disease 8587 261 2004 Valvular disease 9428 353 2005 Valvular disease 8567 275 2006 Valvular disease 8332 306 2007 Valvular disease 7850 322 2008 Valvular disease 7517 299 2009 Valvular disease 6871 237 2010 Valvular disease 6934 257
Year AHRQ comorbidity measure Without Disorder
(Zero)
With Disorder
(One) 2003 Weight loss 8762 86 2004 Weight loss 9689 92 2005 Weight loss 8745 97 2006 Weight loss 8543 95 2007 Weight loss 8069 103 2008 Weight loss 7685 131 2009 Weight loss 7006 102 2010 Weight loss 7047 144
71
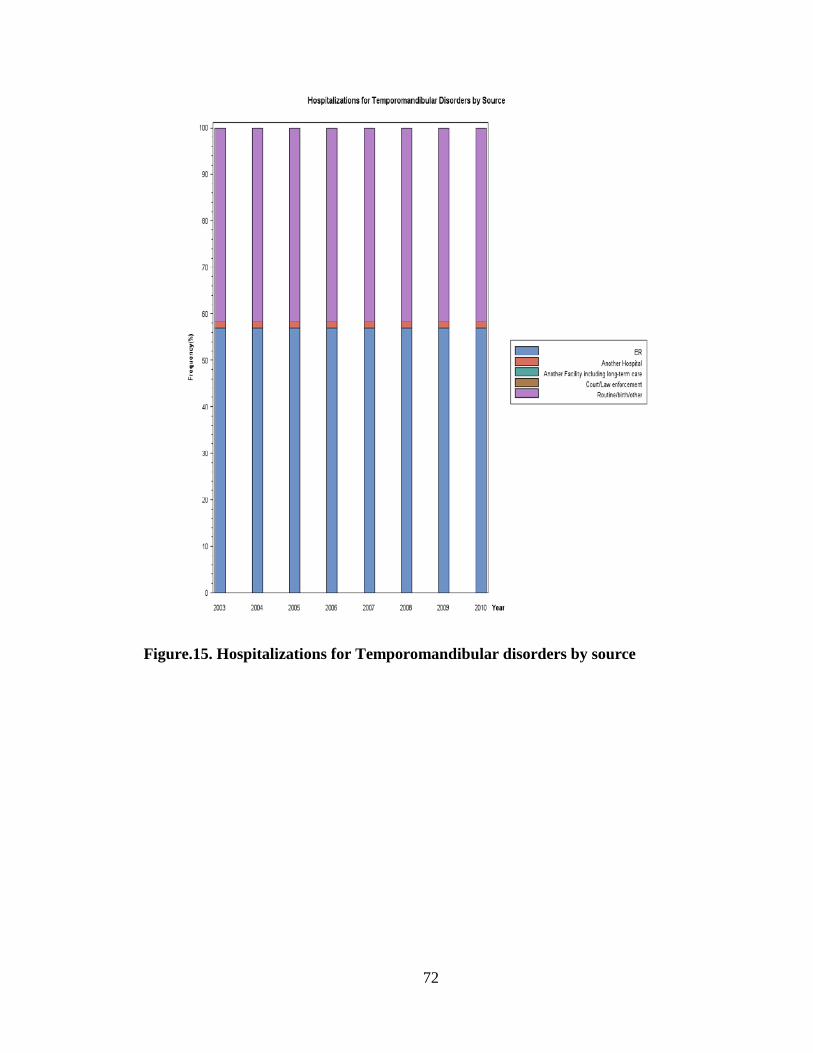
Figure.15. Hospitalizations for Temporomandibular disorders by source
72
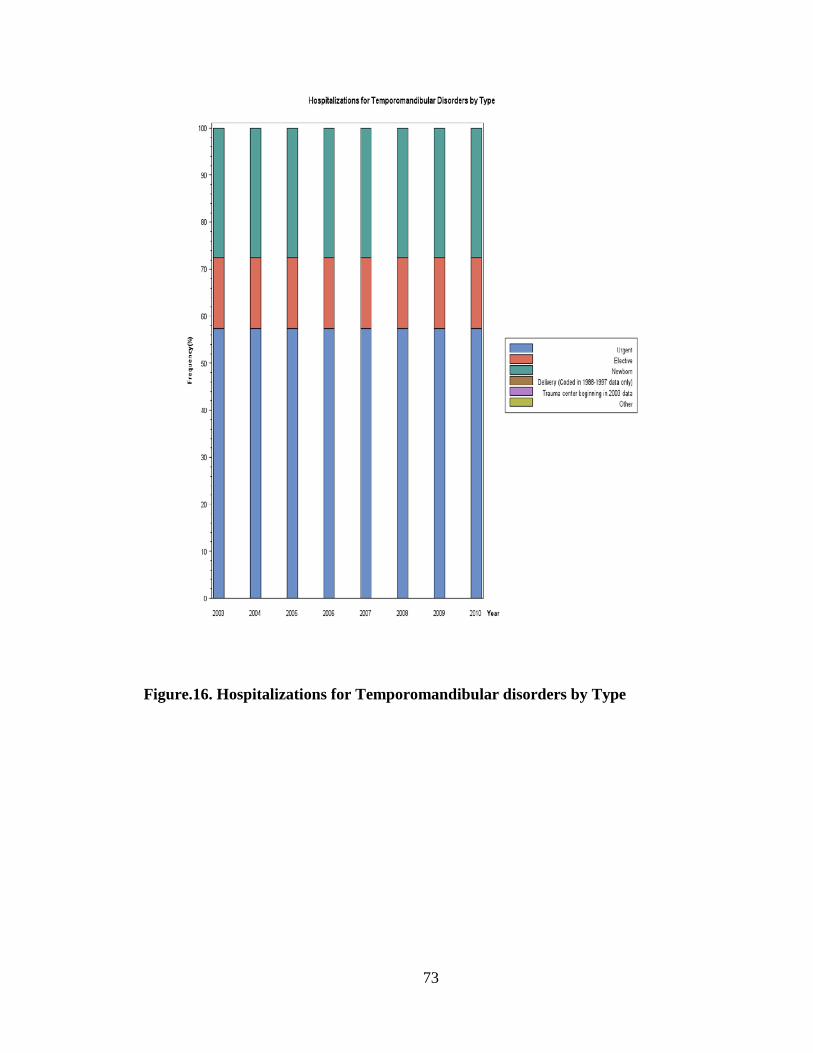
Figure.16. Hospitalizations for Temporomandibular disorders by Type
73
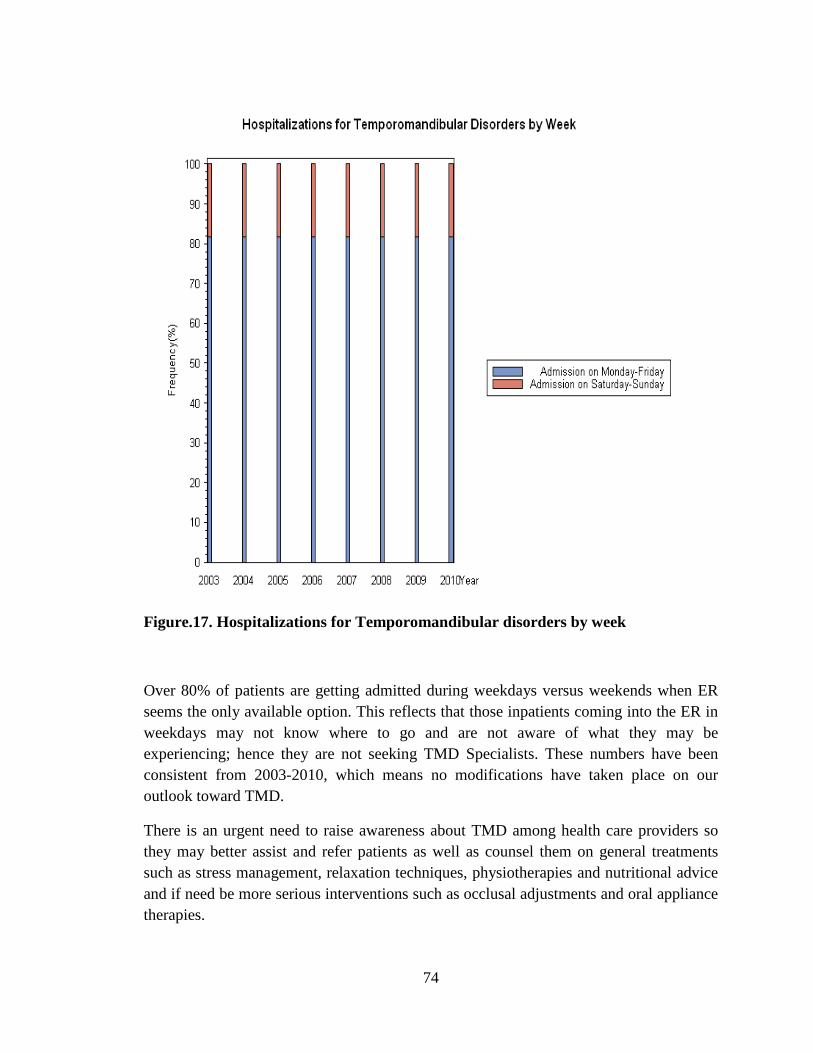
Figure.17. Hospitalizations for Temporomandibular disorders by week
Over 80% of patients are getting admitted during weekdays versus weekends when ER seems the only available option. This reflects that those inpatients coming into the ER in weekdays may not know where to go and are not aware of what they may be experiencing; hence they are not seeking TMD Specialists. These numbers have been consistent from 2003-2010, which means no modifications have taken place on our outlook toward TMD.
There is an urgent need to raise awareness about TMD among health care providers so they may better assist and refer patients as well as counsel them on general treatments such as stress management, relaxation techniques, physiotherapies and nutritional advice and if need be more serious interventions such as occlusal adjustments and oral appliance therapies.
74
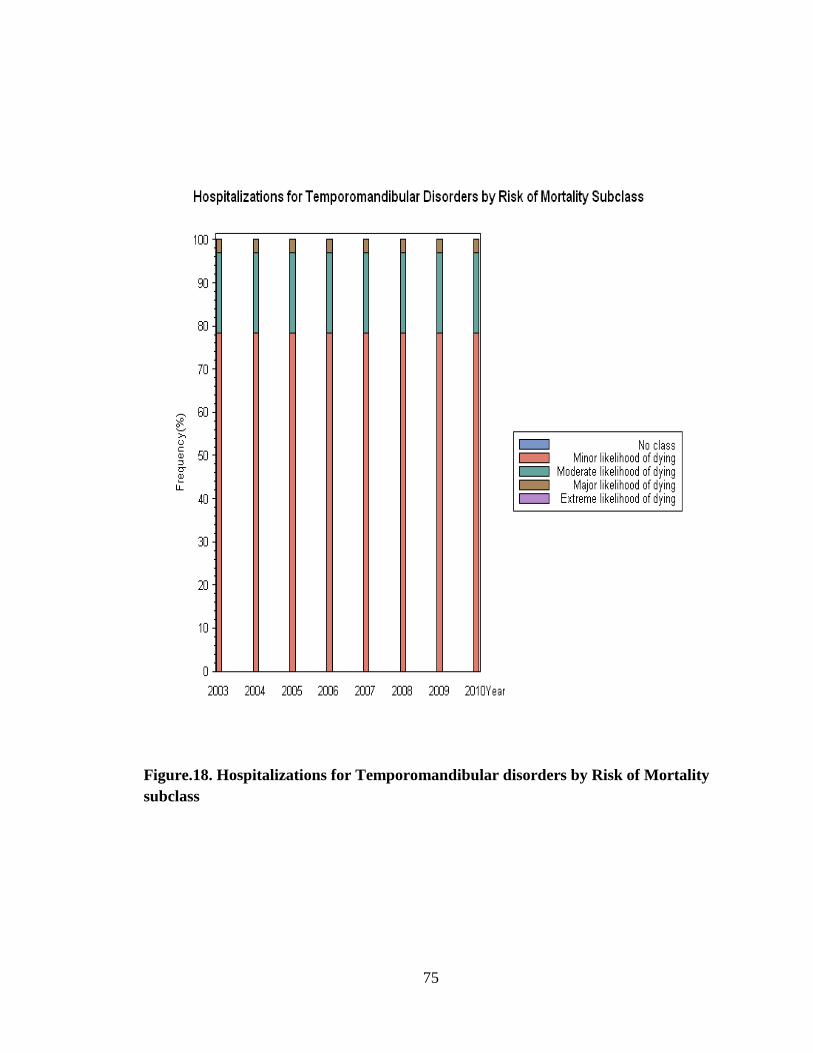
Figure.18. Hospitalizations for Temporomandibular disorders by Risk of Mortality subclass
75

Figure.19. Hospitalizations for Temporomandibular Disorders by Disease staging: Mortality level
76

Figure.20. Hospitalizations for Temporomandibular disorders by hospital location
The majority of patients are located in large metropolitan areas, then small metropolitan areas, micropolitan and other locations. Big cities attract a lot of stress factors and other variables which may contribute to TMD.
77
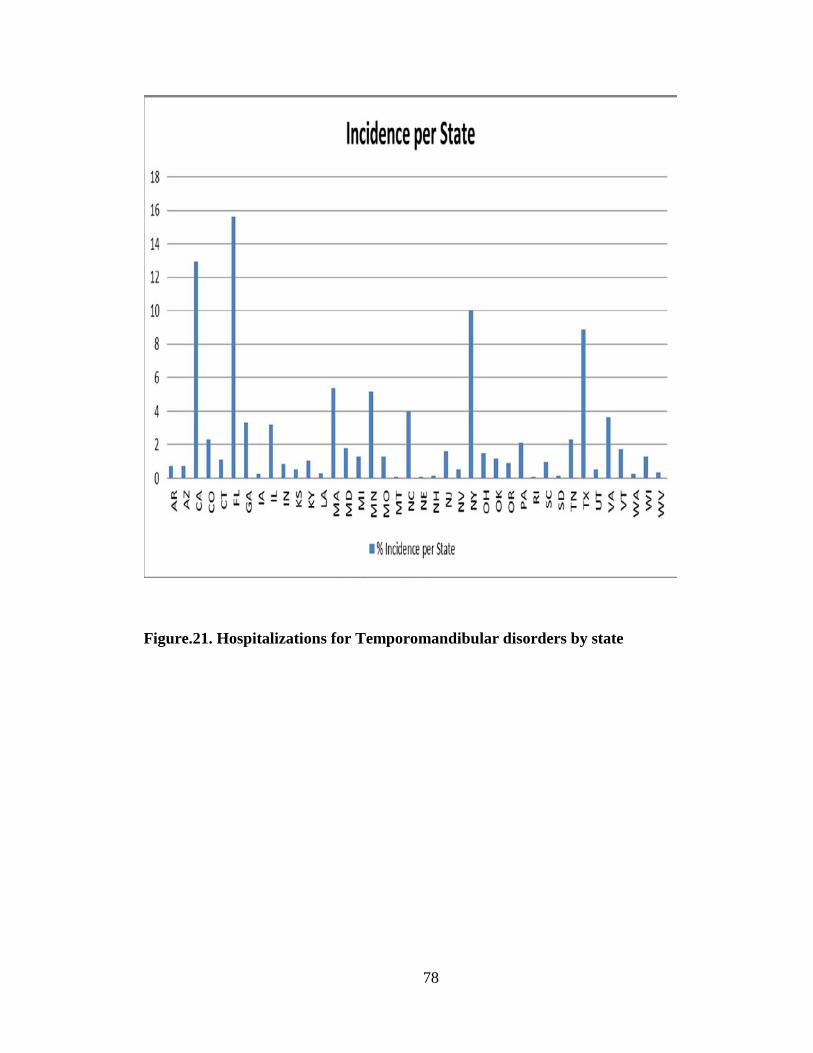
Figure.21. Hospitalizations for Temporomandibular disorders by state
78

Figure.23. Incidence and population diversity
79

Figure.24. Hospitalizations for Temporomandibular disorders by state/Prevalence.
0
10
20
30
40
50
60
CA12.92
FL15.61
MA5.38
MN5.15
MT0.07
NC3.96
NE0.07
NH0.15
NJ1.64
NY10.01
RI0.07
Tx8.89
SD0.15
VA3.66
Fem
ale
& M
ale
% o
f Pop
ulat
ion
State % Prevalence of TMD
The green line shows prevalence/state in %
Female Male Prevalence
80
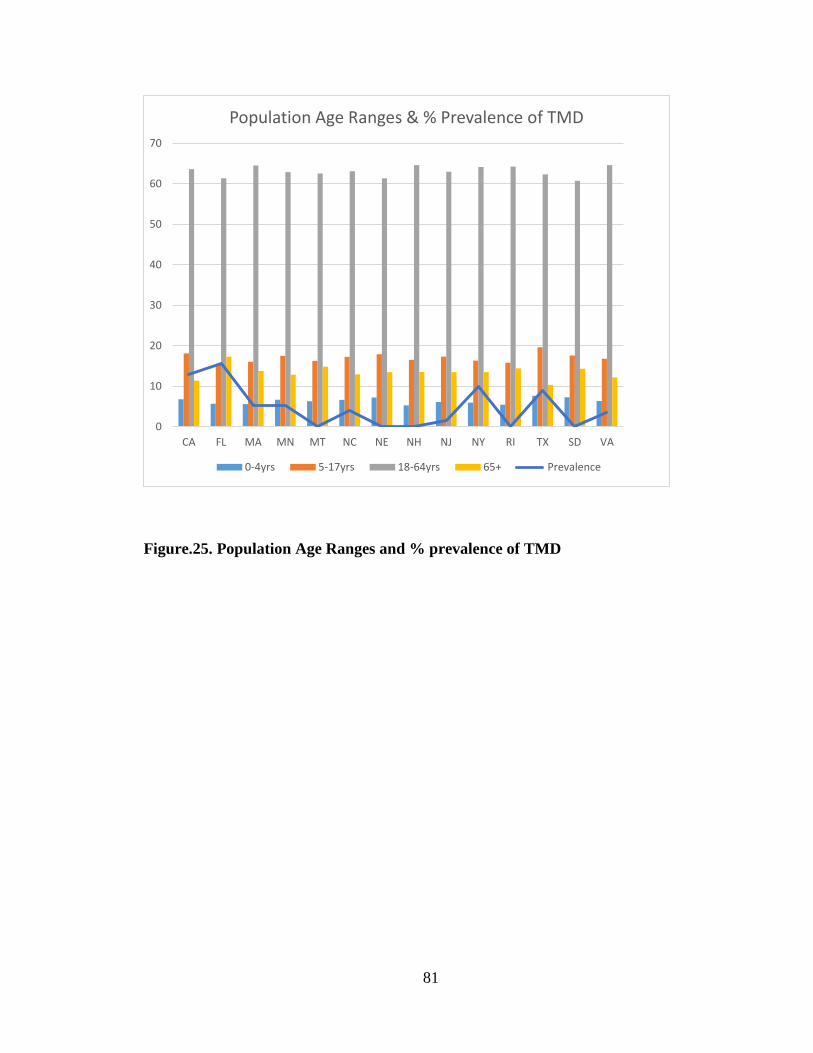
Figure.25. Population Age Ranges and % prevalence of TMD
0
10
20
30
40
50
60
70
CA FL MA MN MT NC NE NH NJ NY RI TX SD VA
Population Age Ranges & % Prevalence of TMD
0-4yrs 5-17yrs 18-64yrs 65+ Prevalence
81
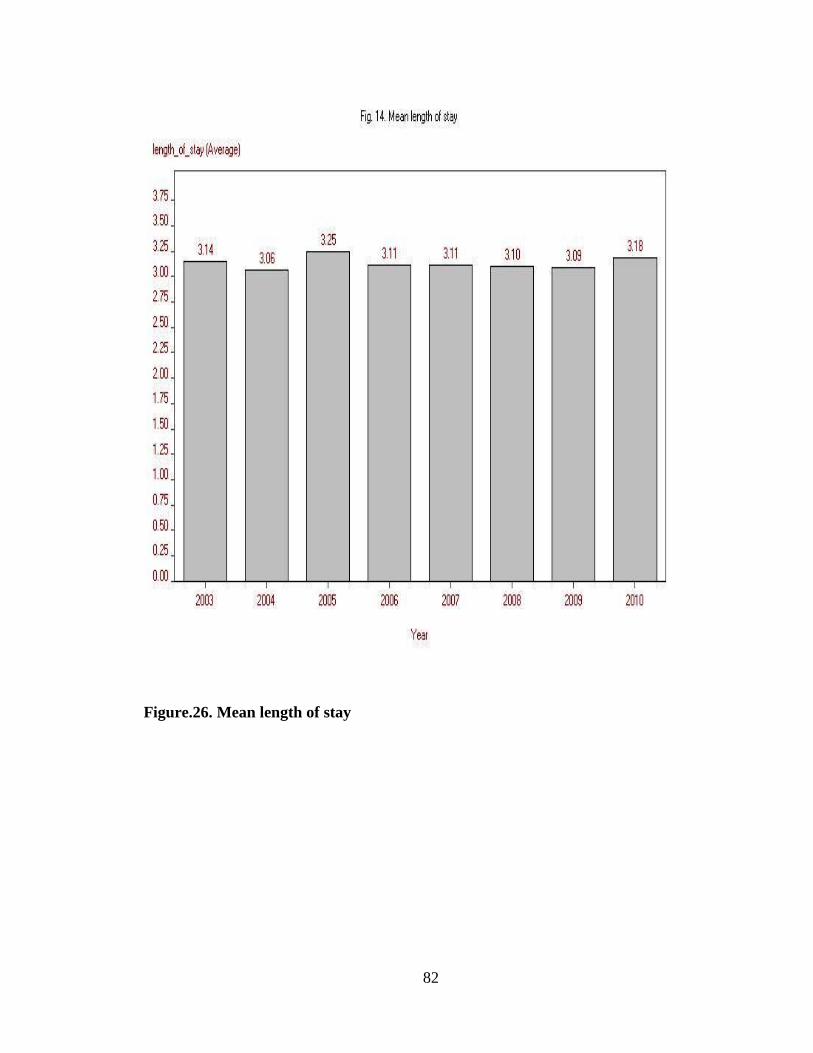
Figure.26. Mean length of stay
82
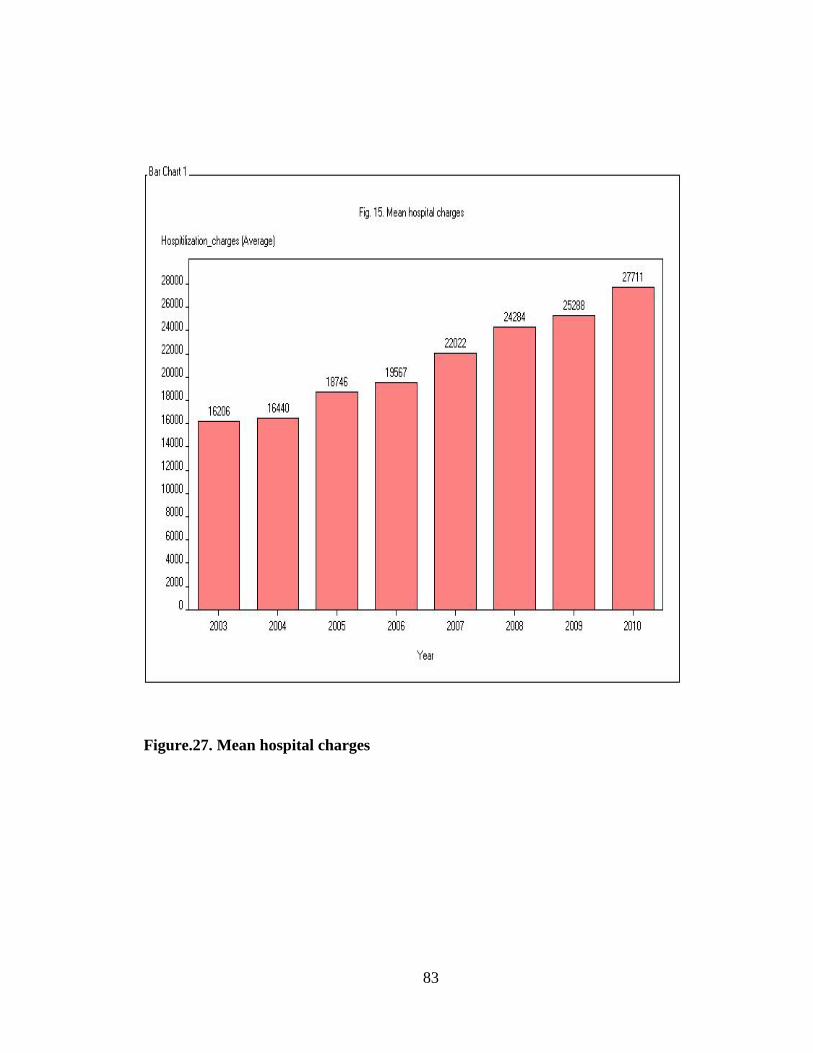
Figure.27. Mean hospital charges
83

Figure.28 . Median Household income by patient Zip code
84
Chapter V
DISCUSSION
DISCUSSION
Geography;
The high incidence of TMJ in geographic locations may be attributed to the originally high populations of these large states especially FL, Ca, NY, Tx. It may also relate to the metropolitan fast pace lifestyle and stress disorders or the different diets in diverse and densely populated urban areas. Alternatively, there may be an underlying cause for spikes of incidence at certain geographies and further investigation is thus required.
Florida with a total population 18,801,310 showed the highest incidence of 15.61% of TMD inpatients, although it has a high elderly population of 3,259,602 persons over 65 years old and 11,539,617 persons 18-64 years who are not the main culprit for TMD. Florida also showed a higher incidence of 15.61% than California of 12.92% incidence even though its population is less than half that of California which has a total population of 37,253,956 with 4,246,514
elderly over 65 years old and 23,712,402 persons 18-64 years old. Also the west coast is known for its laid back lifestyle yet California had a higher prevalence than New York. TMD is highest at age range 18-64.
New York with a total population of 19,378,102 out of which 12,435,943 persons are 18-64 years has a prevalence of 10.01% versus Texas with a total population of 25,145,561 including 15,677,851 persons 18-64 years and a prevalence of 8.89%
Texas has a dry atmosphere versus the humid Florida weather, and the geographic distribution of TMJ shows no direct co-relation and a more in depth analysis is necessary.
Massachusetts with a total population of 6,547,629 and 4,225,982 persons 18-64 years had a prevalence of 5.38% is similar to Minnesota with total population 5,303,925 and 3,336,741 persons 18-64 years and prevalence 5.15% yet these incidence rates are much higher in comparison to two other states. The two other states are North Carolina with a total population of 9,535,483 and 6,019,769 persons 18-64 years and prevalence of 3.96% and the state of Virginia with total population 8,001,024 and 5,170,410 persons 18-64 years and a prevalence of 3.66%. Although North Carolina and Virginia have almost double the populations of Massachusetts and Minnesota their incidence rates are significantly lower.
85
New Jersey on the other hand has a total population of 8,791,894 and 5,540,687 persons 18-64 years and a prevalence of only 1.64%. So although the population of NJ is closer to MA and MN its incidence rate is almost half that of NC and VA.
Fortunately some states have a very low incidence rate such as; Montana with a total population of 989,415 out of which 619,110 persons are 18-64 years and a prevalence of 0.07%. Nebraska has a total population of 1,826,341 and 1,120,443 persons 18-64 years with a prevalence of 0.07%. Rhode Island has a total population of 1,052,567 with 676,730 persons 18-64 years and a prevalence of 0.07%. Meanwhile New Hampshire has a total population of 1,316,470 with 850,968 persons 18-64 years and a prevalence of 0.15%. South Dakota has a total population of 814,180 with 494,802 persons of 18-64 years and a prevalence of 0.15%.
The prevalence of TMD in the female population far outweighs that of the male by almost five folds with an incidence rate of 81.54% female to 18.46% male.
Women in general may have a softer bone structure and they are more likely to report symptoms and more likely to seek medical attention sooner and more frequent than men. The female anatomy may also play a role of weaker jaws for example with osteoporosis & rheumatoid arthritis which are more common with women.
Women of child bearing age are more subject to risk since the common age range for TMD is 20-60 years old, peaking at 30-40years old. However, the percentages of prevalence above still do not explain why some states have a higher incidence than others. Further investigation is required at a more local level.
Race;
The Caucasian population shows a high incidence compared to minorities such as African American, Hispanic, Native American, Asian & others. This might be due to better access to healthcare or more educated diagnosis or more inclusive insurance coverage. Perhaps genetic biomarkers can help us understand why occurrence is higher in this population.
Income;
Higher income population shows more prevalence which could be attributed to higher education & hence diagnosis, better access to healthcare & broader insurance coverage. It may also reflect a different diet or lifestyle that encourages TMJ and is thus interesting to further investigate.
86

Hypertension;
Contrary to existing literature(46-50), inpatients with hypertension showed significantly higher incidence of TMJ. This may be attributed to higher stress levels being a cause for TMJ. Further investigation is necessary to assess the relation between these conditions. the relationship between chronic pain and blood pressure is much less well understood. It has been reported in a number of studies that there may be a deficiency of endogenous opioids in chronic pain patients. The blood pressure-pain relationship was studied by Bruehl et al. in 118 patients with chronic lower back pain. The main finding was that in patients in whom the duration of the pain was relatively short (less than a year) there was a weak inverse correlation between the symptoms of pain and blood pressure, but in those who had been suffering from pain for more than 2 years the correlation was positive -- those who reported more frequent or intense pain had higher blood pressures. Maixner et al. found no relationship between blood pressure and sensitivity to acute pain in patients with temporomandibular joint disorders. Thus, the normal pain-blood pressure relationship is absent or reversed in these patients, which raises questions about which comes first: Are people who do not show the usual pain-blood pressure relationship more likely to develop chronic pain, or does chronic pain impair the relationship? The effects of the duration of exposure to pain reported by Bruehl et al. favor the latter explanation, leading those authors to propose the following sequence of events: persistent pain leads to generalized arousal and elevation of blood pressure. This in turn leads to baroreceptor stimulation, which acutely lowers pain sensitivity, partly through release of endogenous opioids. However, over the long term progressive opioid dysfunction occurs, resulting in a decrease of endogenous opioids and their painkilling effects, and hence a vicious cycle whereby further pain leads to further arousal and decreased pain tolerance. Additional support for this view comes from a study showing that in women with acute pelvic pain of 2-3 days' duration, endorphin levels are increased.
Diabetes;
Some inpatients showed incidence and more studies are needed to confirm association between diabetes & TMJ.
Ankylosis;
Although a higher occurrence is expected, only a few incidences were reported. It may be due to those patients already being in the appropriate treatment regime.
A retrospective analysis of 1504 patients with primary diagnosis musculoskeletal TMJD from 2003-2010 available from HCUP member states can help us understand which geographies are more affected & why. It can help us understand which patients are high risk & why, whether women experience a higher prevalence or just differ because they
87
actually report it. We can learn about any other variables that may exist, such as co-morbidities & if any then which ones have a direct relation and what can be done about it.
Although the overall number of incidences declines, the numbers for incidences with comorbidities fluctuate randomly from 2003-2010 which may mean there is no relation or that those patients are not controlled or that there is not enough awareness for patients or providers.
Such rich data will help track and monitor patients & their TMJD progression over the years and provide a productive study of treatments available to compare safety & effectiveness as well as long term effects of these treatment options. This can offer a useful platform to investigate the reasons behind recurrence & a strategy to make educated decisions and establish preventative care that allows patients a healthier life style and is more cost effective. It can help simplify the diagnosis & direct the patients to the appropriate specialist at inpatient as well as outpatient settings.
A more in-depth analysis can provide a comparative study of facial structural damages such as jaw joint wear & tear, teeth wear & breakdown, and long term tissue damage. It can help us study craniofacial development & craniofacial microbiology & immunology. We can learn if there is any relation to oral & pharyngeal cancer or if the salivary glands & any tumors are affected.
We can also compare prevalence in the United States with the rest of the world to study causes & alternative treatment options available if any exist.
88

Chapter VI
SUMMARY AND CONCLUSIONS
Dysfunction of TMJ and associated structures can be a source of acute and chronic
recurrent orofacial pain and masticatory dysfunction. Successful treatment depends on an
accurate assessment of these disorders, therefore it must be based on a comprehensive
evaluation and accurate diagnosis.
The disorders that may affect the TMJ are similar to those involving other synovial joints;
therefore, treatment of TMD will be consistent with any other musculoskeletal disorder.
A clear understanding of the anatomy, biomechanics and possible pathologic processes
that may afflict the TMJ is necessary in order to determine an acceptable course of
treatment.
An organized approach to the assessment of the orofacial pain/TMD patients and an
accurate diagnosis is essential.
During hospital visits patients are unlikely to be seen by TMD Specialists as they do not
tend to be stationed at ER or in Wards. Therefore optimal care is not provided, nor is
there appropriate education and self-care awareness should patients experience repeat
episodes. There are no follow up visits upon discharge to prevent further deterioration
and improve preventative care and ensure an improved quality of life for the affected
individuals.
The complex nature of this condition and the lack of general familiarity with it is
confusing to both patients as well as to some health care providers too. After evaluating
the association of socio-demographics, comorbidities and related disorders of TMD using
the NIS-HCUP data several conclusions have been reached.
This investigation to establish optimal treatment for inpatients reflects the hardship faced
by Multidisciplinary Specialists in identifying TMD and distinguishing its symptoms
from the related disorders that mask it. Therefore there is a dire need to make available
89

measures and guidelines for health care providers at ER and inpatients settings as well as
at Primary care level and at Specialists offices.
In order to strategize for long term preventative care , improve patients’ quality of life
and reduce direct and indirect costs of TMD, the following suggestions are made;
• Raising awareness for patients as well as health care providers in the Orofacial
pain and associated arenas such as Neurologists, ENT Specialists, Pain
Management Specialists, and General Physiscian offices and healthcare clinics
• Making available TMD guidelines and their updates at secondary care level for
Multidisciplinary Specialists at the ER and at inpatient settings
• Also making these guidelines and their updates available along with educational
information at post discharge facilities like home health care, nursing homes,
hospices, outpatient services, rehabilitation facilities etc
• Obtaining appropriate documentation at discharge to ensure patients are not lost
to follow up and flagging these patients’ charts/medical records to alert both
patient and their health care provider for follow up after a specified time whether
or not the patient complains of any symptoms
• Setting up measures to monitor long term effects of the different treatments
available in order to establish optimal care and device a preventative approach at
local and regional levels. These measures should be structured for both
conservative treatments like counselling, stress management, physiotherapy and
nutritional advice as well as interventional treatments like Occlusal Adjustments
and Oral Appliance Therapies
• Continue to investigate and identify the likely causes, recognize socio-
demographics, TMD related disorders and comorbidities in order to develop
optimal interaction and treatment strategies that are safe, effective and
preventative and that would improve patient’s quality of life and reduce
prevalence and long term costs of TMD
• Continue to investigate in particular why prevalence is much higher in women
versus men, in the white population versus all other ethnicities, why it seems to
affect high income versus lower income brackets, metropolitan versus
90

micropolitan locations, and how depression, diabetes, chronic pulmonary disease
and especially hypertension may be related to a raised risk for TMD.
91

REFERENCES 1 Journal of Neurology, Neurosurgery, and Psychiatry 1999; 67: 141.
2 Bell WE. Clinical management of temporomandibular disorders. Chicago: Year
Book Medical, 1982.
3 Okeson JP (Ed). American Academy of orofacial pain. Orofacial Pain: Guidelines for Assessment, Diagnosis, and Management. Chicago: Quintessence, 1996.
4 Kuttila M, Kuttila S, Le Bell Y, Alanen P. Association between TMD treatment need, sick leaves, and use of health care services for adults. J Orofacial Pain 1997:11:242-248.
5 Carlsson GE, Magnusson T. Management of Temporomandibular Disorders in the general dental practice. Chicago: Quintessence, 1999.
6 Benoliel R, Sharav Y. Masticatory myofascial pain, and tension-type and chronic daily headache. In: Sharav Y, Benoliel R, editors. Orofacial pain and headache. Edinburgh: Elsevier; 2008. p. 109-28.
7 Benoliel R, Svensson P, Heir GM, Sirois D, Zakrzewska J, Oke-Nwosu J, Torres SR, Greenberg MS, Klasser GD, Katz J, Eliav E. Persistent orofacial muscle pain. Oral Dis 2011; 17 (Suppl 1):23–41.
8 De Boever JA, Nilner M, Orthlieb JD, Steenks MH; Educational Committee of the European Academy of Craniomandibular Disorders. Recommendations by the EACD for examination, diagnosis, and management of patients with temporomandibular disorders and orofacial pain by the general dental practitioner. J Orofacial Pain 2008; 22:268–78.
9 De Leeuw R, Klasser G. Orofacial pain. Guidelines for assessment, diagnosis and management, 5th Ed. The American Academy of Orofacial Pain. Quintessence; 2013.
10 Greene CS. Managing the care of patients with temporomandibular disorders: a new guideline for care. J Am Dent Assoc 2010; 141:1086–8.
11 List T, Axelsson S. Management of TMD: evidence from systematic reviews and meta-analyses. J Oral Rehabil 2010; 37:430–51.
12 Manfredini D, Guarda-Nardini L, Winocur E, Piccotti F, Ahlberg J, Lobbezoo F. Research diagnostic criteria for temporomandibular disorders: a systematic review of axis I epidemiologic findings. Oral Surg Oral Med Oral Pathol Oral Radiol Endod 2011; 112:453–62.
13 Manfredini D, Winocur E, Guarda-Nardini L, Lobbezoo F. Epidemiology of bruxism in adults: a systematic review of the literature. J Orofac Pain 2013; 27:99–110.
14 Michelotti A, Liguori R, Toriello M, D'Antò V, Vitale D, Castaldo G, Sacchetti L. Catechol-O-methyltransferase (COMT) gene polymorphisms as risk factor in
92

temporomandibular disorders patients from southern Italy. Clin J Pain 2013;Epub Feb 26.
15 Schiffman EL. Diagnostic criteria for temporomandibular disorders (DC/TMD) for clinical and research applications: recommendations of the International RDC/TMD Consortium Network and Orofacial Pain Special Interest Group. J Orofacia Pain; in press.
16 National Institute of Dental and Craniofacial Research, 2014.
17 International Association for the study of pain 2013, http://www.iasp-pain.org
18 Report of the president’s conference on examination, diagnosis and management of temporomandibular disorders. J Am Dent Assoc 1983; 106:75-7.
19 Bakke M. Jaw muscle disorders. In: Klineberg I, Jagger R. Occlusion and clinical practice. Edinburgh: Wright, 2004:75-82.
20 Weinmann JP, Sicher H. Pathology of the temporomandibular joint. In: Sarnat BG. (Ed). The temporomandibular joint. Springfield, IL: Charles C. Thomas, 1951:65-81.
21 Dworkin S, Huggins K, LeResche :. Et al. Epidemiology of signs and symptoms in temporomandibular disorders: Chronic Signs in case and controls. JADA1990:120:273-281.
22 Manc LG, DeLuke DM, CT Diagnosis of Synovial Chondromatosis of the Temporomandibular joint, AJR 148:574-576, March 1987.
23 Travel J, Simons D, Simons L, The Myofacial Trigger Point Manual.
24 Daniel M Laskin, Charles S Greene, William L. Hylander :, An Evidence-based approach to diagnosis and treatment of TMDs, 2006.
25 V. Jerolimov: Temporomandibular disorders and orofacial pain. Medical sciences 33(2009): 53-77.
26 McNeill C. Craniomandibular (TMJ) disorders- the state of the art. Part ii. Accepted diagnosis and treatment modalities. J prosthet dent 1983; 49:393-7.
27 Rollman, GB, Harris G. Percept. Psychophysics. 42: 268 1989.
28 Fillingim RB, Maixner W. Pain Forum 4(4):209-221, 1995.
29 Abubaker AO, et al. Oral Maxillofacial Surgery 51:1096-1100, 1993.
30 Aufdemorte TB, et al. Oral Medicine, Oral Surgery, Oral Pathology 61:307-314, 1986.
31 Milam SB. Oral medicine, Oral surgery, Oral pathology 64:527-532, 1987.
32 Milam SB. IASP international association for the study of pain Press 4:89-112, 1995.
33 Lesse S. Am Journal of Psychical; 124:25-40, 1968.
34 Lipsitt DR. International Journal of Psychology Medicine 1970;1:15-25
93

35 Tanne, et al. Journal of Orofacial Pain 7:156-162, 1993
36 Ingervall B., Variation of the range of movement of the mandible in relation to facial morphology in young adults. Scandinavian Journal of Dental Research. 79(2):133-40, 1971
37 Jerolimov V. Prevencija temporomandibularnih ozljeda i disfunkcija u športu. U:Valentić-Peruzović M., Jerolimov V (Ur.). Temporomandibularni poremećaji –multidisciplinarni pristup. Zagreb: Stomatološki fakultet Sveučilišta u ZagrebuI Akademija medicinskih znanosti Hrvatske, 2007:145-62.
38 Rugh JD, Solberg WK. Oral health status in the United States: temporomandibular disorders. Journal of dental education 1985; 49 (6):398-406.
39 Von Korff M et al. epidemiology of temporomandibular disorders: TMD pain compared to other common pain sites. Pain 1987; 4 (sup); S 123.
40 Agerberg G, Carlsson GE. Symptoms of functional disturbances of the masticatory system. A comparison of frequencies in a population sample and in a group of patients. Acta odontologica scandinavica 1975; 33(4):183-190.
41 Mangnusson T. five year longitudinal studies of signs and symptoms of mandibular dysfunction in adolescents. Cranio 1986;4(4):338-344.
42 Locker D, Grushka M. the impact of dental and facial pain. Journal of dental research 1987; 66 (9):1414-1417.
43 Wedel A, Carlsson GE. Sick leave in patients with functional disturbances of the masticatory system. Swedish Dental Journal 1987; 11(1-2):53-59.
44 Lipton, Shipp, Larach-Robinson the Journal of the American Dental Association 124:115, 1993.
45 International Classification of Diseases, 9th Revision,4th edition, clinical modifications, volumes 1 and 2, practice management information corporation, LA, 2005.
46 Maixner W, Fillingim R, Kincaid S, et al. Relationship between pain sensitivity and resting arterial blood pressure in patients with painful temporomandibular disorders. Psychosom Med. 1997;59(5):503-511.
47 Goulet JP. Clark GT. Flack VF. Liu C. The reproducibility of muscle and joint tenderness detection methods and maximum mandibular movement measurement for the temporomandibular system. Journal of Orofacial Pain. 12(1):17-26, 1998 Winter.
48 Chung s-C, Kim J-H, Kim H-S. Reliability and validity of the pressure pain threshold (PPT) in the TMJ capsules by electronic algometer. J Craniomand Pract 1993;11:171177.
49 Preston DC., Shapiro BE., Needle electromyography. Fundamentals, normal and abnormal patterns, Neurologic Clinics. 20(2):361-96, vi, 2002 May.
94

50 Mayer RF. The motor unit and electromyography –the legacy of Derek Denny-
Brown, Journal of the Neurological Sciences. 189(1-2):7-11, 2001 Aug 15.
95