a research project submited in partial fulfillment of …
TRANSCRIPT
OPERATIONS STRATERGIES IN KENYA’S REAL ESTATE SECTO R
STEPHEN G. NJOROGE
A RESEARCH PROJECT SUBMITED IN PARTIAL FULFILLMENT OF THE
REQUIREMENT OF THE DEGREE OF MASTER OF BUSINESS ADM INISTRATION,
SCHOOL OF BUSINESS, UNIVERSITY OF NAIROBI.
NOVEMBER 2013
ii
DECLARATION
I declare that this research project is my original work and has not been submitted in any
University.
Stephen G. Njoroge D61/61769/2010
Signed………………………………………………...Date……………………………………
This research project has been submitted for examination with my approval as the university
supervisor
Dr. X. N. Iraki
Signed ………………………………………………..Date……………………………………..
School of Business, University of Nairobi

iii
DEDICATION
I dedicate this research project to my late loving sister Betty. Although physically gone you will
always have a special place in our hearts .
iv
ACKNOWLEDGEMENT
First and foremost I give glory to the Almighty God for giving me this gracious opportunity to
undertake this project and indeed my studies at the university. It is with his grace and mercy that
I have been able to walk this journey.
Special thanks to my supervisor, Dr. Iraki for his ultimate guidance and support toward
successful completion of this research project. Tributes also go to the University of Nairobi
School of business for giving me the opportunity to carry out this study.
My sincere gratitude to all firms that give me support and cooperation especially providing with
important data necessary for this study project.
Special thanks to my parents and siblings for their unlimited moral support during the course of
my studies. You have been a source of inspiration for me.
Lastly I give thank to my comrades and friends for their moral support and words of
encouragement. I will forever be grateful to all who gave me support no matter in which way
throughout this journey, God bless you all.
v
ABSTRACT
Operations strategy is defined as the development of specific competitive strength based on the operations function that is aimed at helping an organization achieve its long-term competitive goals. The research study aimed at establishing the operation strategies in Kenya’s real estate sector. The study established that 82.3% of the sampled firms were found to have a written operations strategy. The study indicates that operations strategies are highly rated in the sector. Quality was the most adopted operations strategy with a mean score of 4.64, time had a mean score of 4.43, flexibility 3.18 and finally cost with a mean score of 3.07. The findings indicate that the sector adoptions of these strategies may have led to its growth and success in recent years. The study also sought to establish the extent of influence of business environment has on operations strategies. It was established that economic factors which included; economic growth rate, interest rates & inflation, and labour & material cost, to have the greatest influence on operations strategies scoring a mean of 3.37. Political factors had a mean score of 2.86, social 2.44 and finally technological with a mean score of 2.39. These findings indicate that real estate firms considered business environment factors when setting their operations strategies. The study recommends that the government should ease the procedures of land acquisition and registration as this greatly hindered the growth of the sector and also largely contributes to the higher prices witnessed in the sector. The government should also develop a framework for public private partnerships between government agencies and the private sector mainly focusing on affordable housing for the low income market. Financiers are also recommended to come up with measures that will make mortgages accessible and affordable. The study was not complete without some limitations. Some of these limitations included decline by some firms to respond to questionnaires. This limitation was overcome by paying personal visits to these firms to convince and promising a copy of the completed project. Another limitation was that majority of the sampled firms were from Nairobi County thus not reflecting a national outlook of the sector. To overcome this, firms that had branches or operations in other counties were given preference when sampling.
vi
TABLE OF CONTENTS
Declaration ...................................................................................................................................... ii
Dedication ...................................................................................................................................... iii
Acknowledgement ......................................................................................................................... iv
Abstract ........................................................................................................................................... v
Table of Contents ........................................................................................................................... vi
List of Figures and Charts ............................................................................................................... x
List of Tables ................................................................................................................................. ix
CHAPTER ONE: INTRODUCTION ......................................................................................... 1
1.1 Background of the Study .......................................................................................................... 1
1.1.1 Operations Strategy ............................................................................................................ 2
1.1.2 Operations Strategy and Business Environment ................................................................ 3
1.1.3 The Real Estate Sector in Kenya ........................................................................................ 5
1.2 Research Problem ..................................................................................................................... 6
1.3 Research Objectives .................................................................................................................. 7
1.4 Value of the Study .................................................................................................................... 8
CHAPTER TWO: LITERATURE REVIEW ............................................................................ 9
2.1 Operations Strategy Process ..................................................................................................... 9
2.1.1 Top-Down Perspective ..................................................................................................... 10
2.1.2 Bottom-Up Perspective .................................................................................................... 10
2.1.3 Market-Led Perspective ................................................................................................... 11
2.1.4 Operations-Led Perspective ............................................................................................. 11
2.2 Operations and Competitiveness............................................................................................. 12
2.2.1. Competing on Cost .......................................................................................................... 13
2.2.2 Competing on Quality ...................................................................................................... 13
2.2.3 Competing on Time .......................................................................................................... 14
2.2.4 Competing on Flexibility ................................................................................................. 14
2.2.5 Trade-Off Model .............................................................................................................. 15
2.2.6 Cumulative Capability (Sandcone) Model ....................................................................... 15
1.3 Operations Management and Operations Strategy ................................................................. 16
2.4 Operational Excellence ........................................................................................................... 18
vii
2.5 P.E.S.T.E.L Analysis ............................................................................................................. 19
CHAPTER THREE: RESEARCH METHODOLOGY ............... .......................................... 20
3.1 Introduction ............................................................................................................................. 20
3.2 Research design ...................................................................................................................... 20
3.3 Target population .................................................................................................................... 20
3.4 Sample..................................................................................................................................... 20
3.5 Data collection ........................................................................................................................ 20
3.6 Data Analysis .......................................................................................................................... 21
CHAPTER FOUR:DATA ANALYSIS, RESULTS AND DISCUSSIO NS ......................... 22
4.1 Introduction ............................................................................................................................. 22
4.2 Firms Profile ........................................................................................................................... 22
4.2.1 Area of operations ............................................................................................................ 22
4.2.2 Year of Establishment of the firm .................................................................................... 24
4.2.3 Number of Employees ...................................................................................................... 24
4.2.4 Ownership of the firm ...................................................................................................... 25
4.2.5 Position of the respondent ................................................................................................ 26
4.2.6 Length of service .............................................................................................................. 26
4.3 Operations Strategies .............................................................................................................. 28
4.3.1 Existence of written operations strategy .......................................................................... 28
4.3.2 Development of operation strategy .................................................................................. 29
4.3.3 Quality as an operations strategy ..................................................................................... 30
4.3.4 Cost as an operations strategy .......................................................................................... 31
4.3.5 Time as an operations strategy ......................................................................................... 31
4.3.6 Flexibility as an operations strategy ................................................................................. 32
4.3.7 Operations Strategy Ratings ............................................................................................. 33
4.4 Environmental factors ............................................................................................................. 34
4.4.1 Political Factors ................................................................................................................ 34
4.4.2 Economical Factors .......................................................................................................... 35
4.4.3 Social Factors .................................................................................................................... 36
4.4.4 Technological Factors ...................................................................................................... 37
4.14 Environmental Factors Ratings ......................................................................................... 38
viii
4.5 Is the government doing enough to support the sector? ......................................................... 38
4.6 Discussions ............................................................................................................................. 39
CHAPTER FIVE: SUMMARY, CONCLUSIONS AND RECOMMENDATI ONS ............ 41
5.1 Summary ................................................................................................................................. 41
5.2 Conclusions ............................................................................................................................. 42
5.3 Policy Recommendations........................................................................................................ 42
5.4 Limitations of the study .......................................................................................................... 43
5.5 Suggestions for further research ............................................................................................. 44
REFERENCES ............................................................................................................................. 45
APPENDIX 1: QUESTIONNAIRE TO THE REAL ESTATE FIRMS ..................................... 49
ix
LIST OF TABLES
Table 4.1 Year of Establishment of the firm................................................................................. 24
Table 4.2 Number of employees ................................................................................................... 25
Table 4.3 Ownership of the firm ................................................................................................... 25
Table 4.4 Length of service .......................................................................................................... 27
Table 4.5 Development of operation strategy ............................................................................... 29
Table 4.6 Quality as an operations strategy .................................................................................. 30
Table 4.7 Cost as an operations strategy ....................................................................................... 31
Table 4.8 Time as an operations strategy...................................................................................... 32
Table 4.9 Flexibility as an operations strategy ............................................................................. 32
Table 4.10 Operations Strategies .................................................................................................. 33
Table 4.11 Political factors ........................................................................................................... 35
Table 4.12 Economical factors ..................................................................................................... 35
Table 4.13 Social Factors .............................................................................................................. 36
Table 4.14 Technological factors .................................................................................................. 37
Table 4.15 Environmental factors Ratings ................................................................................... 38
x
LIST OF FIGURES AND CHARTS
Fig 1. The four perspectives on operations strategy. ...................................................................... 9
Fig 2. P.E.S.T.E.L Frame work. ................................................................................................... 19
Chart 4.1 Area of operations ......................................................................................................... 23
Chart 4.2 Position of the respondent ............................................................................................. 26
Chart 4.3 Existence of written operations strategy ....................................................................... 28
1
CHAPTER ONE: INTRODUCTION
1.1 Background of the Study
Operations strategy can be viewed as the effective use of production capability and technology
for achieving business and corporate goals. These goals include profit, innovations,
customizations, product flexibility, product reliability, quality, response, delivery reliability and
after sales service (Nazim and Montagino, 1996). The role of operations strategy is to provide a
plan for the operations function so that it can make the best use of its resources. Operations
function is responsible for managing the resources needed to produce the company’s goods and
services. It is the plan that specifies the design and use of resources to support the business
strategy. This includes the location, size, and type of facilities available; worker skills and talents
required; use of technology, special processes needed, special equipment; and quality control
methods. The operations strategy must be aligned with the company’s business strategy and
enable the company to achieve its long-term plan (Slack and Lewis 2004).
Barnes (2008) noted that the relationship between an organization’s strategy and its operations is
a key determinant of its ability to achieve long-term success or even survival. Organizational
success is only likely to result if short-term operations activities are consistent with long term
strategic intentions and make contribution to competitive advantage.
With the intense global competition, companies today understand that the best way to boost the
bottom line is to cut costs through more efficient operations management (Wee, 2009). Wright
(1999) describe operations as the activities of designing, reviewing and using the operating
system, to achieve service outputs as determined by the organization for customers.
Organizations rely on a good operations management to achieve their objectives. So the pressure
is on operations managers to deliver results, and this means supplying better products than
competitors and using resources more efficiently. It means building distinctive capabilities that
set the organization apart from its competitors with unique products, a process that no other
organization has, low operating costs, customized products, and flexible responses to changing
demand, rapid development of new products, fast service, convenient locations, high quality, or a
wide range of other options.
2
Housing is one of the principal sectors that would revitalize economic growth in Kenya with
shelter being recognized as one of the tools of development. Investment in housing and related
infrastructure and services have effects on the national income that go far beyond the direct
investment itself by triggering forward and backward linkages through additional investments in
building materials production, transportation, marketing and Jua Kali (fabrication of construction
materials). Investment in the sector has a multiplier effect of 7 to 9 times on Kenya’s economic
development. What this means is that one shilling invested in housing development would
generate seven shillings in the economy. Other direct and indirect benefits from a functioning
housing market in a country include employment creation, increased tax base, reduced
expenditures on Health, improved Security, socially cohesive and patriotic societies and
improved quality of life. An adequately housed population is also more productive and has a
sense of national pride (MOH, 2011).
Despite the acknowledged importance of housing, Kenyan housing sector is characterized by
deteriorating housing conditions countrywide arising from demand that far surpasses supply
particularly in urban areas. This shortage in housing manifests itself through overcrowding,
proliferation of slums and informal settlements in urban areas and poor quality housing (MOH,
2011). According to UN-HABITAT (2002) the rate of urbanization is directly related to the
demand for houses. It is expected that as a country becomes more urban, more houses will be
needed to accommodate the increasing population in urban centers. The practice, however, does
not support this in that the acceleration in urbanization is not accompanied by the provision of
adequate housing.
1.1.1 Operations Strategy
Slack et al. (2004) argue that an ‘operations strategy concerns the pattern of strategic decisions
and actions which set the role, objectives and activities of operations’. Their use of the term
‘pattern’ implies a consistency in strategic decisions and actions over time. This concept is
consistent with management guru Henry Mintzberg’s view of strategy as being a ‘pattern in a
stream of actions’.
3
Mintzberg sees strategy as being realized through a combination of deliberate and emergent
actions. An organization can have an intended strategy, perhaps as a set of strategic plans.
However, only some of this intended strategy may be realized through deliberate strategy. Some
of the intentions may be unrealized. Strategies which take no regard of operational feasibility are
likely to become unrealized, remaining merely as a set of intentions. Strategy may also emerge
from actions taken within the organization, which over time form a consistent pattern. Actions of
this kind will, almost inevitably, arise from within the operations of the organization. So,
whether planned or otherwise, the organization’s operations are bound to have a major impact on
the formation of organizational strategy (Mintzberg and Waters, 1985).
Porter (1996) argues that strategy is about competitive position, differentiating you in the eyes of
the customer, adding value through a mix of activities different from the ones used by
competitors. Thomson et al (2007) defines company strategy as the management’s action plan
for running the business and conducting operations. Wheelen and hunger (2008) state that
strategy of a corporation forms comprehensive master plans that state how it will achieve its
mission and objectives. Strategy they add will maximize competitive advantage and minimize
competitive disadvantage. Therefore strategy serves as a map for the organization and the means
to stay ahead of competition. Nyamwange and Mulwa (2010) argues that strategy is a vision that
unifies the organization, it provides consistency in decisions and keeps the organization moving
in the right direction. Slack et al. (2004) argue that an operations strategy concerns the pattern of
strategic decisions and actions which set the role, objectives and activities of operations.
1.1.2 Operations Strategy and Business Environment
Amoako-Gyampah (2001), noted that environmental issues have not received much attention in
operations strategy research. This lack of attention is occurring although empirical evidence
seems to suggest that practicing managers do consider environmental factors when they seek to
develop operations strategy. In a case study of six manufacturing firms on the development of
manufacturing strategy conducted by Marucheck et al. (1990), the data showed that managers
indeed do consider the importance of the assessment of competitors and customers in the
development of manufacturing strategy.
4
The main reason why company would development a competitive business strategy is to achieve
a competitive advantage over its competitions. The essence of a competitive business strategy for
organization is achieving a favorable match between firm’s distinctive competence and the
external environment in which it compete. Therefore, it is crucial for firms to focus on the
dimensions of its environment while making a business strategy. The most important of these are
to discover new opportunities, to divert potential threats, to overcome current weakness, to
sustain existing systems, and apply strengths for new fields. Every firm has to deal with these
strategic environmental factors on a continuous basis. (Pitt, 2000)
According Johnson and Scholes (2002) the major task of managers is to ensure survival of the
companies they manage. In order to achieve success, the companies have to adequately adjust to
meet environmental challenges. Failure to do this will course the companies to experience a
strategic problem. Therefore, strategy is a tool which offers significant help that enable the firm
to cope with turbulent event facing the firm. This problem arises out of the mismatch between
the output of the company and the demand in the market place. Strategy is useful in helping
managers tackle the potential problems that face the companies, (Aosa, 1998). Strategy is the
tool which offers help for coping with turbulence confronted by the business firms. Strategy
requires to be taken seriously as a managerial tool not only for the firm but also for a broad
spectrum of social organization, ( Ansoff and McDonnel,1990).
Badri et al (2000), states that the environment in which a firm competes changes continually, so
an organization needs to scan and adapt to that environment continually. A crucial reason for
environmental scanning is to stay ahead of competition. Competitors may be gaining an edge by
broadening product lines, improving quality, or lowering costs. New entrants into the market or
competitors who offer substitutes for the firm’s product may threaten continued profitability.
Thus the business environment is a significant causal element in the operations strategy and
business performance nexus. The environment is a major factor when integrated with effective
operations strategy in determining the performance of the organization.
5
1.1.3 The Real Estate Sector in Kenya
Harvey (1981), real estate property or real estate refers to a particular type of good, land or
resources that is not physically movable. The mobility aspect of land and land resources
distinguishes it from other goods and services. Real estate consists of physical land as well as
structures and other improvements that are permanently attached to it (Miles et al, 1994).
According to Charles et al, (1997) property can be classified into commercial, residential,
industrial, agricultural, and special properties. Anwar (2010) in his study state that real estate is a
broad term that refers to residential new homes and existing (resale) homes, commercial
shopping centers and offices, industrial and manufacturing building and property and vacant land
and farm.
In recent years the real estate sector has undergone a very significant period of change driven
largely by the desire of the largest firms in the sector to create global delivery platforms. This has
resulted in emergence of up to ten potential global players embodying diverse traditions of
service provision from a variety of business cultures. However, real estate is in essence a
business which is highly location specific, where local market knowledge will always be the
principal input into the majority of service products and where as a consequence as a whole,
despite this process of globalization remains fragmented with the global players accounting for at
best ten percent of the total market (Argwings, 2004)
The Government’s commitment to growth of real estate sector is in our blueprint for Vision 2030
and is also well articulated in the Finance Bill, 2010. The Finance Bill outlines a number of
measures to spur growth in the property market. In particular, in order to facilitate provision of
adequate housing to Kenya’s growing population, The Finance Bill, 2010 contains proposals to
amend the Banking Act: thus to allow mortgage finance companies to operate current accounts
and allow banks to advance up to 40 percent of their total deposit liabilities up from 25 percent
for purchase, improvement or alterations of land. These measures will unlock the sector’s
potentials by availing funding required to finance growth of real estate in Kenya (CBK, 2010).
The mortgage market in Kenya is the third most developed in sub-Saharan Africa after South
Africa and Namibia - has big challenges that have locked out the majority of citizens from
accessing the necessary financing to buy properties. The challenges includes the lack of access to
6
long-term funds and credit risk information, low incomes, high difficulties with registration of
property and high interest rates. Despite this challenges property in Kenya is booming - price
growth is intense and the rental figures being charged for some of these properties in the most
desirable areas are on a par with major cities around the world. For example in Nairobi demand
for property is intense. Certain up market areas of the city have seen property prices increase by
up to fifty percent in the last two years alone (World Bank, 2011).
1.2 Research Problem
Firms that fail to fully exploit the strategic power of operations will be hampered in their
competitive abilities and vulnerable to attack from those competitors who do exploit their
operations strategy. To do this effectively, operations must be involved throughout the whole of
the corporate strategy. Corporate executives have tended to assume that strategy has only to do
with marketing initiatives. They erroneously make the assumption that operation’s role is strictly
to respond to marketing changes rather than make inputs into them. Secondly, corporate
executives assume that operations have the flexibility to respond positively to changing
demands. These assumptions place unrealistic demand upon the operations function. While
corporate management perceives corporate improvement as coming through broad decisions
concerning new markets, takeovers, and so on, it overlooks the idea that building blocks of
corporate success can be found in the creative and effective use of operations strategy to support
the marketing requirement within a well-conceived corporate strategy, (Clark, 1994)
The Constitution of the Republic of Kenya expressly provides for the right to “accessible and
adequate housing, and to reasonable standards of sanitation” in article 43(1) (b).
The demand for housing has continued to outstrip supply, particularly in urban areas with an
estimated annual average supply of only 30,000 – 50,000 units against estimated annual demand
of over 150,000 units in the urban areas. The housing deficit derives from the low level of
investment in the sector by both public agencies and the formal private sector, with housing units
produced by both sectors representing only an estimated 20 per cent of the total number of new
urban households. Other factors that contribute to the national housing shortage include rapid
urbanization, inaccessibility to land and housing finance, stringent planning regulations,
7
restrictive building standards, high cost of infrastructure, poor economic performance and high
incidence of poverty (MOH, 2011).
The overall goal of the National Housing Policy seasonal paper no. 3 (2004) is to facilitate the
provision of adequate shelter and a healthy living environment at an affordable cost to all socio-
economic groups in Kenya in order to foster sustainable human settlements. This will minimize
the number of citizens living in shelters that are below the habitable living conditions. It will also
curtail the mushrooming of slums and informal settlements especially in the major towns. Thus
the need to promote growth in the real estate sector in Kenya highlights the importance of this
study.
A number of studies have been done in the areas of operations strategy. They include Cheboi
Anne J. (2011) who focused on operations strategy adopted by the mobile telephony service
providers in Kenya to gain competitive advantage. Pauline Sang (2011) did a study on
operational strategies and competitive advantage in the commercial banking sector in Kenya.
Magutu, Mbeche, Nyamwange, Mwove, Ndubai and Nyaanga (2010) focused on formulation
and implementation of operations strategies used in solid waste management: A case study of
City Council of Nairobi. Nyamwange (2001) studied on the operations strategies applied for
competitiveness of Kenyan large manufacturing firms. However, to the researcher’s knowledge,
there has not been any research touching operations strategy and business environment on the
real estate sector, despite the great importance this sector plays toward the growth Kenya’s
economy. Thus this research aims to fill this gap by investigating the operations strategy adopted
by real estate developers in Kenya and how business environment influence the operations
strategies adopted.
1.3 Research Objectives
1. To investigate operations strategies adopted in the real estate sector in Kenya.
2. To investigate the influence of business environment on operations strategies.

8
1.4 Value of the Study
This study will be important in several aspects. First it will provide the government with critical
information about how to promote the growth of the sector in order to meet it short and long term
goals as stipulated in the millennium development goals and the vision 2030. It will also guide
the policy makers on issues that affect the sector and what incentives to offer so as to spur
growth in the sector.
Real estate players will also be able to understand factors that affect operations strategy in the
sector. This will be very critical in determining their success in the sector. The information
provided will guide them in decision making as it will enable them to have a clear perspective of
the sector.
Other stakeholders such as lenders, supplies and investors will have information on how to take
advantage of this promising sector. This is by providing information on challenges of the sector
and how they can exploit them in to business opportunities
The study will also guide potential investors by having a clear perspective of the sector. This will
be critical in promoting growth in the sector. Readily available information on the sector will be
crucial to new players wishing to venture in the sector.
9
CHAPTER TWO: LITERATURE REVIEW
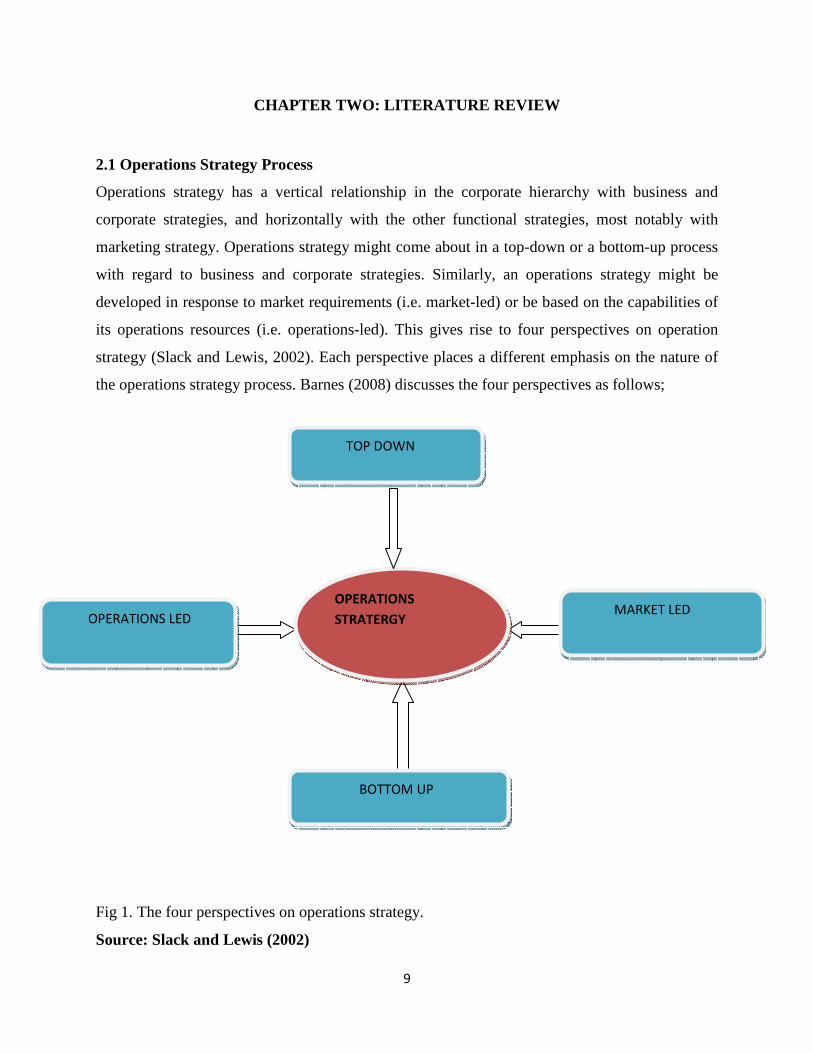
2.1 Operations Strategy Process
Operations strategy has a vertical relationship in the corporate hierarchy with business and
corporate strategies, and horizontally with the other functional strategies, most notably with
marketing strategy. Operations strategy might come about in a top-down or a bottom-up process
with regard to business and corporate strategies. Similarly, an operations strategy might be
developed in response to market requirements (i.e. market-led) or be based on the capabilities of
its operations resources (i.e. operations-led). This gives rise to four perspectives on operation
strategy (Slack and Lewis, 2002). Each perspective places a different emphasis on the nature of
the operations strategy process. Barnes (2008) discusses the four perspectives as follows;
Fig 1. The four perspectives on operations strategy.
Source: Slack and Lewis (2002)
OPERATIONS
STRATERGY
TOP DOWN
OPERATIONS LED MARKET LED
BOTTOM UP
10
2.1.1 Top-Down Perspective
The top-down perspective is one in which the operations strategy is derived from, and is
supportive of the organization’s business strategy; an operations strategy that the organization
uses to realize its business strategy. According to this perspective, the process of developing an
operations strategy would follow Skinner’s approach of identifying an operation’s ‘task’
(Skinner, 1969). The task for operations would be determined logically from the business
strategy. Using Slack et al.’s (2004) five operations performance objectives is one way of
articulating the operations task. For example, if the organization’s business strategy is one of
offering low prices, then the operation’s task should be one of achieving low costs in operations.
If the business strategy is based on offering customers fast delivery, the operations task should be
one of achieving speed in operations, and so on.
2.1.2 Bottom-Up Perspective
The bottom-up perspective is one which sees operations strategy emerging through a series of
actions and decisions taken over time within operations. These actions and decisions might at
first sight appear somewhat haphazard, as operations managers respond to customer demands,
seek to solve specific problems, copy good practices in other organizations, etc. However, they
can build over time to form a coherent pattern recognizable as an operations strategy. The actions
taken within this kind of strategy are likely to be characterized by a continuous series of
incremental improvements rather than the large one-off technologically led changes that require
large capital investments in new plant and machinery. The bottom-up perspective is one in which
the organization learns from its experiences, developing and enhancing its operational
capabilities as operations managers try new things out in an almost experimental fashion using
their workplaces as a kind of ‘learning laboratory’ (Leonard-Barton, 1992). Many of the
manufacturing practices that are now considered leading edge (such as JIT, TQM, Statistical
Process Control) were developed in just such a fashion by Japanese manufacturers responding to
the constraints placed upon them in the aftermath of the Second World War. One of the problems
associated with this perspective is that the organization may not recognize what its operations
strategy is. Mills et al. (1998) have developed a technique that aims to overcome this by enabling
managers to construct a visual representation of operations strategy as realized. It does this by
tapping into the organization’s collective memory (whether written or verbal) to map all the most
11
significant events in operations over the previous number of years. This should enable managers
to recognize the patterns that now make up the existing operations strategy.
2.1.3 Market-Led Perspective
The market-led perspective is one in which the operations strategy is developed in response to
the market environment in which the organization operates. There are a number of approaches in
the operations strategy literature that suggest how this might be done. The best known of these is
that of Terry Hill (1985). He suggests that an organization’s operations strategy should be linked
to its marketing strategy by considering how its products and services win orders in the market
place. He believes it is possible to identify two types of competitive criteria in any market.
Market qualifying criteria are those factors that must be satisfied before customers will consider
making a purchase in the first place. Order winning criteria, on the other hand, are the factors on
which customers ultimately make their purchasing decision. Consequently, an operations
strategy should be developed which will satisfy market qualifying criteria, but excel at order
winning criteria for the market segment that the operation wishes to serve. Platts and Gregory
(1990) use an approach that audits the products or groups of products that the organization offers
to its markets. The aim is to identify any gaps between market requirements for particular
products and services and the performance of the organization’s operations in delivering those
products and services. First the market requirements for the product or service are analyzed in
terms of various competitive factors (such as cost, quality, and reliability). The performance of
the organization’s operations against those factors is then assessed. An operations strategy
should be developed which will enable operations to match the level of performance required by
customers in each of the competitive criteria.
2.1.4 Operations-Led Perspective
The operations-led perspective is one in which its excellence in operations is used to drive the
organization’s strategy. This is in line resource-based view (RBV) of strategy that currently
dominates the strategic management literature. The premise of the RBV is that superior
performance comes from the way that an organization acquires, develops and deploys its
resources and builds its capabilities rather than the way it positions itself in the market place
(Barney, 1991; Wernerfelt, 1984). Thus, the process of strategy development should be based on
12
a sound understanding of current operational capabilities and an analysis of how these could be
developed in the future. This can then provide the basis for decisions about which markets are
likely to be the best in which to deploy current and future capabilities, which competitors are
likely to be most vulnerable and how attacks from competitors might best be countered (Hayes et
al., 2005). Mills et al. (2002) have developed methods through which organizations can apply
these ideas in practice. This involves undertaking an analysis of the resources that have
underpinned the activities of a business unit over an extended period of time (at least the
previous three to five years). Six resource categories, which are not mutually exclusive, are used:
tangible resources, knowledge resources skills and experience, systems and procedural resources,
cultural resources and values, network resources and resources important for change. The
resources are evaluated against three criteria: value, sustainability and versatility. Resources that
individually or collectively score highly in these criteria are considered to be important
resources. They are sources of existing or potential competitive advantage to the organization.
2.2 Operations and Competitiveness
Competitiveness is how effectively organization meets the wants and needs of customers relative
to others that offer similar goods and services. In other words it is how effective an organization
is in the market place. Operations strategy in a business organization is essentially about how the
organization seeks to survive and prosper within its environment over the long-term. The
decision taken and the actions taken within its operations have a direct impact on the basis on
which an organization is able to compete. The way in which an organization secures, deploys
and utilizes it resources will determine the extent to which it can successfully pursue specific
performance objectives (Barnes, 2008).
Operations have a major influence on competitiveness as it determines the way organizations
compete with one another. Slack et al. (2004) argues that there are four operations performance
objectives; which are also referred as competitive priorities as discussed below.
13
2.2.1. Competing on Cost
Competing based on cost means offering a product at a low price relative to the prices of
competing products. The need for this type of competition emerges from the business strategy.
The role of the operations strategy is to develop a plan for the use of resources to support this
type of competition. Note that a low-cost strategy can result in a higher profit margin, even at a
competitive price. Also, low cost does not imply low quality. To develop this competitive
priority, the operations function must focus primarily on cutting costs in the system, such as
costs of labor, materials, and facilities. Companies that compete based on cost study their
operations system carefully to eliminate all waste. They might offer extra training to employees
to maximize their productivity and minimize scrap. Also, they might invest in automation in
order to increase productivity. Generally, companies that compete based on cost offer a narrow
range of products and product features, allow for little customization, and have an operations
process that is designed to be efficient as possible (Slack, and Lewis 2002)
2.2.2 Competing on Quality
Many companies claim that quality is their top priority, and many customers say that they look
for quality in the products they buy. Yet quality has a subjective meaning; it depends on who is
defining it. For example, to one person quality could mean that the product lasts a long time, to
another person quality might mean high performance. When companies focus on quality as a
competitive priority, they are focusing on the dimensions of quality that are considered important
by their customers. Quality as a competitive priority has two dimensions. The first is high-
performance design. This means that the operations function will be designed to focus on aspects
of quality such as superior features, close tolerances, high durability, and excellent customer
service. The second dimension is goods and services consistency, which measures how often the
goods or services meet the exact design specifications. Companies that compete on quality must
deliver not only high-performance design but goods and services consistency as well. A
company that competes on this dimension needs to implement quality in every area of the
organization. One of the first aspects that need to be addressed is product design quality, which
involves making sure the product meets the requirements of the customer. A second aspect is
process quality, which deals with designing a process to produce error-free products. This
includes focusing on equipment, workers, materials, and every other aspect of the operations to
14
make sure it works the way it is supposed to. Companies that compete based on quality have to
address both of these issues: the product must be designed to meet customer needs, and the
process must produce the product exactly as it is designed (Slack and Lewis 2002)
2.2.3 Competing on Time
Time or speed is one of the most important competitive priorities today. Companies in all
industries are competing to deliver high-quality products in as short a time as possible.
Customers don’t want to wait, and companies that can meet their need for fast service are
becoming leaders in their industries. Making time a competitive priority means competing based
on all time-related issues, such as rapid delivery and on-time delivery. Rapid delivery refers to
how quickly an order is received; on-time delivery refers to the number of times deliveries are
made on time. When time is a competitive priority, the job of the operations function is to
critically analyze the system and combine or eliminate processes in order to save time. Often
companies use technology to speed up processes, rely on a flexible workforce to meet peak
demand periods, and eliminate unnecessary steps in the production process (Rondeau et al, 2000)
2.2.4 Competing on Flexibility
As a company’s environment changes rapidly, including customer needs and expectations, the
ability to readily accommodate these changes can be a winning strategy. This is flexibility. There
are two dimensions of flexibility. One is the ability to offer a wide variety of goods or services
and customize them to the unique needs of clients. This is called product flexibility. A flexible
system can quickly add new products that may be important to customers or easily drop a
product that is not doing well. Another aspect of flexibility is the ability to rapidly increase or
decrease the amount produced in order to accommodate changes in the demand. This is called
volume flexibility. Companies that compete based on flexibility often cannot compete based on
speed, because it generally requires more time to produce a customized product. Also, flexible
companies typically do not compete based on cost, because it may take more resources to
customize the product. However, flexible companies often offer greater customer service and can
meet unique customer requirements. To carry out this strategy, flexible companies tend to have
more general-purpose equipment that can be used to make many different kinds of products.
15
Also, workers in flexible companies tend to have higher skill levels and can often perform many
different tasks in order to meet the customer needs (Vokurka and O’Leary-Kelly, 2000)
2.2.5 Trade-Off Model
The concept is based on the premise that it is impossible to excel simultaneously at all aspects of
operations. This means that an operations strategy can be successful only if it is based upon a
single clear goal, determined by a prioritization of operations performance objectives (e.g. cost,
quality, speed, and flexibility). This may result in having to ‘trade-off’ less than excellent
performance in one aspect of operations in order to achieve excellence in another (Barnes, 2008).
Skinner (1969) argued that operations could not be ‘all things to all people’. What was needed
was to identify a single goal or task for operations; a clear set of competitive priorities to act as
the objective. The task would then act as the criterion against which all decisions and actions in
operations could be judged.
2.2.6 Cumulative Capability (Sandcone) Model
Ferdows and de Meyer (1990) argue that certain operational capabilities enhance one another,
enabling operations excellence to be built in a cumulative fashion. In their ‘sandcone’ model of
operations excellence, they maintain that there is an ideal sequence in which operational
capabilities should be developed. The starting point, the base of the sandcone is excellence in
quality. On this should be built excellence in dependability, then flexibility (which they take to
include speed), then cost. They emphasize that efforts to further enhance quality should continue
whilst commencing efforts to build dependability. Similarly, actions on quality and dependability
need to continue whilst building flexibility. Finally efforts to reduce costs take place alongside
continuing efforts to improve quality, dependability and flexibility. They claim that operational
capabilities developed in this way are more likely to endure than individual capabilities
developed at the expense of others.
16
1.3 Operations Management and Operations Strategy
To many people, the term production conjures up images of factories, machines, and assembles
lines. Interestingly enough, the field of production management in the past focused almost
exclusively on manufacturing management. Heavy emphasis was placed on methods and
techniques that dealt with operating a factory. In recent years, the scope of production
management has broadened considerably. Currently production concepts and techniques are
being applied to a wide range of activities and situations outside of manufacturing, that is, in
services as well as manufacturing. Because of this broadened scope, the field has taken up the
name production/operations management or more simply operations management, a term that
more closely reflects the diverse nature of activities to which it concept and techniques are
applied (Stevenson, 2010). Harold et al (1996) state that operations management begun when the
first crude tool was produced. In the ensuing years, we have reached the point where nearly
everything we touch is a manufactured or processed product. The goal or purpose of most
organizations involves the production of goods and services. To some (especially those
professionally involved in operations management) operations involve everything an
organization does. In this sense, every manager is an operations manager (Thomsons, 2010).
There are some key decision areas of operations management that need to be considered when an
organization is developing an operations strategy. Although there are a number of classifications
in use, operations management scholars generally agree (e.g. Leong et al., 1990) that the major
strategic decision areas in operations can be conveniently divided into ten categories under two
broad headings: structure (the physical attributes of operations; the hardware) and infrastructure
(the people and systems of operations; the software). The structural decision areas comprise:
Facilities: the location, size and focus of operational resources. These decisions are concerned
with where to locate production facilities, how large each facility should be, what goods or
services should be produced at each location, what markets each facility should serve, etc.
Capacity: the capacity of operations and their ability to respond to changes in customer demand.
These decisions are concerned with the use of facilities, for example through shift patterns,
working hours and staffing levels. Decisions about capacity will affect the organization’s ability
to serve particular markets from a given location.
17
Process technology: the technology of the equipment used in operations processes. For example,
the degree of automation used, the configuration of equipment, and so on. Supply network: the
extent to which operations are conducted in-house or are outsourced. Decisions about vertical
integration are also concerned with the choice of suppliers, their location, the extent of
dependence on particular suppliers, and how relationships with suppliers are managed.
Structural decisions often involve major capital investment decisions, which once made will set
the direction of operations for many years to come. They invariably impact the resources and
capabilities of an organization, determining its potential future output. It may be prohibitively
expensive to change such decisions once implemented, and hence these must be considered to be
truly strategic decisions for the organization. It may be much easier to change the organization’s
marketing strategy (e.g. its target markets, or its promotional activities) than it is to change its
operations strategy with respect to the structural decision areas.
Infrastructure decision areas comprise: Planning and Control: the systems used for planning and
controlling operations. Quality: quality management policies and practices. Work Organization:
organizational structures, responsibilities and accountabilities in operations. Human Resources:
recruitment and selection, training and development, management style. New Product
Development: the systems and procedures used to develop and design new products and services.
Performance Measurement: financial and non-financial performance management and its linkage
to recognition and reward systems.
These issues are also important to an organization, involving the use made of the operating
hardware discussed above. It is possible to change aspects of operations infrastructure more
quickly and easily than is the case for operations structure. Nonetheless the difficulty of so doing
should not be underestimated; neither should the impact of making inappropriate infrastructural
decisions.
18
2.4 Operational Excellence
Operational excellence is a specific strategic approach to the production and delivery of products
and services. A company that allows this strategy attempts to lead it industry in price and
convenience by pursuing a focus on lean and efficient operations. The focus is on delivering
products and services to customers at competitive prices with minimal inconvenience. Firms that
implement this strategy typically restructure their delivery processes to focus on efficiency and
reliability, and use state of the art information systems that emphasize integration and low cost
transactions (Treacy and Wiersema, 1993)
Nokia Siemens (2007) developed five ways to achieve operational excellence. One is to analyze
the current situation; assess the efficiency of work processes to identify areas for improvement.
Second is to optimize business processes; optimizing and streamlining existing operations and
business processes is the key to reducing waste and improving customer satisfaction. Third is to
modernize existing assets; using up to date equipments. The fourth one is expand fast and
flexibly; focus on emerging markets, and finally is to maximize the growth opportunity;
application of technology and fresh business thinking.
Porter (1996), state that the strategy of low costs means efficient operations. The ultimately
difference between companies in cost or price derive from hundreds of activities to create,
produce, sell and deliver their products. Usually low cost operations are characterized by large
volume, automated production, high productivity, continuous improvements to the process,
concentration in a few main products, limited product ranges, sample design, waste reduction,
shorter supply chain, high product quality, and any other means of reducing costs. Waters
(2008), argue that low costs are achieved by eliminating all wastes, and this approach has
become increasingly known as lean operations. Cost reduction and lean operations are not the
same, but they follow the same general reasoning. The aim of lean operations is to do every
operation using less of each resource – people, space, stock, equipment, time, etc. It organizes
the efficient flow of materials to eliminate waste, give the shortest lead-time, minimum stocks
and minimum total cost.
19
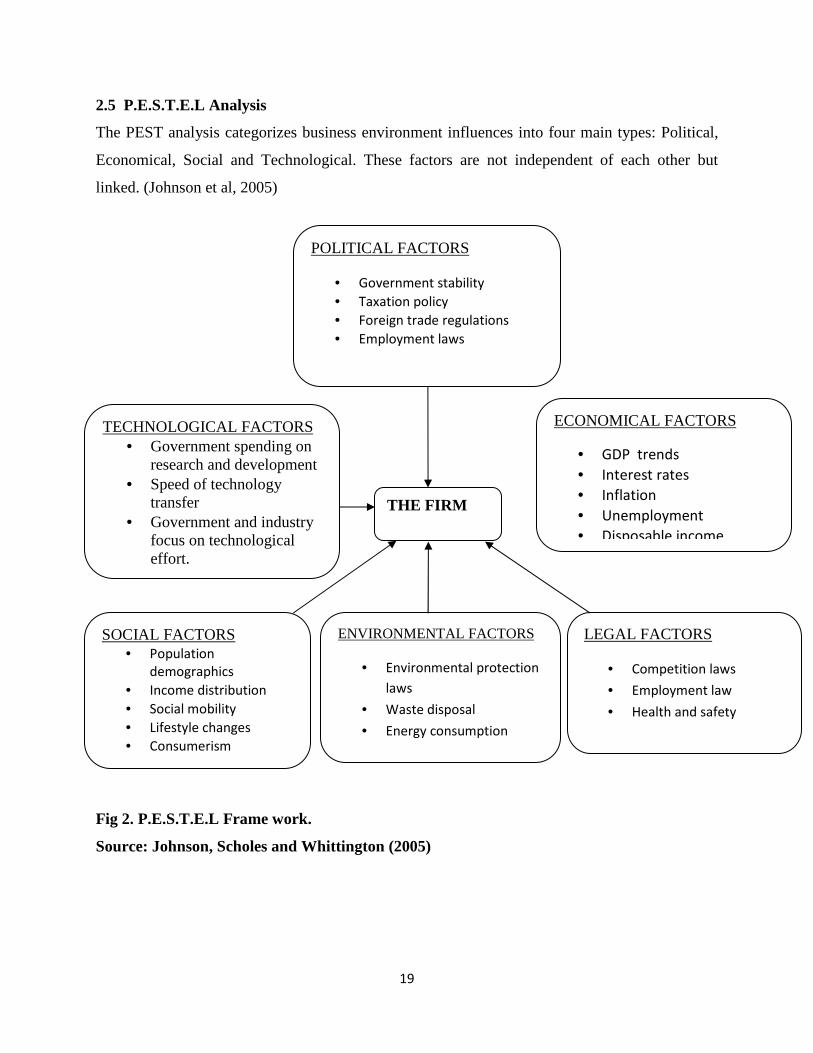
2.5 P.E.S.T.E.L Analysis
The PEST analysis categorizes business environment influences into four main types: Political,
Economical, Social and Technological. These factors are not independent of each other but
linked. (Johnson et al, 2005)
Fig 2. P.E.S.T.E.L Frame work.
Source: Johnson, Scholes and Whittington (2005)
POLITICAL FACTORS
• Government stability
• Taxation policy
• Foreign trade regulations
• Employment laws
THE FIRM
TECHNOLOGICAL FACTORS • Government spending on
research and development • Speed of technology
transfer • Government and industry
focus on technological effort.
ECONOMICAL FACTORS
• GDP trends
• Interest rates
• Inflation
• Unemployment
• Disposable income
SOCIAL FACTORS • Population
demographics
• Income distribution
• Social mobility
• Lifestyle changes
• Consumerism
• Altitude to work and
ENVIRONMENTAL FACTORS
• Environmental protection
laws
• Waste disposal
• Energy consumption
LEGAL FACTORS
• Competition laws
• Employment law
• Health and safety
20
CHAPTER THREE: RESEARCH METHODOLOGY
3.1 Introduction
This chapter presents the methodology that the research adopted. It is subdivided into research
design, target population, sample size and sampling procedures, data collection and data analysis
tools.
3.2 Research design
The research adopted a survey design. A survey research can be defined as systematic gathering
of information from several study units with the purpose of understanding and /or predicting
some aspects of the behavior of the population of interest (Nachmias, 1996). A survey study
allowed general understanding of Operations strategies in Kenya’s Real Estate sector as a whole.
3.3 Target population
The populations of the study comprised of real estate firms who are members of Kenya Private
Development Association (KPDA). However, the population of interest to this study consisted
firms carrying out development and marketing of properties. The total number of registered and
licensed firms with KPDA is 71.
3.4 Sample
A sample of 35 firms was selected; this is because there are a total of 71 firm registered with
KPDA. Non probability sampling was preferred to other sampling methods. Non probability
sampling allowed deliberate selection of particular units of the population. This was because
some members of KPDA were not involved in development or marketing of properties which
based the interest of the study.
3.5 Data collection
To achieve the research objective, both primary and secondary data were used. Primary data was
collected through the use of questionnaire. The questionnaire had three sections A, B and C.
section A contained information on the company profile section B contained respondents’
21
information and section C covered the objective of the research study. The questionnaire was
administered through drop and pick later method. The questionnaire had both open ended and
closed ended questions. Secondary data was obtained through previous researches, property
reports and government records
3.6 Data Analysis
The collected data was edited for accuracy, uniformity, consistency and completeness. Coding of
the data was done to allow analysis. Quantitative data was analyzed using statistical package for
social scientists version 20. Descriptive statistics such as frequencies, percentages and tables
were used to analyze the data. In addition statistical methods such as means and standard
deviation were used in the analysis. Presentation of the data was in form of tables, pie charts, and
bar graphs. Qualitative data was presented inform of explanatory notes.
22
CHAPTER FOUR:
DATA ANALYSIS, RESULTS AND DISCUSSIONS
4.1 Introduction
This chapter covers data analysis, results and discussions of the research. Data was collected
from real estate firms in Kenya. The sample of the research was 35 firms, to which the
questionnaires were personally delivered, receiving response from 28 firms. The data was
analyzed using descriptive statistics tools. The analysis and study findings were then summarized
into mean scores, standard deviations, percentages and frequencies. These were subsequently
presented in tables, graphs and charts.
4.2 Firms Profile
The study captured demographic information such as area of operation, year of establishment,
number of employees, ownership of the firm, position of the respondent, and length of service.
4.2.1 Area of operations
The study sought to establish the area of operations of the firms; the areas of operations
considered were Kenya, East Africa, Africa and the Global market.
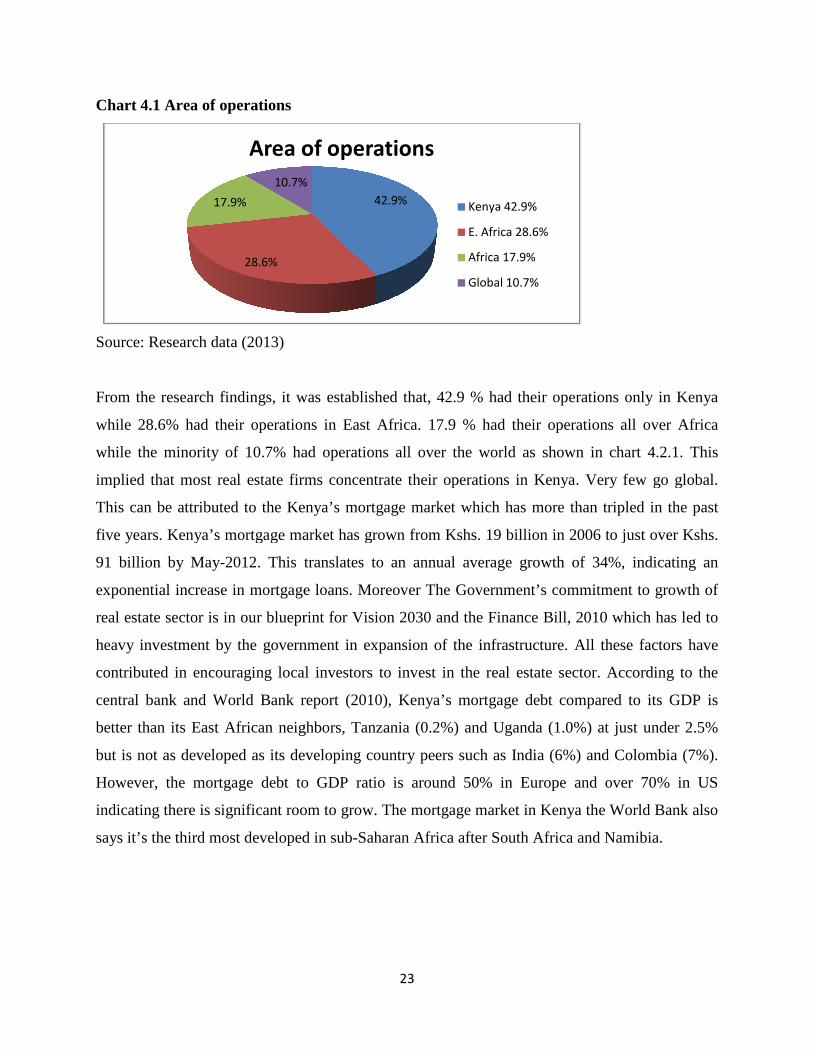
Chart 4.1 Area of operations
Source: Research data (2013)
From the research findings, it was established that, 42.9 % had
while 28.6% had their operations in East Africa. 17.9 % had their operations all over Africa
while the minority of 10.7% had operations all over the world as shown in chart 4.2.1. This
implied that most real estate firms conc
This can be attributed to the Kenya’s
five years. Kenya’s mortgage market has grown from Kshs. 19 billion in 2006 to just over Kshs.
91 billion by May-2012. This translates to an annual average growth of 34%, indicating an
exponential increase in mortgage loans. Moreover The Government’s commitment to growth of
real estate sector is in our blueprint for Vision 2030 and the Finance Bill, 2010 which
heavy investment by the government in expansion of the infrastructure. All these factors have
contributed in encouraging local investors to invest in the real estate sector. According to the
central bank and World Bank report (2010), Kenya’s mor
better than its East African neighbors, Tanzania (0.2%) and Uganda (1.0%) at just under 2.5%
but is not as developed as its developing country peers such as India (6%) and Colombia (7%).
However, the mortgage debt to GDP r
indicating there is significant room to grow. The mortgage market in Kenya the World Bank also
says it’s the third most developed in sub
28.6%
17.9%
10.7%
Area of operations
23
From the research findings, it was established that, 42.9 % had their operations only in Kenya
while 28.6% had their operations in East Africa. 17.9 % had their operations all over Africa
while the minority of 10.7% had operations all over the world as shown in chart 4.2.1. This
implied that most real estate firms concentrate their operations in Kenya. Very few go global.
This can be attributed to the Kenya’s mortgage market which has more than tripled in the past
Kenya’s mortgage market has grown from Kshs. 19 billion in 2006 to just over Kshs.
2012. This translates to an annual average growth of 34%, indicating an
exponential increase in mortgage loans. Moreover The Government’s commitment to growth of
real estate sector is in our blueprint for Vision 2030 and the Finance Bill, 2010 which
heavy investment by the government in expansion of the infrastructure. All these factors have
contributed in encouraging local investors to invest in the real estate sector. According to the
central bank and World Bank report (2010), Kenya’s mortgage debt compared to its GDP is
better than its East African neighbors, Tanzania (0.2%) and Uganda (1.0%) at just under 2.5%
but is not as developed as its developing country peers such as India (6%) and Colombia (7%).
However, the mortgage debt to GDP ratio is around 50% in Europe and over 70% in US
indicating there is significant room to grow. The mortgage market in Kenya the World Bank also
says it’s the third most developed in sub-Saharan Africa after South Africa and Namibia.
42.9%
10.7%
Area of operations
Kenya 42.9%
E. Africa 28.6%
Africa 17.9%
Global 10.7%
their operations only in Kenya
while 28.6% had their operations in East Africa. 17.9 % had their operations all over Africa
while the minority of 10.7% had operations all over the world as shown in chart 4.2.1. This
entrate their operations in Kenya. Very few go global.
mortgage market which has more than tripled in the past
Kenya’s mortgage market has grown from Kshs. 19 billion in 2006 to just over Kshs.
2012. This translates to an annual average growth of 34%, indicating an
exponential increase in mortgage loans. Moreover The Government’s commitment to growth of
real estate sector is in our blueprint for Vision 2030 and the Finance Bill, 2010 which has led to
heavy investment by the government in expansion of the infrastructure. All these factors have
contributed in encouraging local investors to invest in the real estate sector. According to the
tgage debt compared to its GDP is
better than its East African neighbors, Tanzania (0.2%) and Uganda (1.0%) at just under 2.5%
but is not as developed as its developing country peers such as India (6%) and Colombia (7%).
atio is around 50% in Europe and over 70% in US
indicating there is significant room to grow. The mortgage market in Kenya the World Bank also
Saharan Africa after South Africa and Namibia.
24
4.2.2 Year of Establishment of the firm
The respondents were requested to indicate the year their firms were established.
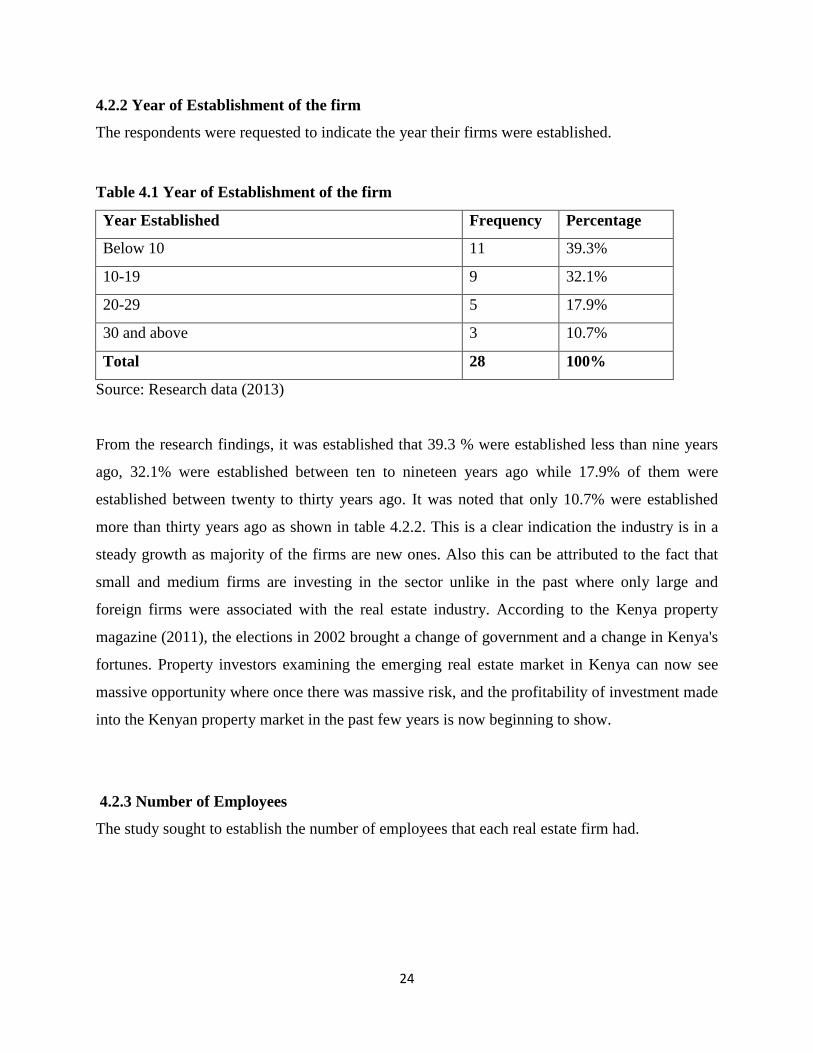
Table 4.1 Year of Establishment of the firm
Year Established Frequency Percentage
Below 10 11 39.3%
10-19 9 32.1%
20-29 5 17.9%
30 and above 3 10.7%
Total 28 100%
Source: Research data (2013)
From the research findings, it was established that 39.3 % were established less than nine years
ago, 32.1% were established between ten to nineteen years ago while 17.9% of them were
established between twenty to thirty years ago. It was noted that only 10.7% were established
more than thirty years ago as shown in table 4.2.2. This is a clear indication the industry is in a
steady growth as majority of the firms are new ones. Also this can be attributed to the fact that
small and medium firms are investing in the sector unlike in the past where only large and
foreign firms were associated with the real estate industry. According to the Kenya property
magazine (2011), the elections in 2002 brought a change of government and a change in Kenya's
fortunes. Property investors examining the emerging real estate market in Kenya can now see
massive opportunity where once there was massive risk, and the profitability of investment made
into the Kenyan property market in the past few years is now beginning to show.
4.2.3 Number of Employees
The study sought to establish the number of employees that each real estate firm had.
25
Table 4.2 Number of employees
No. of Employees Frequency Percentage
1-9 7 25%
10-19 8 28.6%
20-29 6 21.4%
30-39 4 14.3%
40 and above 3 10.7%
Total 28 100%
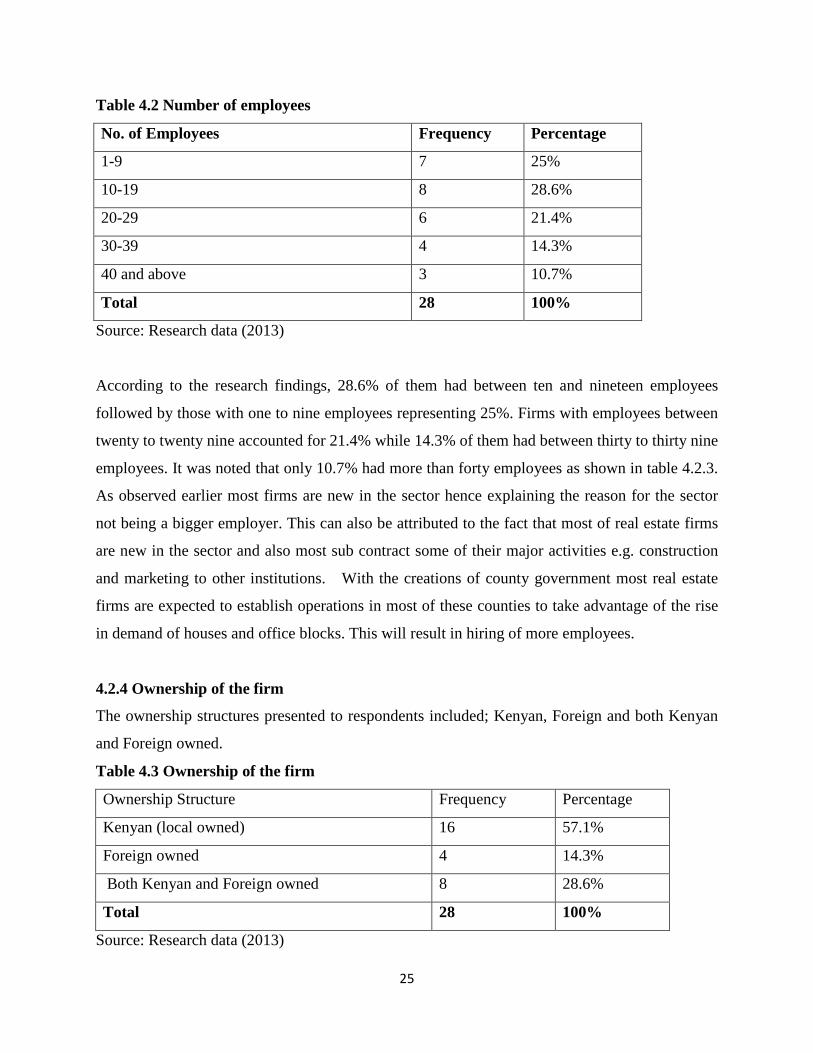
Source: Research data (2013)
According to the research findings, 28.6% of them had between ten and nineteen employees
followed by those with one to nine employees representing 25%. Firms with employees between
twenty to twenty nine accounted for 21.4% while 14.3% of them had between thirty to thirty nine
employees. It was noted that only 10.7% had more than forty employees as shown in table 4.2.3.
As observed earlier most firms are new in the sector hence explaining the reason for the sector
not being a bigger employer. This can also be attributed to the fact that most of real estate firms
are new in the sector and also most sub contract some of their major activities e.g. construction
and marketing to other institutions. With the creations of county government most real estate
firms are expected to establish operations in most of these counties to take advantage of the rise
in demand of houses and office blocks. This will result in hiring of more employees.
4.2.4 Ownership of the firm
The ownership structures presented to respondents included; Kenyan, Foreign and both Kenyan
and Foreign owned.
Table 4.3 Ownership of the firm
Ownership Structure Frequency Percentage
Kenyan (local owned) 16 57.1%
Foreign owned 4 14.3%
Both Kenyan and Foreign owned 8 28.6%
Total 28 100%
Source: Research data (2013)
26
According to the research findings, 57.1% of the firms were fully owned by Kenyans while
28.6% were owned by both Kenyans and foreigners. It was noted that only 14.3% were fully
owned by foreigners as presented in table 4.2.4. This can be attributed to the liberazation of the
financial sector since 2002 which has contributed to the rise of more locals accessing funds to
invest in the sector. Also the higher returns associated with real estate has seen financial
institutions, Saccos and investment groups develop products aimed at wooing local investors to
invest in the sector. Another key mover of the sector is said to be remittances by Kenyan
diaspora.
4.2.5 Position of the respondent
The researcher wanted to establish the positions of the respondents in the real estate firms.
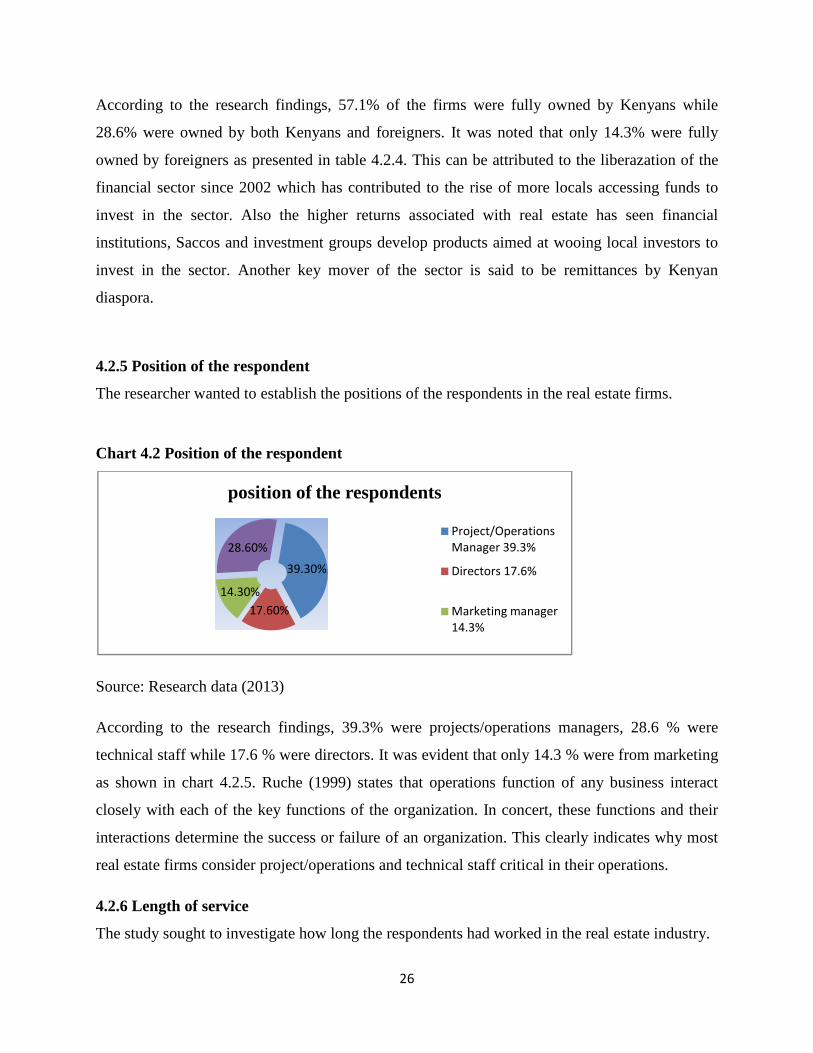
Chart 4.2 Position of the respondent
Source: Research data (2013)
According to the research findings, 39.3% were projects/operations managers, 28.6 % were
technical staff while 17.6 % were directors. It was evident that only 14.3 % were from marketing
as shown in chart 4.2.5. Ruche (1999) states that operations function of any business interact
closely with each of the key functions of the organization. In concert, these functions and their
interactions determine the success or failure of an organization. This clearly indicates why most
real estate firms consider project/operations and technical staff critical in their operations.
4.2.6 Length of service
The study sought to investigate how long the respondents had worked in the real estate industry.
39.30%
17.60%
14.30%
28.60%
position of the respondents
Project/Operations
Manager 39.3%
Directors 17.6%
Marketing manager
14.3%

27
Table 4.4 Length of service
Length of Service Frequency percentage
0-9 15 53.6%
10-19 7 25%
20-29 4 14.3%
30 and above 2 7.1%
Total 28 100%
Source: Research data (2013)
From the research findings, it was established that 53.6% were between zero to nine years in the
industry, 25 % were between ten to nineteen years while 14.3% of them were between twenty to
twenty nine years. It was noted that only 7.1% of the respondents had over 30 years in the
industry as presented in table 4.2.6. This demonstrates that most employees have been in the real
estate industry for a short duration of less than nine years. This is mainly because most firms
were very young in the sector. Also the growth and high returns associated with the sector have
also seen professional from other sectors join the real estate sector in the recent times.
From the above firms profile analysis it’s evident that the real estate sector is destined for greater
growth. Concentration of most firms operations in Kenya indicates the optimism in the sector.
Knight Frank report notes that Kenya’s rapid economic development and a dynamic business
regime are some of the reasons being given for the drive in the sector. The study also indicates
that 39.3% of real estate firms were established less than ten years ago. This can be attributed to
higher returns associated with the sector. For example certain up market areas of the city have
seen property prices increase by up to fifty percent in the last two years alone. Also the study
reveals that the firms are not big recruiters this was attributed to the fact that firms contract most
of their operations. However the construction sector is considered as one biggest employer all
over the world. The study also noted that the sector lack wealth in experience as 53.6% of
employees had less than nine years in the sector.
4.3 Operations Strategies
The first objective of the study was to determine the operations strategies adopted by
firms in Kenya. The operations strategy under focus included Quality, Cost, Time and Flexibility
and the findings are discussed below.
4.3.1 Existence of written operations strategy
The study sought to determine whether the real estate firms i
strategy.
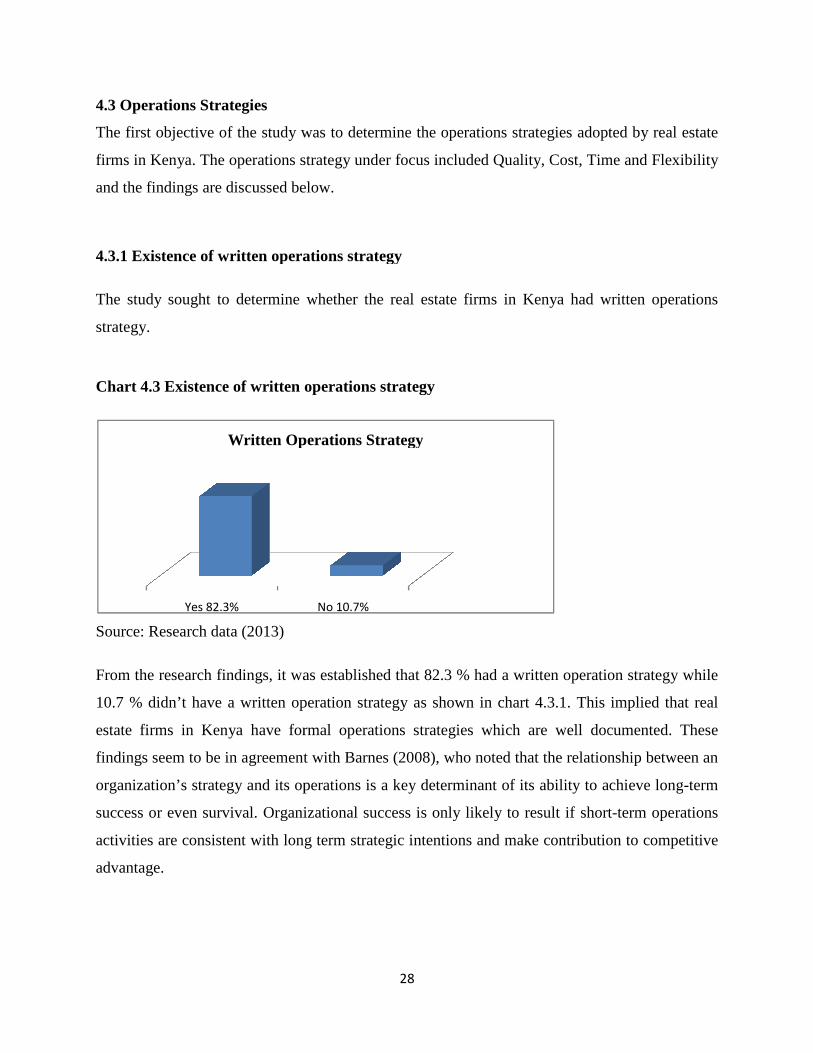
Chart 4.3 Existence of written operations strategy
Source: Research data (2013)
From the research findings, it was established that 82.3 % had a written operation strategy while
10.7 % didn’t have a written opera
estate firms in Kenya have formal operations strategies which are well documented. These
findings seem to be in agreement with Barnes (2008), who noted that the relationship between an
organization’s strategy and its operations is a key determinant of its ability to achieve long
success or even survival. Organizational success is only likely to result if short
activities are consistent with long term strategic intentions and
advantage.
Yes 82.3%
Written Operations Strategy
28
The first objective of the study was to determine the operations strategies adopted by
firms in Kenya. The operations strategy under focus included Quality, Cost, Time and Flexibility
and the findings are discussed below.
4.3.1 Existence of written operations strategy
The study sought to determine whether the real estate firms in Kenya had written operations
Chart 4.3 Existence of written operations strategy
From the research findings, it was established that 82.3 % had a written operation strategy while
10.7 % didn’t have a written operation strategy as shown in chart 4.3.1. This implied that real
estate firms in Kenya have formal operations strategies which are well documented. These
findings seem to be in agreement with Barnes (2008), who noted that the relationship between an
ion’s strategy and its operations is a key determinant of its ability to achieve long
success or even survival. Organizational success is only likely to result if short
activities are consistent with long term strategic intentions and make contribution to competitive
No 10.7%
Written Operations Strategy
The first objective of the study was to determine the operations strategies adopted by real estate
firms in Kenya. The operations strategy under focus included Quality, Cost, Time and Flexibility
n Kenya had written operations
From the research findings, it was established that 82.3 % had a written operation strategy while
tion strategy as shown in chart 4.3.1. This implied that real
estate firms in Kenya have formal operations strategies which are well documented. These
findings seem to be in agreement with Barnes (2008), who noted that the relationship between an
ion’s strategy and its operations is a key determinant of its ability to achieve long-term
success or even survival. Organizational success is only likely to result if short-term operations
make contribution to competitive
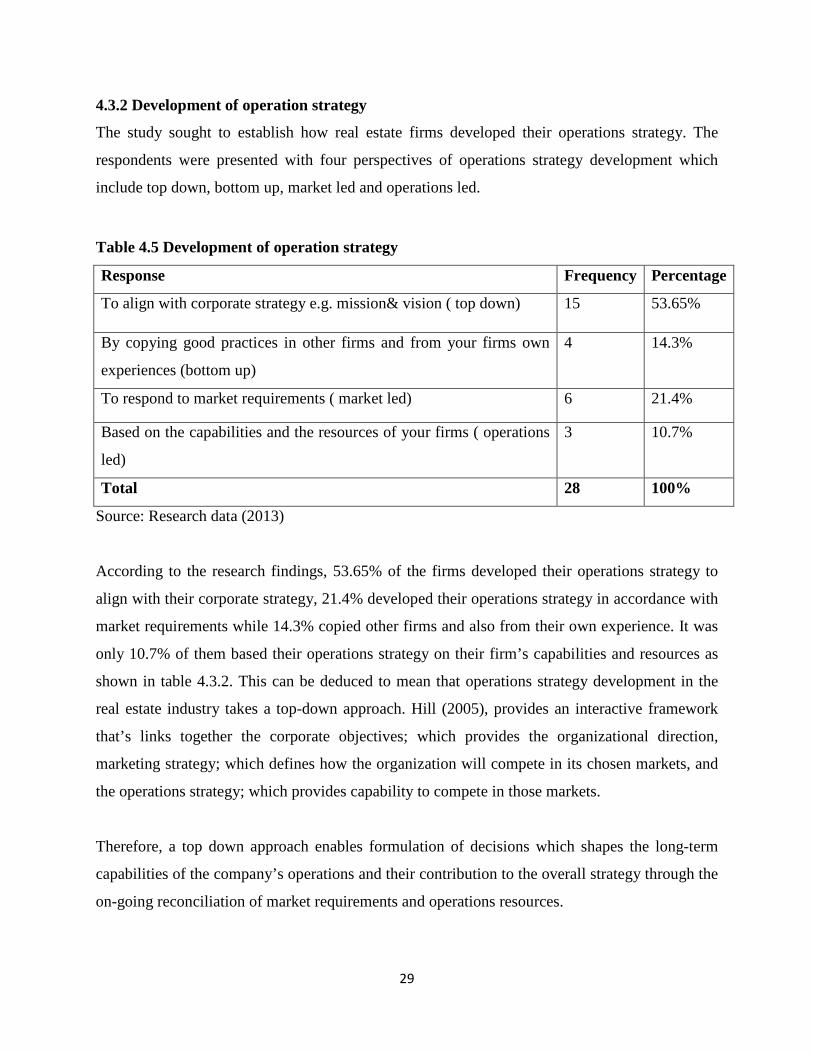
29
4.3.2 Development of operation strategy
The study sought to establish how real estate firms developed their operations strategy. The
respondents were presented with four perspectives of operations strategy development which
include top down, bottom up, market led and operations led.
Table 4.5 Development of operation strategy
Response Frequency Percentage
To align with corporate strategy e.g. mission& vision ( top down) 15 53.65%
By copying good practices in other firms and from your firms own
experiences (bottom up)
4 14.3%
To respond to market requirements ( market led) 6 21.4%
Based on the capabilities and the resources of your firms ( operations
led)
3 10.7%
Total 28 100%
Source: Research data (2013)
According to the research findings, 53.65% of the firms developed their operations strategy to
align with their corporate strategy, 21.4% developed their operations strategy in accordance with
market requirements while 14.3% copied other firms and also from their own experience. It was
only 10.7% of them based their operations strategy on their firm’s capabilities and resources as
shown in table 4.3.2. This can be deduced to mean that operations strategy development in the
real estate industry takes a top-down approach. Hill (2005), provides an interactive framework
that’s links together the corporate objectives; which provides the organizational direction,
marketing strategy; which defines how the organization will compete in its chosen markets, and
the operations strategy; which provides capability to compete in those markets.
Therefore, a top down approach enables formulation of decisions which shapes the long-term
capabilities of the company’s operations and their contribution to the overall strategy through the
on-going reconciliation of market requirements and operations resources.
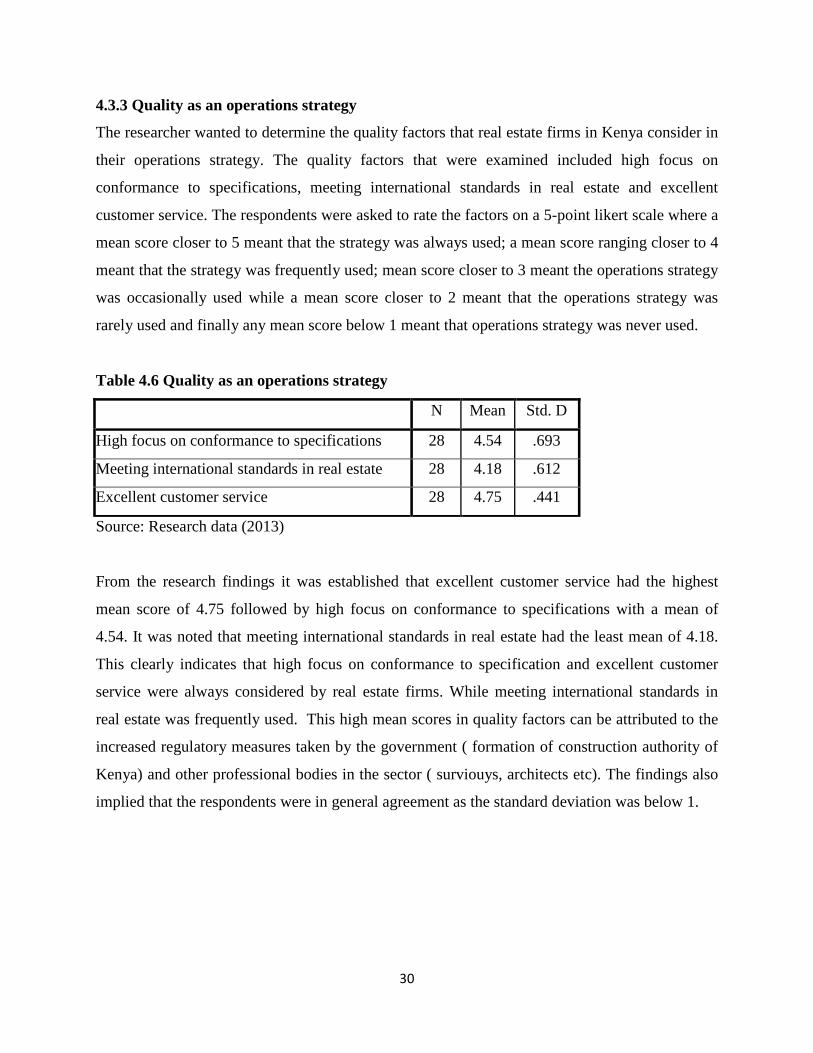
30
4.3.3 Quality as an operations strategy
The researcher wanted to determine the quality factors that real estate firms in Kenya consider in
their operations strategy. The quality factors that were examined included high focus on
conformance to specifications, meeting international standards in real estate and excellent
customer service. The respondents were asked to rate the factors on a 5-point likert scale where a
mean score closer to 5 meant that the strategy was always used; a mean score ranging closer to 4
meant that the strategy was frequently used; mean score closer to 3 meant the operations strategy
was occasionally used while a mean score closer to 2 meant that the operations strategy was
rarely used and finally any mean score below 1 meant that operations strategy was never used.
Table 4.6 Quality as an operations strategy
N Mean Std. D
High focus on conformance to specifications 28 4.54 .693
Meeting international standards in real estate 28 4.18 .612
Excellent customer service 28 4.75 .441
Source: Research data (2013)
From the research findings it was established that excellent customer service had the highest
mean score of 4.75 followed by high focus on conformance to specifications with a mean of
4.54. It was noted that meeting international standards in real estate had the least mean of 4.18.
This clearly indicates that high focus on conformance to specification and excellent customer
service were always considered by real estate firms. While meeting international standards in
real estate was frequently used. This high mean scores in quality factors can be attributed to the
increased regulatory measures taken by the government ( formation of construction authority of
Kenya) and other professional bodies in the sector ( surviouys, architects etc). The findings also
implied that the respondents were in general agreement as the standard deviation was below 1.
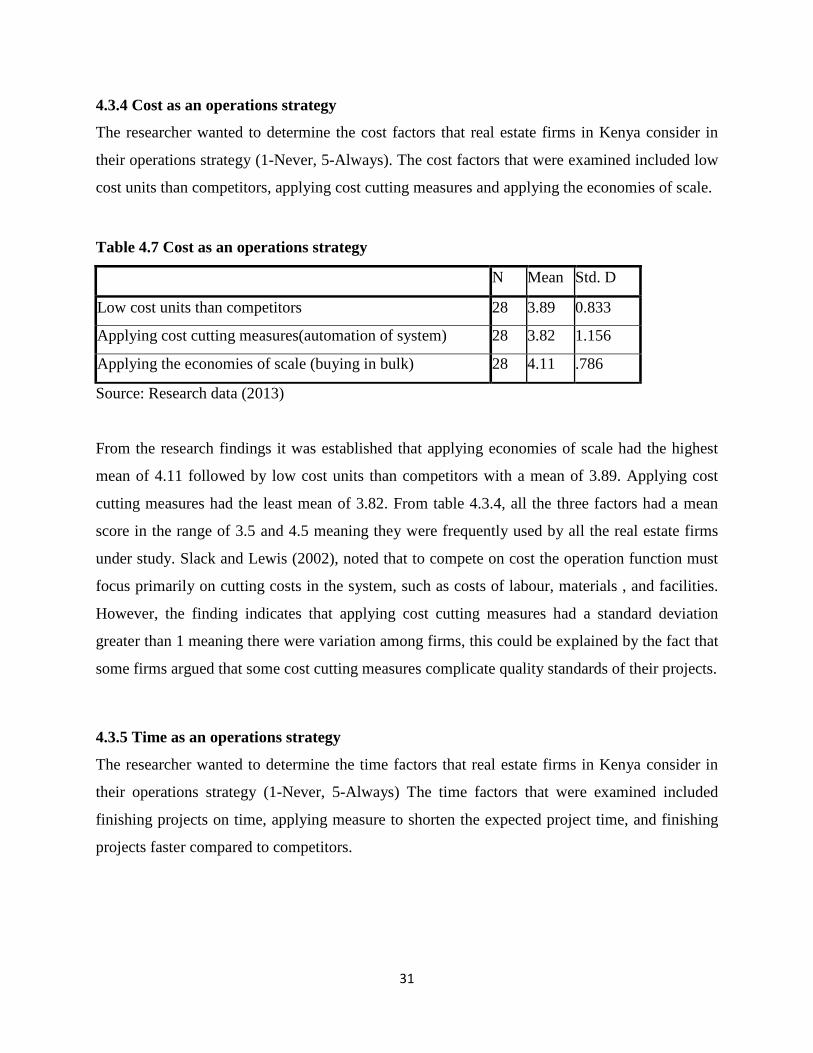
31
4.3.4 Cost as an operations strategy
The researcher wanted to determine the cost factors that real estate firms in Kenya consider in
their operations strategy (1-Never, 5-Always). The cost factors that were examined included low
cost units than competitors, applying cost cutting measures and applying the economies of scale.
Table 4.7 Cost as an operations strategy
Source: Research data (2013)
From the research findings it was established that applying economies of scale had the highest
mean of 4.11 followed by low cost units than competitors with a mean of 3.89. Applying cost
cutting measures had the least mean of 3.82. From table 4.3.4, all the three factors had a mean
score in the range of 3.5 and 4.5 meaning they were frequently used by all the real estate firms
under study. Slack and Lewis (2002), noted that to compete on cost the operation function must
focus primarily on cutting costs in the system, such as costs of labour, materials , and facilities.
However, the finding indicates that applying cost cutting measures had a standard deviation
greater than 1 meaning there were variation among firms, this could be explained by the fact that
some firms argued that some cost cutting measures complicate quality standards of their projects.
4.3.5 Time as an operations strategy
The researcher wanted to determine the time factors that real estate firms in Kenya consider in
their operations strategy (1-Never, 5-Always) The time factors that were examined included
finishing projects on time, applying measure to shorten the expected project time, and finishing
projects faster compared to competitors.
N Mean Std. D
Low cost units than competitors 28 3.89 0.833
Applying cost cutting measures(automation of system) 28 3.82 1.156
Applying the economies of scale (buying in bulk) 28 4.11 .786
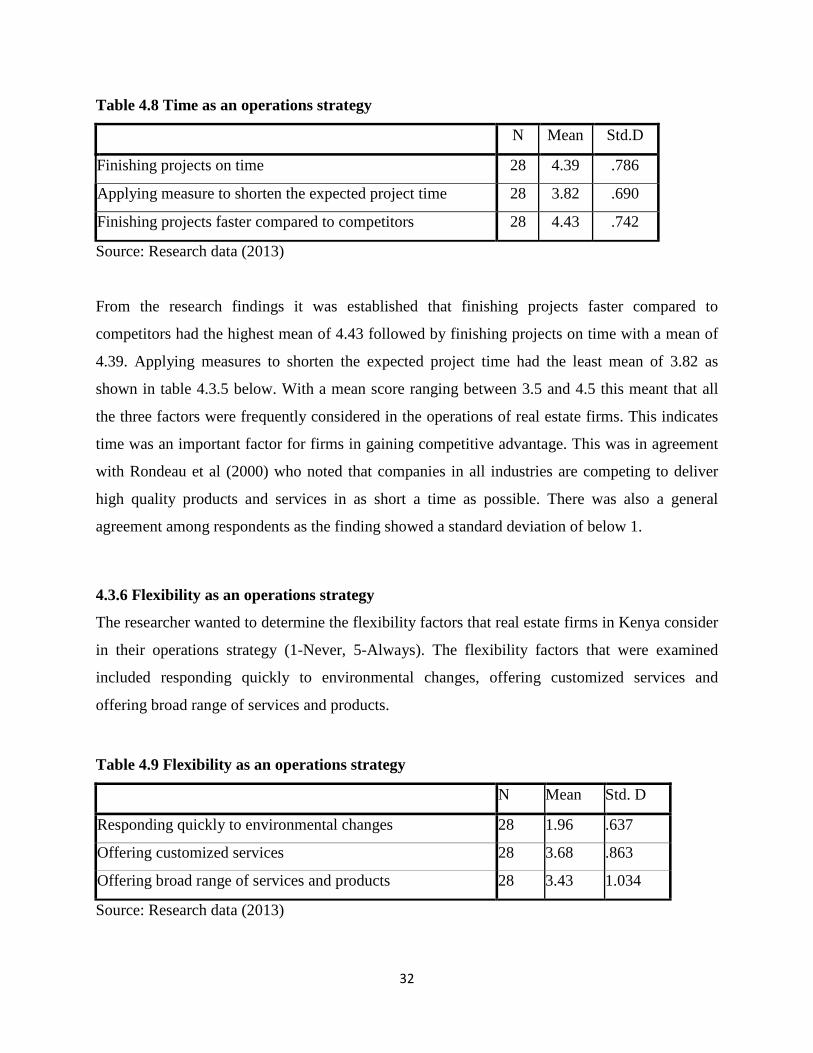
32
Table 4.8 Time as an operations strategy
N Mean Std.D
Finishing projects on time 28 4.39 .786
Applying measure to shorten the expected project time 28 3.82 .690
Finishing projects faster compared to competitors 28 4.43 .742
Source: Research data (2013)
From the research findings it was established that finishing projects faster compared to
competitors had the highest mean of 4.43 followed by finishing projects on time with a mean of
4.39. Applying measures to shorten the expected project time had the least mean of 3.82 as
shown in table 4.3.5 below. With a mean score ranging between 3.5 and 4.5 this meant that all
the three factors were frequently considered in the operations of real estate firms. This indicates
time was an important factor for firms in gaining competitive advantage. This was in agreement
with Rondeau et al (2000) who noted that companies in all industries are competing to deliver
high quality products and services in as short a time as possible. There was also a general
agreement among respondents as the finding showed a standard deviation of below 1.
4.3.6 Flexibility as an operations strategy
The researcher wanted to determine the flexibility factors that real estate firms in Kenya consider
in their operations strategy (1-Never, 5-Always). The flexibility factors that were examined
included responding quickly to environmental changes, offering customized services and
offering broad range of services and products.
Table 4.9 Flexibility as an operations strategy
N Mean Std. D
Responding quickly to environmental changes 28 1.96 .637
Offering customized services 28 3.68 .863
Offering broad range of services and products 28 3.43 1.034
Source: Research data (2013)
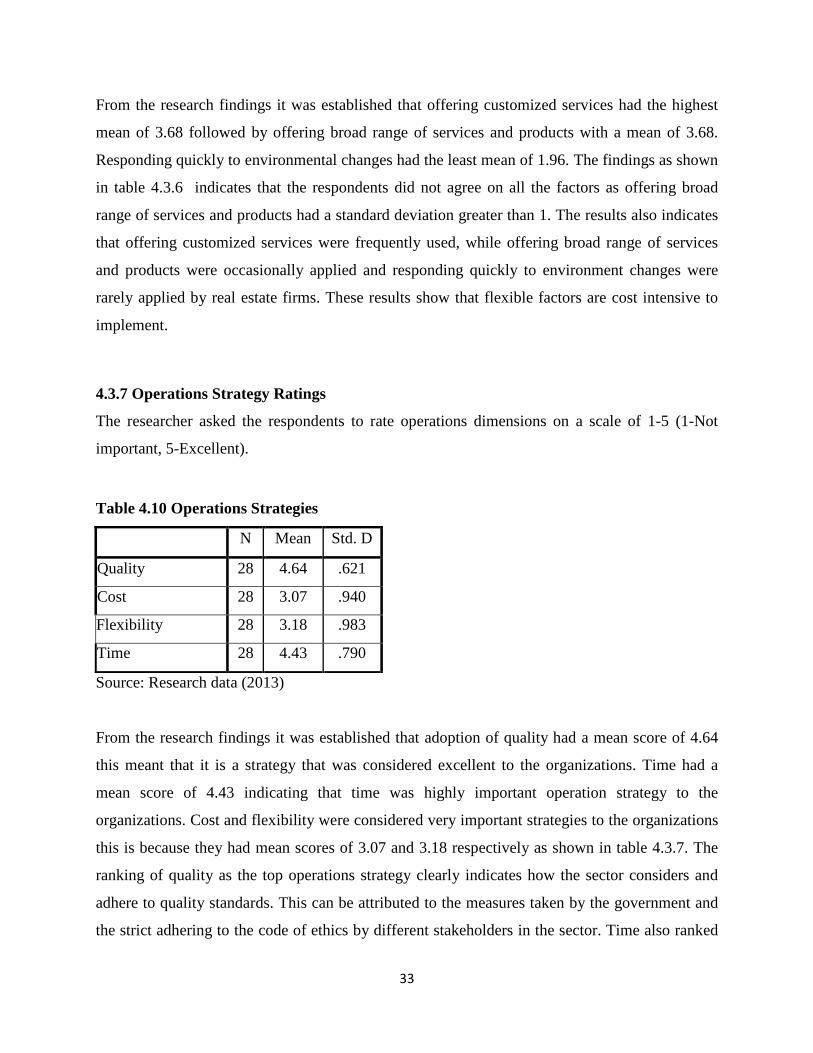
33
From the research findings it was established that offering customized services had the highest
mean of 3.68 followed by offering broad range of services and products with a mean of 3.68.
Responding quickly to environmental changes had the least mean of 1.96. The findings as shown
in table 4.3.6 indicates that the respondents did not agree on all the factors as offering broad
range of services and products had a standard deviation greater than 1. The results also indicates
that offering customized services were frequently used, while offering broad range of services
and products were occasionally applied and responding quickly to environment changes were
rarely applied by real estate firms. These results show that flexible factors are cost intensive to
implement.
4.3.7 Operations Strategy Ratings
The researcher asked the respondents to rate operations dimensions on a scale of 1-5 (1-Not
important, 5-Excellent).
Table 4.10 Operations Strategies
N Mean Std. D
Quality 28 4.64 .621
Cost 28 3.07 .940
Flexibility 28 3.18 .983
Time 28 4.43 .790
Source: Research data (2013)
From the research findings it was established that adoption of quality had a mean score of 4.64
this meant that it is a strategy that was considered excellent to the organizations. Time had a
mean score of 4.43 indicating that time was highly important operation strategy to the
organizations. Cost and flexibility were considered very important strategies to the organizations
this is because they had mean scores of 3.07 and 3.18 respectively as shown in table 4.3.7. The
ranking of quality as the top operations strategy clearly indicates how the sector considers and
adhere to quality standards. This can be attributed to the measures taken by the government and
the strict adhering to the code of ethics by different stakeholders in the sector. Time also ranked
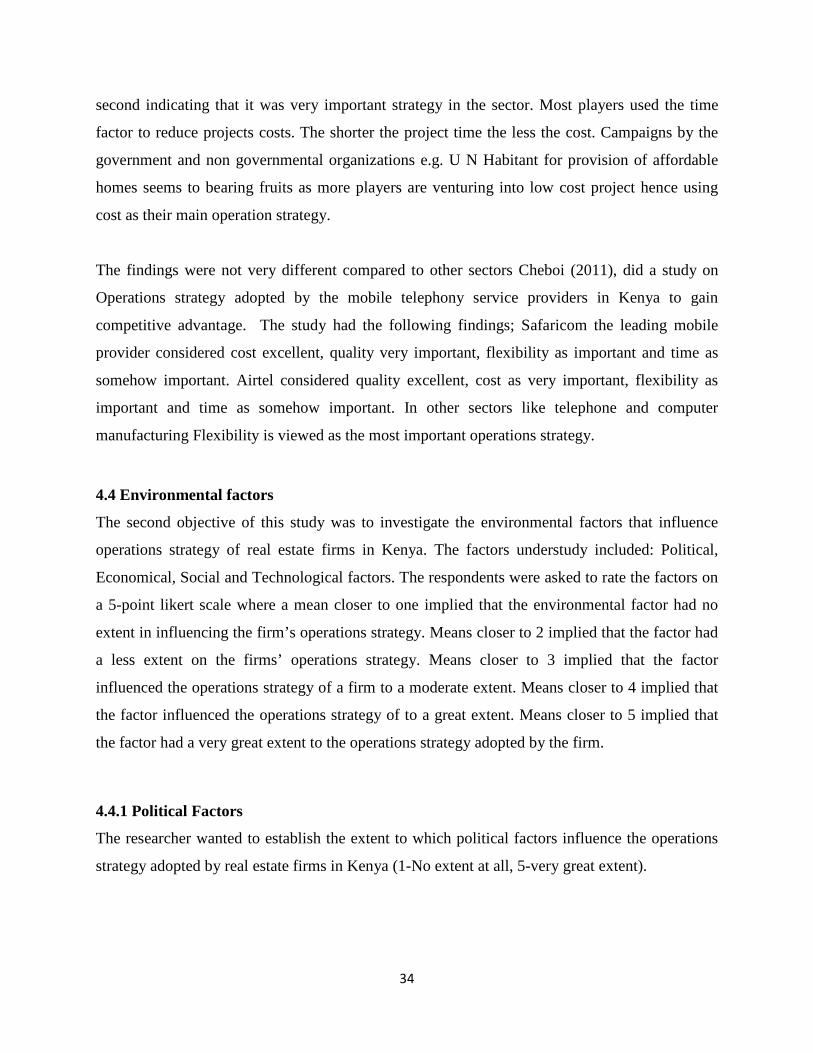
34
second indicating that it was very important strategy in the sector. Most players used the time
factor to reduce projects costs. The shorter the project time the less the cost. Campaigns by the
government and non governmental organizations e.g. U N Habitant for provision of affordable
homes seems to bearing fruits as more players are venturing into low cost project hence using
cost as their main operation strategy.
The findings were not very different compared to other sectors Cheboi (2011), did a study on
Operations strategy adopted by the mobile telephony service providers in Kenya to gain
competitive advantage. The study had the following findings; Safaricom the leading mobile
provider considered cost excellent, quality very important, flexibility as important and time as
somehow important. Airtel considered quality excellent, cost as very important, flexibility as
important and time as somehow important. In other sectors like telephone and computer
manufacturing Flexibility is viewed as the most important operations strategy.
4.4 Environmental factors
The second objective of this study was to investigate the environmental factors that influence
operations strategy of real estate firms in Kenya. The factors understudy included: Political,
Economical, Social and Technological factors. The respondents were asked to rate the factors on
a 5-point likert scale where a mean closer to one implied that the environmental factor had no
extent in influencing the firm’s operations strategy. Means closer to 2 implied that the factor had
a less extent on the firms’ operations strategy. Means closer to 3 implied that the factor
influenced the operations strategy of a firm to a moderate extent. Means closer to 4 implied that
the factor influenced the operations strategy of to a great extent. Means closer to 5 implied that
the factor had a very great extent to the operations strategy adopted by the firm.
4.4.1 Political Factors
The researcher wanted to establish the extent to which political factors influence the operations
strategy adopted by real estate firms in Kenya (1-No extent at all, 5-very great extent).
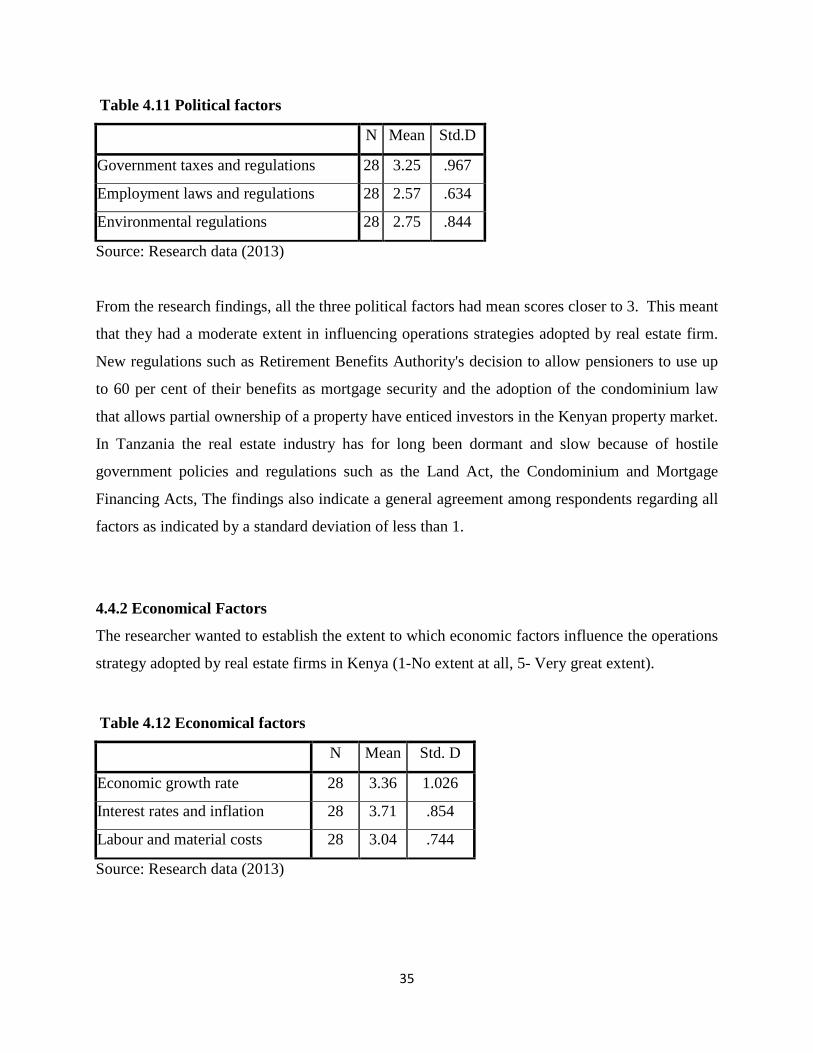
35
Table 4.11 Political factors
N Mean Std.D
Government taxes and regulations 28 3.25 .967
Employment laws and regulations 28 2.57 .634
Environmental regulations 28 2.75 .844
Source: Research data (2013)
From the research findings, all the three political factors had mean scores closer to 3. This meant
that they had a moderate extent in influencing operations strategies adopted by real estate firm.
New regulations such as Retirement Benefits Authority's decision to allow pensioners to use up
to 60 per cent of their benefits as mortgage security and the adoption of the condominium law
that allows partial ownership of a property have enticed investors in the Kenyan property market.
In Tanzania the real estate industry has for long been dormant and slow because of hostile
government policies and regulations such as the Land Act, the Condominium and Mortgage
Financing Acts, The findings also indicate a general agreement among respondents regarding all
factors as indicated by a standard deviation of less than 1.
4.4.2 Economical Factors
The researcher wanted to establish the extent to which economic factors influence the operations
strategy adopted by real estate firms in Kenya (1-No extent at all, 5- Very great extent).
Table 4.12 Economical factors
N Mean Std. D
Economic growth rate 28 3.36 1.026
Interest rates and inflation 28 3.71 .854
Labour and material costs 28 3.04 .744
Source: Research data (2013)
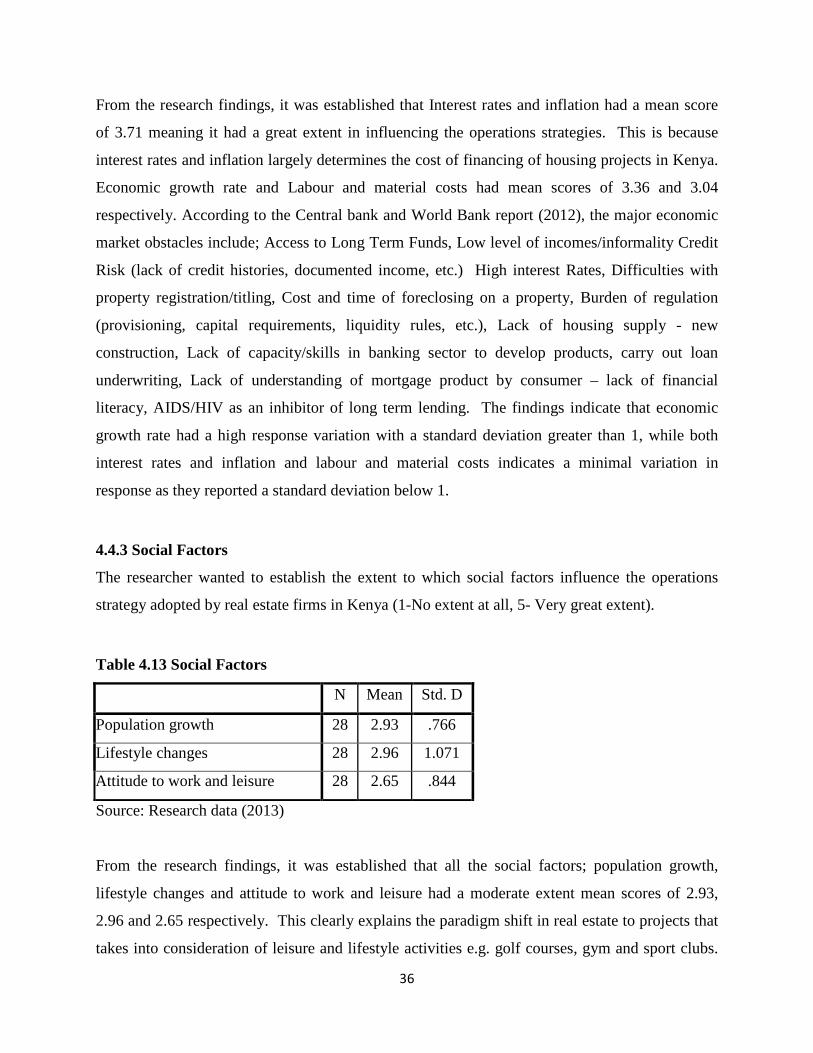
36
From the research findings, it was established that Interest rates and inflation had a mean score
of 3.71 meaning it had a great extent in influencing the operations strategies. This is because
interest rates and inflation largely determines the cost of financing of housing projects in Kenya.
Economic growth rate and Labour and material costs had mean scores of 3.36 and 3.04
respectively. According to the Central bank and World Bank report (2012), the major economic
market obstacles include; Access to Long Term Funds, Low level of incomes/informality Credit
Risk (lack of credit histories, documented income, etc.) High interest Rates, Difficulties with
property registration/titling, Cost and time of foreclosing on a property, Burden of regulation
(provisioning, capital requirements, liquidity rules, etc.), Lack of housing supply - new
construction, Lack of capacity/skills in banking sector to develop products, carry out loan
underwriting, Lack of understanding of mortgage product by consumer – lack of financial
literacy, AIDS/HIV as an inhibitor of long term lending. The findings indicate that economic
growth rate had a high response variation with a standard deviation greater than 1, while both
interest rates and inflation and labour and material costs indicates a minimal variation in
response as they reported a standard deviation below 1.
4.4.3 Social Factors
The researcher wanted to establish the extent to which social factors influence the operations
strategy adopted by real estate firms in Kenya (1-No extent at all, 5- Very great extent).
Table 4.13 Social Factors
N Mean Std. D
Population growth 28 2.93 .766
Lifestyle changes 28 2.96 1.071
Attitude to work and leisure 28 2.65 .844
Source: Research data (2013)
From the research findings, it was established that all the social factors; population growth,
lifestyle changes and attitude to work and leisure had a moderate extent mean scores of 2.93,
2.96 and 2.65 respectively. This clearly explains the paradigm shift in real estate to projects that
takes into consideration of leisure and lifestyle activities e.g. golf courses, gym and sport clubs.
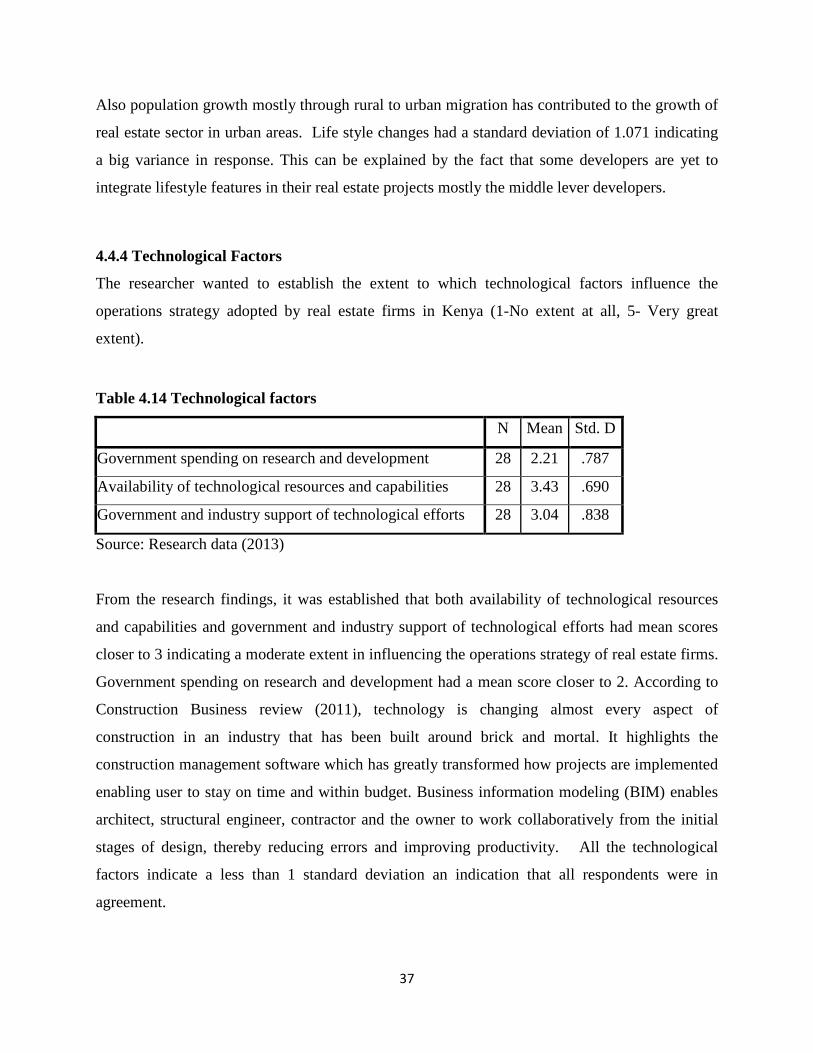
37
Also population growth mostly through rural to urban migration has contributed to the growth of
real estate sector in urban areas. Life style changes had a standard deviation of 1.071 indicating
a big variance in response. This can be explained by the fact that some developers are yet to
integrate lifestyle features in their real estate projects mostly the middle lever developers.
4.4.4 Technological Factors
The researcher wanted to establish the extent to which technological factors influence the
operations strategy adopted by real estate firms in Kenya (1-No extent at all, 5- Very great
extent).
Table 4.14 Technological factors
N Mean Std. D
Government spending on research and development 28 2.21 .787
Availability of technological resources and capabilities 28 3.43 .690
Government and industry support of technological efforts 28 3.04 .838
Source: Research data (2013)
From the research findings, it was established that both availability of technological resources
and capabilities and government and industry support of technological efforts had mean scores
closer to 3 indicating a moderate extent in influencing the operations strategy of real estate firms.
Government spending on research and development had a mean score closer to 2. According to
Construction Business review (2011), technology is changing almost every aspect of
construction in an industry that has been built around brick and mortal. It highlights the
construction management software which has greatly transformed how projects are implemented
enabling user to stay on time and within budget. Business information modeling (BIM) enables
architect, structural engineer, contractor and the owner to work collaboratively from the initial
stages of design, thereby reducing errors and improving productivity. All the technological
factors indicate a less than 1 standard deviation an indication that all respondents were in
agreement.
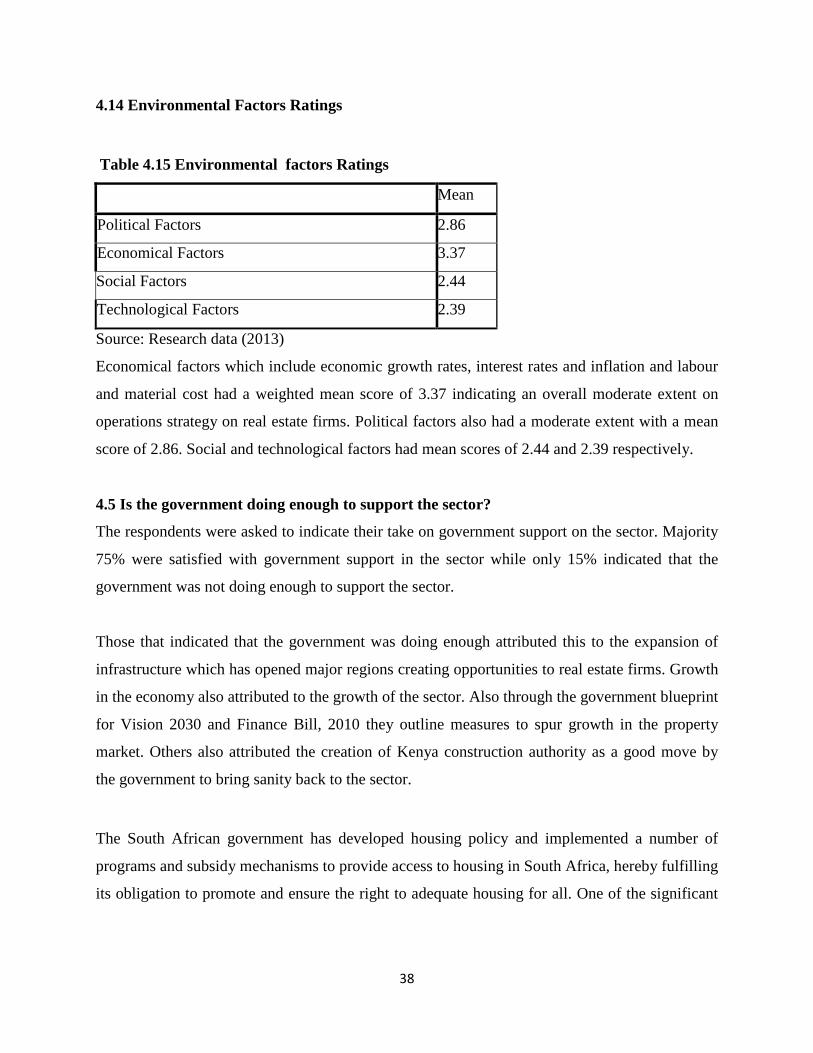
38
4.14 Environmental Factors Ratings
Table 4.15 Environmental factors Ratings
Mean
Political Factors 2.86
Economical Factors 3.37
Social Factors 2.44
Technological Factors 2.39
Source: Research data (2013)
Economical factors which include economic growth rates, interest rates and inflation and labour
and material cost had a weighted mean score of 3.37 indicating an overall moderate extent on
operations strategy on real estate firms. Political factors also had a moderate extent with a mean
score of 2.86. Social and technological factors had mean scores of 2.44 and 2.39 respectively.
4.5 Is the government doing enough to support the sector?
The respondents were asked to indicate their take on government support on the sector. Majority
75% were satisfied with government support in the sector while only 15% indicated that the
government was not doing enough to support the sector.
Those that indicated that the government was doing enough attributed this to the expansion of
infrastructure which has opened major regions creating opportunities to real estate firms. Growth
in the economy also attributed to the growth of the sector. Also through the government blueprint
for Vision 2030 and Finance Bill, 2010 they outline measures to spur growth in the property
market. Others also attributed the creation of Kenya construction authority as a good move by
the government to bring sanity back to the sector.
The South African government has developed housing policy and implemented a number of
programs and subsidy mechanisms to provide access to housing in South Africa, hereby fulfilling
its obligation to promote and ensure the right to adequate housing for all. One of the significant
39
housing subsidy schemes that are being implemented by government is the Peoples Housing
Process (PHP). These policy priorities are consistent with those of Habitat Agenda.
Those who had contrary opinion on government support to the sector attributed this mostly to the
bureaucratic process at the land registry offices which have seen investors and individuals lose
million of shillings through fraud. Lack of structured mechanism to control mortgage rate and
interest rate have also resulted to financial institutions raising the cost of finances at will, this
resulted to real estate firms unable to sell their houses to prospective buyers.
4.6 Discussions
The real estate sector in Kenya considers project/operations as a key department. 39.3% of the
respondents were projects/operations managers. Therefore for any real estate firm to be
successful, their strategies have to be aligned to operations. Barnes (2008) noted that the
relationship between an organization’s strategy and its operations is a key determinant of its
ability to achieve long-term success or even survival. Moreover, the real estate firms in Kenya
were found to have a written operations strategy. Strategy requires to be taken seriously as a
managerial tool not only for the firm but also for a broad spectrum of social organization (Ansoff
and McDonnel, 1990)
Real estate firms in Kenya frequently considered quality factors in their operations strategy.
Companies that compete on quality must deliver not only high-performance design but goods
and services consistency as well. It was noted that all cost factors were frequently considered for
real estate firms’ operations strategies. With the intense global competition, companies today
understand that the best way to boost the bottom line is to cut costs through more efficient
operations management (Wee, 2009). Moreover, it was evident that all time factors were
frequently considered in real estate industry operations strategies.
Quality was the most common operations strategy even though all the others were viewed as
very important in an operations strategy. Slack et al. (2004) argues that there are four operations
performance objectives; which are also referred as competitive priorities. Excellent customer
service from quality dimension had the highest consideration of with a mean of 4.75 while quick
40
response to environmental changes from flexibility dimension was rarely considered with the
least mean of 1.96.
On environmental factors that influence operations strategy, it was noted that all political factors
had a moderate influence. Economic factors either had a moderate or great influence on
operations strategy. According to World Bank (2011), certain up market areas of the city have
seen property prices increase by up to fifty percent in the last two years alone. Moreover, all
social factors had a moderate influence on operations strategy. It was noted that technological
factors either had a small or moderate influence on operations strategy adopted by real estate
firms in Kenya. However some variations were evident with interest rates and inflation
(economic factor) having the greatest influence with a mean of 3.71 while government spending
on research and development (technological factor) having the smallest influence of 2.21. In an
industry keen on reducing the cost of operations and improve on efficiency the results indicates
that technological factors were not utilized as it could be expected.
41
CHAPTER FIVE:
SUMMARY, CONCLUSIONS AND RECOMMENDATIONS
5.1 Summary
The study was on the operations strategy in Kenya’s real estate sector. Generally 82.3 % of the
real estate firms in Kenya were found to have written operations strategies. This implied that
operations strategy is considered important in real estate sector. Aosa (1998) reaffirmed that
strategy was useful in helping managers tackle the potential problems that face the companies. It
was noted that majority of employees working in the real estate sector were new in the sector
having worked less than nine years. It was found that only 7.1% of the respondents had over 30
years experience in the real estate sector. These employees were mostly found to be from
project/operations or technical areas. Only 14.3 % of the employees came from marketing.
Moreover, most real estate firms were locally owned by Kenyans which accounted for 57.1 %
and 42.9 % of the real estate firms in Kenya concentrated their operations within Kenya.
According to Knight Frank 4th Quarter report (2012), Kenya has an emerging housing micro-
sector and NGOs catering for the lower end of the pyramid. Also buoyed by an expanding
middle class, improved infrastructure and an enduring property boom the sector is destined for
prosperity. This explains the research finding why there are more new players in the sector.
The first objective of the study to investigate operations strategies adopted in the real estate
sector in Kenya was compounded by the fact that most of the factors were frequently considered
in the operations strategy of real estate firms in Kenya. Excellent customer service from quality
dimension had the highest consideration of with a mean of 4.75 while quick response to
environmental changes from flexibility dimension was rarely considered with the least mean of
1.96. Moreover, all the operations strategy dimensions were very important with quality ranked
first with a mean of 4.64.
The second objective of the study of investigating the influence of business environment on
operations strategies was backed by findings which revealed that there that most environmental
factors had a moderate influence on the operations strategy adopted by real estate firms in
42
Kenya. However some variations were evident with interest rates and inflation (economic factor)
having the greatest influence with a mean of 3.71 while government spending on research and
development (technological factor) having the smallest influence of 2.21.
5.2 Conclusions
From the study findings can be concluded that even though most of the factors were frequently
considered in the operations strategy of real estate firms in Kenya, some of the factors were
highly regarded. This was evident from the way respondents replied to questions and the analysis
arising thereof. This study established that quality factors were considered to be very important
in operations strategy in the real estate sector. Therefore real estate sector players should pay
more attention to quality to ensure their operations strategies are successful. Companies that
complete based on quality have to address two issues: the product must be designed to meet
customer needs, and the process must produce the product exactly as it is designed (Slack and
Lewis 2002). This is mainly because customers in the real estate sector consider quality as their
top priority, and many customers say that they look for quality in the products they buy. These
results present good news to an industry previously facing a lot of challenges in quality
assurance from collapsing building and constructions on road reserves and public utility spaces.
Moreover it can be concluded that most real estate players considered economic factors to have
the greatest influence. Waters (2008) argued that low costs are achieved by eliminating all
wastes and this approach has become increasingly known as lean operations. With the intense
global competition, companies today understand that the best way to boost the bottom line is to
cut costs through more efficient operations management (Wee, 2009). This can be seen from the
research findings which showed that interest rates and inflation were the mostly considered cost
factors while adopting an operations strategy.
5.3 Policy Recommendations
The government should ease the procedures of land acquisition and registration because the
sector is growing. Njeri Cerere, CEO of the Kenya Property Developers Association notes that
the story is different in Rwanda, as it is currently the best emerging real estate market. The
Rwandan government has put in place measures to make the country conducive for investment.
43
In 2009, four major commercial laws were passed in addition to administrative changes that
make it easier to start a business, employ workers, register property, get credit and be protected
as an investor. Following these changes, the building design approval process takes less than
three days. This contrasts sharply with Kenya where property developers have for many years
protested the unnecessary delays in the registration and approval processes.
The government should develop a framework for public private partnerships between
government agencies and the private sector mainly focusing on affordable housing for the low
income market. This sector is shunned by developers mainly because of the low returns as
compared to the higher income markets. This can be done by offering incentives e.g. tax
exemptions on construction materials, tax exemptions on mortgage loans so as to lower the cost
of finance to developers in the low market sector. The new constitution has created counties,
now the county government should develop housing policies in their respective counties to spur
the real estate sector in those regions.
The construction industry has been faulted for being a major exploiter of natural non-renewable
resources and polluter of the environment through resources depletion, energy consumption, air
pollution and generation of waste in the acquisition of raw materials and construction site
process. This call on all policy makers in the sector to develop policies that safeguards our
environment and strict measures takes on those who fail to comply.
Financiers should also develop measures that will see the cost of housing reduce. According to
Hass consult quarterly report, Kenya had a total of 19,177 mortgage accounts by December last
year. This clearly indicates that very few Kenyans can afford a mortgage. Both the government
and the private sector should develop mechanisms to improve this statistics.
5.4 Limitations of the study
This study was successfully undertaken but not without a few limitations. One such limitation
was that some of the respondents declined to respond to the questionnaires. The time period
covered by the study and the resources available to the researcher were also limited.
44
The finding of this study could only be limited to firms located in Nairobi. The operations
strategy adopted by others firms within the country may show different results and thus the study
may not confidently reflect the happenings in the country in general.
5.5 Suggestions for further research
Arising from the study, the following directions for future research in Operations were
recommended: First, this study focused on the general real estate sector in Kenya. Therefore,
generalisations could not adequately be extended to the specific real estate categories which
comprised of commercial, residential, industrial, agricultural and special properties that have
their own unique development problems. Based on this fact among others, it is therefore
recommended that a narrow based study covering a specific real estate category be done to
determine operations strategies adopted and the influence of business environment on operations
strategies. Similar surveys to this can also be replicated in a few years to come to asses if the
operations strategies have changed as the real estate sector continues to develop in Kenya. More
researches should also be carried out on county basis since every county have their unique
characteristics. This may help in development of county housing policies in the provision of
affordable housing.
It is also recommended a further research on how operations strategies influence the performance
of real estate companies. This will help by providing critical information to existing and new
investor in the sector on how expands their real estate firms. It will also provide critical
information from the buyer’s perspective.
45
REFERENCES
Ani, K.S and Suresh N. (2006), Operations Management.
Aquilano, N.J, Chase R.B (1991), Fundamentals of Operations
Aquilano, N.J, Chase R.B (2004), Operations Management for Competitive Advantage
Barasa, C . (2010). Assessment of The Attractiveness of the Real Estate Management Industry in
Kenya. Unpublished Research Project. University of Nairobi
Barnes, D. (2008). Operations Management: An international perspective
Brian, J. C. (2011). Lean Operations Principle Tools & Practices – Management Production
Information and Administration
Cheboi, Anne Jepkoskei (2011), Operations Strategy Adopted by the Mobile Telephony Service
Providers in Kenya to Gain Competitive Advantage. Unpublished Research Project.
University of Nairobi
David, X. P, Schroeder R.G, Rachna S, (2011),"Competitive priorities, plant improvement and
innovation capabilities, and operational performance: A test of two forms of fit",
International Journal of Operations & Production Management, Vol. 31.
Ferdows, K. and de Meyer, A. (1990) ‘Lasting improvement in manufacturing’, Journal of
Operations.
Gok, (2004), ‘Seasonal paper No.3 of 2004 on National Housing Policy for Kenya,’ Ministry of
Housing.
GoK, (2005), ‘The Kenya Slum Upgrading Strategy, 2005 – 2020,’ Ministry of Housing.
46
Gok, (2010), ‘The constitution of Republic of Kenya
Harold, E. F, Ruch A. W, David C.W, Production / Operations Management 4th Edition
Hayes, R.H, Wheelwright, S.C, (1984) Restoring our competitive edge: Competing through
Manufacturing, Newyork: John Wiley.
Heizer, J. Render B. Principles of Operations Management: Pearson International Edition
James, B. Dilworth (1996). Operations Management: Design, Planning, And Control for
Manufacturing and service
Johnson, G. Scholes K, Whittington R, (2006) Exploring Corporate Strategy FT Prentice Hall.
Karanja, P.W. (2002). Competitive Strategies of Real Estate Firms; The perspective and Porter
Generic Model. Unpublished Research Project. University of Nairobi
Kwasi, Amoako-Gyampah, Samuel S. Boye (2001). Operations strategy in an emerging
economy: the case of the Ghanaian manufacturing industry. International Journal of
Operations Management Vol 19.
Masood, A. Badria, Donald Davisb, Donna Davis (2000). Operations strategy, environmental
uncertainty and performance: a path analytic model of industries in developing
countries. International Journal of Management Science Vol 23.
Nachimias, C.F (1996). Research methods in the social sciences, 5th edition.
Nazim, U. A. and Ray V. M (1995). Operations Strategy and Organizational Performance: An
Empirical Study. International Journal of Operations & Production Management, Vol. 13.
Operations Management, Vol 9(2).
47
Peter, T. Ward, Rebecca Duray, G. Keong Leong and Chee-Chuong Sum (1995). Business
Environment, Operations Strategy, and Performance: An Empirical Study of Singapore
Manufacturers. International Journal of Operations Management Vol 13(2).
Peter, T.W, John K.M, Larry P. R, and Deven S. (1998). Competitive Priorities in Operations
Management. Volume 29 Number 4.
Platts, K. Gregory, M. (1990), ‘Manufacturing audit in the process of strategy formulation’,
International Journal of Operations and Production Journal.
Porter, M.E, (1996) what is Strategy? Harvard Business Review: Nov/Dec 1996 Vol 74 Issue 6
Potter, M. (1996) Havard Business Review: What is Strategy?
Reid, R. D and Sanders N R. (2010). Operations Management (2010). 4th Edition Wiley
Richard, B. Chase, F. Roberts Jacobs, Nicholas, J. Acquilano, (2004) Operations Management
for Competitive Advantage, 10th Edition. New York: Irwin McGraw Hill.
Roberto, S. Graeme K, Mike B, (2008). "Strategic consensus on manufacturing competitive
priorities: A new methodology and proposals for research", Journal of Manufacturing
Technology Management, Vol. 19.
Salem, O. Solomon J, Geneidy A, and Minkarah I. (2006) Lean Construction: From Theory to
Implementation. Journal of Management in Engineering ASCE, 2006.
Schonberger, R.J. Knod M.E, (1997) Operations Management: Customer Focused Principles 6th
Edition
Schroeder, G. R (1981) Operations Management: Decision Making in Operations
48
Skinner, W. (1985) Manufacturing: The Formidable Competitive Weapon, New York: John
Wiley.
Slack, N. Chambers S, Johnson R. (2004) Operations Management: 4th Edition Harlow: Pearson
Education
Slack, N. Lewis, M. (2002), Operations Strategy, Harlow: Pearson Education.
Steenkamp, R.J (2010) A review of the modern Operations Management: Curricular for a new
programme qualification mix (PQM)
Stevenson, J. W, Introduction to Production and Operations Management McGraw-Hill./Irwin
Syagga, P. (1999). Real Estate Management Handbook. University of Nairobi Press
Thompson, J.R, Strickland A.J, Gamble E.J (2007) Crafting & Executing Strategy McGrawhill
Irwin
Wahome, M.W. (2010). A Survey of Factor Influencing Mortgage Financing in Kenya.
Unpublished Research Project. University of Nairobi
Waters, D. (2006) Operations Strategy
Wheelen, L.T, Hunger J.D, (2008) Strategic Management and Business Policy 11th Edition
Pearson Prentice Hall
William, J. Stevenson, Irwin (2002) Production/Operations Management
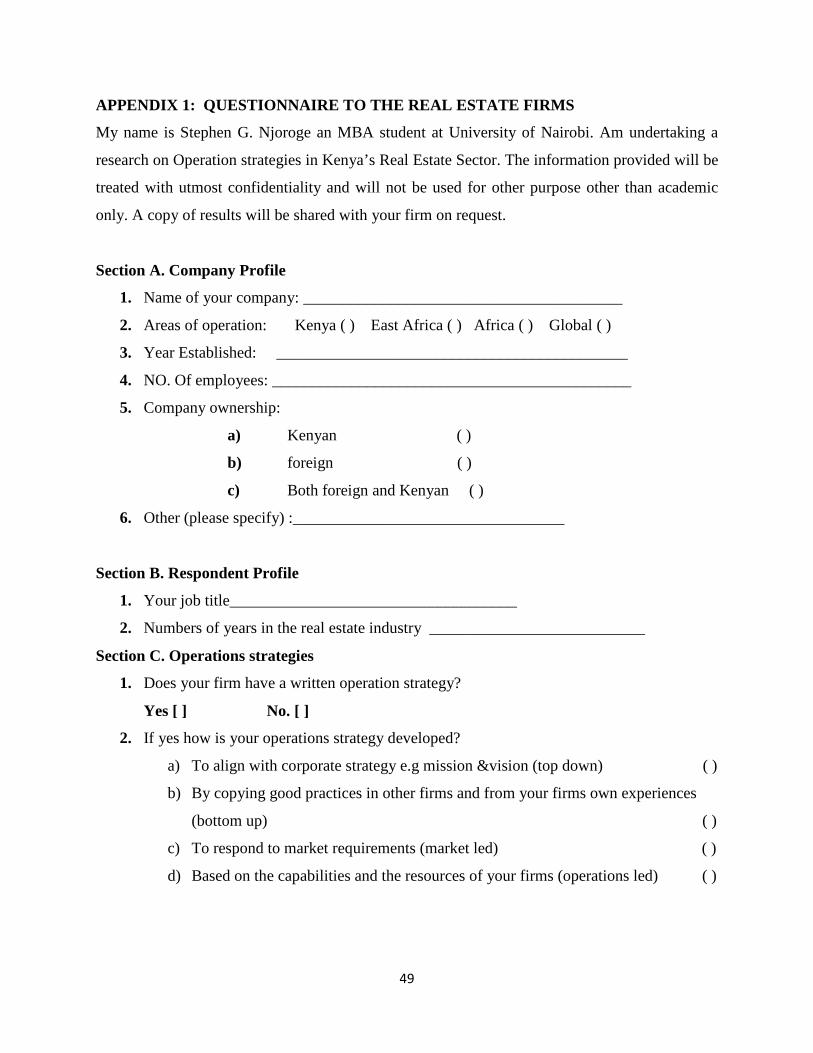
49
APPENDIX 1: QUESTIONNAIRE TO THE REAL ESTATE FIRMS
My name is Stephen G. Njoroge an MBA student at University of Nairobi. Am undertaking a
research on Operation strategies in Kenya’s Real Estate Sector. The information provided will be
treated with utmost confidentiality and will not be used for other purpose other than academic
only. A copy of results will be shared with your firm on request.
Section A. Company Profile
1. Name of your company: ________________________________________
2. Areas of operation: Kenya ( ) East Africa ( ) Africa ( ) Global ( )
3. Year Established: ____________________________________________
4. NO. Of employees: _____________________________________________
5. Company ownership:
a) Kenyan ( )
b) foreign ( )
c) Both foreign and Kenyan ( )
6. Other (please specify) :__________________________________
Section B. Respondent Profile
1. Your job title____________________________________
2. Numbers of years in the real estate industry ___________________________
Section C. Operations strategies
1. Does your firm have a written operation strategy?
Yes [ ] No. [ ]
2. If yes how is your operations strategy developed?
a) To align with corporate strategy e.g mission &vision (top down) ( )
b) By copying good practices in other firms and from your firms own experiences
(bottom up) ( )
c) To respond to market requirements (market led) ( )
d) Based on the capabilities and the resources of your firms (operations led) ( )
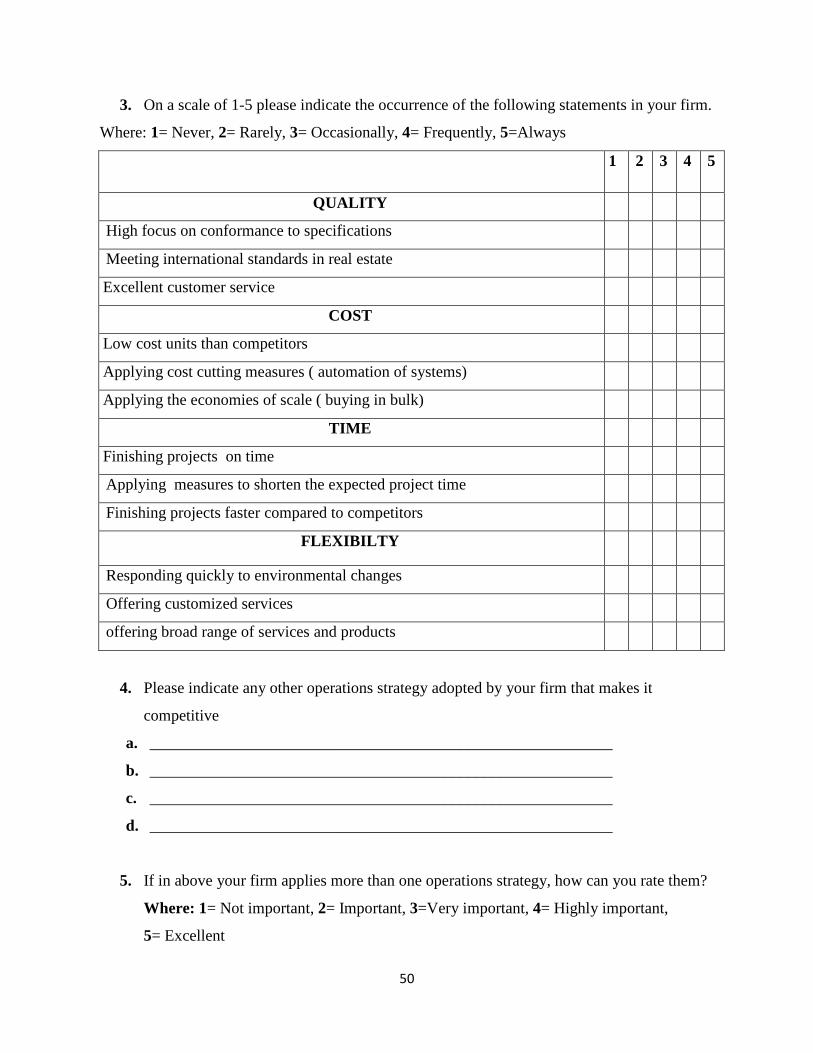
50
3. On a scale of 1-5 please indicate the occurrence of the following statements in your firm.
Where: 1= Never, 2= Rarely, 3= Occasionally, 4= Frequently, 5=Always
1 2 3 4 5
QUALITY
High focus on conformance to specifications
Meeting international standards in real estate
Excellent customer service
COST
Low cost units than competitors
Applying cost cutting measures ( automation of systems)
Applying the economies of scale ( buying in bulk)
TIME
Finishing projects on time
Applying measures to shorten the expected project time
Finishing projects faster compared to competitors
FLEXIBILTY
Responding quickly to environmental changes
Offering customized services
offering broad range of services and products
4. Please indicate any other operations strategy adopted by your firm that makes it
competitive
a. __________________________________________________________
b. __________________________________________________________
c. __________________________________________________________
d. __________________________________________________________
5. If in above your firm applies more than one operations strategy, how can you rate them?
Where: 1= Not important, 2= Important, 3=Very important, 4= Highly important,
5= Excellent
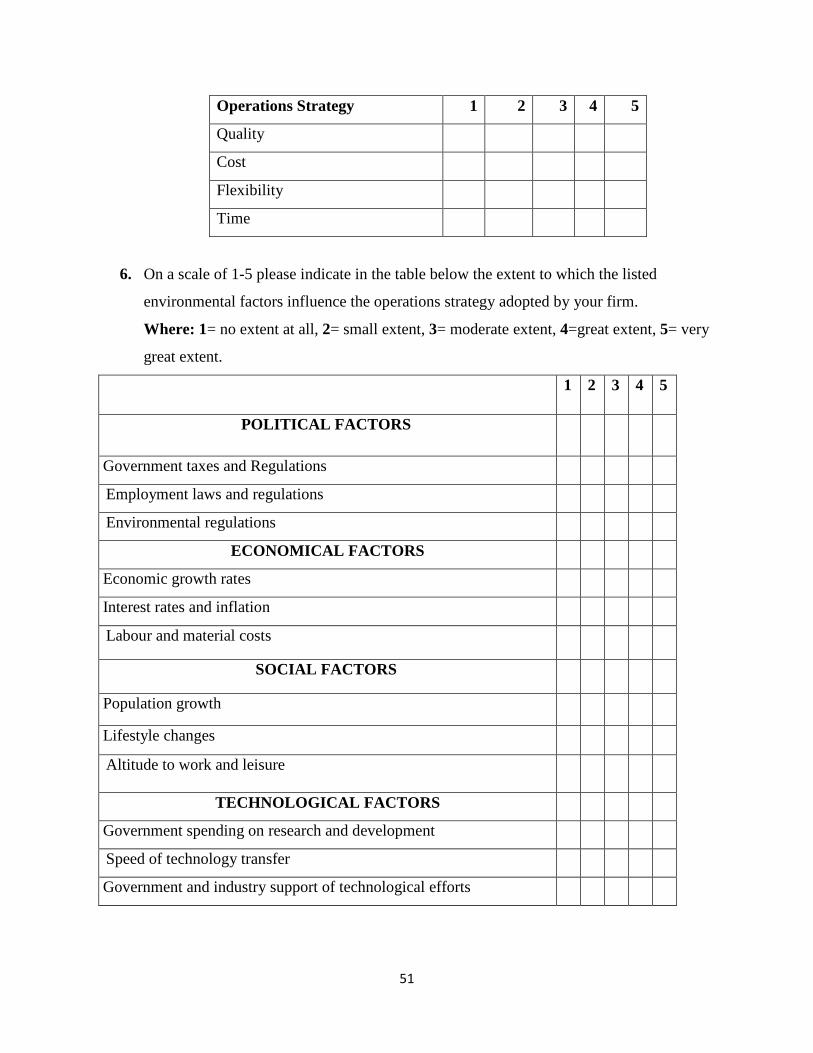
51
Operations Strategy 1 2 3 4 5
Quality
Cost
Flexibility
Time
6. On a scale of 1-5 please indicate in the table below the extent to which the listed
environmental factors influence the operations strategy adopted by your firm.
Where: 1= no extent at all, 2= small extent, 3= moderate extent, 4=great extent, 5= very
great extent.
1 2 3 4 5
POLITICAL FACTORS
Government taxes and Regulations
Employment laws and regulations
Environmental regulations
ECONOMICAL FACTORS
Economic growth rates
Interest rates and inflation
Labour and material costs
SOCIAL FACTORS
Population growth
Lifestyle changes
Altitude to work and leisure
TECHNOLOGICAL FACTORS
Government spending on research and development
Speed of technology transfer
Government and industry support of technological efforts
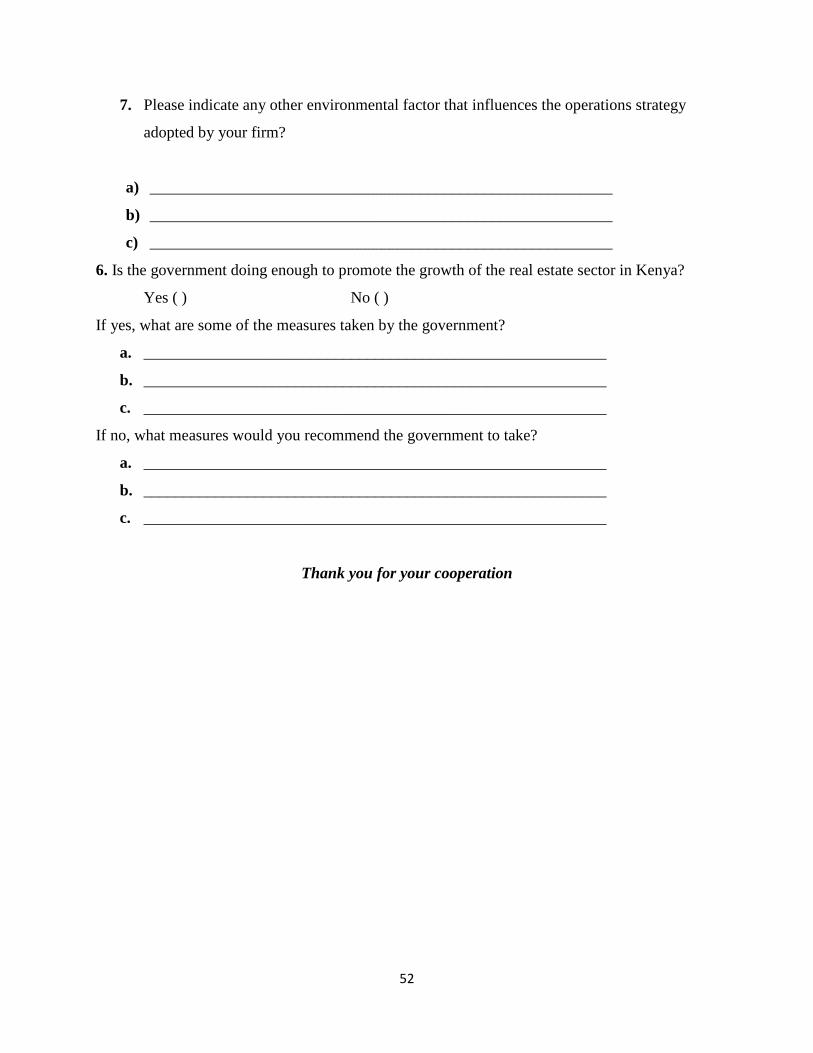
52
7. Please indicate any other environmental factor that influences the operations strategy
adopted by your firm?
a) __________________________________________________________
b) __________________________________________________________
c) __________________________________________________________
6. Is the government doing enough to promote the growth of the real estate sector in Kenya?
Yes ( ) No ( )
If yes, what are some of the measures taken by the government?
a. __________________________________________________________
b. __________________________________________________________
c. __________________________________________________________
If no, what measures would you recommend the government to take?
a. __________________________________________________________
b. __________________________________________________________
c. __________________________________________________________
Thank you for your cooperation