a report on the 2nd experiment, filtration group 6 · to determine the specific cake resistance and...
TRANSCRIPT

1
BT4110 - Downstream Processing Laboratory
A report on the 2nd experiment, Filtration
Group 6
Group 6
Name Roll Number Percentage Contribution Signature
Aman Kumar BT10B003
Amit Kumar BT10B004
Eddy Hudson BT10B013
Gopikrishna R BT10B016
Karunya P. BT10B021
Monica P. BT10B033
2
Table of Contents INTRODUCTION ............................................................................................................................................. 3
CONVENTIONAL FILTRATION ................................................................................................................ 3
AIM & OBJECTIVE..................................................................................................................................... 3
THEORY......................................................................................................................................................... 3
CROSS FLOW FILTRATION: ULTRA FILTRATION ......................................................................... 4
AIM & OBJECTIVE..................................................................................................................................... 4
THEORY......................................................................................................................................................... 4
SESSION I ........................................................................................................................................................... 5
Methodology ............................................................................................................................................... 5
Results and Discussions: ....................................................................................................................... 5
Conventional Filtration: ................................................................................................................... 5
Cross-flow Filtration:......................................................................................................................... 7
SESSION II ...................................................................................................................................................... 10
PART 1: ....................................................................................................................................................... 10
Aim: ......................................................................................................................................................... 10
Approach: ............................................................................................................................................. 10
Procedure ............................................................................................................................................. 11
Results & Discussion ....................................................................................................................... 11
PART 2: ....................................................................................................................................................... 13
Aim: ......................................................................................................................................................... 13
Procedure ............................................................................................................................................. 13
Approach: ............................................................................................................................................. 13
Results and Discussions: ............................................................................................................... 14
REFERENCES: ............................................................................................................................................... 18
APPENDIX ...................................................................................................................................................... 18
3
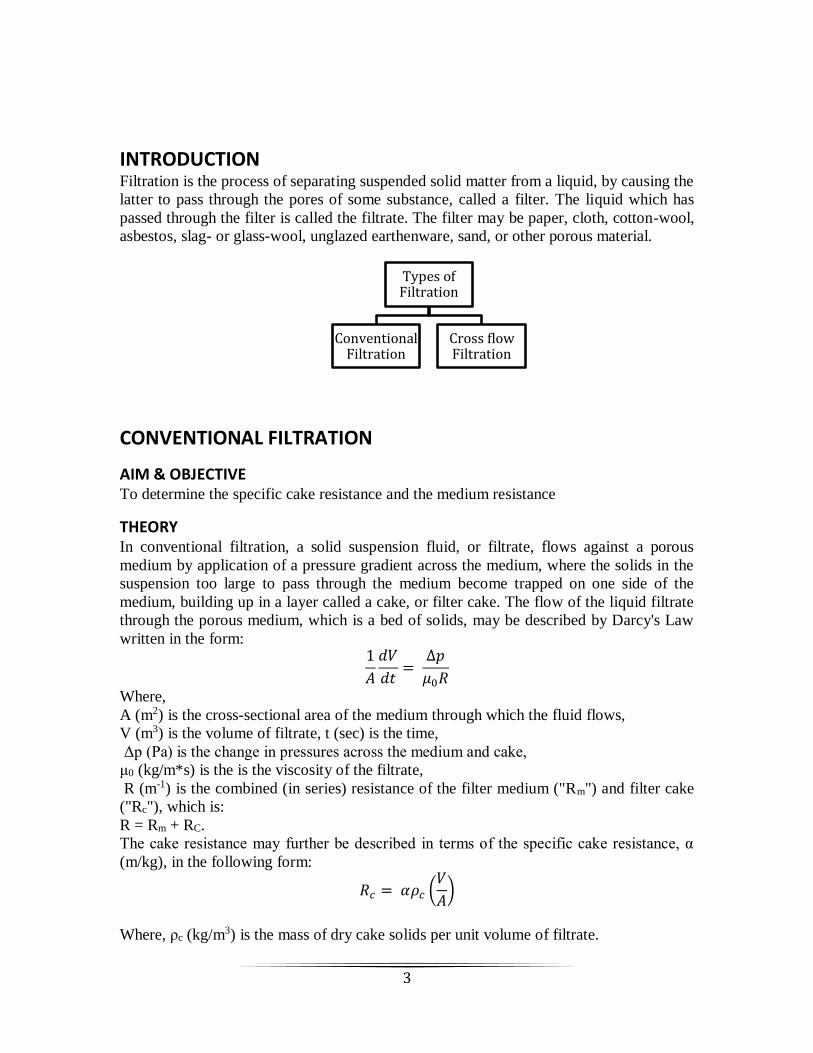
INTRODUCTION Filtration is the process of separating suspended solid matter from a liquid, by causing the
latter to pass through the pores of some substance, called a filter. The liquid which has
passed through the filter is called the filtrate. The filter may be paper, cloth, cotton-wool,
asbestos, slag- or glass-wool, unglazed earthenware, sand, or other porous material.
CONVENTIONAL FILTRATION
AIM & OBJECTIVE To determine the specific cake resistance and the medium resistance
THEORY In conventional filtration, a solid suspension fluid, or filtrate, flows against a porous
medium by application of a pressure gradient across the medium, where the solids in the
suspension too large to pass through the medium become trapped on one side of the
medium, building up in a layer called a cake, or filter cake. The flow of the liquid filtrate
through the porous medium, which is a bed of solids, may be described by Darcy's Law
written in the form: 1
𝐴
𝑑𝑉
𝑑𝑡=
∆𝑝
𝜇0𝑅
Where,
A (m2) is the cross-sectional area of the medium through which the fluid flows,
V (m3) is the volume of filtrate, t (sec) is the time,
Δp (Pa) is the change in pressures across the medium and cake,
μ0 (kg/m*s) is the is the viscosity of the filtrate,
R (m-1) is the combined (in series) resistance of the filter medium ("Rm") and filter cake
("Rc"), which is:
R = Rm + RC.
The cake resistance may further be described in terms of the specific cake resistance, α
(m/kg), in the following form:
𝑅𝑐 = 𝛼𝜌𝑐 (𝑉
𝐴)
Where, ρc (kg/m3) is the mass of dry cake solids per unit volume of filtrate.
Types of Filtration
Conventional Filtration
Cross flow Filtration

4
Darcy's Law for the flow of the liquid filtrate through the bed of solids porous filter medium
and cake may therefore be rewritten as: 1
𝐴
𝑑𝑉
𝑑𝑡=
∆𝑝
𝜇0(𝛼𝜌𝑐 (𝑉𝐴) + 𝑅𝑚)
For constant pressure operation, this equation may be integrated with an initial condition
of zero filtrate at time zero to yield: 𝑡
𝑉𝐴
= 𝜇0𝛼𝜌𝑐
2∆𝑝(
𝑉
𝐴) +
𝜇0𝑅𝑚
∆𝑝
Figure A1: The process of conventional flow.
CROSS FLOW FILTRATION: ULTRA FILTRATION
AIM & OBJECTIVE To determine the resistances due to the membrane (medium) and due to the cake.
THEORY In cross flow filtration, an incoming feed stream passes across the surface of a cross flow
membrane, and two exiting streams are generated. The permeate stream is the portion of
the fluid that passes through the membrane. This filtered fluid will contain some percentage
of soluble and/or insoluble components from the initial feed stream that are smaller than
the membrane removal rating. The remainder of the feed stream, which does not pass
through the cross flow membrane, is known as the retentate stream.
1 http://en.citizendium.org/wiki/Filtration
Types of Cross Flow Filtration
Micro Filtration
Ultra Filtration

5
The principle of micro filtration and ultra-filtration is physical separation. The extent to
which dissolved solids, turbidity and microorganisms are removed is determined by the
size of the pores in the membranes. Substances that are larger than the pores in the
membranes are fully removed. Substances that are smaller than the pores of the membranes
are partially removed, depending on the construction of a refuse layer on the membrane.
Micro filtration and ultra-filtration are pressure-dependent processes, which remove
dissolved solids and other substances from water to a lesser extent than nano filtration and
reverse osmosis. Membranes with a pore size of 0.1 – 10 µm perform micro filtration. The
pores of ultra-filtration membranes can remove particles of 0.001–0.1µm from fluids.
Figure B2: The process of cross flow filtration
SESSION I
Methodology The protocol was followed as given in Lab Manual (G.K Suraish Kumar et al.)
Results and Discussions:
Conventional Filtration: We have used the parameters as:
1 𝑝𝑠𝑖 = 6894.75 Pa
𝜇 = 8.90 × 10⁻⁴ Pa.s
Diameter of filter paper = 11.6cm
Weight of the dry membrane was found to be 0.62g. The cake was very well formed as
observed in Figure 1.2.
2 http://www.pall.com/main/graphic-arts/how-crossflow-filtration-works.page

6
Figure 1.2: Membrane with formed cake layer
The weight of membrane along with cake after drying in oven was found to be 2.82g.
Hence, the weight of the cake was obtained as (2.82-0.62) g = 2.2g.
The graph between At/V vs. V/A was plotted to calculate the value of specific cake
resistance and filter resistance. The data was obtained as shown in Table 1.1 (refer
appendix). Figure 1.1 is the required graph with R-square value of 0.9997. The slope and
intercept of the curve is found to be 34.8819 s/m2and 0.1801 s/m respectively.
Figure 1.1: Graph between At/V vs. V/A.

7
Using the above graph and above described parameters, the value of Rm and Rc was
calculated using the formula explained earlier (refer theory of conventional filtration).
Rm =22.32 µm-1
Rc = 686.84 µm-1
The value of Rc was found to be much higher than Rm which was in accordance with the
results obtained.
Cross-flow Filtration: The absorbance values for the standard curve were taken in triplicate as shown in Table
1.2 (refer appendix) and the standard curve was plotted. The standard curve (Figure 1.3)
was found to have an R2 value of 0.9984 and slope as 0.5688 l/g.
Figure 1.3: Standard Curve using known BSA concentration
Table 1.1 (a) & Table 1.1 (b) along with the data supplied in appendix (Table 1.3 & Table
1.4) were used to calculate the values of average flow rate with change in pressure. These
data were used to plot curves (Figure 1.4 & Figure 1.5) for getting filter medium resistance
and cake resistance.

8
Change
in
pressure
(psi)
Volume
(ml)
Flow
Rate
1
Flow Rate 2
Average
Flow
rate
(ml/sec)
Standard Deviation Standard Error
10 5 0.041 0.034 0.037 0.0050 0.0035
20 5 0.074 0.065 0.069 0.0061 0.0043
30 5 0.109 0.102 0.105 0.0047 0.0033
Table 1.1 (a): Data used to calculate value of Rm.
Figure 1.4: Curve used to calculate filter membrane resistance
Change
in
pressure
Volume
(ml/sec)
Flow
Rate 1
Flow
Rate
2
Flow
Rate 3
Flow
Rate 4
Average
Flow
rate
(ml/sec)
Standard
Deviation
Standard
Error
10 5 0.0521 0.044 0.0495 0.0424 0.047 0.0046 0.0023
20 5 0.0893 0.083 0.0893 0.0806 0.085 0.0044 0.0022
30 5 0.1389 0.119 0.1282 0.125 0.127 0.0083 0.0042
Table 1.1 (b): Data used to calculate value of Rm + Rc.
y = 0.0043xR² = 0.9969
0
0.02
0.04
0.06
0.08
0.1
0.12
0 5 10 15 20 25 30 35
Flo
w r
ate
(m
l/se
c)
Change in pressure (psi)
Resistance due to membrane
9
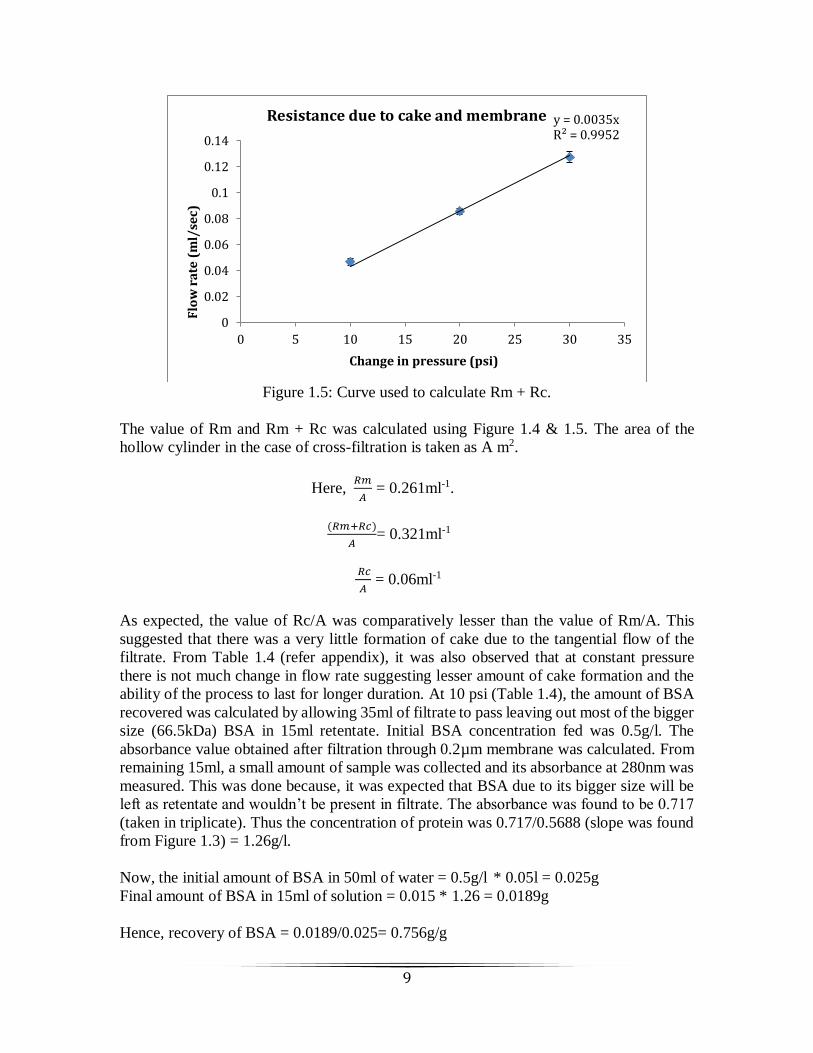
Figure 1.5: Curve used to calculate Rm + Rc.
The value of Rm and Rm + Rc was calculated using Figure 1.4 & 1.5. The area of the
hollow cylinder in the case of cross-filtration is taken as A m2.
Here, 𝑅𝑚
𝐴 = 0.261ml-1.
(𝑅𝑚+𝑅𝑐)
𝐴= 0.321ml-1
𝑅𝑐
𝐴 = 0.06ml-1
As expected, the value of Rc/A was comparatively lesser than the value of Rm/A. This
suggested that there was a very little formation of cake due to the tangential flow of the
filtrate. From Table 1.4 (refer appendix), it was also observed that at constant pressure
there is not much change in flow rate suggesting lesser amount of cake formation and the
ability of the process to last for longer duration. At 10 psi (Table 1.4), the amount of BSA
recovered was calculated by allowing 35ml of filtrate to pass leaving out most of the bigger
size (66.5kDa) BSA in 15ml retentate. Initial BSA concentration fed was 0.5g/l. The
absorbance value obtained after filtration through 0.2µm membrane was calculated. From
remaining 15ml, a small amount of sample was collected and its absorbance at 280nm was
measured. This was done because, it was expected that BSA due to its bigger size will be
left as retentate and wouldn’t be present in filtrate. The absorbance was found to be 0.717
(taken in triplicate). Thus the concentration of protein was 0.717/0.5688 (slope was found
from Figure 1.3) = 1.26g/l.
Now, the initial amount of BSA in 50ml of water = 0.5g/l * 0.05l = 0.025g
Final amount of BSA in 15ml of solution = 0.015 * 1.26 = 0.0189g
Hence, recovery of BSA = 0.0189/0.025= 0.756g/g
y = 0.0035xR² = 0.9952
0
0.02
0.04
0.06
0.08
0.1
0.12
0.14
0 5 10 15 20 25 30 35
Flo
w r
ate
(m
l/se
c)
Change in pressure (psi)
Resistance due to cake and membrane

10
Percentage recovery of BSA in the retentate was found to be 75.6%.
Due to bigger size of BSA, most of it stayed in the retentate stream while some of them
contributed in formation of the cake.
Thus, we were able to calculate the values of filter membrane resistance as well as cake
resistance using both conventional and cross-flow filtration.
Conventional filtration, on one hand, is best when filtering micro-organisms, other
contaminants like organic matter etc. Most of the contaminants are negatively charged,
hence adding a coagulating agent (positively charged) can further enhance efficiency of
the process. On other hand, apart from filtering contaminants, cross-flow filtration can be
best employed while separating proteins of different sizes. Multiple size proteins can be
separated depending on the size of filter used in multiple steps. Thus, cross-flow filtration,
in particular finds a wide application in downstream processing of proteins.
While both of the methods find wide applications in various fields, but for most of the large
scale purposes, we tend to use cross-flow or tangential filtration. This is because it offers
an additional advantage of being more of a continuous process, unlike conventional
filtration. In case of conventional filtration, there is continuous accumulation of filter cake
because of which, its efficiency to run for longer time decreases, and makes it tedious and
less profitable process on large scale. In case of cross-filtration the filter cake is
substantially washed away during the process of filtration which leads to its longevity in
operation.
Keeping the above disadvantage offered by conventional process in mind, we have tried to
make it more of an efficient process in our next session. Along with that we have also
provided a practical use of conventional filtration in day-to-day life.
SESSION II
We have divided this session in two parts where we have tried to work on two important
modules of conventional filtration i.e. efficiency and application.
PART 1:
Aim: An approach to make conventional filtration more efficient process.
Approach:
We wished to recalculate the amount of resistance (Rm) offered by the filter paper we used
during the first session, using a simpler procedure. During session 1, we used the design
11
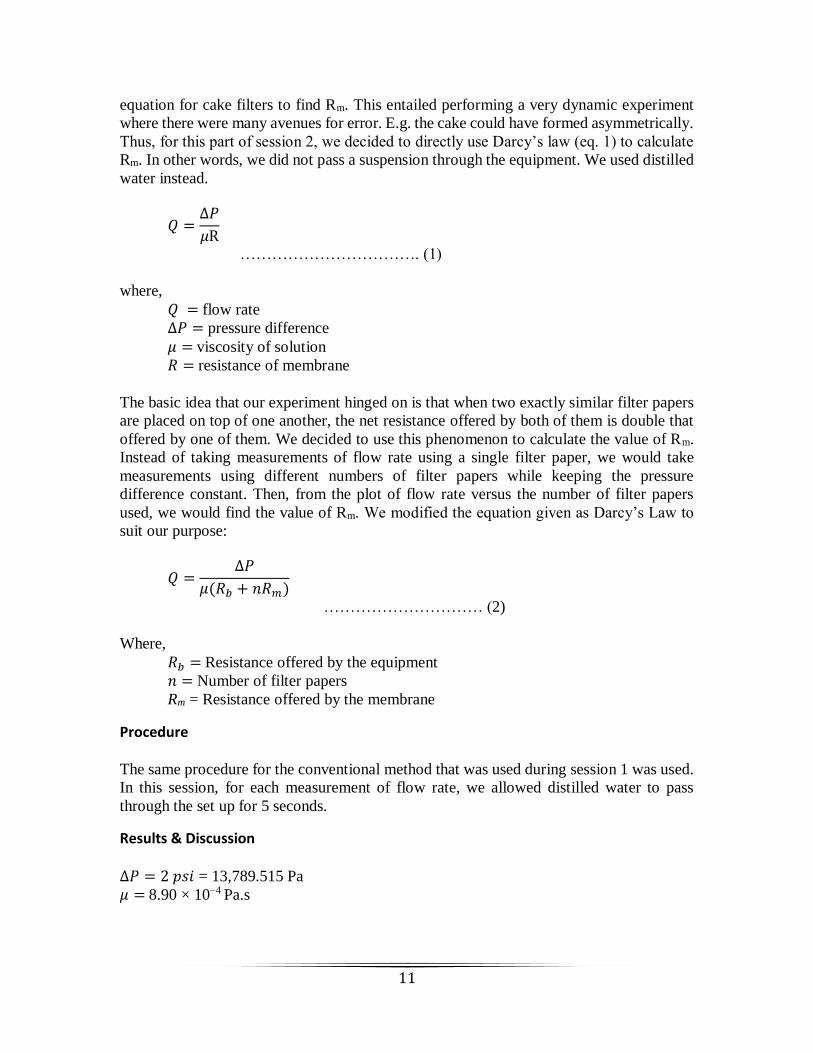
equation for cake filters to find Rm. This entailed performing a very dynamic experiment
where there were many avenues for error. E.g. the cake could have formed asymmetrically.
Thus, for this part of session 2, we decided to directly use Darcy’s law (eq. 1) to calculate
Rm. In other words, we did not pass a suspension through the equipment. We used distilled
water instead.
𝑄 =∆𝑃
𝜇R
……………………………. (1)
where,
𝑄 = flow rate
∆𝑃 = pressure difference
𝜇 = viscosity of solution
𝑅 = resistance of membrane
The basic idea that our experiment hinged on is that when two exactly similar filter papers
are placed on top of one another, the net resistance offered by both of them is double that
offered by one of them. We decided to use this phenomenon to calculate the value of Rm.
Instead of taking measurements of flow rate using a single filter paper, we would take
measurements using different numbers of filter papers while keeping the pressure
difference constant. Then, from the plot of flow rate versus the number of filter papers
used, we would find the value of Rm. We modified the equation given as Darcy’s Law to
suit our purpose:
𝑄 =∆𝑃
𝜇(𝑅𝑏 + 𝑛𝑅𝑚)
………………………… (2)
Where,
𝑅𝑏 = Resistance offered by the equipment
𝑛 = Number of filter papers
Rm = Resistance offered by the membrane
Procedure The same procedure for the conventional method that was used during session 1 was used.
In this session, for each measurement of flow rate, we allowed distilled water to pass
through the set up for 5 seconds.
Results & Discussion ∆𝑃 = 2 𝑝𝑠𝑖 = 13,789.515 Pa
𝜇 = 8.90 × 10⁻⁴ Pa.s

12
N Volume1
(mL)
Volume2
(mL)
Volume3
(mL)
Average
Vol. (mL)
Q (mL/s)
0 226 265 250 247 49.4
1 70 98 55 74.33 14.86
2 13.5 15 13 13.83 2.766
3 13 18 22.5 17.83 3.566
4 5 7 6.5 6.166 1.233
Table 2: Data showing change in flow rate with number of filter papers
Using MATLAB, the above data points were fit to eq. 2.
Figure 2.1: Curve b/n flow rate vs. number of filter papers
R-square value of the fit: 0.9834
Rb = 313 (mL)-1, Rm = 1053.7 (mL)-1 was calculated using MATLAB.
Hence, we were able to successfully calculate the values of Rb and Rm (Figure 2.1).
The major thing we achieved by following our modified procedure is calculate the amount
of resistance offered by a single filter paper. In the previous experiments we calculated the
resistance of the filter paper combined with that offered by the equipment.
Our approach of exclusively finding the correct filter resistance finds application in
designing membrane area for particular application based on temperature, membrane
material, or other site- or system-specific factors (Steve Allgeier et al.). In the above
applications, cake resistance is not taken into consideration while designing, hence it is
totally dependent on the value of constant filter resistance provided by the manufacturer.

13
Thus, our process can be employed by membrane manufacturer to calculate the exact value
of membrane filter resistance.
PART 2:
Aim: To test the purity of water from various sources inside Institute (IIT Madras) using
conventional filtration.
Procedure The same procedure for the conventional method that was used during session 1 was used.
Approach: Water was collected from different part of institute to test the amount of contaminants
present and provide a comparative study at various levels.
Our experiment tested the amount of contaminants present at four different levels:
1. Tap water of hostels: It is mainly used for brushing teeth, bathing and other
purposes.
2. Residential zone water: It is mainly used for dish washing, cloth washing, brushing
teeth and other house hold purposes.
Figure 2.2: Water used for dish washing
3. Pump house water: It is used as drinking water by the people residing in residential
zone.
4. Lake water: It was primarily taken to compare the amount of cake formed with that
of water taken from other sources. Also, the presence of high amount of
contaminants can be dangerous for the people residing nearby because of being
prone to various water-borne diseases. Lake water was aseptically collected in
bottle (Figure 2.3) for further use.

14
Figure 2.3: Place near Institute Stadium where Lake Water was collected
Results and Discussions:
After collecting water from different places, we compared the amount of cake formed. We
found that the amount of cake formed differed with different water.
Figure 2.4: Cake obtained with Hostel tap water
15
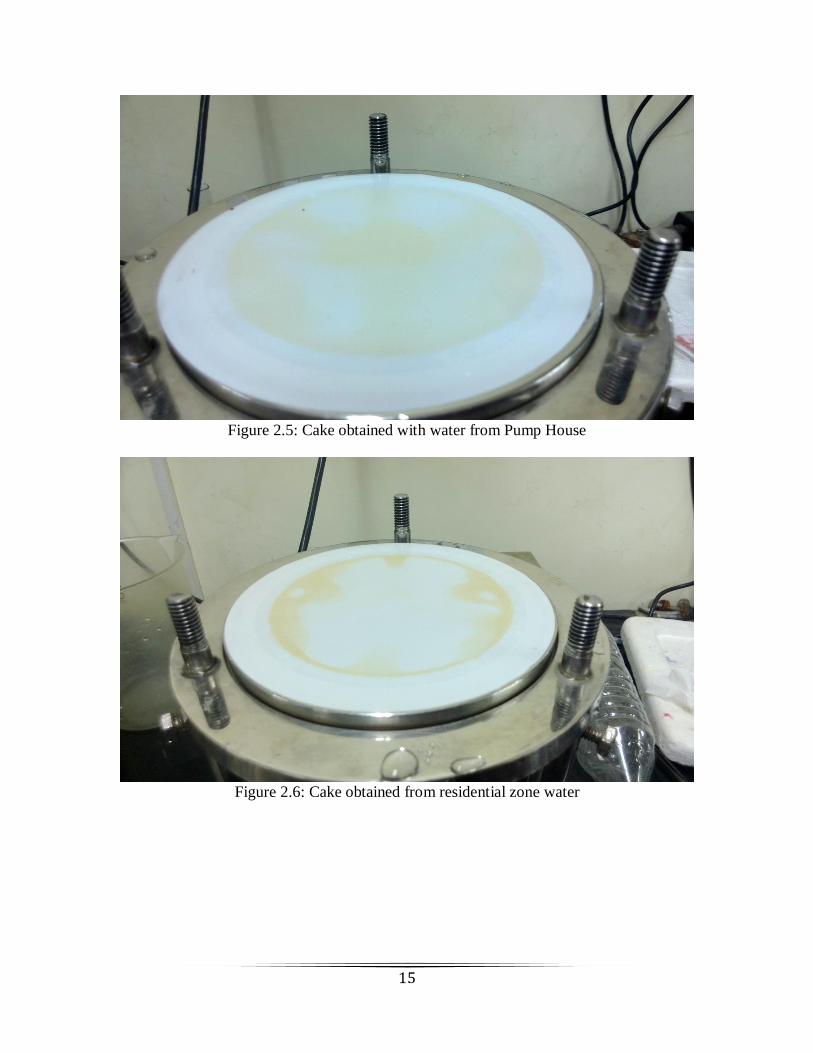
Figure 2.5: Cake obtained with water from Pump House
Figure 2.6: Cake obtained from residential zone water

16
Figure 2.7: Cake obtained from lake water
We observed that the cake formed by lake water (Figure 2.7) had thickest layer. The cake
obtained by pump water (Figure 2.5) was less thicker as compared with the cake obtained
by residential zone water (Figure 2.6) and hostel tap water (Figure 2.4) respectively. The
hostel tap water and residential zone water showed almost identical pattern and similar
intense cake was formed. While that of residential zone and pump house water showed a
good all round distribution of cake, lake water and hostel tap water showed a round patches
in the middle along with the distribution all around. This can be because of improper
placing of the filter membrane. In future, care must be taken while placing and properly
wiping of the membrane should be done for avoiding any unwanted bubble.
Despite the improper distribution of cake, it doesn’t affected our experiments in this case
and we were able to perform the comparative study for the four cases.
Along with this, the dry weights of the membrane along with the cake was compared.
The following observations were made:
Weight of the membrane along with cake for hostel tap water (Figure 2.4) = 0.62g
Weight of the membrane along with cake for pump house water (Figure 2.5) = 0.6g
Weight of the membrane along with cake for residential zone (Figure 2.6) = 0.622g
Weight of the membrane along with cake for lake water (Figure 2.7) = 0.644g
This was similar to what we observed from figure 2.4-2.7. It also suggested that the water
which is used in hostel zone and residential zone had almost equal amount of
contamination. As expected, lake water had maximum amount of cake formation while that
of drinking water had the least. This indicated that pump house is least contaminated and
indeed good for drinking.

17
Taking a closer look, we realized that the amount of cake formed for drinking water can
still be dangerous for health. Apart from that, water used for dish cleaning and ultimately
usage of dishes while eating is indirectly affecting us. Thus, further treatment of water need
to be done before supplying to residential zone or hostel zone.
On literature survey (Ahsan Munir et al., Steve Allgeier et al.), we found one of the
approach which can be employed to further treat the water is based on conventional
filtration. A combination of coagulation, sedimentation, filtration and disinfection can be
used as depicted in Figure 2.8.
Figure 2.8: Flow chart explaining water treatment
Most of the contaminants are negatively charged, thus generally a positively charged
coagulating agent is added which interacts with the contaminants present in the water. Due
to its weight, the contaminant along with the coagulating agent settles down and finally it
can be filtered to remove the sediment particles (Figure 2.8). The particles based on their
sizes can be removed through various filtration methods with different filter pore size. One
of the filtration method is slow sand filtration which removes contaminants as small as
bacteria, protozoa and viruses. The water can be further disinfected as a precautionary
measure and to finally get safe drinking water.
Thus, a comparative study was successfully performed for water from different sources.
Our results demand a quick attention in this regard.
Altogether, we were able to improve the conventional flow technique as well as provide a
practical application for the benefit of Institute and its residents.

18
REFERENCES:
1. Iritani, Eiji. "Properties of filter cake in cake filtration and membrane filtration." Kona
21 (2003): 19-39.
2. Ahsan Munir. “Dead End Membrane Filtration” Laboratory Feasibility Studies in
Environmental Engineering
3. Steve Allgeier. “Membrane filtration guidance manual” United States
Environmental Protection Agency (USEPA).
4. B. Balaji, Aparna B. Ganesh, Abdul Majeed, S.Kalpana, Sawan Kumar,Aslam
Basha Z and G. K. Suraishkumar. BT4110 Downstream Processing Laboratory
Guidance Manual.
5. http://www.lenntech.com/chemistry/filtration.htm#ixzz2jwR0QP3Y
6. http://en.citizendium.org/wiki/Filtration
7. http://www.lenntech.com/microfiltration-and-ultrafiltration.htm#ixzz2jwexOwyO
8. http://www.pall.com/main/graphic-arts/how-crossflow-filtration-works.page
APPENDIX
Time
(min)
Volume
(ml)
1 204
2 97
3 72
4 61
5 54
6 53
7 46
8 41
9 39
10 37
11 36
12 33
13 31
14 30
Table 1.1: Data obtained using conventional filtration

19
Conc (g/l) Absorption @ 280nm
OD1 OD2 OD3 Average
0.2 0.117 0.12 0.118 0.118
0.4 0.215 0.214 0.214 0.214
0.6 0.34 0.346 0.342 0.343
0.8 0.456 0.459 0.46 0.458
1 0.573 0.567 0.569 0.570
Table 1.2: Standard Curve Data
Change(p) Time (in sec) Volume
(ml)
Flow rate
(ml/sec) Reading 1 Reading 2 Average
10 121 146 133.5 5 0.0374
20 68 77 72.5 5 0.0689
30 46 49 47.5 5 0.1052
Table 1.3: Data obtained for calculating filter resistance
Volume
(ml)
Time (sec) Flow
Rate
(ml/sec) Reading 1 Reading 2 Average
5 138 125 131.5 0.0380
10 263 252 257.5 0.0388
15 388 375 381.5 0.0393
20 518 500 509 0.0392
25 628 611 619.5 0.0403
30 752 745 748.5 0.0400
35 878 875 876.5 0.0399
Table 1.4: Flow rate data obtained at 10psi
Change
(p)
Time (sec) Volume
(ml/sec)
Flow rate
(ml/sec) Reading
1
Reading
2
Reading
3
Reading
4
Averag
e
10 96 114 101 118 107.25 5 0.0466
20 56 60 56 62 58.5 5 0.0854
30 36 42 39 40 39.25 5 0.1273
Table 1.5: Data obtained to calculate cake resistance