a report on ribasim-submitted final
TRANSCRIPT
7/21/2019 A Report on RIBASIM-Submitted Final
http://slidepdf.com/reader/full/a-report-on-ribasim-submitted-final 1/72
A Report on
Nile Integrated River Basin Master Plan
Using RIBASIM
Submitted to:
Laura Basco Carrera
Submitted By:
Sudish Lal Maskey (43584 / 227)
Karim Morsy (45880 / 277)

7/21/2019 A Report on RIBASIM-Submitted Final
http://slidepdf.com/reader/full/a-report-on-ribasim-submitted-final 2/72

7/21/2019 A Report on RIBASIM-Submitted Final
http://slidepdf.com/reader/full/a-report-on-ribasim-submitted-final 3/72
A Report on Nile Integrated River Basin Master Plan Using RIBASIM HERBD/43584/227/45880/277
3
10. Design and analysis of alternative strategies ............................................................................................... 47
10.1 Strategy 1 ....................................................................................................................................................... 48
10.1.1 Public Water Supply .................................................................................................................................... 48
10.1.2 Irrigation Water Supply ............................................................................................................................... 49
10.1.3 Energy .............................................................. ................................................................. ........................... 50
10.2 Strategy 2 ....................................................................................................................................................... 51
10.2.1Public Water Supply ..................................................................................................................................... 51
10.2.2 Irrigation Water Supply ............................................................................................................................... 52
10.2.3 Energy .............................................................. ................................................................. ........................... 53
10.3.1 Public Water Supply .................................................................................................................................... 53
10.3.2 Irrigation Water Supply ............................................................................................................................... 54
10.3.3 Energy .............................................................. ................................................................. ........................... 55
10.4 Scorecard for better decision making ............................................................ ................................................. 55
11. Conclusion and Recommendation ............................................................................................................... 63
11.1 Conclusion ...................................................................................................................................................... 63
11.2 Recommendations ......................................................... .............................................................. ................... 63
12. References .................................................................................................................................................. 64
13. Appendices .................................................................................................................................................. 65

7/21/2019 A Report on RIBASIM-Submitted Final
http://slidepdf.com/reader/full/a-report-on-ribasim-submitted-final 4/72
A Report on Nile Integrated River Basin Master Plan Using RIBASIM HERBD/43584/227/45880/277
4
List of Figures
Figure 1 Overview of the Nile Basin ..............................................................................................................9
Figure 2 Nile River Basin ...............................................................................................................................9
Figure 3 Integrated Water Resource Management Framework ................................................................ 11
Figure 4 Stake Holder Analysis ................................................................................................................... 11
Figure 5 Problem Identification ................................................................................................................. 15
Figure 6 Schematization of the Nile Basin showing Atbara River Confluence ........................................... 17
Figure 7 Merowe Dam ............................................................................................................................... 17
Figure 8 Data for calibration ...................................................................................................................... 19
Figure 9 Results of Calibration ................................................................................................................... 20
Figure 10 Shortage in Public Water Supply ................................................................................................ 30
Figure 11 Graph obtained from Ribasim .................................................................................................... 30
Figure 12 Shortage in Irrigation Water Supply .......................................................................................... 31
Figure 13 Ribasim Graph showing Shortage in Irrigation in ...................................................................... 32
Figure 14 Ribasim Graph showing time step shortage in Irrigation Water Supply .................................... 32
Figure 15 Shortage in Energy in base case ................................................................................................. 33
Figure 16 Shortage in Energy ..................................................................................................................... 33
Figure 17 Graph showing shortage in Public Water Supply in Reference Case ......................................... 38
Figure 18 Ribasim Graph showing Shortage in Irrigation Water Supply in Reference Case ...................... 38
Figure 19 Shortage of Water for Irrigation in Reference Case .................................................................. 39
Figure 20 Ribasim Graph showing the Shortage Irrigation Water Supply in Reference Case ................... 40
Figure 21 Ribasim graph showing a time step of shortage in irrigation water supply in Reference Case. 40
Figure 22 Shortage Comparison Chart for Irrigation ................................................................................. 43
Figure 23Comparative Chart for Public water shortage in reference case with strategy 1 ...................... 49
Figure 24Comparative Study of Irrigation Water Supply in Reference case and Strategy1 ...................... 50
Figure 25Comparative Study of Energy Shortage in Reference case and Strategy 1 ................................ 51
Figure 26 Comparative Study of Public Water Supply Shortage in Reference case and Strategy 2 .......... 52
Figure 27 Comparative Study of Irrigation Water Supply Shortage in Reference Case and Strategy 2 .... 53
Figure 28 Comparative Study of Public Water Supply Shortage in Reference case and Strategy 3 .......... 54
Figure 29 Comparative Study of Irrigation Water Supply Shortage in Reference case and Strategy 3 ..... 55
Figure 30 Radial Plot of Strategy with reference case for Ethiopia ........................................................... 59
Figure 31 Radial Plot of Strategy with reference case for Sudan and South Sudan .................................. 59
Figure 32 Radial Plot of Strategy with reference case for Egypt ............................................................... 60
Figure 33 Comparison with the Ideal Case for Sudan ................................................................................ 60

7/21/2019 A Report on RIBASIM-Submitted Final
http://slidepdf.com/reader/full/a-report-on-ribasim-submitted-final 5/72
A Report on Nile Integrated River Basin Master Plan Using RIBASIM HERBD/43584/227/45880/277
5
Figure 34 Comparison with the Ideal Case for Egypt ................................................................................. 61
Figure 35 Comparison with the Ideal Case for Ethiopia............................................................................. 61
Figure 36 Comparison with the Ideal Case for Ethiopia............................................................................. 62

7/21/2019 A Report on RIBASIM-Submitted Final
http://slidepdf.com/reader/full/a-report-on-ribasim-submitted-final 6/72
A Report on Nile Integrated River Basin Master Plan Using RIBASIM HERBD/43584/227/45880/277
6
List of Tables
Table 1 Problem Identification................................................................................................................... 15
Table 2 Data Analysis for Calibration and model input ............................................................................. 19
Table 3 Population in Egypt, Sudan and South Sudan, and Ethiopia 2005 ................................................ 21
Table 4 Water needed by the population in the four riparian countries 2005 ......................................... 21
Table 5 Population and Water Demand for the Riparian Countries 2005 ................................................. 21
Table 6 Livestock details 2005 ................................................................................................................... 21
Table 7 Water needed for livestock 2005 .................................................................................................. 21
Table 8 Population and Water Demand of Livestock 2005 ....................................................................... 22
Table 9 Total Water Demand 2005 ............................................................................................................ 22
Table 10 Energy Table 2005 ....................................................................................................................... 22
Table 11 Potential yield for wheat, vegetables and sugarcane 2005 ........................................................ 22
Table 12 Required Irrigation Area 2005 ..................................................................................................... 23
Table 13 Current Irrigated area for the Nile River Basin 2005 ................................................................... 23
Table 14 Comparision area equiped for irrigation, area currenlty irrigated and required irrigation per
country 2005 .............................................................................................................................................. 23
Table 15 Cropping Pattern per country for the present situation 2005 .................................................... 24
Table 16 Area Currently irrigated for egypt, Ethiopia and Sudan and South Sudan 2005 ........................ 24
Table 17 Crop Evapo-transpiration per irrigation scheme in sudan and Egypt 2005 ................................ 25
Table 18 Crop factors for Wheat,Vegetables and Sugarcane 2005 ........................................................... 25
Table 19 Calendar of the cropping plan for Sudan and Egypt 2005 .......................................................... 25
Table 20Expected rainfall per irrigation scheme in Egypt 2005 ................................................................ 26
Table 21 Net water requirements for Wheat and Vegetables for "Fir_Nile Valley Delta"irrigation Scheme
2005 ........................................................................................................................................................... 27
Table 22Net water requirements for Sugarcane for "Fir_Nile Valley Delta"irrigation Scheme 2005 ....... 28
Table 23 Total Net water Requirement for all types of crop 2005 ............................................................ 29
Table 24 Shortage in Public Water Supply ................................................................................................. 29
Table 25 Irrigation Shortage in Base case .................................................................................................. 31
Table 26 Population in Egypt, Sudan and South Sudan, and Ethiopia 2030 .............................................. 34
Table 27 Water needed by the population in the four riparian countries 2030 ....................................... 34
Table 28 Population and Water Demand for the Riparian Countries 2030 ............................................... 34
Table 29 Livestock details 2030 ................................................................................................................. 34
Table 30 Water needed for livestock 2030 ................................................................................................ 34
Table 31 Population and Water Demand of Livestock 2030...................................................................... 34

7/21/2019 A Report on RIBASIM-Submitted Final
http://slidepdf.com/reader/full/a-report-on-ribasim-submitted-final 7/72
A Report on Nile Integrated River Basin Master Plan Using RIBASIM HERBD/43584/227/45880/277
7
Table 32 Total Water Demand 2030 .......................................................................................................... 35
Table 33 Energy Table 2030 ....................................................................................................................... 35
Table 34 Potential yield for wheat, vegetables and sugarcane 2030 ........................................................ 35
Table 35 Required Irrigation Area 2030 ..................................................................................................... 36
Table 36 Irrigation developments for 2030 ............................................................................................... 36
Table 37 Irrigated areas in base case and reference case 2030 ................................................................ 36
Table 38 Cropping patterns for 2030 ......................................................................................................... 36
Table 39 Irrigation Area Gap ...................................................................................................................... 37
Table 40 Distribution of irrigated area per country for 2030 .................................................................... 37
Table 41 Irrigated area per crop in each country ...................................................................................... 37
Table 42 Shortage in Public Water Supply in Reference Case ................................................................... 38
Table 43 Shortage in Irrigation Water Supply in Reference Case .............................................................. 39
Table 44 Shortage in Energy in Reference Case ......................................................................................... 41
Table 45 Shortage of Energy in Reference Case ........................................................................................ 41
Table 46 Comparative study of Shortage situation Public Water Supply .................................................. 42
Table 47 Comparative Study of Shortage Situation of Public Water Supply ............................................. 42
Table 48 Comparison of Shortage Situation .............................................................................................. 42
Table 49 Assumed population and Public water supply ............................................................................ 47
Table 50 Net Irrigation Demand after change in cropping time ................................................................ 47Table 51 Reservoir operation Rules adopted fir alternative strategies ..................................................... 48
Table 52 Comparison of Shortage in Public Water Supply with reference case and strategy 1 ............... 49
Table 53 Comparative Study of Irrigation Water Shortage in Reference case and Strategy 1 .................. 50
Table 54Comparative Study of Irrigation Energy Shortage in Reference case and Strategy 1 .................. 50
Table 55 Comparative Study of Public Water Supply Shortage in Reference case and Strategy 2 ........... 51
Table 56 Comparative Study of Irrigation Water Supply Shortage in Reference case and Strategy 2 ...... 52
Table 57 Comparative Study of Energy Shortage in Reference Case and Strategy 2 ................................ 53
Table 58 Comparative Study of Public Water Supply Shortage in Reference case and Strategy 3 ........... 54
Table 59 Comparative Study of Irrigation Water Supply Shortage in Reference case and Strategy 3 ...... 55
Table 60 Criteria and Values obtained from calculations and ribasim for all the countries with different
strategies .................................................................................................................................................... 56
Table 61 Coloured Representation of Score card ...................................................................................... 57
Table 62 Score Card showing the preference level of each objectives with strategies ............................ 58
Table 63 Comparison with the Ideal Case for Sudan ................................................................................. 60
Table 64 Comparison with the Ideal Case for Egypt .................................................................................. 61

7/21/2019 A Report on RIBASIM-Submitted Final
http://slidepdf.com/reader/full/a-report-on-ribasim-submitted-final 8/72
A Report on Nile Integrated River Basin Master Plan Using RIBASIM HERBD/43584/227/45880/277
8
Table 65Complete Analysis of all three cases ............................................................................................ 11

7/21/2019 A Report on RIBASIM-Submitted Final
http://slidepdf.com/reader/full/a-report-on-ribasim-submitted-final 9/72
A Report on Nile Integrated River Basin Master Plan Using RIBASIM HERBD/43584/227/45880/277
9
1. Introduction
The Nile River is a major north-flowing river in north
eastern Africa and generally regarded as the longest
river in the world The Nile river basin comprises of 11riparian countries which are Burundi, Rwanda,
Tanzania, Democratic Republic of Congo, Kenya,
Uganda, South Sudan, Sudan, Ethiopia, Eritrea and
Egypt. Nile River has two main tributaries; White Nile
with its sources from Burundi, Rwanda, Tanzania,
Kenya, Zaire and Uganda and Blue Nile with its sources
in the Ethiopian highlands. The population living in this
basin represents about 54% of the total population of
the riparian countries. Within the Nile basin, there are
five major lakes (Victoria, Albert, Kyoga, Tana and
Nasser) with a surface area larger than 1000 km2
1.1 Location and Study Area
The Nile extends over a wide band of latitude from 4°S to 32°N. The
river flows from highland region in the tropical climate zone with
abundant moisture to lowland plains under severe arid conditions.
It has a total length of 6700 km. Egypt is wholly dependent upon
water that originates from the upstream Nile Basin. The drainage
area of the Nile basin is roughly 3.4 million km2, with and average
discharge of 2800m3/s; providing freshwater resources to a
population of about 200 million people.
1.2 Use of RIBASIM to analyse the Basin
To analyse the Project and its different components River Basin Simulation (RIBASIM) is used as a tool.
This software was developed by Deltares, Delft Hydraulics which is mainly used in water management
studies for the simulation of river basin management. This model is used for large water resources
development and also operational of water management systems dealing with multi sector of water
supply. To address all the problems related to water resources and water supply, appropriate
schematization is to be done during modelling in RIBASIM
Figure 1 Overview of the Nile Basin
Figure 2 Nile River Basin

7/21/2019 A Report on RIBASIM-Submitted Final
http://slidepdf.com/reader/full/a-report-on-ribasim-submitted-final 10/72
A Report on Nile Integrated River Basin Master Plan Using RIBASIM HERBD/43584/227/45880/277
10
2. Characterization of the Nile Water Resources
The components that should be included in planning IWRM in the Nile Basin are as follows:
Components of Natural Resource System (NRS)
The physical system-
The average annual rainfall over the basin differs considerably from upstream
2500mm/year to downstream 0mm/year
In the south, the highest rainfall volume is accumulated in the month of April, with a
second maximum between September and November
In the north, maximum rainfall gradually shifts towards a single maximum in July-
August.
Fluctuations in the Nile flows are primarily driven by the variation in rainfall over the
Ethiopian highlands
The considerable amount of water is lost through evaporation
The chemical system and
The biological system-response of aquatic and terrestrial ecosystem, sedimentation problems
in the reservoirs, flooding
Control variables – Change of Reservoir operation rule curve, the size of feeder canals, etc.
Components of Socio-Economic System (SES)
Water uses and related activities-
Dams constructed for irrigations and hydropower like the Rosieres and sennar in the
blue Nile, Aswan in the Main Nile
Regulated lakes like Lake Tana
Water supply both for municipal and industrial
Future plans for expansion of those schemes
Tourist attraction
Control variables –Governed by legislative and regulating measures
Components of the administrative and Institutional System (AIS)
International Agreement- between the countries like the agreement of Egypt and Great
Britain ( Repr. Sudan, Kenya, Tanzania and Uganda) in 1929; Egypt and Sudan in 1959 and
Egypt and Ethiopia in 1993
Central Government
Regional government
Coordinating bodies between the countries

7/21/2019 A Report on RIBASIM-Submitted Final
http://slidepdf.com/reader/full/a-report-on-ribasim-submitted-final 11/72
A Report on Nile Integrated River Basin Master Plan Using RIBASIM HERBD/43584/227/45880/277
11
Figure 3 Integrated Water Resource Management Framework
2.1The Stakeholders
The stake holder analysis is done based on this format
Meet their needs Key player
Least important Show consideration
Figure 4 Stake Holder Analysis
Stakeholder analysis is a process of systematically gathering and analysing qualitative information to
determine whose interests should be taken into account when developing and/or implementing a policy
or program. Stakeholders in a process are actors (persons or organizations) with a vested interest in the
Interest of stakeholders
Power/influenceofstakeholders
7/21/2019 A Report on RIBASIM-Submitted Final
http://slidepdf.com/reader/full/a-report-on-ribasim-submitted-final 12/72
A Report on Nile Integrated River Basin Master Plan Using RIBASIM HERBD/43584/227/45880/277
12
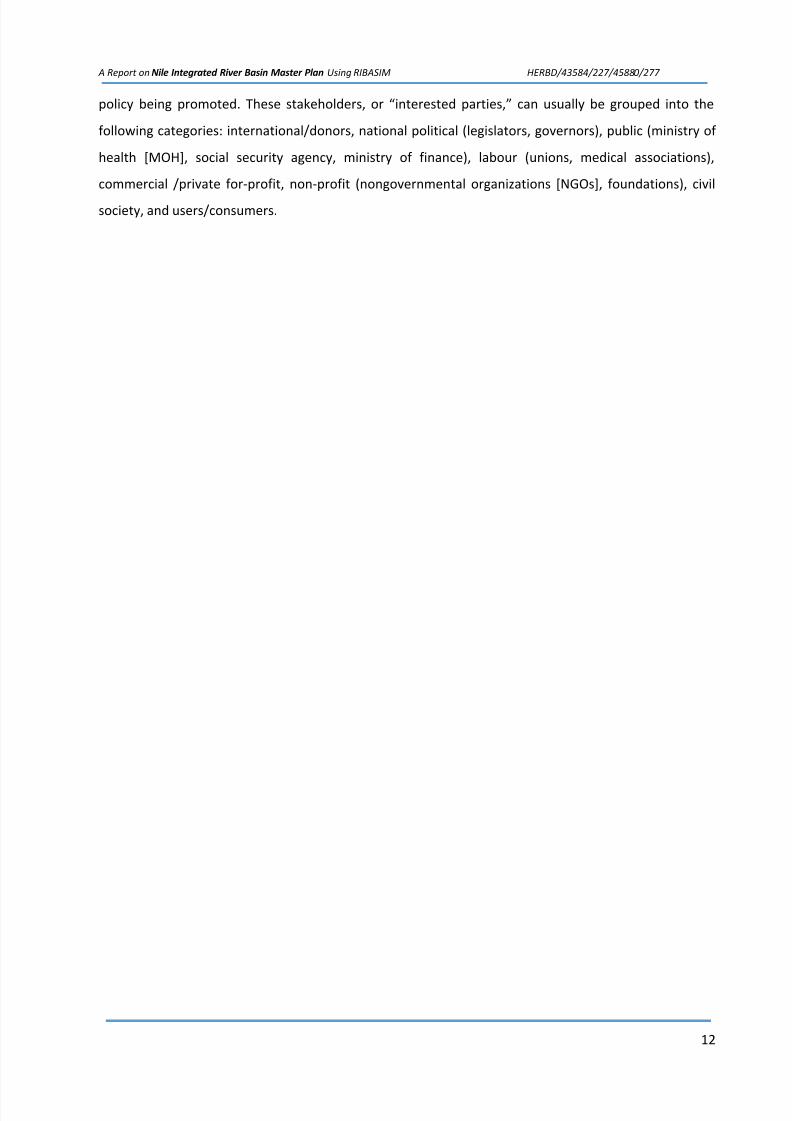
policy being promoted. These stakeholders, or “interested parties,” can usually be grouped into the
following categories: international/donors, national political (legislators, governors), public (ministry of
health [MOH], social security agency, ministry of finance), labour (unions, medical associations),
commercial /private for-profit, non-profit (nongovernmental organizations [NGOs], foundations), civil
society, and users/consumers.

7/21/2019 A Report on RIBASIM-Submitted Final
http://slidepdf.com/reader/full/a-report-on-ribasim-submitted-final 13/72
A Report on Nile Integrated River Basin Master Plan Using RIBASIM HERBD/43584/227/45880/277
13
A scoring system was used to more easily decide on a ranking, as it was difficult to say definitively if groups had power ( legitimacy and urgency) or not, and a
scale more accurately reflected the differences between groups. For the Venn diagram values of 2 and 3 were included in the circle, with 1 excluded.
Stakeholder Description Scoring (3-high, 1-low) Stakeholder type
Power Urgency Legitimacy
Aquaculture/Fisheries Local industry who wish to maintain traditional
fishery or develop a new economic sector of
aquaculture using the lake
3 3 2 Definitive
Governmental Consortium The lake management organisation, with
representatives from the three bordering countries
3 2 3 Definitive
Environmental NGOs Local and larger groups concerned about the
environmental state of the lake
1 3 3 Dependent
Local people Residents of the area 2 1 1 Dormant
Recreational Users Primarily boat and property owners from other
places who visit the lake frequently
2 3 1 Dangerous
Tourism Largest economic sector in region 1 2 1 Demanding
Universities/Research
centres
Researchers interested in the region 1 1 3 Discretionary
Consumers People who would buy the fish produced in the
region
1 2 1 Demanding
7/21/2019 A Report on RIBASIM-Submitted Final
http://slidepdf.com/reader/full/a-report-on-ribasim-submitted-final 14/72
A Report on Nile Integrated River Basin Master Plan Using RIBASIM HERBD/43584/227/45880/277
14
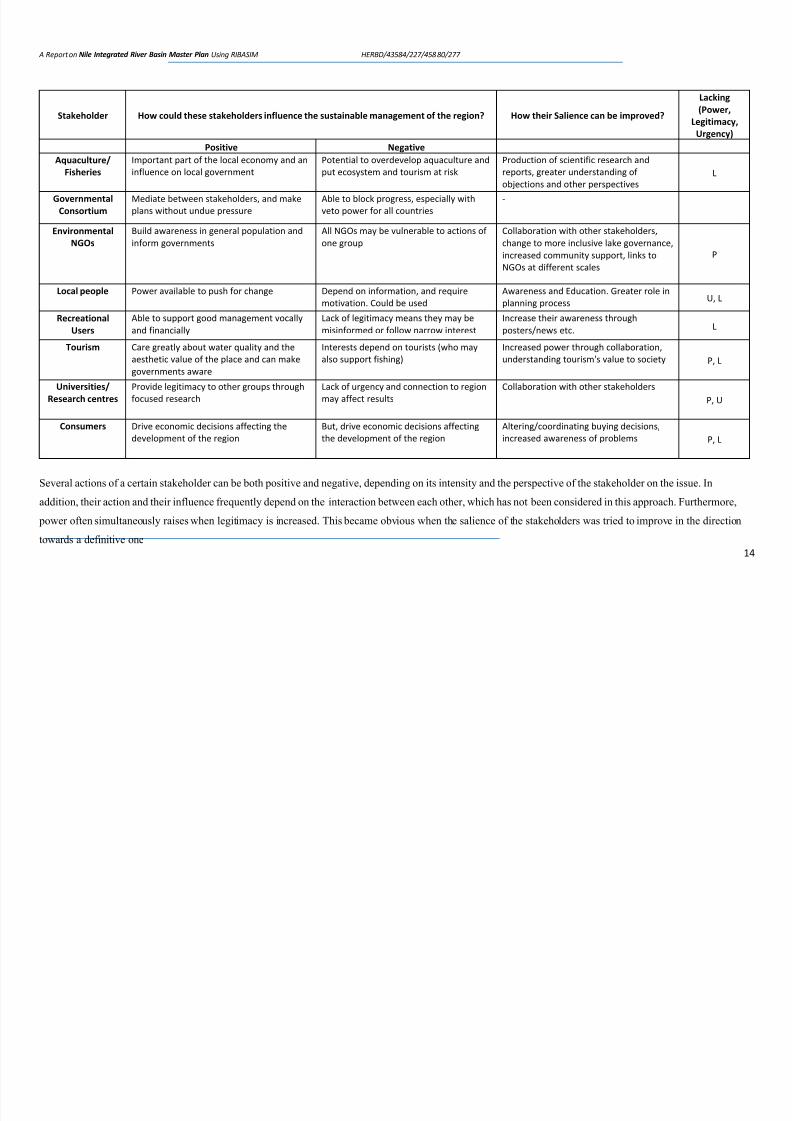
Several actions of a certain stakeholder can be both positive and negative, depending on its intensity and the perspective of the stakeholder on the issue. In
addition, their action and their influence frequently depend on the interaction between each other, which has not been considered in this approach. Furthermore,
power often simultaneously raises when legitimacy is increased. This became obvious when the salience of the stakeholders was tried to improve in the direction
towards a definitive one
Stakeholder How could these stakeholders influence the sustainable management of the region? How their Salience can be improved?
Lacking
(Power,
Legitimacy,
Urgency)
Positive Negative
Aquaculture/
Fisheries
Important part of the local economy and an
influence on local government
Potential to overdevelop aquaculture and
put ecosystem and tourism at risk
Production of scientific research and
reports, greater understanding of
objections and other perspectives
L
GovernmentalConsortium
Mediate between stakeholders, and make
plans without undue pressure
Able to block progress, especially with
veto power for all countries
-
Environmental
NGOs
Build awareness in general population and
inform governments
All NGOs may be vulnerable to actions of
one group
Collaboration with other stakeholders,
change to more inclusive lake governance,
increased community support, links to
NGOs at different scales
P
Local people Power available to push for change Depend on information, and require
motivation. Could be used
Awareness and Education. Greater role in
planning processU, L
Recreational
Users
Able to support good management vocally
and financially
Lack of legitimacy means they may be
misinformed or follow narrow interest
Increase their awareness through
posters/news etc. L
Tourism Care greatly about water quality and the
aesthetic value of the place and can make
governments aware
Interests depend on tourists (who may
also support fishing)
Increased power through collaboration,
understanding tourism's value to society P, L
Universities/Research centres Provide legitimacy to other groups throughfocused research Lack of urgency and connection to regionmay affect results Collaboration with other stakeholdersP, U
Consumers Drive economic decisions affecting the
development of the region
But, drive economic decisions affecting
the development of the region
Altering/coordinating buying decisions,
increased awareness of problems P, L

7/21/2019 A Report on RIBASIM-Submitted Final
http://slidepdf.com/reader/full/a-report-on-ribasim-submitted-final 15/72
A Report on Nile Integrated River Basin Master Plan Using RIBASIM
3. Problem Identification for the Present Situation
Table 1 Problem Identification
Basin systemphenomena
Causes Socio-econ. effects Measures Implications
Shortage of waterInsufficient food
-uneven rainfall-increased demand
economic losses reservoirs - high costs- hydropower
- environmentaleffects
Water quality (asshown in figure 4)
- Quantity ofdomestic andindustrial effluents.- Quantity of flow inthe canals, which inturn depends onirrigation demands.
Socio-econ. EffectsHealth issues
Along the Nile basin - environmentaleffects-Diseases
Power Supply
Agriculture
Water Allocation and
Equity
Dams (reservoirs)
Health Problems
Food insecurity
Water Shortage
Population Growth
High Sediment Trap
Environmental
Effects
Floods
Crop Yield
Economy
Figure 5 Problem Identification

7/21/2019 A Report on RIBASIM-Submitted Final
http://slidepdf.com/reader/full/a-report-on-ribasim-submitted-final 16/72
A Report on Nile Integrated River Basin Master Plan Using RIBASIM HERBD/43584/227/45880/277
16
4. Objective and Criteria (including the Work Plan)
Objectives Evaluation Criteria
1. Self-sufficiency food Coverage [%]
2. Improve employment Increase of employment
- Number of permanent jobs
- Number of temporally jobs
3. Increase income of people
- Improve income position of farmers
- Improve equity in income distribution
net income of the farmers
4. Increase the export production - Export value
5. Support economic development in an economic
development in an economically efficient way
- Total annual benefits
- Total annual costs
- B/C ratio
- NPV
- Total capital required
- Foreign currency required
- Total construction costs
- Total O&M costs
- Sectorial value added
- GRP

7/21/2019 A Report on RIBASIM-Submitted Final
http://slidepdf.com/reader/full/a-report-on-ribasim-submitted-final 17/72
A Report on Nile Integrated River Basin Master Plan Using RIBASIM HERBD/43584/227/45880/277
17
5. Nile RIBASIM Schematization
The Nile Basin except the Atbara River till the confluence
was provided by the lecturer. So the schematisation of
Atbara River with different structures in the river was madeas shown in figure 7. This was done by adding confluence
points and connecting them with the links and calibrating
them. The schematization includes different natural
systems as well as manmade systems. For the analysis of
this basin, schematization at Atbara River includes different
types of nodes Variable inflow nodes, Confluence nodes,
surface irrigation nodes, fixed irrigation nodes, Reservoirs
nodes and diversion nodes which were connected by the
links.
5.1 Reservoirs (Merowe Dam)
Merowe dam is a potential project proposed to be built on
the Nile river basin in 2002. This dam is located in north Sudan in the capital Khartoum, the main
purpose behind building this dam is hydropower
generation, as well as controlling the flood. The
flood water level is expected to be 300m with a
discharge 9999 m3/s with expected 1250MW of
electricity, this project is considered as the largest
contemporary hydropower project in Africa. The
creation of the reservoir lake will increase the
surface area of the Nile about 700 km2, with
1500,000 m3/yr evapotranspiration rate and this
loss is almost 8% of the total water in Sudan.
5.2 Karadobi Dam
Karadobi projects is expected to provide improvements to the downstream riparian countries with
regards to flooding, siltation, irrigation and water conservation.
The Karadobi hydropower project is located on the Abbay River ( Blue Nile ). The proposed dam site
is located 1.7km down stream of its confluence with Guder River at about 135km (air distance) north
west of Addis-Ababa. The project was studied at reconnaissance level in the Abbay River Master Plan
Project by BCEOM, in 1998.
Figure 6 Schematization of the Nile Basin showing Atbara
River Confluence
Figure 7 Merowe Dam

7/21/2019 A Report on RIBASIM-Submitted Final
http://slidepdf.com/reader/full/a-report-on-ribasim-submitted-final 18/72
A Report on Nile Integrated River Basin Master Plan Using RIBASIM HERBD/43584/227/45880/277
18
The Ministry of Water Resources had entered an agreement and signed a contract with the
international consultants, Norplan-Norconsult- Lahmeyer (with local associates) on May 10, 2004, to
undertake pre-feasibility and feasibility studies of Karadobi hydropower projects respectively.
The study of the Karadobi Multi-Purpose Project indicate a rolled concrete gravity dam of maximum
structural height of 260m and length of about 684 m at the crest, with a corresponding installed
capacity of 1600 MW. The reservoir area full level has an area of 445km 2 with a capacity of. 40,200
Mm3.
The goal of the Project is to:
Promote regional economic development through provision of more renewable hydropower energy
at a reasonable cost

7/21/2019 A Report on RIBASIM-Submitted Final
http://slidepdf.com/reader/full/a-report-on-ribasim-submitted-final 19/72
A Report on Nile Integrated River Basin Master Plan Using RIBASIM HERBD/43584/227/45880/277
19
6. Model data, calibration and assumption
Calibration of the model data means a cross check of the variation between the simulated and
monitored data. In this Basin the variation between the simulated and monitored may be due to
heavy evaporation loss in the basin. So, to compensate this error surface area and initial storage wascalculated by assuming average depth of 10m. The calculation is shown in table 1 below. This Value
was used in the model as shown in the figure 4.i.e in the storage node. The chart showing the
calibrated data with simulated and monitored data is as shown in figure 5.
Table 2 Data Analysis for Calibration and model input
Figure 8 Data for calibration

7/21/2019 A Report on RIBASIM-Submitted Final
http://slidepdf.com/reader/full/a-report-on-ribasim-submitted-final 20/72
A Report on Nile Integrated River Basin Master Plan Using RIBASIM HERBD/43584/227/45880/277
20
Figure 9 Results of Calibration

7/21/2019 A Report on RIBASIM-Submitted Final
http://slidepdf.com/reader/full/a-report-on-ribasim-submitted-final 21/72
A Report on Nile Integrated River Basin Master Plan Using RIBASIM HERBD/43584/227/45880/277
21
7. Base case analysis including the water demands (for each water user)
for the present and future situation (Reference Case)
7.1 Water requirements for public and livestock water supply in present case
For the current situation the water demand is computed by translating population and livestock
statistics into food demand. The food demand is used for determining the required irrigation area.
The population in Egypt, Sudan and South Sudan, and Ethiopia is indicated in table2.
Country Population*10^6 in 2005
Ethiopia 27.1
Sudan and South Sudan 26.4
Egypt 72
Table 3 Population in Egypt, Sudan and South Sudan, and Ethiopia 2005
The water needed per country is given in table 3 below.
Country Water Needed for population (l/cap/day)
Ethiopia 25
Sudan and South Sudan 25
Egypt 56
Table 4 Water needed by the population in the four riparian countries 2005
The datas from table 2 and 3 was then used to calculate the total water demand for each riparian
countries. The result obtained is illustrated in table 4 below.
Country Ethiopia Sudan and South Sudan Egypt
Population 27,100,000.00 26,400,000.00 72,000,000.00
Population water
demand (McM)247,287,500.00 240,900,000.00 1,471,680,000.00
Table 5 Population and Water Demand for the Riparian Countries 2005
Similarly, using the table 5 and 6 below the water demand for the livestocks was calculated and is
shown in table 7 below.
Country Livestock (in*10^6 TLU)
Ethiopia 10.6
Sudan and South Sudan 31.2
Egypt 50
Table 6 Livestock details 2005
Country Water Needed for Livestock(l/cap/day)
Ethiopia 20
Sudan and South Sudan 20
Egypt 20
Table 7 Water needed for livestock 2005

7/21/2019 A Report on RIBASIM-Submitted Final
http://slidepdf.com/reader/full/a-report-on-ribasim-submitted-final 22/72
A Report on Nile Integrated River Basin Master Plan Using RIBASIM HERBD/43584/227/45880/277
22
Country EthiopiaSudan and South
SudanEgypt
Population 10,600,000.00 31,200,000.00 50,000,000.00
Population water demand
Livestock (McM)77,380,000.00 227,760,000.00 365,000,000.0
Table 8 Population and Water Demand of Livestock 2005
Then the total water demand was calculated per country as follows:
Country Ethiopia Sudan and South
Sudan
Egypt
Population 27,100,000.00 26,400,000.00 72,000,000.00
Population water demand (McM) 247,287,500.00 240,900,000.00 1,471,680,000.00
Population 10,600,000.00 31,200,000.00 50,000,000.00
Population water demand
Livestock (McM)
77,380,000.00 227,760,000.00 365,000,000.00
Total water demand PWS(McM/year) 324,667,500.00 468,660,000.00 1,836,680,000.00
Total water demand PWS(m3/s) 10.30 14.86 58.24
Table 9 Total Water Demand 2005
The results were then used as the values for public water supply nodes in Ribasim.
7.2 Water Demand for Irrigation in present case
Two assumptions were made for the computation of irrigated area.
1. Only wheat is considered to fulfil cereal requirement
2. Sugarcane is entirely for export and does not contribute to food of local population
For the agricultural water demand, the food demand for the population was calculated using
the datas in table 9 and table 2. Then using table 10 required Irrigation area was calculated
which is as shown in table 11.
Energy requirement per capita per day assuming light activity level (Kcal) 2100
Nutritional Value of 1000gm cereals / wheat (Kcal) 3400
Table 10 Energy Table 2005
Country Potential yield (kg/ha/yr)Wheat Vegetables Sugarcane
Ethiopia 1160 40000 125000
Sudan and South Sudan 1600 40000 125000
Egypt 8000 40000 125000
Table 11 Potential yield for wheat, vegetables and sugarcane 2005
Country Ethiopia Sudan and South
Sudan
Egypt Total
Total cereals/wheat
requirements per
year(Mton)
6,109,455,882 5,951,647,058 16,231,764,705 28,292,867,647

7/21/2019 A Report on RIBASIM-Submitted Final
http://slidepdf.com/reader/full/a-report-on-ribasim-submitted-final 23/72
A Report on Nile Integrated River Basin Master Plan Using RIBASIM HERBD/43584/227/45880/277
23
Required
cereals/wheat area
(Mha)
5,266,772 3,719,779 2,028,970 11,015,522
Required Irrigation
Area (Mha)5,266,772 3,719,779 2,028,970 11,015,522
Table 12 Required Irrigation Area 2005
The irrigated area in present situation according to the country is as shown in table 12.
Country Node Total irrigated area
2005 (ha) from
software
Total irrigated
area 2005 (ha)
% Area
distribution
Ethiopia Fir_Et_SmallScaleHumer
aMetemaIrr(P)
1800 0
Total 1800 0
Sudan and
South Sudan
Fir_Su_NewHalfaIrr 105000 105000 12.43%
Fir_Su_GeziraMenagilSu
kiGeneidAbuNamaSel
650000 650000 76.92%
Fir_Su_MainNile_Merow
eNasser_Irr
90000 90000 10.65%
Total 845000 845000 100.00%
Egypt Fir_Eg_ToshkaPumpSche
me
250000 250000 8.20%
Fir_Eg_NileValleyDelta 2800000 2800000 91.80%
Total 3050000 3050000 100.00%
Basin Level Total 3896800 3895000
Table 13 Current Irrigated area for the Nile River Basin 2005
However there is a difference between the area currently irrigated (2005) and the area that is
equipped for irrigation. For this the datas were taken from AQUASTAT as per the country and a
comparison was made based on it as follows:
CountryArea equipped for
irrigation (ha)
Area currently irrigated
(ha)
Required
irrigation(ha)
Ethiopia 289,530 - 5,266,772
Ethiopia basin
(20%)57,906 - 5,266,772
Sudan and SouthSudan
1,863,000 845,000 3,719,779
Egypt 3,422,178 3,050,000 2,028,971
Table 14 Comparision area equiped for irrigation, area currenlty irrigated and required irrigation per country 2005
From the above table we can conclude that currently Ethiopia is not irrigated at all along the nile basin
using the water from nile, whereas in Egypt the irrigated area is more than required areas. But Sudan
and south sudan has a lack of irrigation land even if they irrigate all the potential land similar to
Ethiopia.
Finally the irrigated are is divided into areas growing wheat and sugarcane using table 14 as a base.The area irrigated with wheat and sugarcane in each country is then given in table 15 below.
7/21/2019 A Report on RIBASIM-Submitted Final
http://slidepdf.com/reader/full/a-report-on-ribasim-submitted-final 24/72
A Report on Nile Integrated River Basin Master Plan Using RIBASIM HERBD/43584/227/45880/277
24
Country
Cropping pattern (2005)
Wheat and vegetables (%) Sugarcane (%)
Ethiopia basin (20%) 100 -
Sudan and South Sudan 80 20
Egypt 90 10Table 15 Cropping Pattern per country for the present situation 2005
Country Area Irrigated Wheat (ha) Area Irrigated Sugar cane (ha)
Ethiopia 0
Ethiopia basin (20%) 0 0
Sudan and South Sudan 676,000 169,000
Egypt 2,745,000 305,000
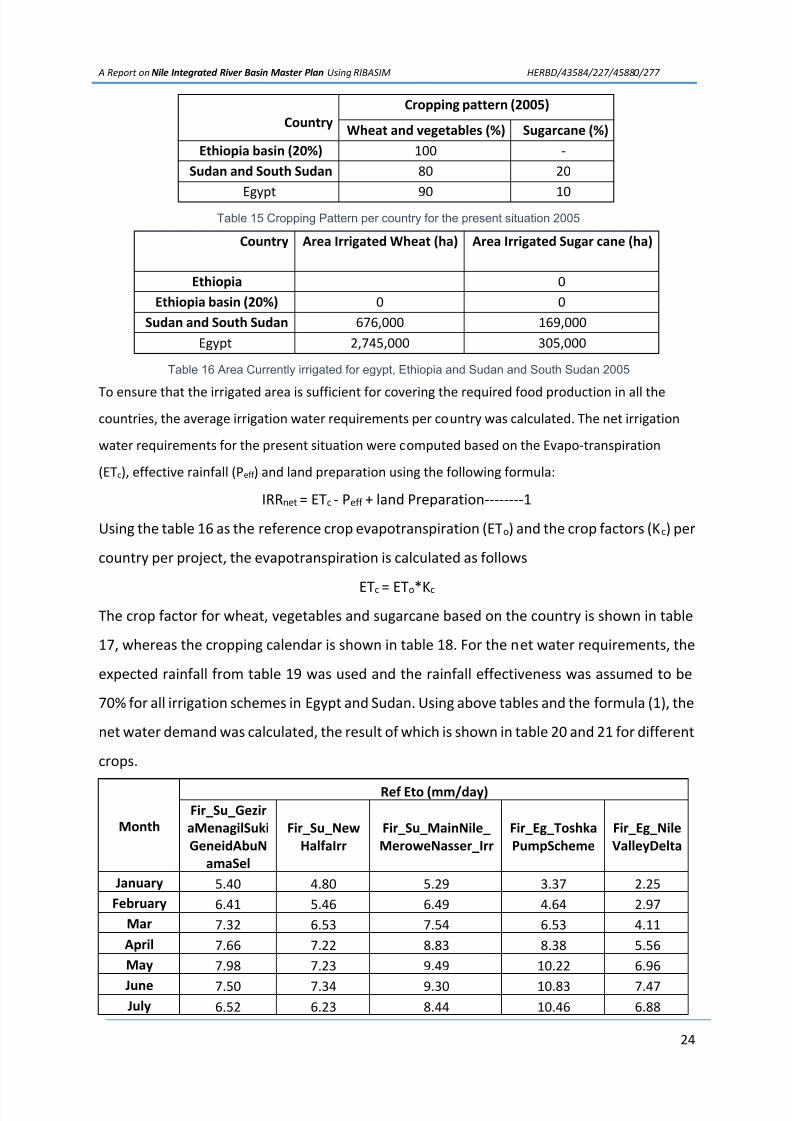
Table 16 Area Currently irrigated for egypt, Ethiopia and Sudan and South Sudan 2005
To ensure that the irrigated area is sufficient for covering the required food production in all the
countries, the average irrigation water requirements per country was calculated. The net irrigation
water requirements for the present situation were computed based on the Evapo-transpiration
(ETc), effective rainfall (Peff ) and land preparation using the following formula:
IRRnet = ETc - Peff + land Preparation--------1
Using the table 16 as the reference crop evapotranspiration (ETo) and the crop factors (Kc) per
country per project, the evapotranspiration is calculated as follows
ETc = ETo*Kc
The crop factor for wheat, vegetables and sugarcane based on the country is shown in table
17, whereas the cropping calendar is shown in table 18. For the net water requirements, the
expected rainfall from table 19 was used and the rainfall effectiveness was assumed to be
70% for all irrigation schemes in Egypt and Sudan. Using above tables and the formula (1), the
net water demand was calculated, the result of which is shown in table 20 and 21 for different
crops.
Month
Ref Eto (mm/day)
Fir_Su_Gezir
aMenagilSuki
GeneidAbuN
amaSel
Fir_Su_New
HalfaIrr
Fir_Su_MainNile_
MeroweNasser_Irr
Fir_Eg_Toshka
PumpScheme
Fir_Eg_Nile
ValleyDelta
January 5.40 4.80 5.29 3.37 2.25
February 6.41 5.46 6.49 4.64 2.97
Mar 7.32 6.53 7.54 6.53 4.11
April 7.66 7.22 8.83 8.38 5.56
May 7.98 7.23 9.49 10.22 6.96
June 7.50 7.34 9.30 10.83 7.47
July 6.52 6.23 8.44 10.46 6.88

7/21/2019 A Report on RIBASIM-Submitted Final
http://slidepdf.com/reader/full/a-report-on-ribasim-submitted-final 25/72
A Report on Nile Integrated River Basin Master Plan Using RIBASIM HERBD/43584/227/45880/277
25
August 5.85 5.43 8.10 10.15 6.26
September 6.07 5.83 8.01 8.99 5.44
October 5.85 5.39 7.66 6.93 4.30
November 5.90 4.91 6.12 4.66 2.90
December 5.36 4.61 5.09 3.43 2.19
Table 17 Crop Evapo-transpiration per irrigation scheme in sudan and Egypt 2005
MonthKc
Wheat Vegetables Sugarcane
1 0.50 0.78 0.40
2 0.72 0.95 0.82
3 1.15 1.05 0.82
4 1.15 1.05 1.25
5 0.32 0.75 1.25
6 1.25
7 1.25
8 1.25
9 1.25
10 1.25
11 0.75
12 0.75
Table 18 Crop factors for Wheat,Vegetables and Sugarcane 2005
Type of
Crop
Calendar cropping plan
Sudan Egypt
Wheat June October
Vegetables December April
Sugarcane January January
Table 19 Calendar of the cropping plan for Sudan and Egypt 2005
Month
Ref Eto (mm/day)
Fir_Su_GeziraMena
gilSukiGeneidAbuN
amaSel
Fir_Su_New
HalfaIrr
Fir_Su_MainNile_
MeroweNasser_Irr
Fir_Eg_Toshka
PumpScheme
Fir_Eg_Nile
ValleyDelta
January 0.00 0.00 0.00 0.00 0.00
February 0.00 0.00 0.00 0.00 0.00Mar 0.00 0.00 0.00 0.00 0.00
April 0.05 0.06 0.00 0.00 0.00
May 0.37 0.55 0.09 0.00 0.00
June 0.84 1.30 0.13 0.00 0.00
July 2.42 3.48 0.19 0.00 0.00
August 2.88 3.67 0.59 0.00 0.00
September 1.36 1.89 0.05 0.00 0.00
October 0.37 0.34 0.01 0.00 0.00
November 0.01 0.06 0.00 0.00 0.00
December 0.00 0.00 0.00 0.00 0.00

7/21/2019 A Report on RIBASIM-Submitted Final
http://slidepdf.com/reader/full/a-report-on-ribasim-submitted-final 26/72
A Report on Nile Integrated River Basin Master Plan Using RIBASIM HERBD/43584/227/45880/277
26
Table 20Expected rainfall per irrigation scheme in Egypt 2005
Also, following formulas were used to calculate table 20 and 21 for different crop types
NWR=Sub-NWR (Sub-NWR>0)
NWR =0(Sub-NWR<0) And multiplying NWR (mm/day) times 0.116 for computing the NWR (l/s. ha)
7/21/2019 A Report on RIBASIM-Submitted Final
http://slidepdf.com/reader/full/a-report-on-ribasim-submitted-final 27/72
A Report on Nile Integrated River Basin Master Plan Using RIBASIM
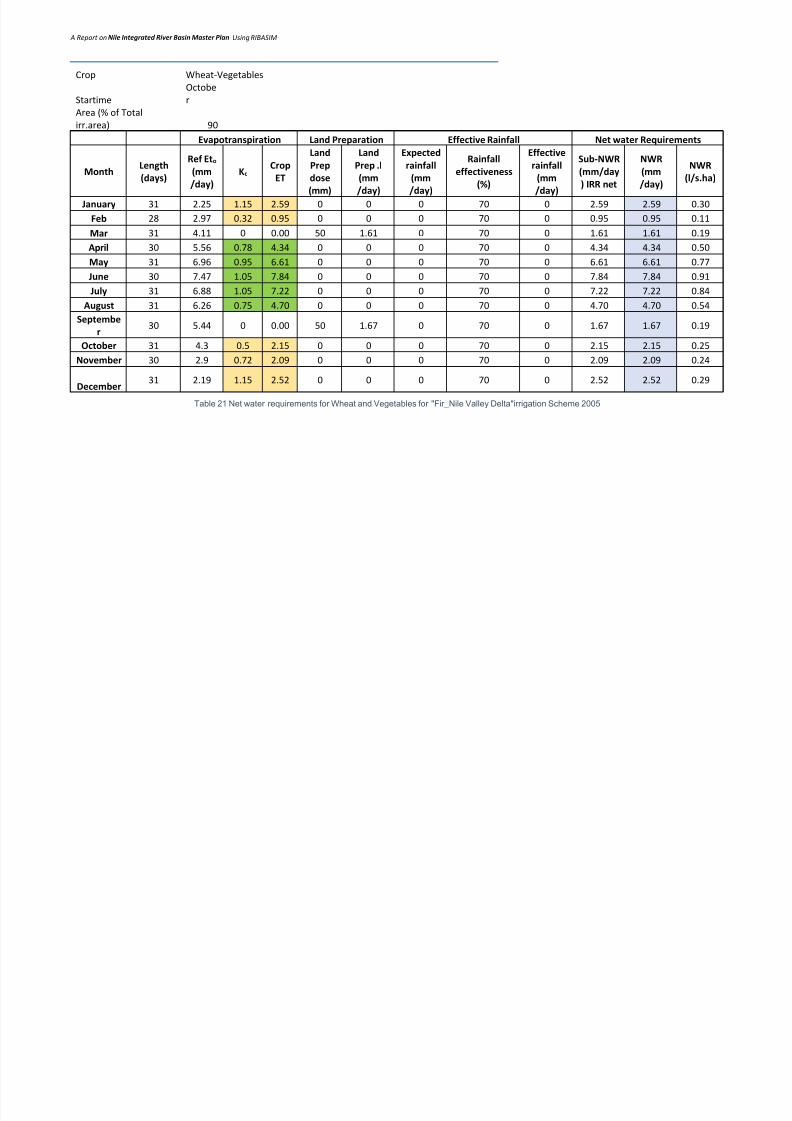
Crop Wheat-Vegetables
Startime
Octobe
r
Area (% of Total
irr.area) 90
Evapotranspiration Land Preparation Effective Rainfall Net water Requirements
MonthLength
(days)
Ref Eto
(mm
/day)
Kc Crop
ET
Land
Prep
dose
(mm)
Land
Prep .l
(mm
/day)
Expected
rainfall
(mm
/day)
Rainfall
effectiveness
(%)
Effective
rainfall
(mm
/day)
Sub-NWR
(mm/day
) IRR net
NWR
(mm
/day)
NWR
(l/s.ha)
January 31 2.25 1.15 2.59 0 0 0 70 0 2.59 2.59 0.30
Feb 28 2.97 0.32 0.95 0 0 0 70 0 0.95 0.95 0.11
Mar 31 4.11 0 0.00 50 1.61 0 70 0 1.61 1.61 0.19
April 30 5.56 0.78 4.34 0 0 0 70 0 4.34 4.34 0.50
May 31 6.96 0.95 6.61 0 0 0 70 0 6.61 6.61 0.77
June 30 7.47 1.05 7.84 0 0 0 70 0 7.84 7.84 0.91
July 31 6.88 1.05 7.22 0 0 0 70 0 7.22 7.22 0.84
August 31 6.26 0.75 4.70 0 0 0 70 0 4.70 4.70 0.54
Septembe
r30 5.44 0 0.00 50 1.67 0 70 0 1.67 1.67 0.19
October 31 4.3 0.5 2.15 0 0 0 70 0 2.15 2.15 0.25
November 30 2.9 0.72 2.09 0 0 0 70 0 2.09 2.09 0.24
December
31 2.19 1.15 2.52 0 0 0 70 0 2.52 2.52 0.29
Table 21 Net water requirements for Wheat and Vegetables for "Fir_Nile Valley Delta"irrigation Scheme 2005

7/21/2019 A Report on RIBASIM-Submitted Final
http://slidepdf.com/reader/full/a-report-on-ribasim-submitted-final 28/72
A Report on Nile Integrated River Basin Master Plan Using RIBASIM HERBD/43584/227/45880/277
28
Crop Sugarcane
Startime January
Area (% of Total
irr.area) 10
Evapotranspiration Land Preparation Effective Rainfall Net water Requirements
MonthLength
(days)
Ref Eto
(mm/day)Kc
Crop
ET
Land
Prep
dose
(mm)
Land Prep
.l
(mm/day)
Expected
rainfall
(mm/day)
Rainfall
effectiveness
(%)
Effective
rainfall
(mm/day)
Sub-NWR
(mm/day)
IRR net
NWR
(mm/day)
NWR
(l/s. ha)
January 31 2.25 0.4 0.90 0 0 0 70 0 0.90 0.90 0.10February 28 2.97 0.82 2.44 0 0 0 70 0 2.44 2.44 0.28
March 31 4.11 0.82 3.37 0 0 0 70 0 3.37 3.37 0.39
April 30 5.56 1.25 6.95 0 0 0 70 0 6.95 6.95 0.81
May 31 6.96 1.25 8.70 0 0 0 70 0 8.70 8.70 1.01
June 30 7.47 1.25 9.34 0 0 0 70 0 9.34 9.34 1.08
July 31 6.88 1.25 8.60 0 0 0 70 0 8.60 8.60 1.00
August 31 6.26 1.25 7.83 0 0 0 70 0 7.83 7.83 0.91
September 30 5.44 1.25 6.80 0 0 0 70 0 6.80 6.80 0.79
October 31 4.3 0.75 3.23 0 0 0 70 0 3.23 3.23 0.37
November 30 2.9 0.75 2.18 0 0 0 70 0 2.18 2.18 0.25
December 31 2.19 0.00 0.00 0 0 0 70 0 0.00 0.00 0.00
Table 22Net water requirements for Sugarcane for "Fir_Nile Valley Delta"irrigation Scheme 2005
The Net water requirement for all types of crops is calculated in table 22 below

7/21/2019 A Report on RIBASIM-Submitted Final
http://slidepdf.com/reader/full/a-report-on-ribasim-submitted-final 29/72
A Report on Nile Integrated River Basin Master Plan Using RIBASIM
29
MonthNWR
(mm/day)
January 2.42
Feb 1.10
Mar 1.79
April 4.60
May 6.82
June 7.99
July 7.36
August 5.01
September 2.18
October 2.26
November 2.10
December 2.27
Table 23 Total Net water Requirement for all types of crop 2005
Similarly, net water requirements for all the projects were calculated and then the values obtained
was entered in RIBASIM as shown in figure 10.
7.3 Analysis of Problems in Present case (Base Case)
After entering all the datas that was calculated into the Ribasim we get the following results in all
the water shortages in the present case.
7.3.1 Public Water Supply
The table below shows the summary of the results obtained.
MonthEthiopia
Sudan and
South SudanEgypt
2005 2005 2005
Jan 0.00 0.00 0.00
Feb 0.01 0.00 0.00
Mar 0.00 0.00 0.00
April 0.00 0.00 0.00
May 0.00 0.00 0.00Jun 0.31 0.00 0.00
Jul 0.00 0.00 0.00
Aug 0.00 0.00 0.00
Sep 0.00 0.00 0.00
Oct 0.00 0.00 0.00
Nov 0.00 0.00 0.00
Dec 0.00 0.00 0.00
Total 0.03 0.00 0.00
Table 24 Shortage in Public Water Supply

7/21/2019 A Report on RIBASIM-Submitted Final
http://slidepdf.com/reader/full/a-report-on-ribasim-submitted-final 30/72
A Report on Nile Integrated River Basin Master Plan Using RIBASIM HERBD/43584/227/45880/277
30
The graph of the same is as follows:
Figure 10 Shortage in Public Water Supply
The Graph of the same was also obtained from the Ribasim software which is presented below.
Figure 11 Graph obtained from Ribasim
By observing the above graphs, we can say that the shortage is maximum only June for Ethiopia and
the rest two countries have no impact in the present case.
7.3.2 Irrigation Water Shortage
The irrigation conditions in the present condition was analysed and summarised as shown in the
table below:
0.000
0.050
0.100
0.150
0.200
0.250
0.300
0.350
Jan Feb Mar Apr May Jun Jul Aug Sep Oct Nov Dec
D i s c h a r g e ( m 3 / s )
Month
Shortage in PWS
Ethiopia Sudan Egypt
7/21/2019 A Report on RIBASIM-Submitted Final
http://slidepdf.com/reader/full/a-report-on-ribasim-submitted-final 31/72
A Report on Nile Integrated River Basin Master Plan Using RIBASIM HERBD/43584/227/45880/277
31
MonthEthiopia
Sudan and
South SudanEgypt
2005 2005 2005
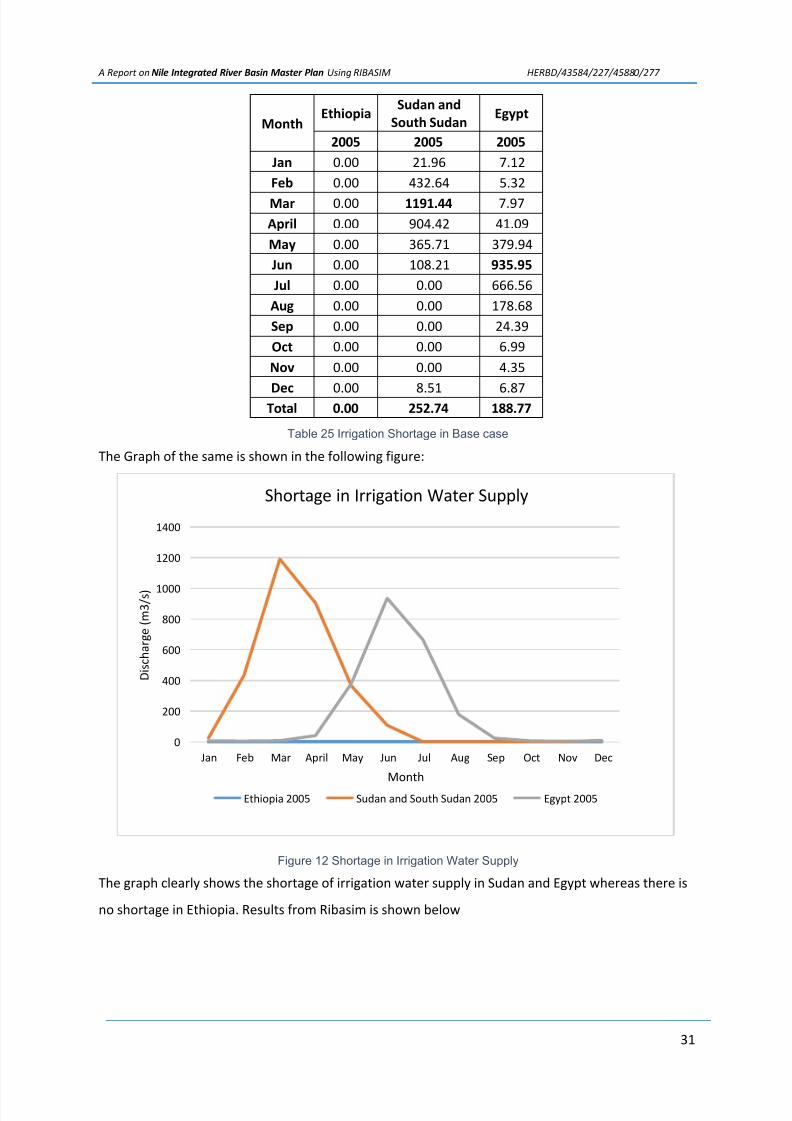
Jan 0.00 21.96 7.12
Feb 0.00 432.64 5.32
Mar 0.00 1191.44 7.97
April 0.00 904.42 41.09
May 0.00 365.71 379.94
Jun 0.00 108.21 935.95
Jul 0.00 0.00 666.56
Aug 0.00 0.00 178.68
Sep 0.00 0.00 24.39
Oct 0.00 0.00 6.99
Nov 0.00 0.00 4.35
Dec 0.00 8.51 6.87Total 0.00 252.74 188.77
Table 25 Irrigation Shortage in Base case
The Graph of the same is shown in the following figure:
Figure 12 Shortage in Irrigation Water Supply
The graph clearly shows the shortage of irrigation water supply in Sudan and Egypt whereas there is
no shortage in Ethiopia. Results from Ribasim is shown below
0
200
400
600
800
1000
1200
1400
Jan Feb Mar April May Jun Jul Aug Sep Oct Nov Dec
D i s c h a r g e ( m 3 / s )
Month
Shortage in Irrigation Water Supply
Ethiopia 2005 Sudan and South Sudan 2005 Egypt 2005

7/21/2019 A Report on RIBASIM-Submitted Final
http://slidepdf.com/reader/full/a-report-on-ribasim-submitted-final 32/72
A Report on Nile Integrated River Basin Master Plan Using RIBASIM HERBD/43584/227/45880/277
32
Figure 13 Ribasim Graph showing Shortage in Irrigation in
Figure 14 Ribasim Graph showing time step shortage in Irrigation Water Supply
7/21/2019 A Report on RIBASIM-Submitted Final
http://slidepdf.com/reader/full/a-report-on-ribasim-submitted-final 33/72
A Report on Nile Integrated River Basin Master Plan Using RIBASIM HERBD/43584/227/45880/277
33
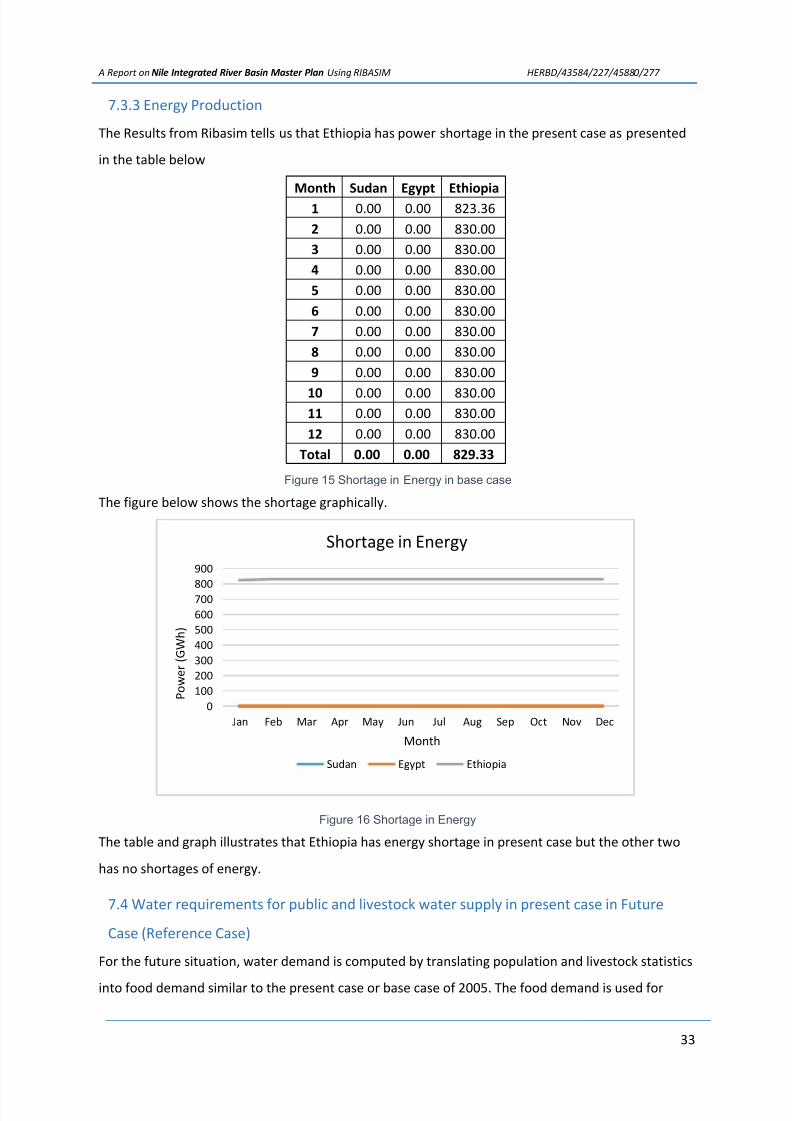
7.3.3 Energy Production
The Results from Ribasim tells us that Ethiopia has power shortage in the present case as presented
in the table below
Month Sudan Egypt Ethiopia
1 0.00 0.00 823.36
2 0.00 0.00 830.00
3 0.00 0.00 830.00
4 0.00 0.00 830.00
5 0.00 0.00 830.00
6 0.00 0.00 830.00
7 0.00 0.00 830.00
8 0.00 0.00 830.00
9 0.00 0.00 830.00
10 0.00 0.00 830.0011 0.00 0.00 830.00
12 0.00 0.00 830.00
Total 0.00 0.00 829.33
Figure 15 Shortage in Energy in base case
The figure below shows the shortage graphically.
Figure 16 Shortage in Energy
The table and graph illustrates that Ethiopia has energy shortage in present case but the other two
has no shortages of energy.
7.4 Water requirements for public and livestock water supply in present case in Future
Case (Reference Case)
For the future situation, water demand is computed by translating population and livestock statistics
into food demand similar to the present case or base case of 2005. The food demand is used for
0
100
200
300
400
500
600
700800
900
Jan Feb Mar Apr May Jun Jul Aug Sep Oct Nov Dec
P o w e r ( G W h )
Month
Shortage in Energy
Sudan Egypt Ethiopia

7/21/2019 A Report on RIBASIM-Submitted Final
http://slidepdf.com/reader/full/a-report-on-ribasim-submitted-final 34/72
A Report on Nile Integrated River Basin Master Plan Using RIBASIM HERBD/43584/227/45880/277
34
determining the required irrigation area. The population in Egypt, Sudan and South Sudan, and
Ethiopia is indicated in table23.
CountryPopulation*10^6 in 2030
Ethiopia 48
Sudan and South Sudan 44.8
Egypt 107
Table 26 Population in Egypt, Sudan and South Sudan, and Ethiopia 2030
The water needed per country is given in table 24 below.
Country
Water Needed
(l/cap/day)
Ethiopia 25
Sudan and South Sudan25
Egypt 56
Table 27 Water needed by the population in the four riparian countries 2030
The datas from table 23 and 24 was then used to calculate the total water demand for each riparian
countries. The result obtained is illustrated in table 24 below.
Country Ethiopia Sudan and South Sudan Egypt
Population 48,000,000.00 44,800,000.00 107,000,000.00
Population water
demand (McM)438,000,000.00 408,800,000.00 2,187,080,000.00
Table 28 Population and Water Demand for the Riparian Countries 2030
Similarly, using the table 25 and 26 below the water demand for the live stocks was calculated and is
shown in table 27 below.
Country Livestock (in*10^6 TLU)
Ethiopia 13.1
Sudan and South Sudan 41
Egypt 90
Table 29 Livestock details 2030
Country Water Needed for Livestock(l/cap/day)Ethiopia 20
Sudan and South Sudan 20
Egypt 20
Table 30 Water needed for livestock 2030
Country Ethiopia Sudan and South Sudan Egypt
Population 13,100,000.00 41,000,000.00 90,000,000.00
Population water
demand
Livestock(McM)
95,630,000.00 299,300,000.00 657,000,000.00
Table 31 Population and Water Demand of Livestock 2030
7/21/2019 A Report on RIBASIM-Submitted Final
http://slidepdf.com/reader/full/a-report-on-ribasim-submitted-final 35/72
A Report on Nile Integrated River Basin Master Plan Using RIBASIM HERBD/43584/227/45880/277
35
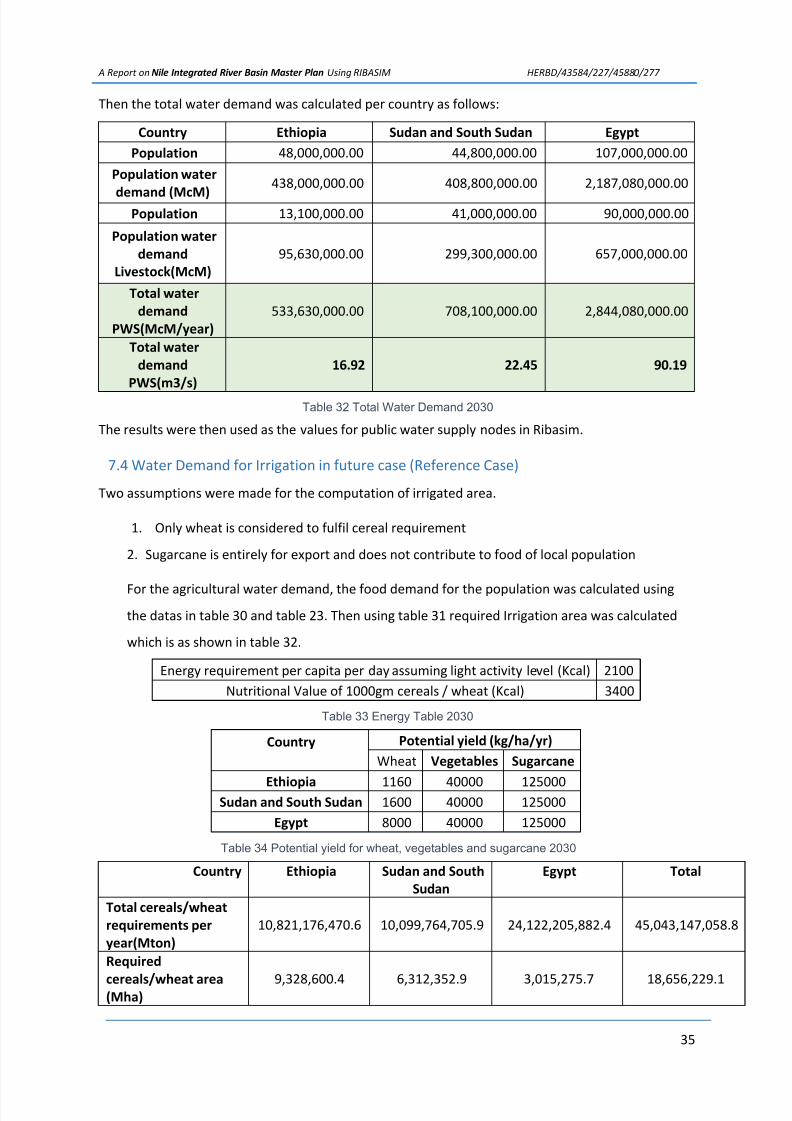
Then the total water demand was calculated per country as follows:
Country Ethiopia Sudan and South Sudan Egypt
Population 48,000,000.00 44,800,000.00 107,000,000.00
Population water
demand (McM)
438,000,000.00 408,800,000.00 2,187,080,000.00
Population 13,100,000.00 41,000,000.00 90,000,000.00
Population water
demand
Livestock(McM)
95,630,000.00 299,300,000.00 657,000,000.00
Total water
demand
PWS(McM/year)
533,630,000.00 708,100,000.00 2,844,080,000.00
Total water
demand
PWS(m3/s)
16.92 22.45 90.19
Table 32 Total Water Demand 2030
The results were then used as the values for public water supply nodes in Ribasim.
7.4 Water Demand for Irrigation in future case (Reference Case)
Two assumptions were made for the computation of irrigated area.
1. Only wheat is considered to fulfil cereal requirement
2. Sugarcane is entirely for export and does not contribute to food of local population
For the agricultural water demand, the food demand for the population was calculated using
the datas in table 30 and table 23. Then using table 31 required Irrigation area was calculated
which is as shown in table 32.
Energy requirement per capita per day assuming light activity level (Kcal) 2100
Nutritional Value of 1000gm cereals / wheat (Kcal) 3400
Table 33 Energy Table 2030
Country Potential yield (kg/ha/yr)
Wheat Vegetables Sugarcane
Ethiopia 1160 40000 125000Sudan and South Sudan 1600 40000 125000
Egypt 8000 40000 125000
Table 34 Potential yield for wheat, vegetables and sugarcane 2030
Country Ethiopia Sudan and South
Sudan
Egypt Total
Total cereals/wheat
requirements per
year(Mton)
10,821,176,470.6 10,099,764,705.9 24,122,205,882.4 45,043,147,058.8
Required
cereals/wheat area(Mha)
9,328,600.4 6,312,352.9 3,015,275.7 18,656,229.1

7/21/2019 A Report on RIBASIM-Submitted Final
http://slidepdf.com/reader/full/a-report-on-ribasim-submitted-final 36/72
A Report on Nile Integrated River Basin Master Plan Using RIBASIM HERBD/43584/227/45880/277
36
Table 35 Required Irrigation Area 2030
For the computation of the required irrigation area versus potential irrigation area we considered
that a country can only reach its potential irrigation area in the long term. Because it depends on set
of factors such as availability of labour force, financial and human resources capacity, infrastructure,
favourable political conditions and economic development.
Assuming that all the riparian countries experience an expansion of the current potential irrigated
area by 10% in the period 2005-2015 and by 50% in the period 2015-2030 and all the irrigation
schemes will be active. The table below shows the result,
CountryIrrigated
Areas (2005)
Estimated
irrigation
area (2015)
Estimated
irrigation
area (2030)
(Max)
Potential
irrigation
(FAO)
Required
Irrigation
(ha)
Ethiopia basin (20%) 0.00 1800.00 2700.00 2,220,000.00 9,328,600.4
Sudan and South
Sudan845,000.00 929,500.00 1,394,250.00 2,750,000.00 6,312,352.9
Egypt 3,050,000.00 3,355,000.00 5,032,500.00 4,420,000.00 3,015,275.7
Table 36 Irrigation developments for 2030
Estimated irrigation land for Egypt was more than maximum potential so the maximum potential
was taken for calculation purpose.
Assumptions considered for the computation of irrigated area in 2030 are only wheat is considered
as to fulfil cereal requirement and the other is sugarcane is entirely for export and does not
contribute to food for locals people. This implies that the area for wheat will increase and the area
of sugarcane remains the same as shown in table 34. Table 35 gives the cropping pattern in both
base case and reference case.
Country
Cropping Pattern base case (2005) Cropping pattern Reference case (2030)
Area
Irrigated
Wheat(ha)
Area Irrigated
Sugarcane (ha)
Area Irrigated
Wheat(ha)
Area Irrigated
Sugarcane (ha)
Ethiopia basin 0.00 0 2700.00 0
Sudan and
South Sudan 676,000.00 169,000.00 1,225,250.00 169,000.00
Egypt2,745,000.00 305,000.00 4,115,000.00 305,000.00
Table 37 Irrigated areas in base case and reference case 2030
Country
Cropping Pattern base case (2005) Cropping pattern Reference case (2030)
Wheat (%) Sugarcane (%) Wheat (%) Sugarcane (%)
Ethiopia basin 100 0 100 0
Sudan and South
Sudan80 20 87.88 12.12
Egypt 90 10 93.10 6.90
Table 38 Cropping patterns for 2030
7/21/2019 A Report on RIBASIM-Submitted Final
http://slidepdf.com/reader/full/a-report-on-ribasim-submitted-final 37/72
A Report on Nile Integrated River Basin Master Plan Using RIBASIM HERBD/43584/227/45880/277
37
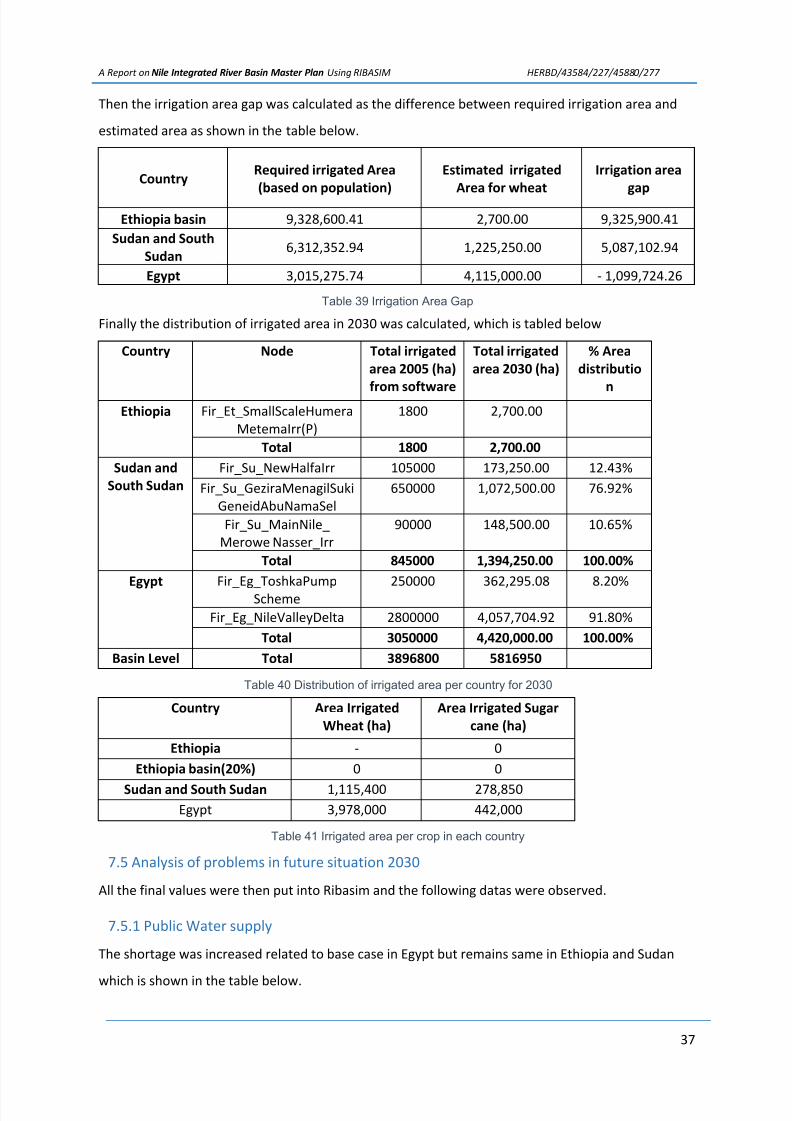
Then the irrigation area gap was calculated as the difference between required irrigation area and
estimated area as shown in the table below.
CountryRequired irrigated Area
(based on population)
Estimated irrigated
Area for wheat
Irrigation area
gap
Ethiopia basin 9,328,600.41 2,700.00 9,325,900.41
Sudan and South
Sudan6,312,352.94 1,225,250.00 5,087,102.94
Egypt 3,015,275.74 4,115,000.00 - 1,099,724.26
Table 39 Irrigation Area Gap
Finally the distribution of irrigated area in 2030 was calculated, which is tabled below
Country Node Total irrigated
area 2005 (ha)
from software
Total irrigated
area 2030 (ha)
% Area
distributio
nEthiopia Fir_Et_SmallScaleHumera
MetemaIrr(P)
1800 2,700.00
Total 1800 2,700.00
Sudan and
South Sudan
Fir_Su_NewHalfaIrr 105000 173,250.00 12.43%
Fir_Su_GeziraMenagilSuki
GeneidAbuNamaSel
650000 1,072,500.00 76.92%
Fir_Su_MainNile_
Merowe Nasser_Irr
90000 148,500.00 10.65%
Total 845000 1,394,250.00 100.00%
Egypt Fir_Eg_ToshkaPump
Scheme
250000 362,295.08 8.20%
Fir_Eg_NileValleyDelta 2800000 4,057,704.92 91.80%
Total 3050000 4,420,000.00 100.00%
Basin Level Total 3896800 5816950
Table 40 Distribution of irrigated area per country for 2030
Country Area Irrigated
Wheat (ha)
Area Irrigated Sugar
cane (ha)
Ethiopia - 0
Ethiopia basin(20%) 0 0
Sudan and South Sudan 1,115,400 278,850
Egypt 3,978,000 442,000
Table 41 Irrigated area per crop in each country
7.5 Analysis of problems in future situation 2030
All the final values were then put into Ribasim and the following datas were observed.
7.5.1 Public Water supply
The shortage was increased related to base case in Egypt but remains same in Ethiopia and Sudan
which is shown in the table below.

7/21/2019 A Report on RIBASIM-Submitted Final
http://slidepdf.com/reader/full/a-report-on-ribasim-submitted-final 38/72
A Report on Nile Integrated River Basin Master Plan Using RIBASIM HERBD/43584/227/45880/277
38
Month Egypt Ethiopia Sudan
January 0.668 0.008 0.000
Feb 1.239 0.247 0.000
Mar 1.751 0.503 0.000
April 2.735 0.408 0.000
May 3.048 0.456 0.000June 2.002 1.371 0.000
July 0.876 0.000 0.000
August 0.000 0.000 0.000
September 0.000 0.000 0.000
October 0.000 0.000 0.000
November 0.000 0.000 0.000
December 0.000 0.000 0.000
Total 1.027 0.249 0
Table 42 Shortage in Public Water Supply in Reference Case
Figure 17 Graph showing shortage in Public Water Supply in Reference Case
Results obtained from Ribasim
Figure 18 Ribasim Graph showing Shortage in Irrigation Water Supply in Reference Case
0
0.5
1
1.5
2
2.5
3
3.5
J a n
F e b
M a r
A
p r i l
M a y
J u n
J u l
A u g
S e p
O c t
N o v
D e c
D i s c h a r g e ( m 3 / s )
Month
Shortage in Public Water Supply
Egypt Ethiopia Sudan

7/21/2019 A Report on RIBASIM-Submitted Final
http://slidepdf.com/reader/full/a-report-on-ribasim-submitted-final 39/72
A Report on Nile Integrated River Basin Master Plan Using RIBASIM HERBD/43584/227/45880/277
39
7.5.2 Irrigation Water Demand
Similarly the results from Irrigation was obtained as follows:
MonthEthiopia
Sudan
and
SouthSudan
Egypt
2030 2030 2030
Jan 0.00 738.77 250.95
Feb 0.00 1600.71 143.37
Mar 0.05 1895.47 228.31
April 0.04 1713.22 910.46
May 0.00 659.90 2714.28
Jun 0.09 551.75 4413.43
Jul 0.00 1.27 3805.54
Aug 0.00 0.00 943.27
Sep 0.00 0.00 270.62
Oct 0.00 0.00 188.83
Nov 0.00 5.33 119.98
Dec 0.00 217.00 183.49
Total 0.01 615.28 1181.04
Table 43 Shortage in Irrigation Water Supply in Reference Case
The above table can be graphically represented as follows:
Figure 19 Shortage of Water for Irrigation in Reference Case
The results obtained from Ribasim is as follows:
0
1000
2000
3000
4000
5000
Jan Feb Mar April May Jun Jul Aug Sep Oct Nov Dec
D i s c h a r g e ( m 3 / s )
Month
Shortage in Irrigation Water Supply
Ethiopia Sudan and South Sudan Egypt
7/21/2019 A Report on RIBASIM-Submitted Final
http://slidepdf.com/reader/full/a-report-on-ribasim-submitted-final 40/72
A Report on Nile Integrated River Basin Master Plan Using RIBASIM HERBD/43584/227/45880/277
40
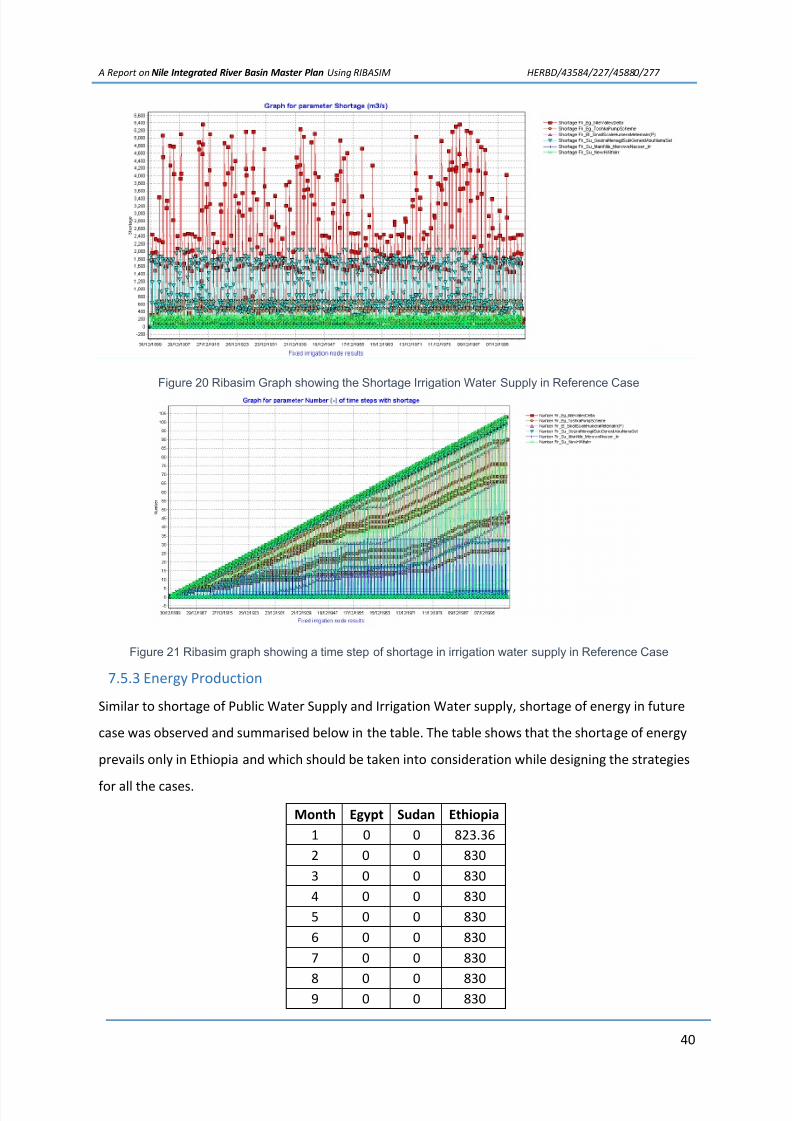
Figure 20 Ribasim Graph showing the Shortage Irrigation Water Supply in Reference Case
Figure 21 Ribasim graph showing a time step of shortage in irrigation water supply in Reference Case
7.5.3 Energy Production
Similar to shortage of Public Water Supply and Irrigation Water supply, shortage of energy in future
case was observed and summarised below in the table. The table shows that the shortage of energy
prevails only in Ethiopia and which should be taken into consideration while designing the strategies
for all the cases.
Month Egypt Sudan Ethiopia
1 0 0 823.36
2 0 0 830
3 0 0 830
4 0 0 830
5 0 0 830
6 0 0 830
7 0 0 830
8 0 0 8309 0 0 830

7/21/2019 A Report on RIBASIM-Submitted Final
http://slidepdf.com/reader/full/a-report-on-ribasim-submitted-final 41/72
A Report on Nile Integrated River Basin Master Plan Using RIBASIM HERBD/43584/227/45880/277
41
Month Egypt Sudan Ethiopia
10 0 0 830
11 0 0 830
12 0 0 830
Total 0 0 829.33
Table 44 Shortage in Energy in Reference Case
The graph showing the result is as follows which basically the same with base case.
Table 45 Shortage of Energy in Reference Case
7.6 Comparison of Base case and Reference Case
To know how the system will behave and what will be the change in scenario of water demand, a
comparative study of base case and reference case was used. This will also help in defining and
focusing our priority towards the projects and its measures.
7.6.1 Public Water Supply
In the table below, the highlighted values shows the changes in the situation, which clarifies that
actually the shortage of water will occur in both Ethiopia and Egypt and Sudan will remain
unaffected. The situation will be worst in Egypt comparing to Ethiopia.
Month
Ethiopia Sudan and South Sudan Egypt
2005 2030 2005 2030 2005 2030
Jan 0.00 0 008 0.00 0.000 0.00 0 668
Feb 0.01 0 247 0.00 0.000 0.00 1 239
Mar 0.00 0 503 0.00 0.000 0.00 1 751
April 0.00 0 408 0.00 0.000 0.00 2 735
May 0.00 0 456 0.00 0.000 0.00 3 048
Jun 0.31 1 371 0.00 0.000 0.00 2 002
Jul 0.00 0.000 0.00 0.000 0.00 0 876
Aug 0.00 0.000 0.00 0.000 0.00 0.000
0
100
200
300400
500
600
700
800
900
Jan Feb Mar Apr May Jun Jul Aug Sep Oct Nov Dec
P o w e r ( G W h )
Month
Shortage in Energy
Sudan Egypt Ethiopia

7/21/2019 A Report on RIBASIM-Submitted Final
http://slidepdf.com/reader/full/a-report-on-ribasim-submitted-final 42/72
A Report on Nile Integrated River Basin Master Plan Using RIBASIM HERBD/43584/227/45880/277
42
Month
Ethiopia Sudan and South Sudan Egypt
2005 2030 2005 2030 2005 2030
Sep 0.00 0.000 0.00 0.000 0.00 0.000
Oct 0.00 0.000 0.00 0.000 0.00 0.000
Nov 0.00 0.000 0.00 0.000 0.00 0.000
Dec 0.00 0.000 0.00 0.000 0.00 0.000
Table 46 Comparative study of Shortage situation Public Water Supply
Table 47 Comparative Study of Shortage Situation of Public Water Supply
7.6.2 Irrigation Demand
The table below shows a change in situation of water shortages in future based on base case. The
highlighted values mean the situation is getting worst and needs some attention. From table we can
conclude that the situation is getting worst for both Sudan and Egypt.
MonthEthiopia Sudan and South Sudan Egypt
2005 2030 2005 2030 2005 2030
Jan 0.00 0.000 21.96 738.768 7.12 250.950
Feb 0.00 0.000 432.64 1600.709 5.32 143.371
Mar 0.00 0.046 1191.44 1895.474 7.97 228.309
April 0.00 0.036 904.42 1713.218 41.09 910.458May 0.00 0.000 365.71 659.900 379.94 2714.281
Jun 0.00 0.090 108.21 551.753 935.95 4413.434
Jul 0.00 0.000 0.00 1.266 666.56 3805.539
Aug 0.00 0.000 0.00 0.000 178.68 943.265
Sep 0.00 0.000 0.00 0.001 24.39 270.615
Oct 0.00 0.000 0.00 0.000 6.99 188.833
Nov 0.00 0.000 0.00 5.327 4.35 119.979
Dec 0.00 0.000 8.51 216.995 6.87 183.494
Table 48 Comparison of Shortage SituationThe graph of the table shows it even better to illustrate the situation.
0
1
1
2
2
3
3
4
J A N F E B M A R A P R I L M A Y J U N J U L A U G S E P O C T N O V D E C
D I S C H A R G E ( M 3 / S )
MONTH
SHORTAGE COMPARISION CHARTEthiopia 2005 Ethiopia 2030 Sudan 2005
Sudan 2030 Egypt 2005 Egypt 2030
7/21/2019 A Report on RIBASIM-Submitted Final
http://slidepdf.com/reader/full/a-report-on-ribasim-submitted-final 43/72
A Report on Nile Integrated River Basin Master Plan Using RIBASIM HERBD/43584/227/45880/277
43
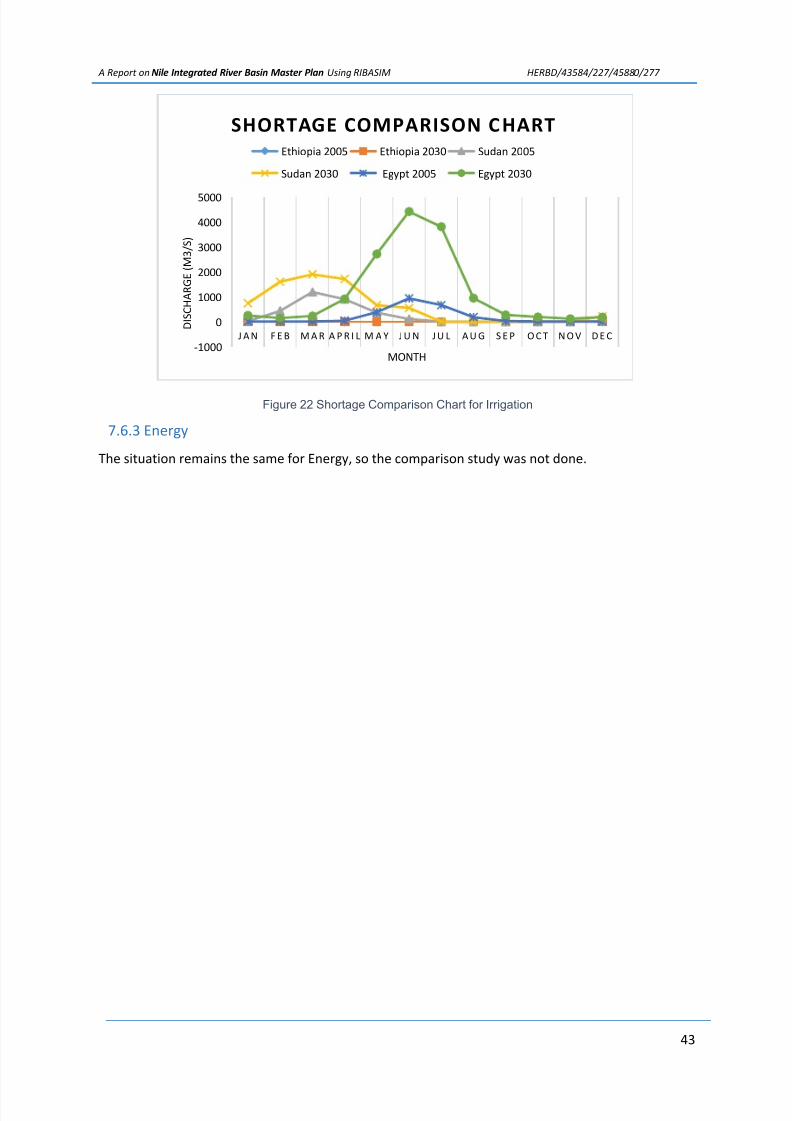
Figure 22 Shortage Comparison Chart for Irrigation
7.6.3 Energy
The situation remains the same for Energy, so the comparison study was not done.
-1000
0
1000
2000
3000
4000
5000
J A N F E B M A R A P R I L M A Y J U N J U L A U G S E P O C T N O V D E C D I S C H A R G E ( M 3 / S )
MONTH
SHORTAGE COMPARISON CHARTEthiopia 2005 Ethiopia 2030 Sudan 2005
Sudan 2030 Egypt 2005 Egypt 2030

7/21/2019 A Report on RIBASIM-Submitted Final
http://slidepdf.com/reader/full/a-report-on-ribasim-submitted-final 44/72
A Report on Nile Integrated River Basin Master Plan Using RIBASIM HERBD/43584/227/45880/277
44
8. Scenario Conditions
Three strategic scenarios are proposed in this section depending on enhancing the irrigation
efficiency, reducing the population growth and the optimum usage of the potential reservoirs
(Karadobi & Merowe). These scenarios are presented as follows:
Scenario 1: scenario 1 aims of:
1. Reducing/controlling the population growth by 10 %.
2. Finding better solutions to reduce the evaporation loss.
3. Operating both of the two potential reservoirs together.
Scenario 2: scenario 2 aims of:
1. Reducing/controlling the population growth by 10 %.
2. Operating both of the two potential reservoirs together.
3. Enhancing the irrigation efficiency in the three countries to achieve
better agriculture as follows:
- Crop pattern: changing the crop time as per FAO, also taking into
consideration that the crops which require more water are planted
on wet seasons and those which require less water on dry season- Planting time: trying to find the best plant time during the year
which decreases the water consumption.
- The present and future irrigation efficiency is predicted to be:
Egypt Sudan Ethiopia
Current Efficiency % 70 45 45
Future Efficiency % 80 7070
Scenario 3: scenario 3 aims of applying all the above mentioned solutions.
1. Reducing/controlling the population growth by 10 %.
2. Finding better solutions to reduce the evaporation loss.
3. Operating both of the two potential reservoirs together.
4. Enhancing the irrigation efficiency in the three countries to achieve better
agriculture as follows:

7/21/2019 A Report on RIBASIM-Submitted Final
http://slidepdf.com/reader/full/a-report-on-ribasim-submitted-final 45/72
A Report on Nile Integrated River Basin Master Plan Using RIBASIM HERBD/43584/227/45880/277
45
- Crop pattern: changing the crop time as per FAO, also taking into
consideration that the crops which require more water are planted
on wet seasons and those which require less water on dry season
- The present and future irrigation efficiency is predicted to be:Egypt Sudan Ethiopia
Current Efficiency % 70 45 45
Future Efficiency % 80 70 70
8.1 Proposed Objective
The objectives of the above mentioned strategic scenarios are demanding a better living
standard for the three countries Egypt, Sudan and Ethiopia as follows:
1. Mainly to provide sufficient amount of food that covers the three countries
needs/requirements.
2. More cooperation between the three countries by using the Egyptian
knowledge/experience in agriculture, using the water controlled by the Ethiopians to
cultivate more land area in the Sudan (which has the best fertile land suitable for
agriculture).
3. Enhancing the irrigation efficiency in the three countries to achieve better agriculture
by changing the crop patterns by finding another alternative of the crops which needs
a lot of water such as rice and sugar cane. Also by trying to find the best plant time
during the year which decreases the water consumption.

7/21/2019 A Report on RIBASIM-Submitted Final
http://slidepdf.com/reader/full/a-report-on-ribasim-submitted-final 46/72
A Report on Nile Integrated River Basin Master Plan Using RIBASIM HERBD/43584/227/45880/277
46
9. Formulations of possible measures for the future horizon (2030)
Infrastructure Measures
1. Construct more storm water networks and involve it after treatment in irrigation
2. Maintenance of the existing networks to prevent water leakage (water loss)3. Build more WTP and use its water for irrigation purposes
4. Modern irrigation systems should be used instead of using the surface irrigation, we can use
dripping ( sprinklers) irrigation
Soft measures
1. Optimum usage of water by reuse the irrigation water once and twice if it is still reusable.
2. Reuse of treated brackish water after treatment in WTP
3. Applying soft engineering instead of building dams and harming the environment
Policy measures
1. Optimum application of International agreements and policies
2. More cooperation and system understanding (locally) between the boarder countries.
3. More negotiation processes should be carried on between countries with the involve of
international organizations
4. Two child policy for controlling the population Control
5. Applying IWRM principals to achieve the optimum usage of water and ecosystem services

7/21/2019 A Report on RIBASIM-Submitted Final
http://slidepdf.com/reader/full/a-report-on-ribasim-submitted-final 47/72
A Report on Nile Integrated River Basin Master Plan Using RIBASIM HERBD/43584/227/45880/277
47
10. Design and analysis of alternative strategies
For the different alternatives, the population was supposed to be decreased by 10% to the assumed
data in the reference case which would result in less demand of public water supply and also food
demand. The following table shows the data assumed for estimating the populations and waterdemand for Public water supply. The table also shows the comparison with the reference case.
Country EthiopiaSudan and South
SudanEgypt
CasesNew
AssumedReference
New
AssumedReference
New
AssumedReference
Population (Million) 43.20 48.00 40.32 44.80 96.30 107.00
Water Need (l/cap/day) 25.00 25.00 25.00 25.00 56.00 56.00
Population Water
Demand (MCM/year)394.20 438.00 367.92 408.80 1968.37 2187.08
Livestock (Million TLU) 13.10 13.10 41.00 41.00 90.00 90.00
Water Need (l/cap/day) 20.00 20.00 20.00 20.00 20.00 20.00
Livestock Water
Demand (MCM/year)95.63 95.63 299.30 299.30 657.00 657.00
Total Water Demand
PWS (MCM/year)489.83 533.63 667.22 2625.37
Total Water Demand
PWS (m3/s)15.53 16.92 21.16 22.45 83.25 90.19
Table 49 Assumed population and Public water supply
The cropping time was changed so as to prepare the land on when the water supply is less as it
demands less water and use the water to the full capacity when it is available. The table for net
irrigation demand looks like this
MonthEg_NileValley
DeltaSu_Gezira
MeroweNasser -
alternative
NewHalfa -
alternative
Toshka
Delta
January 1.73 5.46 5.35 4.85 2.59
February 2.81 4.83 4.89 4.12 4.39
March 4.29 1.88 1.89 1.84 6.81
April 5.87 4.14 4.81 3.89 8.85
May 5.32 5.74 7.07 5.05 7.82June 0.28 8.08 10.66 7.58 2.02
July 3.59 5.84 9.62 4.77 5.47
August 4.61 0.32 2.63 0.25 7.47
September 6.27 0.40 2.13 0.68 10.37
October 4.89 4.29 5.95 3.96 7.89
November 0.97 5.53 5.74 4.56 1.55
December 0.05 5.39 5.12 4.65 1.61
Table 50 Net Irrigation Demand after change in cropping time
Similarly, the table below shows the reservoir operation rules that was created for different projects.

7/21/2019 A Report on RIBASIM-Submitted Final
http://slidepdf.com/reader/full/a-report-on-ribasim-submitted-final 48/72
A Report on Nile Integrated River Basin Master Plan Using RIBASIM HERBD/43584/227/45880/277
48
Karadobi Roseires Khasmel Girba
MonthRef
Case
New
Target
Level (m.)
Ref
Case
New
Target
Level
(m.)
Ref
Case
New
Target
Level (m.)
January 1146 1146 480 480 473 473February 1146 1143 480 479 473 473
March 1146 1140 480 477 473 472
April 1146 1137 480 475 473 471
May 1146 1135 480 473 473 471
June 1146 1130 480 472 473 470
July 1146 1125 480 471 473 470
August 1146 1130 480 470 473 470
September 1146 1135 480 480 473 471
October 1146 1146 480 480 473 473
November 1146 1146 480 480 473 473
December 1146 1146 480 480 473 473
Table 51 Reservoir operation Rules adopted fir alternative strategies
Using the above table the strategies that were defined were applied to get the results which is
discussed below according to the respective strategies.
10.1 Strategy 1
Using this strategy is the cost effective measure as this only considers the reservoir operation and
promoting the population strategy. The following results were obtained in this strategy
10.1.1 Public Water Supply
As the population was assumed to be less compared to the reference case, it was assumed that only
regulation of reservoir would solve the problem but the table below shows a conflicting result i.e. it
actually helped to reduce the peak shortage in 4 months but it shifted to june and july which is
highlighted in the table below.
Month
Ethiopia Sudan Egypt
Refcase S1 Ref case S1 Ref case S1
Jan 0.01 0.01 0.0 0.00 0.67 0.00
Feb 0.25 0.25 0.0 0.00 1.24 0.88
Mar 0.50 0.50 0.0 0.00 1.75 1.75
April 0.41 0.41 0.0 0.00 2.74 2.63
May 0.46 0.46 0.0 0.00 3.05 2.63
Jun 1.37 1.37 0.0 0.00 2.00 3.45
Jul 0.00 0.00 0.0 0.00 0.88 2.17
Aug 0.00 0.00 0.0 0.00 0.00 0.00
Sep 0.00 0.00 0.0 0.00 0.00 0.00Oct 0.00 0.00 0.0 0.00 0.00 0.00
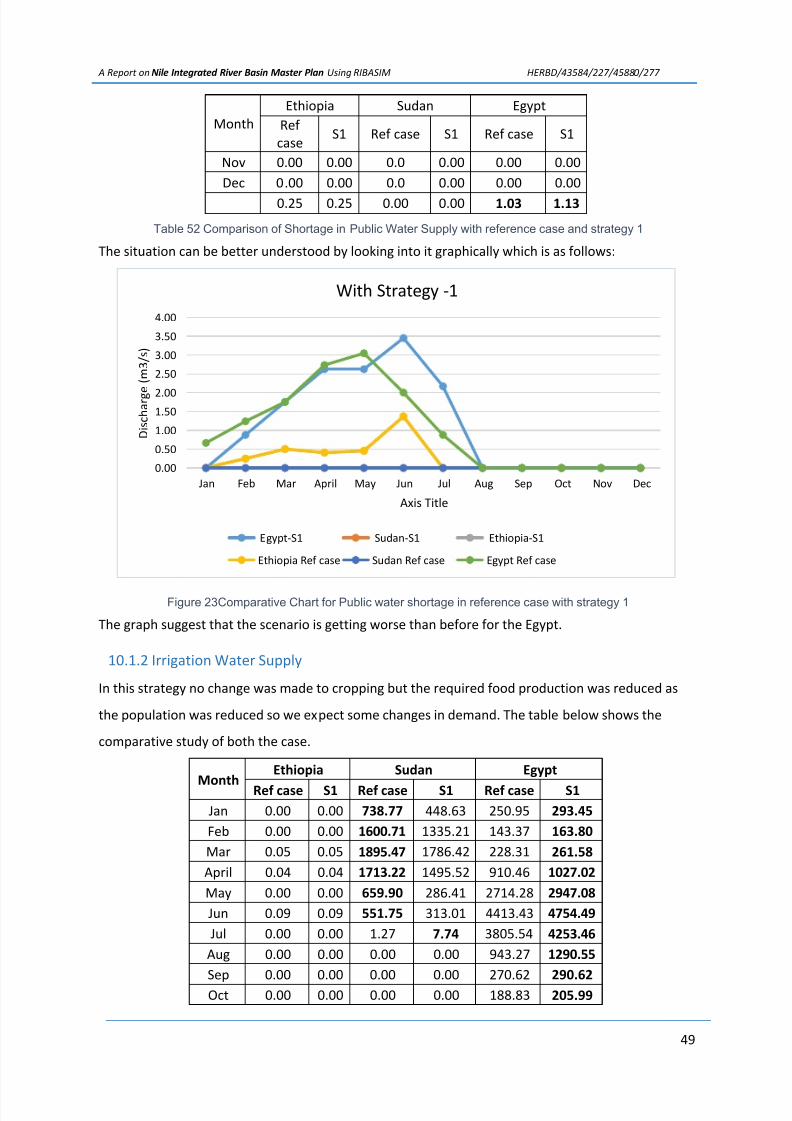
7/21/2019 A Report on RIBASIM-Submitted Final
http://slidepdf.com/reader/full/a-report-on-ribasim-submitted-final 49/72
A Report on Nile Integrated River Basin Master Plan Using RIBASIM HERBD/43584/227/45880/277
49
Month
Ethiopia Sudan Egypt
Ref
caseS1 Ref case S1 Ref case S1
Nov 0.00 0.00 0.0 0.00 0.00 0.00
Dec 0.00 0.00 0.0 0.00 0.00 0.00
0.25 0.25 0.00 0.00 1.03 1.13
Table 52 Comparison of Shortage in Public Water Supply with reference case and strategy 1
The situation can be better understood by looking into it graphically which is as follows:
Figure 23Comparative Chart for Public water shortage in reference case with strategy 1
The graph suggest that the scenario is getting worse than before for the Egypt.
10.1.2 Irrigation Water Supply
In this strategy no change was made to cropping but the required food production was reduced as
the population was reduced so we expect some changes in demand. The table below shows the
comparative study of both the case.
Month
Ethiopia Sudan Egypt
Ref case S1 Ref case S1 Ref case S1
Jan 0.00 0.00 738.77 448.63 250.95 293.45
Feb 0.00 0.00 1600.71 1335.21 143.37 163.80
Mar 0.05 0.05 1895.47 1786.42 228.31 261.58
April 0.04 0.04 1713.22 1495.52 910.46 1027.02
May 0.00 0.00 659.90 286.41 2714.28 2947.08
Jun 0.09 0.09 551.75 313.01 4413.43 4754.49
Jul 0.00 0.00 1.27 7.74 3805.54 4253.46
Aug 0.00 0.00 0.00 0.00 943.27 1290.55
Sep 0.00 0.00 0.00 0.00 270.62 290.62
Oct 0.00 0.00 0.00 0.00 188.83 205.99
0.00
0.50
1.00
1.50
2.00
2.50
3.00
3.50
4.00
Jan Feb Mar April May Jun Jul Aug Sep Oct Nov Dec
D i s c h a r g e ( m 3 / s )
Axis Title
With Strategy -1
Egypt-S1 Sudan-S1 Ethiopia-S1
Ethiopia Ref case Sudan Ref case Egypt Ref case

7/21/2019 A Report on RIBASIM-Submitted Final
http://slidepdf.com/reader/full/a-report-on-ribasim-submitted-final 50/72
A Report on Nile Integrated River Basin Master Plan Using RIBASIM HERBD/43584/227/45880/277
50
MonthEthiopia Sudan Egypt
Ref case S1 Ref case S1 Ref case S1
Nov 0.00 0.00 5.33 0.00 119.98 163.10
Dec 0.00 0.00 217.00 119.63 183.49 233.53
Total 0.01 0.01 615.28 482.71 1181.04 1323.72
Table 53 Comparative Study of Irrigation Water Shortage in Reference case and Strategy 1
The table suggests it actually helps sudan to reduce the shortage but increases the shortages in
Egypt which can be better illustrated in graph which is as belows.
Figure 24Comparative Study of Irrigation Water Supply in Reference case and Strategy1
10.1.3 Energy
Similarly for Energy the table was obtained as follows;
MonthSudan Egypt Ethiopia
Ref case S1 Ref case S1 Ref case S1
Jan 0 0 0 0 823.36 53.30
Feb 0 0 0 0 830 72.53
Mar 0 0 0 0 830 84.63
April 0 0 0 0 830 80.82
May 0 0 0 0 830 42.61
Jun 0 0 0 0 830 44.43
Jul 0 0 0 0 830 53.54
Aug 0 0 0 0 830 43.26
Sep 0 0 0 0 830 41.31
Oct 0 0 0 0 830 42.59
Nov 0 0 0 0 830 43.75
Dec 0 0 0 0 830 42.36
Total 0.00 0.00 0.00 0.00 829.45 53.76
Table 54Comparative Study of Irrigation Energy Shortage in Reference case and Strategy 1
-1000.00
0.00
1000.00
2000.00
3000.00
4000.00
5000.00
Jan Feb Mar April May Jun Jul Aug Sep Oct Nov Dec
D i s c h a r g e ( m 3 / s )
Axis Title
Irrigation With Strategy -1
Egypt-S1 Sudan-S1 Ethiopia-S1
Ethiopia Ref case Sudan Ref case Egypt Ref case
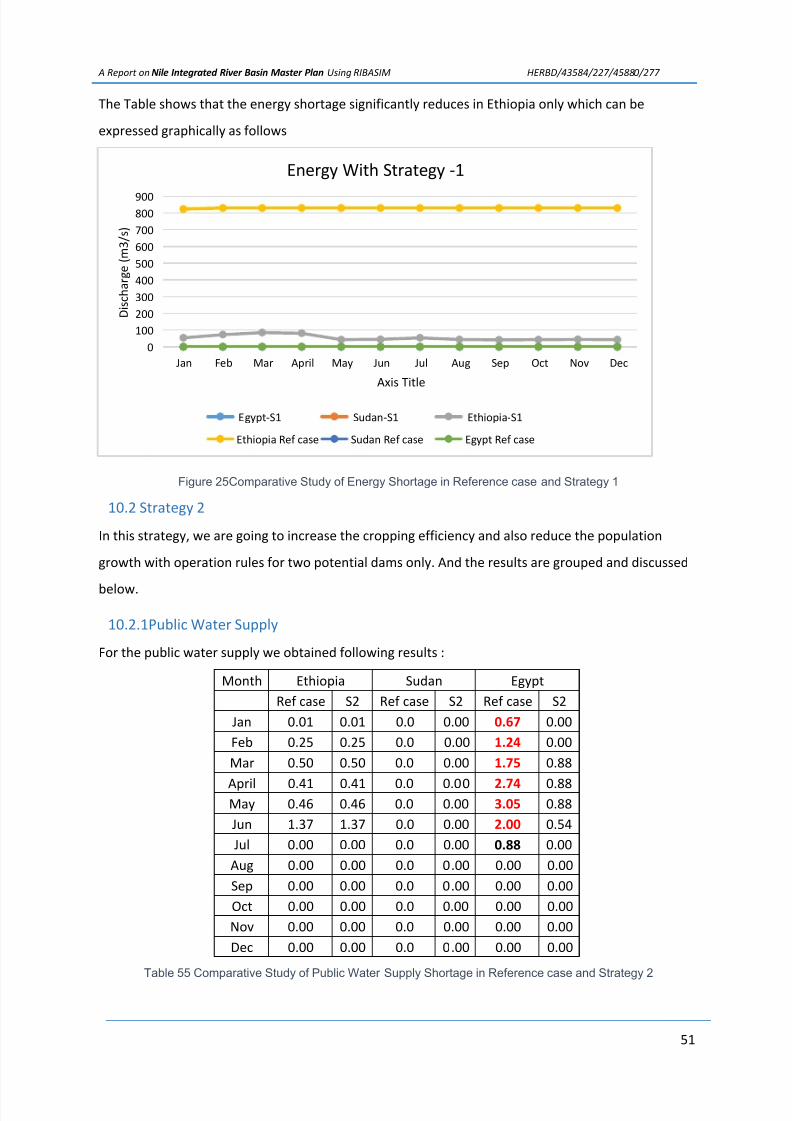
7/21/2019 A Report on RIBASIM-Submitted Final
http://slidepdf.com/reader/full/a-report-on-ribasim-submitted-final 51/72
A Report on Nile Integrated River Basin Master Plan Using RIBASIM HERBD/43584/227/45880/277
51
The Table shows that the energy shortage significantly reduces in Ethiopia only which can be
expressed graphically as follows
Figure 25Comparative Study of Energy Shortage in Reference case and Strategy 1
10.2 Strategy 2
In this strategy, we are going to increase the cropping efficiency and also reduce the population
growth with operation rules for two potential dams only. And the results are grouped and discussed
below.
10.2.1Public Water Supply
For the public water supply we obtained following results :
Month Ethiopia Sudan Egypt
Ref case S2 Ref case S2 Ref case S2
Jan 0.01 0.01 0.0 0.00 0.67 0.00
Feb 0.25 0.25 0.0 0.00 1.24 0.00
Mar 0.50 0.50 0.0 0.00 1.75 0.88
April 0.41 0.41 0.0 0.00 2.74 0.88May 0.46 0.46 0.0 0.00 3.05 0.88
Jun 1.37 1.37 0.0 0.00 2.00 0.54
Jul 0.00 0.00 0.0 0.00 0.88 0.00
Aug 0.00 0.00 0.0 0.00 0.00 0.00
Sep 0.00 0.00 0.0 0.00 0.00 0.00
Oct 0.00 0.00 0.0 0.00 0.00 0.00
Nov 0.00 0.00 0.0 0.00 0.00 0.00
Dec 0.00 0.00 0.0 0.00 0.00 0.00
Table 55 Comparative Study of Public Water Supply Shortage in Reference case and Strategy 2
0
100
200
300
400
500
600
700
800900
Jan Feb Mar April May Jun Jul Aug Sep Oct Nov Dec
D i s c h a r g e ( m 3 / s )
Axis Title
Energy With Strategy -1
Egypt-S1 Sudan-S1 Ethiopia-S1
Ethiopia Ref case Sudan Ref case Egypt Ref case

7/21/2019 A Report on RIBASIM-Submitted Final
http://slidepdf.com/reader/full/a-report-on-ribasim-submitted-final 52/72
A Report on Nile Integrated River Basin Master Plan Using RIBASIM HERBD/43584/227/45880/277
52
This strategy was able to reduce the shortage to some extent but is still not able to eradicate the
problem which can be better explained by using a graph.
Figure 26 Comparative Study of Public Water Supply Shortage in Reference case and Strategy 2
10.2.2 Irrigation Water Supply
As we saw a reduction in shortage in public water supply with this strategy, if this works for reducing
or eliminating shortage in irrigation we could come to a conclusion. That’s why the result was tabled
as follows:
Month Ethiopia Sudan Egypt
Ref case S2 Ref case S2 Ref case S2
Jan 0.00 0.00 738.77 38.32 250.95 101.67
Feb 0.00 0.00 1600.71 249.48 143.37 68.07
Mar 0.05 0.05 1895.47 755.42 228.31 121.54
April 0.04 0.04 1713.22 777.68 910.46 505.38
May 0.00 0.00 659.90 88.03 2714.28 1601.12
Jun 0.09 0.09 551.75 122.55 4413.43 2698.20
Jul 0.00 0.00 1.27 3.52 3805.54 2534.36Aug 0.00 0.00 0.00 0.00 943.27 793.43
Sep 0.00 0.00 0.00 0.00 270.62 137.11
Oct 0.00 0.00 0.00 0.00 188.83 72.26
Nov 0.00 0.00 5.33 0.00 119.98 61.58
Dec 0.00 0.00 217.00 0.45 183.49 71.46
Table 56 Comparative Study of Irrigation Water Supply Shortage in Reference case and Strategy 2
The table suggests that actually the strategy is helping to reduce the peak demands in both sudan
and Egypt which is shown in the chart below.
0.00
0.50
1.00
1.50
2.00
2.50
3.00
3.50
Jan Feb Mar April May Jun Jul Aug Sep Oct Nov Dec
D i s c h a r g e ( m 3 / s )
Axis Title
With Strategy -2
Egypt-S2 Sudan-S2 Ethiopia-S2
Ethiopia Ref case Sudan Ref case Egypt Ref case

7/21/2019 A Report on RIBASIM-Submitted Final
http://slidepdf.com/reader/full/a-report-on-ribasim-submitted-final 53/72
A Report on Nile Integrated River Basin Master Plan Using RIBASIM HERBD/43584/227/45880/277
53
Figure 27 Comparative Study of Irrigation Water Supply Shortage in Reference Case and Strategy 2
10.2.3 Energy
As per Energy, all the conditions remained same with strategy only the table is shown below.
MonthSudan Egypt Ethiopia
Ref case S1 Ref case S1 Ref case S1
Jan 0 0 0 0 823.36 53.30Feb 0 0 0 0 830 72.53
Mar 0 0 0 0 830 84.63
April 0 0 0 0 830 80.82
May 0 0 0 0 830 42.61
Jun 0 0 0 0 830 44.43
Jul 0 0 0 0 830 53.54
Aug 0 0 0 0 830 43.26
Sep 0 0 0 0 830 41.31
Oct 0 0 0 0 830 42.59
Nov 0 0 0 0 830 43.75
Dec 0 0 0 0 830 42.36
Total 0.00 0.00 0.00 0.00 829.45 53.76
Table 57 Comparative Study of Energy Shortage in Reference Case and Strategy 2
10.3.1 Public Water Supply
In this strategy, we are considering that we increase efficiency, change the operation rules of all the
reservoirs and control the population growth. We are hoping to find a better result in this strategy, a
comparative study result is shown below.
-1000.00
0.00
1000.00
2000.00
3000.00
4000.00
5000.00
Jan Feb Mar April May Jun Jul Aug Sep Oct Nov Dec
D i s c h a r g e ( m 3 / s )
Axis Title
Irrigation With Strategy -2
Egypt-S2 Sudan and South Sudan Sudan-S2
Ethiopia Ethiopia-S2 Ethiopia Ref case
Sudan Ref case Egypt Ref case

7/21/2019 A Report on RIBASIM-Submitted Final
http://slidepdf.com/reader/full/a-report-on-ribasim-submitted-final 54/72
A Report on Nile Integrated River Basin Master Plan Using RIBASIM HERBD/43584/227/45880/277
54
Month Ethiopia Sudan Egypt
Ref case S3 Ref case S3 Ref case S3
Jan 0.01 0.01 0.00 0.00 0.67 0.00
Feb 0.25 0.25 0.00 0.00 1.24 0.00
Mar 0.50 0.50 0.00 0.00 1.75 0.00
April 0.41 0.41 0.00 0.00 2.74 0.88
May 0.46 0.46 0.00 0.00 3.05 1.33
Jun 1.37 1.37 0.00 0.00 2.00 1.43
Jul 0.00 0.00 0.00 0.00 0.88 0.00
Aug 0.00 0.00 0.00 0.00 0.00 0.00
Sep 0.00 0.00 0.00 0.00 0.00 0.00
Oct 0.00 0.00 0.00 0.00 0.00 0.00
Nov 0.00 0.00 0.00 0.00 0.00 0.00
Dec 0.00 0.00 0.00 0.00 0.00 2.07
Total 0.25 0.25 0.00 0.00 1.03 0.48
Table 58 Comparative Study of Public Water Supply Shortage in Reference case and Strategy 3
As expected the peak shortage was significantly reduced but it also created a new shortage in
December which is better described by the graph below.
Figure 28 Comparative Study of Public Water Supply Shortage in Reference case and Strategy 3
10.3.2 Irrigation Water Supply
As new and modern technology with change in cropping pattern and reservoir regulations we are
hoping to better results. The table below shows a comparative study:
0.00
0.50
1.00
1.50
2.00
2.50
3.00
3.50
Jan Feb Mar April May Jun Jul Aug Sep Oct Nov Dec
D i s c h a r g e ( m 3 / s )
Axis Title
With Strategy -3
S3
S3
S3
Ref case
Ref case
Ref case
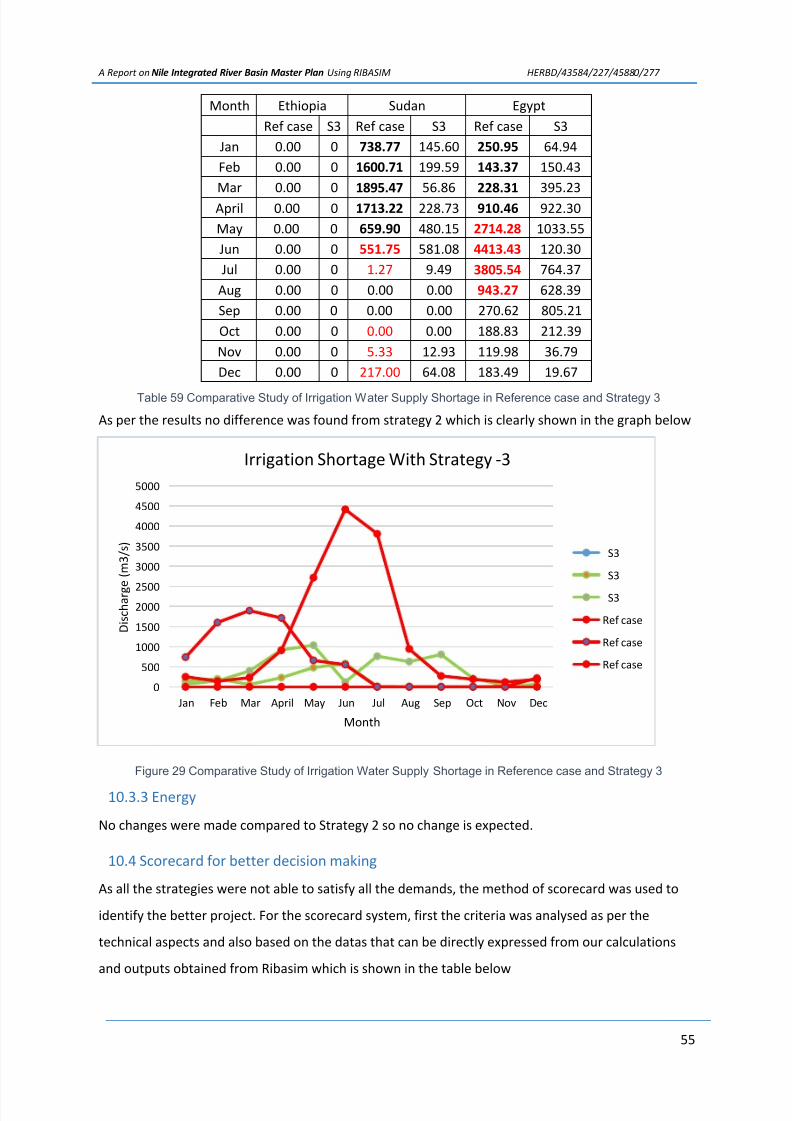
7/21/2019 A Report on RIBASIM-Submitted Final
http://slidepdf.com/reader/full/a-report-on-ribasim-submitted-final 55/72
A Report on Nile Integrated River Basin Master Plan Using RIBASIM HERBD/43584/227/45880/277
55
Month Ethiopia Sudan Egypt
Ref case S3 Ref case S3 Ref case S3
Jan 0.00 0 738.77 145.60 250.95 64.94
Feb 0.00 0 1600.71 199.59 143.37 150.43
Mar 0.00 0 1895.47 56.86 228.31 395.23
April 0.00 0 1713.22 228.73 910.46 922.30
May 0.00 0 659.90 480.15 2714.28 1033.55
Jun 0.00 0 551.75 581.08 4413.43 120.30
Jul 0.00 0 1.27 9.49 3805.54 764.37
Aug 0.00 0 0.00 0.00 943.27 628.39
Sep 0.00 0 0.00 0.00 270.62 805.21
Oct 0.00 0 0.00 0.00 188.83 212.39
Nov 0.00 0 5.33 12.93 119.98 36.79
Dec 0.00 0 217.00 64.08 183.49 19.67
Table 59 Comparative Study of Irrigation Water Supply Shortage in Reference case and Strategy 3
As per the results no difference was found from strategy 2 which is clearly shown in the graph below
Figure 29 Comparative Study of Irrigation Water Supply Shortage in Reference case and Strategy 3
10.3.3 Energy
No changes were made compared to Strategy 2 so no change is expected.
10.4 Scorecard for better decision making
As all the strategies were not able to satisfy all the demands, the method of scorecard was used to
identify the better project. For the scorecard system, first the criteria was analysed as per the
technical aspects and also based on the datas that can be directly expressed from our calculations
and outputs obtained from Ribasim which is shown in the table below
0
500
1000
1500
20002500
3000
3500
4000
4500
5000
Jan Feb Mar April May Jun Jul Aug Sep Oct Nov Dec
D i s c h a r g e ( m 3 / s )
Month
Irrigation Shortage With Strategy -3
S3
S3
S3
Ref case
Ref case
Ref case
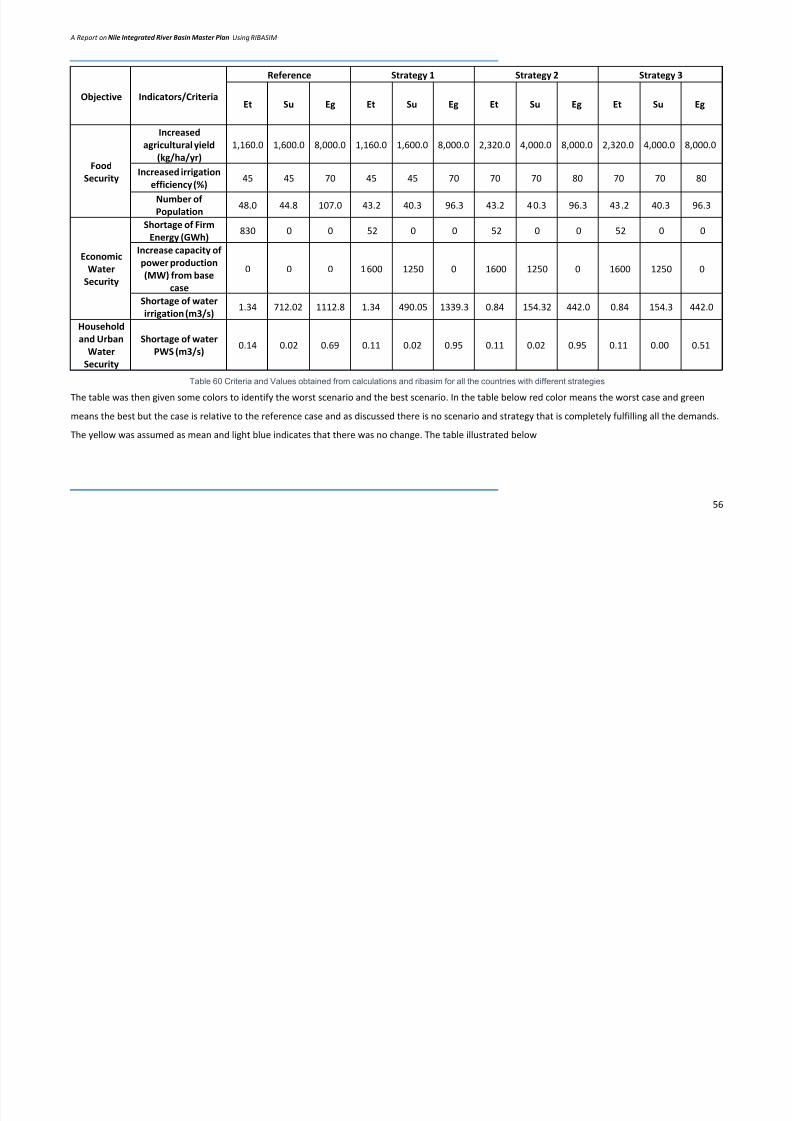
7/21/2019 A Report on RIBASIM-Submitted Final
http://slidepdf.com/reader/full/a-report-on-ribasim-submitted-final 56/72
A Report on Nile Integrated River Basin Master Plan Using RIBASIM
56
Objective Indicators/Criteria
Reference Strategy 1 Strategy 2 Strategy 3
Et Su Eg Et Su Eg Et Su Eg Et Su Eg
Food
Security
Increased
agricultural yield
(kg/ha/yr)
1,160.0 1,600.0 8,000.0 1,160.0 1,600.0 8,000.0 2,320.0 4,000.0 8,000.0 2,320.0 4,000.0 8,000.0
Increased irrigation
efficiency (%)45 45 70 45 45 70 70 70 80 70 70 80
Number ofPopulation
48.0 44.8 107.0 43.2 40.3 96.3 43.2 40.3 96.3 43.2 40.3 96.3
Economic
Water
Security
Shortage of Firm
Energy (GWh)830 0 0 52 0 0 52 0 0 52 0 0
Increase capacity of
power production
(MW) from base
case
0 0 0 1600 1250 0 1600 1250 0 1600 1250 0
Shortage of water
irrigation (m3/s)1.34 712.02 1112.8 1.34 490.05 1339.3 0.84 154.32 442.0 0.84 154.3 442.0
Household
and Urban
Water
Security
Shortage of water
PWS (m3/s)0.14 0.02 0.69 0.11 0.02 0.95 0.11 0.02 0.95 0.11 0.00 0.51
Table 60 Criteria and Values obtained from calculations and ribasim for all the countries with different strategies
The table was then given some colors to identify the worst scenario and the best scenario. In the table below red color means the worst case and green
means the best but the case is relative to the reference case and as discussed there is no scenario and strategy that is completely fulfilling all the demands.
The yellow was assumed as mean and light blue indicates that there was no change. The table illustrated below

7/21/2019 A Report on RIBASIM-Submitted Final
http://slidepdf.com/reader/full/a-report-on-ribasim-submitted-final 57/72
A Report on Nile Integrated River Basin Master Plan Using RIBASIM HERBD/43584/227/45880/277
57
ObjectiveIndicators/Criter
ia
Reference Strategy 1 Strategy 2 Strategy 3
Et Su Eg Et Su Eg Et Su Eg Et Su Eg
Food
Security
Increased
agricultural
yield (kg/ha/yr)
1,160.0
0
1,600.0
0
8,000.0
0
1,160.0
0
1,600.0
0
8,000.0
0
2,320.0
0
4,000.0
0
8,000.0
0
2,320.0
0
4,000.0
0
8,000.0
0
Increased
irrigation
efficiency (%)
45 45 70 45 45 70 70 70 80 70 70 80
Number of
Population48.0 44.8 107.0 43.2 40.3 96.3 43.2 40.3 96.3 43.2 40.3 96.3
Economic
Water
Security
Shortage of Firm
Energy (GWh)830 0 0 52 0 0 52 0 0 52 0 0
Increase
capacity of
power
production
(MW) from base
case
0 0 0 1600 1250 0 1600 1250 0 1600 1250 0
Shortage of
water irrigation
(m3/s)
1.34 712.021112.8
41.34 490.05
1339.3
80.84 154.32 442.06 0.84 154.32 442.06
Househol
d andUrban
Water
Security
Shortage ofwater PWS
(m3/s)
0.14 0.02 0.69 0.11 0.02 0.95 0.11 0.02 0.95 0.11 0.00 0.51
Table 61 Coloured Representation of Score card
The score card was then standardised which is as follows:

7/21/2019 A Report on RIBASIM-Submitted Final
http://slidepdf.com/reader/full/a-report-on-ribasim-submitted-final 58/72
A Report on Nile Integrated River Basin Master Plan Using RIBASIM HERBD/43584/227/45880/277
58
Objective Indicators/CriteriaReference Strategy 1 Strategy 2 Strategy 3
Et Su Eg Et Su Eg Et Su Eg Et Su Eg
Food Security
Increased agricultural yield
(kg/ha/yr)0.50 0.40 0.00 0.50 0.40 0.00 1.00 1.00 0.00 1.00 1.00 0.00
Increased irrigation efficiency (%) 0.64 0.64 0.88 0.64 0.64 0.88 1.00 1.00 1.00 1.00 1.00 1.00
Number of Population 0.90 0.90 0.90 1.00 1.00 1.00 1.00 1.00 1.00 1.00 1.00 1.00
Total 0.68 0.65 0.59 0.71 0.68 0.63 1.00 1.00 0.67 1.00 1.00 0.67
Economic WaterSecurity
Shortage of Firm Energy (GWh) 0.06 0.00 0.00 1.00 0.00 0.00 1.00 0.00 0.00 1.00 0.00 0.00
Increase capacity of power
production (MW) from base case 0.00 0.00 0.00 1.00 1.00 0.00 1.00 1.00 0.00 1.00 1.00 0.00
Shortage of water irrigation
(m3/s)0.63 0.09 0.40 0.63 0.06 0.33 1.00 1.00 1.00 1.00 1.00 1.00
Total 0.23 0.03 0.13 0.88 0.35 0.11 1.00 0.67 0.33 1.00 0.67 0.33
Household and
Urban Water
Security
Shortage of water PWS (m3/s) 0.80 0.95 0.74 0.11 0.95 0.54 1.00 0.95 0.54 1.00 1.00 1.00
Table 62 Score Card showing the preference level of each objectives with strategies
In the above table, 1 means it is the best we could achieve within the three strategies in each country but it does not resemble that it was able to
completely eradicate the problem and 0 means it was not able to change anything from the reference case i.e. the worst case.
The radial plot of these were also made to graphically visualise all three strategies with reference to the countries based on the table shown above.
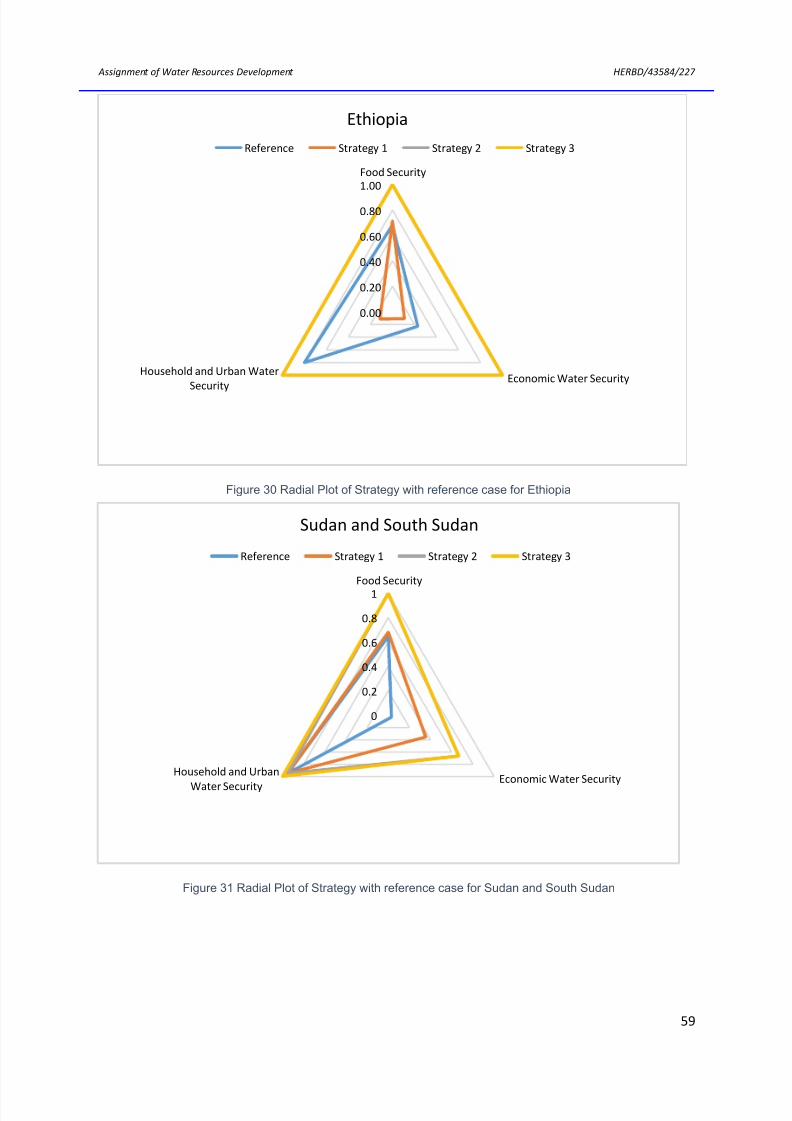
7/21/2019 A Report on RIBASIM-Submitted Final
http://slidepdf.com/reader/full/a-report-on-ribasim-submitted-final 59/72
Assignment of Water Resources Development HERBD/43584/227
59
Figure 30 Radial Plot of Strategy with reference case for Ethiopia
Figure 31 Radial Plot of Strategy with reference case for Sudan and South Sudan
0.00
0.20
0.40
0.60
0.80
1.00
Food Security
Economic Water SecurityHousehold and Urban Water
Security
Ethiopia
Reference Strategy 1 Strategy 2 Strategy 3
0
0.2
0.4
0.6
0.8
1
Food Security
Economic Water SecurityHousehold and Urban
Water Security
Sudan and South Sudan
Reference Strategy 1 Strategy 2 Strategy 3

7/21/2019 A Report on RIBASIM-Submitted Final
http://slidepdf.com/reader/full/a-report-on-ribasim-submitted-final 60/72
Assignment of Water Resources Development HERBD/43584/227
60
Figure 32 Radial Plot of Strategy with reference case for Egypt
But this charts were not clearly showing if these were able to fulfil all the demands or not so a scale
of 1 to 5 was used where 5 means fulfilment of all the requirements and 1 means unsatisfactory
result. For this we used a table below and the results is clearly shown in the radial graph which is
thought to be clearer to the decision makers.
Sudan and South Sudan Reference Strategy 1 Strategy 2 Strategy 3 Ideal Case
Food Security 1.9 2.0 3.0 3.0 5.0
Economic Water Security 0.1 1.1 2.0 2.0 5.0
Household and Urban WaterSecurity
2.9 2.9 2.9 3.0 5.0
Table 63 Comparison with the Ideal Case for Sudan
Figure 33 Comparison with the Ideal Case for Sudan
0
0.2
0.4
0.6
0.8
1Food Security
Economic Water SecurityHousehold and Urban Water
Security
Egypt
Reference Strategy 1 Strategy 2 Strategy 3
0.0
1.0
2.0
3.0
4.0
5.0
Food Security
Economic Water SecurityHousehold and Urban Water
Security
Sudan and South Sudan
Reference Strategy 1 Strategy 2 Strategy 3 Ideal Case

7/21/2019 A Report on RIBASIM-Submitted Final
http://slidepdf.com/reader/full/a-report-on-ribasim-submitted-final 61/72
Assignment of Water Resources Development HERBD/43584/227
61
Egypt Reference Strategy 1 Strategy 2 Strategy 3 Ideal Case
Food Security 1.8 1.9 2.0 2.0 5.0
Economic Water Security 0.4 0.3 1.0 1.0 5.0
Household and Urban Water
Security2.2 1.6 1.6 3.0 5.0
Table 64 Comparison with the Ideal Case for Egypt
Figure 34 Comparison with the Ideal Case for Egypt
Ethiopia ReferenceStrategy
1
Strategy
2
Strategy
3
Ideal
Case
Food Security 2.0 2.1 3.0 3.0 5.0
Economic Water Security 0.7 0.3 3.0 3.0 5.0
Household and Urban Water Security 2.4 0.3 3.0 3.0 5.0
Figure 35 Comparison with the Ideal Case for Ethiopia
0.0
1.0
2.0
3.0
4.0
5.0Food Security
Economic Water SecurityHousehold and Urban Water
Security
Egypt
Reference Strategy 1 Strategy 2 Strategy 3 Ideal Case

7/21/2019 A Report on RIBASIM-Submitted Final
http://slidepdf.com/reader/full/a-report-on-ribasim-submitted-final 62/72
Assignment of Water Resources Development HERBD/43584/227
62
Figure 36 Comparison with the Ideal Case for Ethiopia
0.0
1.0
2.0
3.0
4.0
5.0Food Security
Economic Water SecurityHousehold and Urban
Water Security
Ethiopia
Reference Strategy 1 Strategy 2 Strategy 3 Ideal Case
7/21/2019 A Report on RIBASIM-Submitted Final
http://slidepdf.com/reader/full/a-report-on-ribasim-submitted-final 63/72
Assignment of Water Resources Development HERBD/43584/227
63
11. Conclusion and Recommendation
11.1 Conclusion
As seen in the strategy analysis, we have reached to the conclusion that all the strategies that were
considered were not good enough to solve the problem. They were able to reduce the future problems
but a long list of measures, rules and regulations will have to be followed in order to attain the required
result as obtained from the model. But the real world cannot be modelled, the result obtained are
hypothetical and a factor of safety should be considered regarding the factors that cannot be
controlled by us like population growth, climate change e.tc.
11.2 Recommendations
As per the study results we strongly recommend the following things to be considered before going
for the project establishment,
All the riparian countries agree to implement the population growth measure as it is the heart
of this analysis,
Further, more strategies should be taken into considerations regarding environmental flows
and evaporation loss in the lake,
All the riparian countries should be equally benefited,
The strategy to be implemented depends on the amount of money available so a proper
source budget to be defined beforehand.

7/21/2019 A Report on RIBASIM-Submitted Final
http://slidepdf.com/reader/full/a-report-on-ribasim-submitted-final 64/72
Assignment of Water Resources Development HERBD/43584/227
64
12. References
i. HTTPS://EN.WIKIPEDIA.ORG/WIKI/
ii. HTTP://WWW.NILEBASIN.ORG/
iii. LECTURE NOTES OF EELCO VAN BEEK
iv. RIBASIM MANUAL
v. PROCEDURE PREPARED TO USE THE RIBASIM
vi. WWW.FAO.ORG
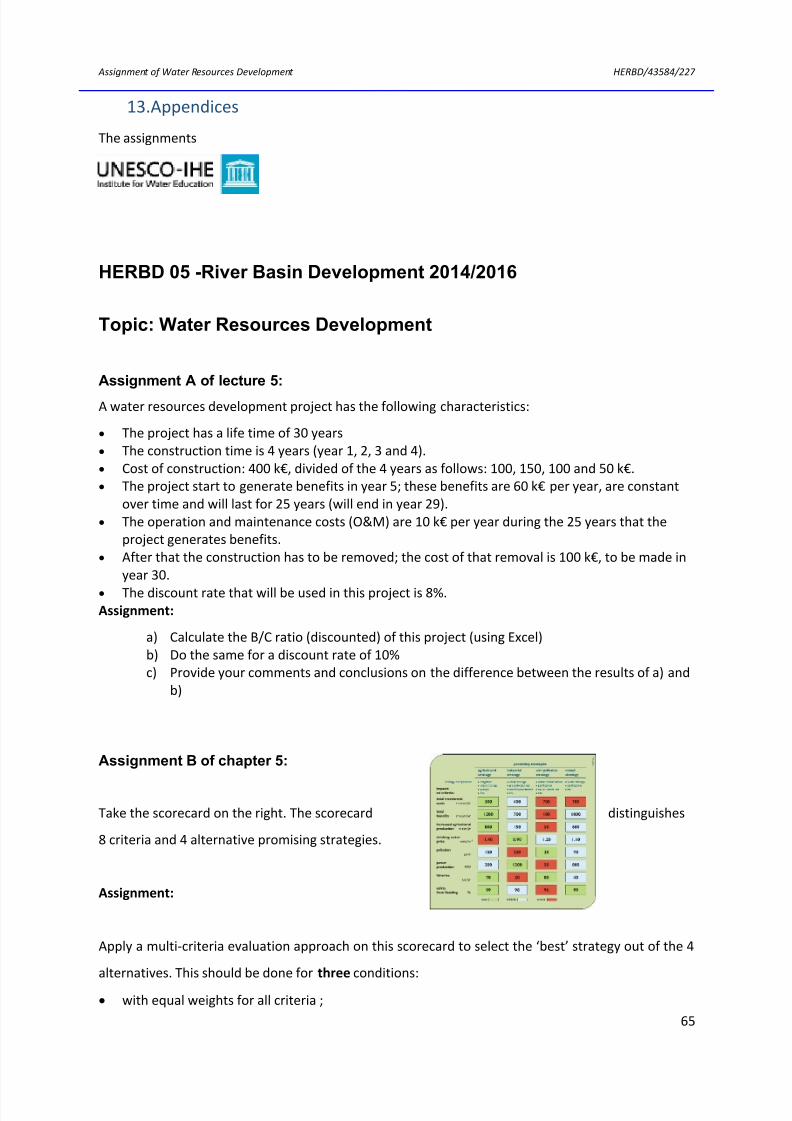
7/21/2019 A Report on RIBASIM-Submitted Final
http://slidepdf.com/reader/full/a-report-on-ribasim-submitted-final 65/72
Assignment of Water Resources Development HERBD/43584/227
65
13. Appendices
The assignments
HERBD 05 -River Basin Development 2014/2016
Topic: Water Resources Development
Assignment A of lecture 5:
A water resources development project has the following characteristics:
The project has a life time of 30 years
The construction time is 4 years (year 1, 2, 3 and 4).
Cost of construction: 400 k€, divided of the 4 years as follows: 100, 150, 100 and 50 k€.
The project start to generate benefits in year 5; these benefits are 60 k€ per year, are constant
over time and will last for 25 years (will end in year 29).
The operation and maintenance costs (O&M) are 10 k€ per year during the 25 years that the
project generates benefits.
After that the construction has to be removed; the cost of that removal is 100 k€, to be made in
year 30.
The discount rate that will be used in this project is 8%.Assignment:
a) Calculate the B/C ratio (discounted) of this project (using Excel)
b) Do the same for a discount rate of 10%
c) Provide your comments and conclusions on the difference between the results of a) and
b)
Assignment B of chapter 5:
Take the scorecard on the right. The scorecard distinguishes
8 criteria and 4 alternative promising strategies.
Assignment:
Apply a multi-criteria evaluation approach on this scorecard to select the ‘best’ strategy out of the 4
alternatives. This should be done for three conditions:
with equal weights for all criteria ;
7/21/2019 A Report on RIBASIM-Submitted Final
http://slidepdf.com/reader/full/a-report-on-ribasim-submitted-final 66/72
Assignment of Water Resources Development HERBD/43584/227
66
with triple weights for the more environment and socio-related criteria (1) drinking water price,
(2) pollution and (3) fisheries); and
with triple weights for the economic criteria (1) total investment costs and (2) total benefits.
First select a standardization method and describe the approach and results of this standardization.
In your assignment report (maximum 2 pages) I like to see:
1. a very short description of your application and the results (for all three conditions);
2. your conclusions with respect to the outcome of the three conditions (e.g. are they different
and why is that?)
3. your own comments and judgment on this application, e.g. if you like the method, what
kind of advantages and disadvantage you see in applying MCEM, etc.
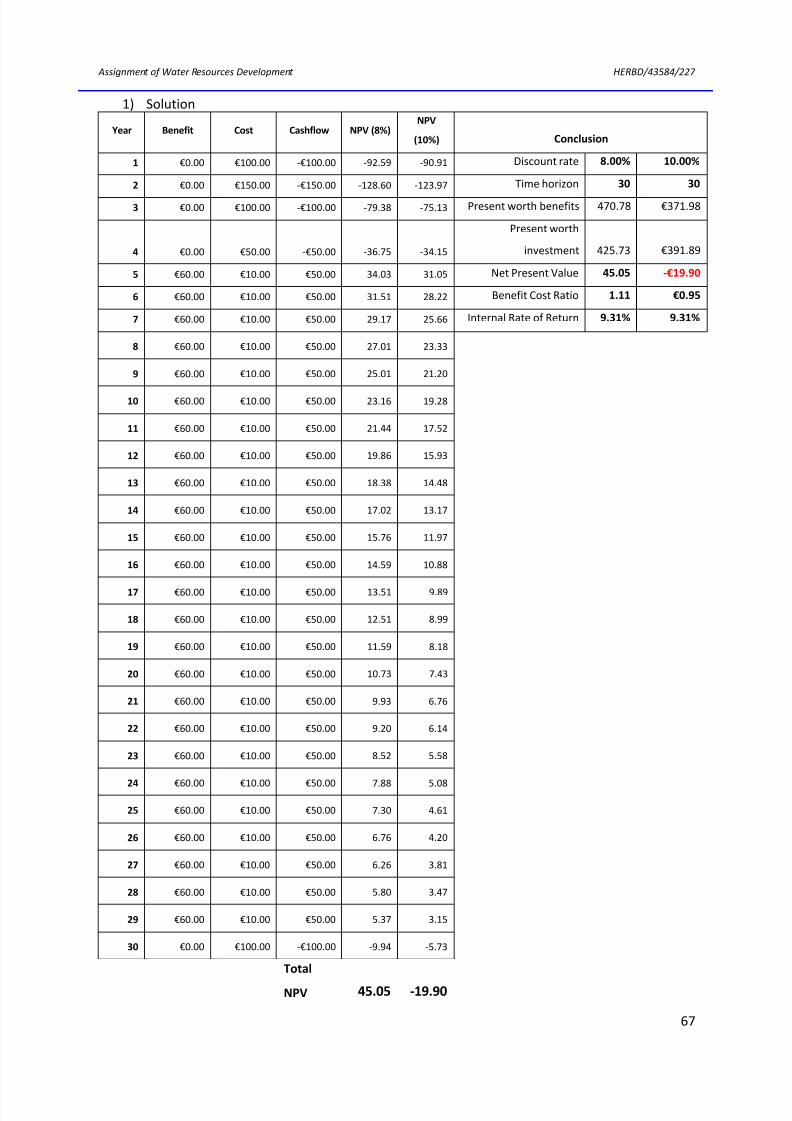
7/21/2019 A Report on RIBASIM-Submitted Final
http://slidepdf.com/reader/full/a-report-on-ribasim-submitted-final 67/72
Assignment of Water Resources Development HERBD/43584/227
67
1) Solution
Year Benefit Cost Cashflow NPV (8%)NPV
(10%) Conclusion
1 €0.00 €100.00 -€100.00 -92.59 -90.91 Discount rate 8.00% 10.00%
2 €0.00 €150.00 -€150.00 -128.60 -123.97 Time horizon 30 30
3 €0.00 €100.00 -€100.00 -79.38 -75.13 Present worth benefits 470.78 €371.98
4 €0.00 €50.00 -€50.00 -36.75 -34.15
Present worth
investment 425.73 €391.89
5 €60.00 €10.00 €50.00 34.03 31.05 Net Present Value 45.05 -€19.90
6 €60.00 €10.00 €50.00 31.51 28.22 Benefit Cost Ratio 1.11 €0.95
7 €60.00 €10.00 €50.00 29.17 25.66 Internal Rate of Return 9.31% 9.31%
8 €60.00 €10.00 €50.00 27.01 23.33
9 €60.00 €10.00 €50.00 25.01 21.20
10 €60.00 €10.00 €50.00 23.16 19.28
11 €60.00 €10.00 €50.00 21.44 17.52
12 €60.00 €10.00 €50.00 19.86 15.93
13 €60.00 €10.00 €50.00 18.38 14.48
14 €60.00 €10.00 €50.00 17.02 13.17
15 €60.00 €10.00 €50.00 15.76 11.97
16 €60.00 €10.00 €50.00 14.59 10.88
17 €60.00 €10.00 €50.00 13.51 9.89
18 €60.00 €10.00 €50.00 12.51 8.99
19 €60.00 €10.00 €50.00 11.59 8.18
20 €60.00 €10.00 €50.00 10.73 7.43
21 €60.00 €10.00 €50.00 9.93 6.76
22 €60.00 €10.00 €50.00 9.20 6.14
23 €60.00 €10.00 €50.00 8.52 5.58
24 €60.00 €10.00 €50.00 7.88 5.08
25 €60.00 €10.00 €50.00 7.30 4.61
26 €60.00 €10.00 €50.00 6.76 4.20
27 €60.00 €10.00 €50.00 6.26 3.81
28 €60.00 €10.00 €50.00 5.80 3.47
29 €60.00 €10.00 €50.00 5.37 3.15
30 €0.00 €100.00 -€100.00 -9.94 -5.73
Total
NPV 45.05 -19.90

7/21/2019 A Report on RIBASIM-Submitted Final
http://slidepdf.com/reader/full/a-report-on-ribasim-submitted-final 68/72
Assignment of Water Resources Development HERBD/43584/227
68
A) The B/C ratio for this case was calculated to be 1.11, IRR was 9.31 % with a discount rate of
8%.
B) The B/C ratio for this case was calculated to be 0.95, IRR was 9.31 % with a discount rate of
10%, and is found to be less than discount rate so it can be said that it is not feasible project.
C) It was found that with low discount rate the present worth of money was more than that of
high discount rate. Also, it was same with B/C ratio, ie the B/C ratio was more for lowdiscount rate and vice-versa. But the internal rate of return remained the same which is also
known as a efficiency indicator of investments. So with respect to B/C ratio and NPV the
project with low discount rate is preferred.

7/21/2019 A Report on RIBASIM-Submitted Final
http://slidepdf.com/reader/full/a-report-on-ribasim-submitted-final 69/72
Assignment of Water Resources Development HERBD/43584/227
69
2) Solution
Case –I with equal weights for all criteria ;
Case –II with triple weights for the more environment and socio-related criteria
(1) drinking water price, (2) pollution and (3) fisheries); and
Case-III with triple weights for the economic criteria
(1) total investment costs and (2) total benefits.
First of all a standardized score card was made as follows
Strategy Components Units
Promising Strategies
Agricultural
Strategy
Industrial
Strategy
Antipollution
strategy
Mixed
Strategy
IrrigationWater
Storage
water
conservation
water
storage
Water
Storage
Groundwater
usepurification
purificatio
n
Pumps
canal
improvemen
t
tax on water
useetc
Impacts Criteria etc etc etc
Total Investment Cost
m
euro/yr 1.00 0.75 0.43 0.43
Total Benefitsm
euro/yr1.00 0.58 0.08 0.83
Increased agricultural
production
m ton/
year1.00 0.19 0.06 0.75
drinking water priceeuro/m
30.64 1.00 0.75 0.82
pollution ppm 0.23 0.16 1.00 0.50
power production MW 0.17 1.00 0.04 0.67
fisheries ton/yr 0.88 0.25 1.00 0.50
safety from flooding % 1.00 0.99 0.97 1.00
Total 5.92 4.92 4.34 5.50

7/21/2019 A Report on RIBASIM-Submitted Final
http://slidepdf.com/reader/full/a-report-on-ribasim-submitted-final 70/72
Assignment of Water Resources Development HERBD/43584/227
70
Conclusion
Strategy Case I Case II Case III
Agricultural ( 1) 0.74 0.67 0.83
Industrial (2) 0.61 0.55 0.63
Antipollution (3) 0.54 0.55 0.70
Mixed (4) 0.69 0.65 0.67
Total 2.58 2.43 2.83
Multi-criteria evaluation is a fundamental step of the rational decision-making process. The purpose
of evaluation is to gain reliable information on strengths, weaknesses and overall utility of each option.
It is undertaken to make a comparative assessment between the projects.
As per the conclusion above, it seems for all the given weightage Strategy I was found the best.
Strategy 2 and 4 had no significant changes in all the cases but strategy 3 has a huge change from case
I to Case III. While strategy 4 was found to be average with less variability in all the cases.
As the investment and benefit for Strategy I was more it was obvious to have great influence in Case
III . Also, overall the standard score card tells that Strategy I is already in higher position than other
strategies as the sum of its criteria is the highest among all the strategies. The standard score card
reveals that the decision will be somewhat like strategy 1>4>2>3, which was also seen in case I and II
but in cases III the order was 1>3>4>2. So, the decision makers are driven towards the first strategy.
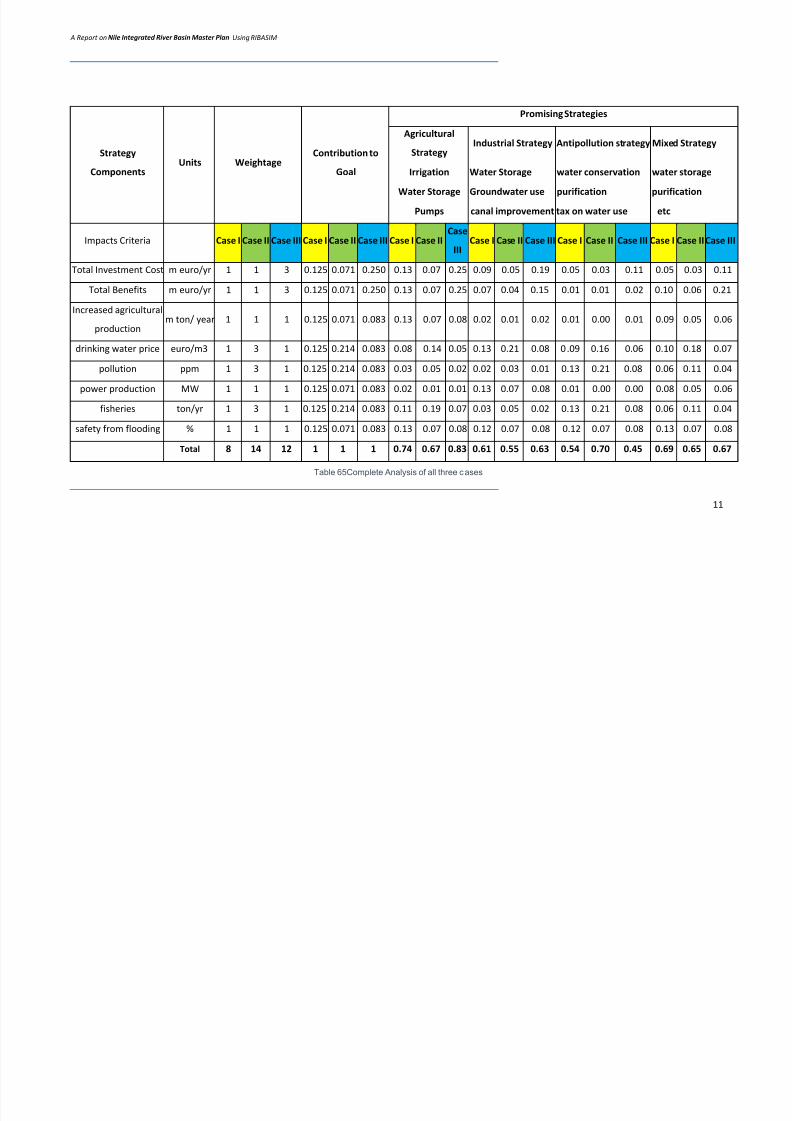
7/21/2019 A Report on RIBASIM-Submitted Final
http://slidepdf.com/reader/full/a-report-on-ribasim-submitted-final 71/72
A Report on Nile Integrated River Basin Master Plan Using RIBASIM
11
Strategy
ComponentsUnits Weightage
Contribution to
Goal
Promising Strategies
Agricultural
StrategyIndustrial Strategy Antipollution strategy Mixed Strategy
Irrigation Water Storage water conservation water storage
Water Storage Groundwater use purification purificationPumps canal improvement tax on water use etc
Impacts Criteria Case I Case II Case III Case I Case II Case III Case I Case IICase
IIICase I Case II Case III Case I Case II Case III Case I Case II Case III
Total Investment Cost m euro/yr 1 1 3 0.125 0.071 0.250 0.13 0.07 0.25 0.09 0.05 0.19 0.05 0.03 0.11 0.05 0.03 0.11
Total Benefits m euro/yr 1 1 3 0.125 0.071 0.250 0.13 0.07 0.25 0.07 0.04 0.15 0.01 0.01 0.02 0.10 0.06 0.21
Increased agricultural
productionm ton/ year 1 1 1 0.125 0.071 0.083 0.13 0.07 0.08 0.02 0.01 0.02 0.01 0.00 0.01 0.09 0.05 0.06
drinking water price euro/m3 1 3 1 0.125 0.214 0.083 0.08 0.14 0.05 0.13 0.21 0.08 0 .09 0.16 0.06 0.10 0.18 0.07
pollution ppm 1 3 1 0.125 0.214 0.083 0.03 0.05 0.02 0.02 0.03 0.01 0.13 0.21 0.08 0.06 0.11 0.04
power production MW 1 1 1 0.125 0.071 0.083 0.02 0.01 0.01 0.13 0.07 0.08 0.01 0.00 0.00 0.08 0.05 0.06
fisheries ton/yr 1 3 1 0.125 0.214 0.083 0.11 0.19 0.07 0.03 0.05 0.02 0.13 0.21 0.08 0.06 0.11 0.04
safety from flooding % 1 1 1 0.125 0.071 0.083 0.13 0.07 0.08 0.12 0.07 0.08 0.12 0.07 0.08 0.13 0.07 0.08
Total 8 14 12 1 1 1 0.74 0.67 0.83 0.61 0.55 0.63 0.54 0.70 0.45 0.69 0.65 0.67
Table 65Complete Analysis of all three cases

7/21/2019 A Report on RIBASIM-Submitted Final
http://slidepdf.com/reader/full/a-report-on-ribasim-submitted-final 72/72
A Report on Nile Integrated River Basin Master Plan Using RIBASIM
I think this method is very useful during the feasibility study of the project when we
have very less data but have an idea about the preferences to be made in the project.
But this will not be a good method to decide when we have sufficient reliable datas.
While using this method, one should be very careful about the weightage given and
should consider various scenarios before coming to a conclusion. And also expert
advice will be essential while giving weightage. The only advantage is it can show us
how important one factor is compared to the other. But it only gives an idea not a
concrete solution as the preference can be manipulated, the results cannot be totally
relied on.