a regression of morphological differences on an …gjaeger/conferences/essli_2012/jschepen... · a...
TRANSCRIPT

A Regression of Morphological Differences on an
Empirical Measure of Learning Difficulty
Please do not quote without written permission
Job Schepens
Centre for Language Studies, Radboud University Nijmegen, the Netherlands
International Max Planck Research School for Language Sciences, Nijmegen,
the Netherlands
1

Introduction
56% of citizizens in the EU
member states are able to
have a converstaion in at least
one language apart from their
mother tongue
(Euro Barometer 243, 2006)
47% 5 years earlier
(Euro Barometer 55.1, 2001)
2

Introduction
Problem
It is unclear how the structure of the mother tongue influences the
acquisition of an additional language Learning difficulty plays a direct role in language contact situations (accounting for
cross-language family tree change)
Aims
To quantify the impact that various typological feature configurations have
on learning difficulty New insights in patterns of borrowing and transfer?
New insights in patterns of morphological complexity?
Bring empirical data of learning difficulty to quantitative diachronic
approach
3

Modelling Linguistic Diversity
Modelling linguistic diversity helps us understand
what we are capable of (Levinson & Gray, 2012)
Divergence, drift Phylogeny of the Indo European language family on
expert cognacy judgments
e.g. tomaat (NL), tomato (EN), Tomat (DE)
using 200 lexical item lists (Dyen et al. database)
Founder effect Regression of phoneme inventory size on population
size and geographical distance (Atkinson, 2011)
using a typological database (WALS) and Ethnologue
Lexical diffusion and standardization Regression of pronunciation distance on social and
geographic factors (Wieling et al, 2011)
using a dialect atlas (GTRP) and lexical databases
(Celex)
4
HITTITE Greek
Armenian Albanian
Kashmiri Singhalese
Nepali List Bengali Hindi
Panjabi Gujarati Marathi Persian List
Afghan Lithuanian
Latvian Slovenian
Bulgarian Serbocroatian
Slovak Ukrainian Byelorussian Russian
Polish Breton
Irish Romanian
French Spanish Portuguese
Catalan Italian German
Dutch List Afrikaans Flemish
English Swedish
Icelandic Faroese
Danish
Gray & Atkinson, 2003

Modelling Linguistic Diversity
Adaptation effects? Varying patterns of
L2 acquisition across languages? Regression of morphological
complexity on the number of speakers
of a language (Lupyan & Dale, 2010)
using 28 typological features (WALS)
and Ethnologue
Empirical measure of linguistic
differences Regression of learning difficulty on
measures of evolutionary relatedness
(previous study)
using branch lengths from Gray &
Atkinson (2003)
5

0.000
0.002
0.004
0.006
0.008
0.010
300 400 500 600 700
Speaking
De
nsity
Learning Difficulty: Data
• State exam “Dutch as a Second Language” - Produced by CITO, a Dutch organization that produces tests and exams
- For non-native speakers who intend to start a higher level education / occupation
- 1995 – 2010
- 50,000 test scores available
- Enough data to test learning differences across 72 mother tongues
6
• The speaking exam - 14 tasks in 30 minutes
- e.g. provide information, give
instructions, …
- in Dutch television, a lot of ads are
made for all kinds of products, even in
the middle of a program. What is your
opinion about ads on TV?
• Evaluation on content and
correctness
• Passing level ≈ upper-intermediate /
B2 level

Learning Difficulty: Data
• Fixed Effects - Gender, age of arrival, length of residence, years of
daily education, educational quality
- interaction years of daily education and quality
- interaction age of arrival and linguistic distance
- interaction length of residence and linguistic distance
- best additional language
- linguistic distance
7
Mother
Tongue
Country
of Birth
Mean
Speaking
Linguistic
Distance
Schooling
Quality
Group Size
Kurdish Syria 487 .426 423 63
Kurdish Turkey 490 .426 454 185
French Congo 491 .398 350 65
French France 531 .398 497 936
French Switzerland 550 .398 517 37
German Germany 558 .037 510 4434
German Switzerland 571 .037 517 190
Sample 1
- 35 Indo-European
- 35,000 learners
- 89 countries of birth
• Sample 2 - 72 mother tongues
- 50,000 learners

8
Learning Difficulty: Method
Exam score 2
Farsi Iran
Exam score 1 Exam score 3
Kurdish Afghanistan
• Linear Mixed Effects Regression • Models dependencies in
variation by estimating group
level BLUPs
• Assumes BLUPs are: • normally distributed,
• centred around 0, and
• orthogonal to the individual level
noise
Mother Tongue L1 Country of Birth C
• Data structure • Country of birth (C)
• Mother tongue (L1)
• Best additional language (L2)
• Combinations (L1-L2)
English Arabic
Best Additional Language L2
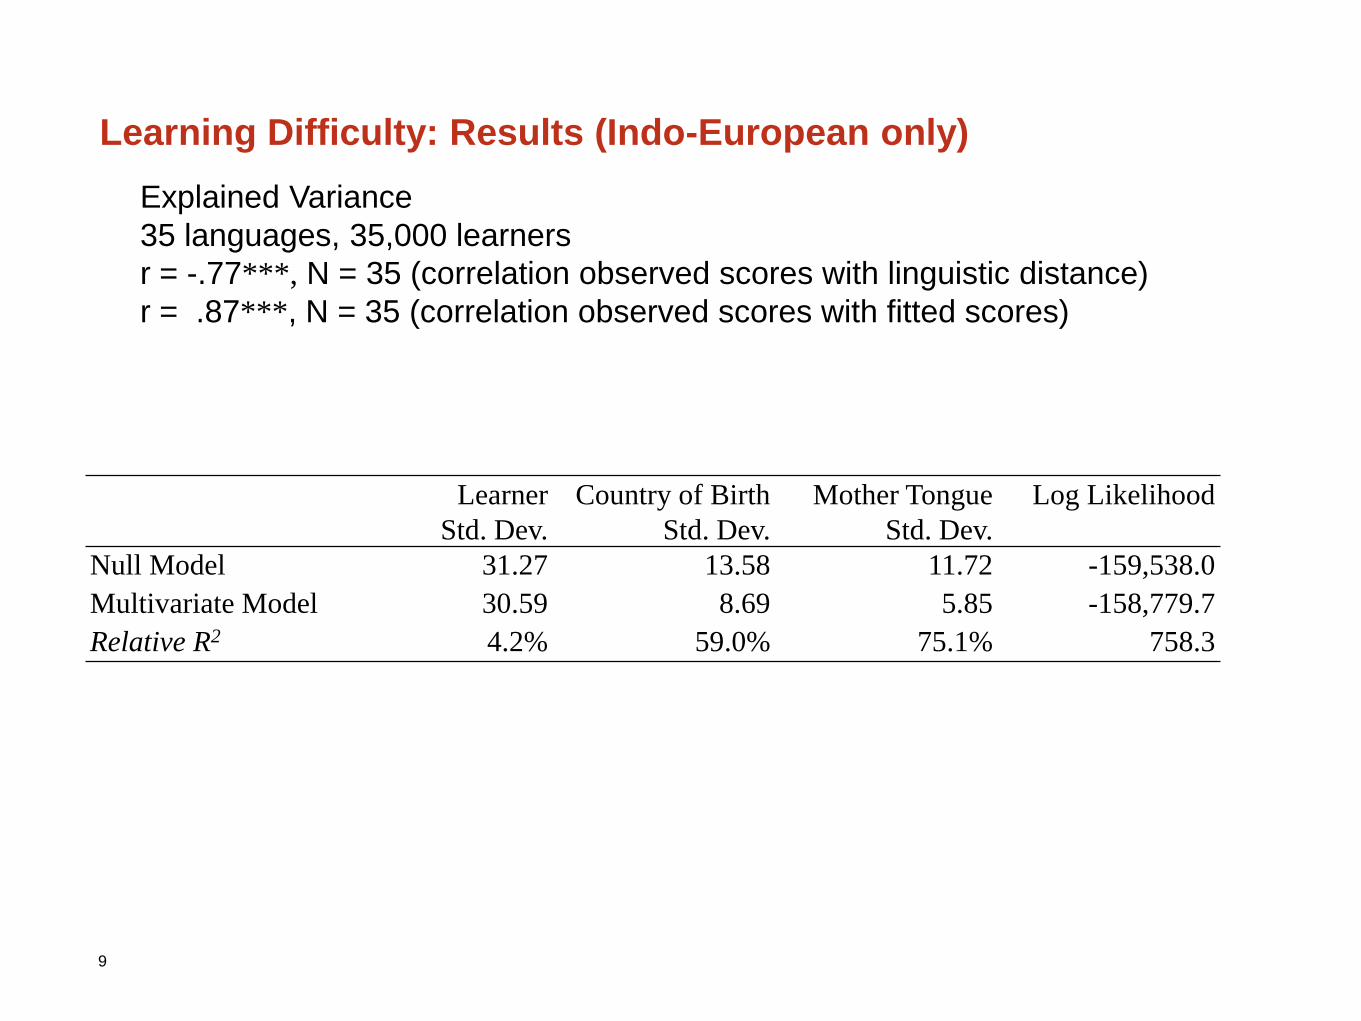
Learning Difficulty: Results (Indo-European only)
9
Learner
Std. Dev.
Country of Birth
Std. Dev.
Mother Tongue
Std. Dev.
Log Likelihood
Null Model 31.27 13.58 11.72 -159,538.0
Multivariate Model 30.59 8.69 5.85 -158,779.7
Relative R2 4.2% 59.0% 75.1% 758.3
Explained Variance
35 languages, 35,000 learners
r = -.77***, N = 35 (correlation observed scores with linguistic distance)
r = .87***, N = 35 (correlation observed scores with fitted scores)

Learning Difficulty: Results (outside Indo-European also)
10
Model Degrees of
freedom
Log
Likelihood χ² k Pr(> χ²)
Null model: L1, C 4 -247,546.18
L1, C 10 -246,336.19 2,419.98 6 < 2.2e-16 ***
L1L2, C 10 -246,097.03 478.33 0 < 2.2e-16 ***
L1,L2, C 11 -246,003.81 186.43 1 < 2.2e-16 ***
L1,L1L2, C 11 -245,993.14 21.35 0 < 2.2e-16 ***
L1,L2,L1L2, C 12 -245,945.03 96.21 1 < 2.2e-16 ***
Model comparison
72 languages, 50,000 learners

Learning Difficulty: Results (outside Indo-European also)
Fixed Effects Estimate MCMC
mean
HPD95
lower
HPD95
upper Pr(> |t|)
(Intercept) 505.02 504.89 498.44 511.36 < 2.2e-16 ***
1. Gender (1 = Female) 7.39 7.41 6.74 8.05 < 2.2e-16 ***
2. Age of Arrival -0.72 -0.72 -0.77 -0.68 < 2.2e-16 ***
3. Length of Residence 0.62 0.62 0.55 0.69 < 2.2e-16 ***
4. Years of Daily Education -0.77 -0.78 -1.83 0.24 0.143
5. Secondary School Enrollment Rate 0.18 0.18 0.11 0.25 < 2.2e-16 ***
6. Interaction 4* 5 0.04 0.04 0.02 0.057 < 2.2e-16 ***
11
Random Effects Std. Dev. MCMC
mean
HPD95
lower
HPD95
upper
L1L2 3.29 2.96 2.27 3.70
C 8.30 7.90 6.55 9.26
L1 11.13 10.55 8.76 12.46
L2 3.82 3.93 2.64 5.27
Residual 31.34 31.35 31.16 31.55
P values and HPD confidence intervals
72 languages, 50,000 learners

-40 -20 0 20 40
Learning Difficulty: Product
BLUPs of the random effect of the mother tongue on
speaking proficiency in Dutch as an L2
Account for
country characteristics such as educational quality
individual differences such as level of education
Empirical measure of learning difficulty 72 languages, 29 genera, 13 families
12
Germanic
Romance
Chinese & Thai
Austronesian
Altaic
Niger-Congo
Slavic
Afro-Asiatic
predicted score with =13.6
L1
Fre
qu
en
cy
-40 -20 0 20 40
02
46
8

Stepwise expanding the analysis
1st step Expose a feature hierarchy in L2 learnability
Regression of differences and overlap in inflectional morphology on learning
difficulty
2nd Step Test of adaptation effects: are complex features more difficult to acquire?
13

Feature Hierarchy: Data
Inflectional morphology Tense, aspect, evidentiality, negation, plurality, possibility, etc. (28 features from
WALS, based on Lupyan & Dale, 2010)
E.g. aspect marking in Russian vs. English:
“Ya vypil chai” (I PFV+drank tea)
“I finished drinking the tea.” (5 words)
Cross-language Comparison Different feature value as compared to Dutch (0)
Feature value is more complex (26 features)
Feature value is less complex (14 features)
Feature value is equally complex (9 features)
Overlapping feature value (1)
Missing values Dutch: 9 values
7 values adopted from German, 2 from English (judgments based on WALS
chapters)
Other languages
Impute missing feature values from languages with the most recent common
ancestor? 14
15
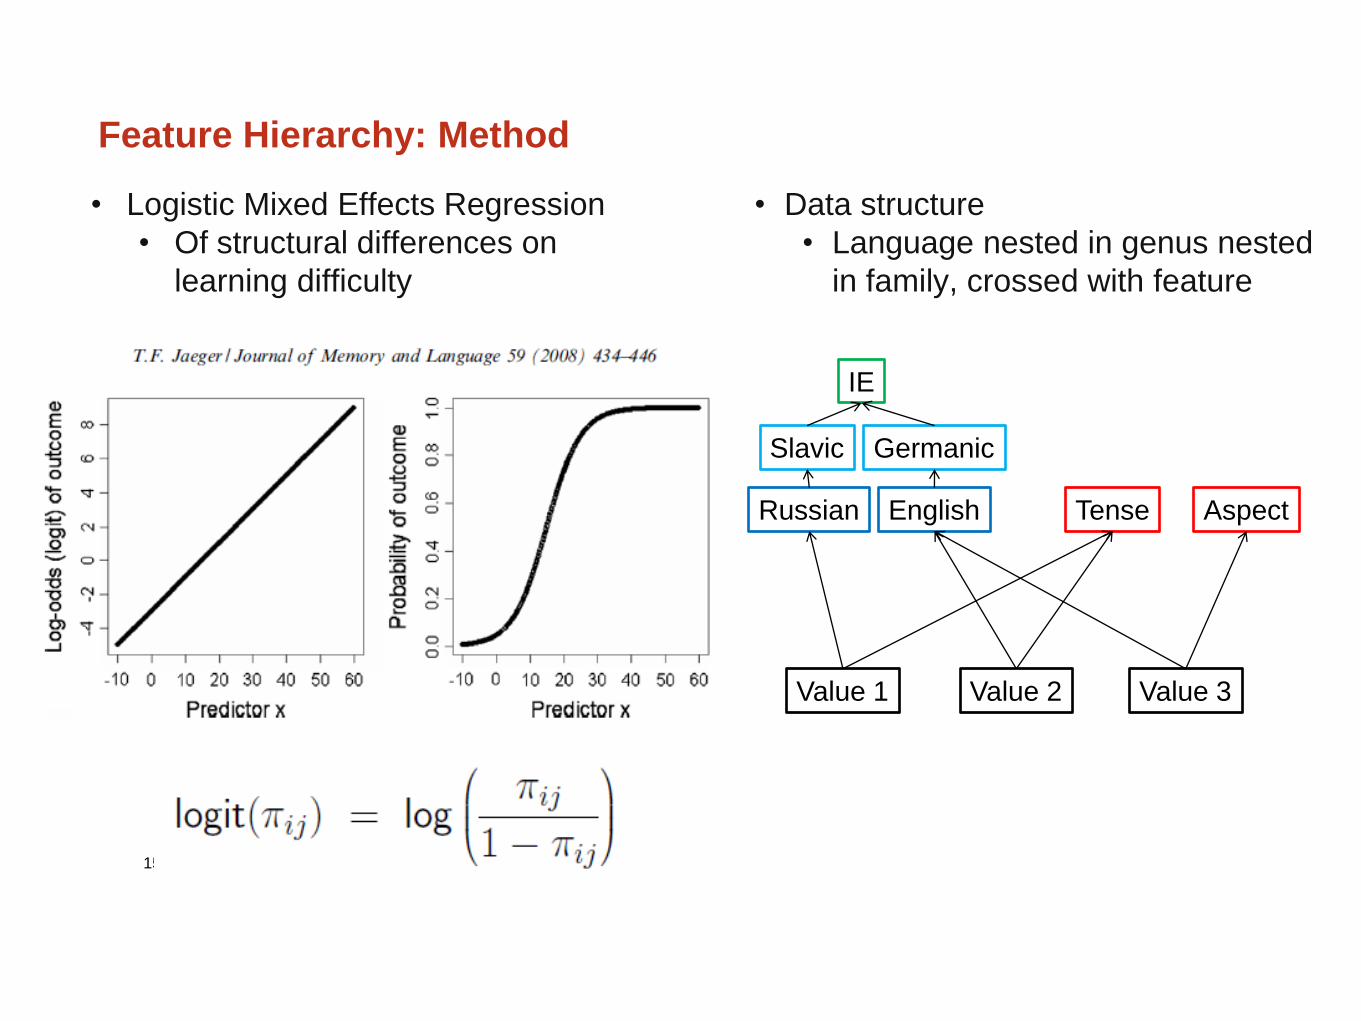
Feature Hierarchy: Method
• Data structure
• Language nested in genus nested
in family, crossed with feature
Value 2
English Tense
Value 1 Value 3
Russian Aspect
Slavic Germanic
IE
• Logistic Mixed Effects Regression
• Of structural differences on
learning difficulty

Feature Hierarchy: Results
Without Imputation
Number of obs: 1127, groups: language_name:(genus:family), 65; feature_name, 29;
genus:family, 29; family, 13
16
Model Degrees
of freedom
Log
Likelihood χ² k Pr(> χ²)
Null model 5 -646.91
Random slope 7 -637.04 19.74 2 0.0001
Groups Std. Dev. Corr
Feature 1.409087
Learning Difficulty | Feature 0.049532 0.644
Language : (Genus : Family) 0.000000
Genus : Family 0.521079
Family 0.377069

Feature Hierarchy: Results
Predicted
logits
Map of
typological
variation to
linguistic
distance
17
Random effect of learning difficulty among 28 features
Learning difficulty
Pre
dic
ted
pro
ba
bility o
f a
mo
rph
olo
gic
al d
iffe
ren
ce
-4
-2
0
2
4
-20 -10 0 10 20 30

Feature Hierarchy: Results
Predicted
probabilities
Map of
typological
variation to
linguistic
distance
18
Random effect of learning difficulty among 28 features
Learning difficulty
Pre
dic
ted
lo
git o
f a
mo
rph
olo
gic
al d
iffe
ren
ce
0.0
0.2
0.4
0.6
0.8
1.0
-20 -10 0 10 20 30

r p feature name 0.79 <0.001 Alignment of Verbal Person Marking 0.74 <0.001 Coding / Occurrence of Plurality 0.59 <0.001 Person Marking on Verbs 0.55 0.003 Case Syncretism 0.51 0.007 Syncretism in Verbal Person / Number Marking 0.46 0.002 Past Tense 0.43 0.002 Epistemic Possibility 0.39 0.064 Fusion of inflectional formatives 0.36 0.007 Coding of Negation 0.36 0.009 Situational Possibility 0.35 0.030 Coding of Possesives 0.32 0.021 Inflectional Morphology 0.28 0.080 Optative 0.25 0.079 Number of Cases 0.14 0.568 Morphological Imperative 0.01 0.991 Possessive Classification 0.00 0.742 Definite / Indefinite Articles -0.13 0.529 Associative Plural -0.13 0.365 Perfective / Imperfective -0.16 0.374 Distance distinctions in demonstratives -0.18 0.231 Definite Articles -0.19 0.303 Inflectional Synthesis of the Verb -0.20 0.247 Future Tense -0.24 0.134 Coding of Evidentiality -0.25 0.203 Alignment of Case markings of Full NPs -0.30 0.016 Polar Question Coding -0.32 0.028 Overlap b/w Epistemic and Situational Possibility -0.45 0.001 Expression of Pronomial Subjects

Conclusions
• For most features, learning difficulty increases the probability of typological
difference - 20 positive correlations (12 significant, 8 not significant)
- 7 negative correlations (2 significant, 5 not significant)
• Empirical support for the hypothesis that complexity is reduced by L2 learning
• Mixed Effects Regression is useful for modelling variation across features and
languages
• Feature hierarchy may be used as a structural measure of linguistic distance
20