a real-time computer vision system for vehicle tracking and traffic surveillance
TRANSCRIPT

A real-time computer vision system for vehicle trackingand tra�c surveillance
Benjamin Coifmana,*, David Beymerb,1, Philip McLauchlanb,2,Jitendra Malikb,3
aInstitute of Transportation Studies, University of California, Berkeley, CA, 94720, USAbDepartment of Electrical Engineering and Computer Sciences, University of California, Berkeley,
CA 94720-1776, USA
Received 30 March 1998; received in revised form 3 December 1998; accepted 3 December 1998
Abstract
Increasing congestion on freeways and problems associated with existing detectors have spawned aninterest in new vehicle detection technologies such as video image processing. Existing commercial imageprocessing systems work well in free-¯owing tra�c, but the systems have di�culties with congestion, sha-dows and lighting transitions. These problems stem from vehicles partially occluding one another and thefact that vehicles appear di�erently under various lighting conditions. We are developing a feature-basedtracking system for detecting vehicles under these challenging conditions. Instead of tracking entire vehi-cles, vehicle features are tracked to make the system robust to partial occlusion. The system is fully func-tional under changing lighting conditions because the most salient features at the given moment aretracked. After the features exit the tracking region, they are grouped into discrete vehicles using a commonmotion constraint. The groups represent individual vehicle trajectories which can be used to measure tra-ditional tra�c parameters as well as new metrics suitable for improved automated surveillance. This paperdescribes the issues associated with feature based tracking, presents the real-time implementation of aprototype system, and the performance of the system on a large data set. # 1999 Elsevier Science Ltd. Allrights reserved.
Keywords: Tra�c surveillance; Wide-area detection; Vehicle tracking; Video image processing; Machine vision
0968-090X/99/$ - see front matter # 1999 Elsevier Science Ltd. All rights reserved.
PII: S0968-090X(98)00019-9
TRANSPORTATION
RESEARCH
PART C
Transportation Research Part C 6 (1998) 271±288
* Corresponding author. Tel.:+1-510-845-5121; fax:+1-510-642-1246; e-mail:[email protected] D. Beymer is now with SRI International, 333 Ravenswood Ave, Menlo Park, Ca 94025. E-mail: beymer@-
ai.sri.com2 P. McLauchlan is now with the University of Surrey, School of EE, IT and Math., Guildford, Surrey GU2 5XH,
UK. E-mail: [email protected] E-mail: [email protected]

1. Introduction
In recent years, tra�c congestion has become a signi®cant problem. Early solutions attemptedto lay more pavement to avoid congestion, but adding more lanes is becoming less and less fea-sible. Contemporary solutions emphasize better information and control to use the existinginfrastructure more e�ciently.The quest for better tra�c information, and thus, an increasing reliance on tra�c surveillance,
has resulted in a need for better vehicle detection such as wide-area detectors; while the high costsand safety risks associated with lane closures has directed the search towards non-invasivedetectors mounted beyond the edge of the pavement. One promising approach is vehicle trackingvia video image processing, which can yield traditional tra�c parameters such as ¯ow and velo-city, as well as new parameters such as lane changes and vehicle trajectories.Because the vehicle tracks, or trajectories, are measured over a length of roadway, rather than
at a single point, it is possible to measure true density instead of simply recording detector occu-pancy. In fact, by averaging trajectories over space and time, the traditional tra�c parameters aremore stable than corresponding measurements from point detectors, which can only average overtime. The additional information from the vehicle trajectories could lead to improved incidentdetection, both by detecting stopped vehicles within the camera's ®eld of view and by identifyinglane change maneuvers or acceleration/deceleration patterns that are indicative of incidentsbeyond the camera's ®eld of view. The trajectory data could also be used to automate previously laborintensive tra�c studies, such as examining vehicle maneuvers in weaving sections or bottlenecks. Thevehicle tracking system can produce individual vehicle data (e.g. spacing, headway, velocity,acceleration), which could lead to better tra�c ¯ow modeling and an improved understanding ofdriver behavior. Finally, our group has demonstrated that the system can extract vehicle sig-natures and match observations of the same vehicle at multiple detector stations (Huang andRussell, 1998). This signature matching can be used to measure true link travel time and thus,quantify conditions between widely spaced detectors rather than assuming that local conditionsare representative of the entire link.To be an e�ective tra�c surveillance tool, whether by mimicking loop detectors or actually
tracking vehicles, a video image processing system (VIPS) should meet several stringent require-ments:
1. Automatic segmentation of each vehicle from the background and from other vehicles sothat all vehicles are detected.
2. Correctly detect all types of road vehiclesÐmotorcycles, passenger cars, buses, constructionequipment, trucks, etc.
3. Function under a wide range of tra�c conditionsÐlight tra�c, congestion, varying speeds indi�erent lanes.
4. Function under a wide variety of lighting conditionsÐsunny, overcast, twilight, night, rainy,etc.
5. Operate in real-time.
Even though a number of commercial VIPS for monitoring tra�c have been introduced to themarket, many of these criteria still cannot be met.
272 B. Coifman et al./Transportation Research Part C 6 (1998) 271±288

1.1. State of the practice
Most of the commercial VIPS available today are tripwire systems which mimic the opera-tion of loop detectors, but they do not track vehicles. That is, they do not identify individualvehicles as unique targets and follow their movements in time distinct from other vehicles. Thefollowing detectors are examples of commercial tripwire systems: AUTOSCOPE, CCATS,TAS, IMPACTS and Tra�Cam (Hockaday, 1991; Hoose, 1992; Chatziioanou et al., 1994;Klein and Kelley, 1996; MNDOT, 1997). The systems typically allow a user to specify severaldetection regions in the video image and then the given system looks for image intensitychanges in the detection regions to indicate vehicle presence/passage. The comparisons are notcomputationally intensive and can be implemented on Intel 386 based PC's. The primaryadvantage of these systems is the ease of placing/replacing detector zones and the fact thatthere is no need to cut the pavement. Some of these systems use a large number of detectionzones to follow successive detector actuations through the image, (e.g. IMPACTS), but theydo not track vehicles.Some commercial systems do track vehicles, the so-called ``third generation'' VIPS, e.g. CMS
Mobilizer, Eliop EVA, PEEK VideoTrak, Nestor Tra�cVision, and Sumitomo IDET (Chat-ziioanou et al., 1994; Klein and Kelley, 1996; MNDOT, 1997; Nihan et al., 1995). Generally,these systems use region based tracking, i.e., vehicles are segmented based on movement. Unfor-tunately, if one moving target (including its shadow) occludes another, the two targets maybecome merged together by the tracking software.Recent evaluations of commercial VIPS found the systems had problems with congestion, high
¯ow, occlusion, camera vibration due to wind, lighting transitions between night/day and day/night, and long shadows linking vehicles together (Hockaday, 1991; Chatziioanou et al., 1994;Nihan et al., 1995; Klein and Kelley, 1996; MNDOT, 1997). The need for tra�c surveillanceunder ALL conditions has led to research in more advanced video-based vehicle detection. Forexample, Chao et al. (1996) have developed an algorithm to di�erentiate vehicles from shadows.On a larger scale, the FHWA has sponsored a major research e�ort administered by the JetPropulsion Laboratory (JPL) to advance wide-area tra�c detector technology (Condos, 1996; JPL,1997). Five VIPS were funded by the JPL project, of which, three were existing commercial products(AUTOSCOPE, CMS Mobilizer, and Nestor Tra�cVision). The two remaining systems wereproduced in university laboratories: Autocolor (Chachich et al., 1996; Zeng and Crisman,1996), which uses color features to identify vehicles, segment them from the backgroundimage and track them through the camera's ®eld of view; and Roadwatch, the subject of thisreport.For some years, our group has been developing a vision-based vehicle tracking system: (Koller
et al., 1994a,b; Beymer et al., 1997). The system uses video from wayside cameras and processes itcurbside, then, the data is transmitted in summary form to a central location such as a tra�cmanagement center (TMC) for collation and computation of multi-site parameters (e.g., linktravel time). Processing occurs in three stages:
1. Segmentation of the scene into individual vehicles and tracking each vehicle inside a trackingzone to re®ne and update its position and velocity in 3D world coordinates. The time trackof these position estimates yield a vehicle trajectory.
B. Coifman et al./Transportation Research Part C 6 (1998) 271±288 273

2. Processing the trajectory data to compute local tra�c parameters (e.g. ¯ow and lane changefrequency). These parameters, together with vehicle signature information (e.g. time stamp,vehicle type, color, shape, position), are communicated to the TMC at regular intervals.
3. At the TMC, local tra�c parameters from each site are collated and signature informationfrom neighboring camera sites are processed to compute section parameters such as linktravel time and origin-destination counts. The data is then passed on to automated andoperator assisted applications.
In this paper, we focus on the ®rst two stages: vehicle segmentation and tracking, and thecomputation of tra�c parameters from the tracking data. First, we present di�erent vehicletracking strategies from the computer vision literature. Then we focus on feature based trackingas a means to improve detector performance in congestion and di�cult lighting conditions. Thetrue wide-area detection yields vehicle trajectories and facilitates new and improved tra�c para-meters. The remainder of the paper presents the testing results from a real-time prototype on 44lane-hours of data.
2. Vehicle tracking strategies
Multi-object tracking and data association have received considerable attention in the compu-ter vision ®eld and much of the background work has been in non-transportation applications.From the computer vision literature, the di�erent tracking approaches for video data can beclassi®ed as follows.
2.1. Model based tracking
Three-dimensional model-based vehicle tracking systems have previously been investigated byseveral research groups, the most prominent being the groups at Karlsruhe (Koller et al., 1993)and at the University of Reading (Baker and Sullivan, 1992; Sullivan, 1992). The emphasis is onrecovering trajectories and models with high accuracy for a small number of vehicles. The mostserious weakness of this approach is the reliance on detailed geometric object models. It isunrealistic to expect to be able to have detailed models for all vehicles that could be found on theroadway.
2.2. Region based tracking
In this approach, the VIPS identi®es a connected region in the image, a `blob', associated witheach vehicle and then tracks it over time using a cross-correlation measure. Typically, the processis initialized by the background subtraction technique. A Kalman ®lter-based adaptive back-ground model (Karmann and Brandt, 1990; Kilger, 1992) allows the background estimate toevolve as the weather and time of day a�ect lighting conditions. Foreground objects (vehicles) aredetected by subtracting the incoming image from the current background estimate, looking forpixels where this di�erence image is above some threshold and then ®nding connected compo-nents.
274 B. Coifman et al./Transportation Research Part C 6 (1998) 271±288

This approach works fairly well in free-¯owing tra�c. However, under congested tra�c condi-tions, vehicles partially occlude one another instead of being spatially isolated, which makes the taskof segmenting individual vehicles di�cult. Such vehicles will become grouped together as one largeblob in the foreground image. Fig. 1(A) illustrates this phenomena on a hypothetical onedimensional roadway (i.e. no width) viewed from the camera's perspective, henceforth referred toas the image plane. The vehicles have ®nite length, hence the trajectories are shown as `thick'bands in the time space plane. By time t3, vehicle 2 partially occludes vehicle 1. Region basedtracking would erroneously merge the two `blobs' together at this point.
2.3. Active contour based tracking
A dual to the region based approach is tracking based on active contour models, or snakes. Thebasic idea is to have a representation of the bounding contour of the object and keep dynamicallyupdating it. The previous system for vehicle tracking developed in our group, Koller et al.(1994a,b), was based on this approach. The advantage of having a contour based representationinstead of a region based representation is reduced computational complexity.However, the inability to segment vehicles that are partially occluded remains. If one could
initialize a separate contour for each vehicle, then one could track even in the presence of partialocclusion (Koller et al., 1994a). However, initialization is the di�cult part of the problem! Con-sider the example in Fig. 1(A): if the vehicles enter the detection region partially occluded, thesystem will group two vehicles into a single object and this will result in signi®cant measurementerrors.
2.4. Feature based tracking
An alternative approach to tracking abandons the idea of tracking objects as a whole andinstead, tracks sub-features such as distinguishable points or lines on the object. The advantage ofthis approach is that even in the presence of partial occlusion, some of the features of the movingobject remain visible. Furthermore, the same algorithm can be used for tracking in daylight,twilight or night-time conditions; it is self-regulating because it selects the most salient featuresunder the given conditions.4
Fig. 1(B) shows feature tracking for the same two vehicles in the earlier example. Individualfeatures are highlighted at three instants in time and the lines indicate their respective tracks.5 Forillustration, the features from di�erent vehicles are shown with di�erent symbols, but, in practice,the features would be indistinguishable at the tracking level. By t3, some of the features from the®rst vehicle are occluded and lost, however, other features from this vehicle remain and continueto be tracked.While detecting and tracking vehicle features makes the system more robust to partial occlu-
sion, a vehicle will have multiple features. This introduces a new problem of grouping, i.e., what
4 For example window corners, bumper edges, etc. during the day and tail lights at night.5 To avoid confusion, ``tracjectory'' will be used when referring to entire vehicles and ``track'' will be used when
referring to vehicle features.
B. Coifman et al./Transportation Research Part C 6 (1998) 271±288 275

set of features belong to the same vehicle? To address this problem we use a common motionconstraint; features that are seen rigidly moving together are grouped together.Returning to the simple example once more, applying a common motion constraint to the
features in Fig. 1(B) and collecting the feature tracks into discrete vehicles yields Fig. 1(C). Theopen circles in this ®gure denote features that were lost to occlusion at some point in their track,and thus, not included in the ®nal grouping.
Fig. 1. (A) An example of region based tracking. By time t3, vehicle 2 has partially occluded vehicle 1, resulting inpotential segmentation problems. (B) An example of feature based tracking with features shown at three times. Note
that individual features are indistinguishable to the tracker, but are shown using di�erent symbols for illustration. (C)Features are grouped together based on common motion, avoiding segmentation problems due to occlusion. Becausethe features move together, one feature track is selected as being representative of the vehicle trajectory.
276 B. Coifman et al./Transportation Research Part C 6 (1998) 271±288

3. Feature based tracking algorithm
This section presents our vehicle tracking system, which includes: camera calibration, featuredetection, feature tracking, and feature grouping modules. First, the camera calibration is con-ducted once, o�-line, for a given location and then, the other modules are run continuously on-line in real-time.
3.1. O�-line camera de®nition
Before running the tracking and grouping system, the user speci®es camera-speci®c parameterso�-line. These parameters include:
1. line correspondences for a projective mapping, or homography, as explained below;2. a detection region near the image bottom and an exit region near the image top, and3. multiple ®ducial points for camera stabilization.
Since most road surfaces are ¯at, the grouper exploits an assumption that vehicle motion isparallel to the road plane. To describe the road plane, the user simply speci®es four or more line orpoint correspondences between the video image of the road (i.e. the image plane) and a separate`world' road plane, as shown in Fig. 2. In other words, the user must know the relative distance inworld coordinates between four points visible in the image plane. Ideally, this step involves a ®eldsurvey; however, it is possible to approximate the calculations using a video tape recorder, knownlane widths and one or more vehicles traveling at a constant velocity. The vehicle velocity canbe used to measure relative distance along the road at di�erent times and the lane widths yieldrelative distance between two points on the edge of the road, coincident with the vehicle'sposition.Based on this o�-line step, our system computes a projective transform, or homography, H,
between the image coordinates (x,y) and world coordinates (X,Y), (Fig. 2). This transformation isnecessary for two reasons. First, features are tracked in world coordinates to exploit knownphysical constraints on vehicle motion (e.g. ®nite acceleration). Second, the transformation isused to calculate distance based measures such as position, velocity and density. Once thehomography has been computed, the user can specify the detection region, exit region and ®ducialpoints in the image plane.
3.2. On-line tracking and grouping
A block diagram for our vehicle tracking and grouping system is shown in Fig. 3. First, the rawcamera video is stabilized by tracking manually chosen ®ducial points to subpixel accuracy andsubtracting their motion from the entire image. Second, the stabilized video is sent to a detectionmodule, which locates corner features in a detection zone at the bottom of the image. In ourdetection module, ``corner'' features are de®ned as regions in the gray level intensity image wherebrightness varies in more than one direction. This detection is operationalized by looking forpoints in the image, I, where the rank of the windowed second moment matrix, rI.rIT. is two(see Beymer et al., 1997). Fig. 4(A) shows some example corners detected by the system.
B. Coifman et al./Transportation Research Part C 6 (1998) 271±288 277

Next, these corner features are tracked over time in the tracking module. The tracking moduleuses Kalman ®ltering (Gelb, 1974) to predict a given corner's location and velocity in the nextframe, (X,Y, _X, _Y), using world coordinates. Normalized correlation6 is used to search a smallregion of the image around the estimate for the corner location. If the corner is found, the state ofthe Kalman ®lter is updated; otherwise, the feature track is dropped. Fig. 4(B) shows the tem-poral progression of several corner features in the image plane.Vehicle corner features will eventually reach a user de®ned exit region that crosses the entire
road near the top of the image (or multiple exit regions if there is an o� ramp). Once corner
Fig. 2. A projective transform, H, or homography is used to map from image coordinates, (x,y), to world coordinates,(X,Y).
6For normalized correlation, a 9�9 template of each corner is extracted when the corner is ®rst detected.
Fig. 3. Block diagram of the vehicle tracking system. In the future, we plan to add a vehicle classi®cation module, asindicated by the dashed lines.
278 B. Coifman et al./Transportation Research Part C 6 (1998) 271±288

Fig. 4. (A) Sample corner features identi®ed by the tracker. (B) Sample feature tracks from the tracker. (C) Samplefeature groups from the grouper.
B. Coifman et al./Transportation Research Part C 6 (1998) 271±288 279

features reach the exit region, they are grouped into vehicle hypotheses by the grouping module,e.g. Fig. 4(C). The grouper uses a common motion constraint to collect features into a vehicle:corner features that are seen as moving rigidly together probably belong to the same object. Inother words, features from the same vehicle will follow similar tracks and two such features willbe o�set by the same spatial translation in every frame. Two features from di�erent vehicles, onthe other hand, will have distinctly di�erent tracks and their spatial o�set will change from frameto frame. A slight acceleration or lane drift is su�cient to di�erentiate features between mostvehicles; note that both lateral and longitudinal motion are used to segment vehicles. Thus, inorder to fool the grouper, two vehicles would have to have identical motions during the entiretime they were being tracked. Typically, the tracking region is on the order of 100m along theroad. In congested tra�c, vehicles are constantly changing their velocity to adjust to nearbytra�c and remain in the ®eld of view for a long period of time, giving the grouper the informationit needs to perform the segmentation. In free ¯owing tra�c, vehicles are more likely to maintainconstant spatial headways, or spacings, over the short period of observation, making the commonmotion constraint less e�ective. Fortunately, under free ¯ow conditions, drivers take larger spacings(in excess of 30m), so a spatial proximity cue is added to aid the grouping/segmentation process.The grouper considers corner features in pairs. Initially points A and B that are less than a
prespeci®ed distance, ro, apart will be hypothesized to belong to the same vehicle. By monitoringthe distance, d(t)=pa(t)ÿpB(t), between the points, this hypothesis can be dismissed as soon asthe points are found to move relative to each other. The distance, d, is measured in the worldcoordinates by multiplying the image distance with a depth scaling factor computed from thehomography. More details can be found in Beymer et al. (1997).Because features must share a common motion to be grouped into a vehicle, one feature track
from each group is selected as being representative of the vehicle trajectory. In particular, thegrouper selects the feature point closest to the camera because it is likely to be near the groundplane and thus, is less likely to su�er from distortions due to the viewing angle. Finally, tra�cparameters such as ¯ow, average speed, and density are computed from the vehicle trajectories.
4. Real-time system
We have implemented the vehicle tracker on a network of 13 Texas Instruments C40 digitalsignal processing (DSP) chips. The computationally heavy operations in the tracking algorithm,convolution in the feature detector and correlation in feature tracker, are placed on the C40 net-work, while the grouper is run on the host PC. Running the grouper on the PC is necessitated bymemory requirements; the grouper needs to store feature tracks, which would quickly exhaust thelimited memory available on the C40 modules. Keeping the grouper on the PC is also bene®cialfrom a load balancing perspective, as the PC is a 150MHz Pentium and thus, equivalent to 3±4C40's.The performance of the vehicle tracker is 7.5Hz in uncongested tra�c, dropping to 2Hz in
congested tra�c (i.e. near jam density), where many more feature tracks are in progress at anygiven time. This reduction in computational speed does not of itself lead to a reduction in per-formance of the vehicle tracker. Vehicle speeds in congested tra�c are slower, and so the requiredtracking rate is reduced.
280 B. Coifman et al./Transportation Research Part C 6 (1998) 271±288

5. Measuring tra�c parameters using an wide-area detector
Traditional tra�c parameters such as ¯ow, occupancy and velocity are usually de®ned withrespect to point detectors and they are only averaged over time. The vehicle tracker extractsvehicle trajectories over a signi®cant distance and is a true wide-area detector. Using the tradi-tional point based de®nitions would mean discarding information available from the detector.Instead, it is possible to measure the generalized tra�c parameters over the entire tracking regionand thus, average over time and space.Consider a region, A, in the time-space plane with m vehicle trajectories passing through it, as
shown in Fig. 5. Following Edie (1963), let d�A� be the sum of the distance traveled by all vehiclesin region A and t�A� be the sum of the time spent by all vehicles in region A (i.e. the vertical andhorizontal components of the trajectories within A, respectively). Finally, jAj let denote the `area'of region A, L�T, then, the generalized ¯ow, q�A�, density, k�A�, and velocity, v�A�, are de®nedas:
q�A� � d�a�jAj ; k�a� � t�A�
jAj ; ��A� � q�A�k�A� �
d�A�t�A� �1�
For the real-time system, the generalized parameters are measured for each lane using the entiretracking region, L, and user de®ned sample period, T. The de®nitions are robust to lane changes7,e.g. vehicle 3 leaving the lane and vehicle 5 entering the lane as shown in Fig. 5.Re®ning traditional metrics is only one aspect of the vehicle tracker. The vehicle trajectories
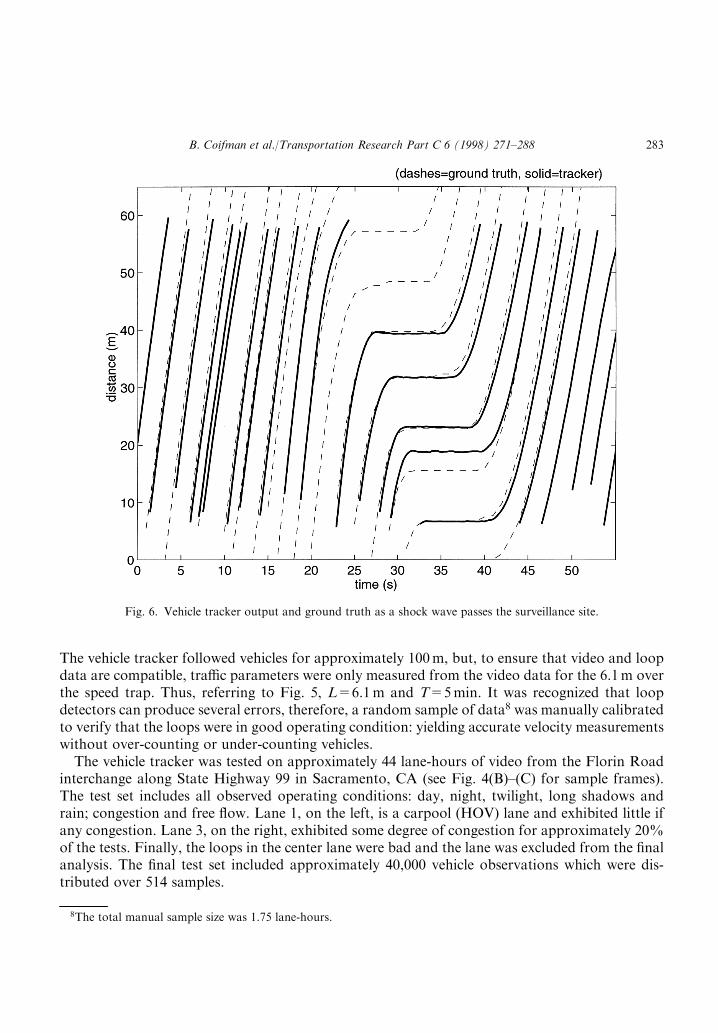
allow for new approaches to measuring tra�c and ultimately, better automated surveillance.Fig. 6 shows the time space diagram for vehicle trajectories from a single lane as a shock wavepasses through the detection region [solid lines indicate the vehicle tracker output and dashedlines show manually generated ground truth (Coifman, 1997)]. Note that horizontal trajectoriescorrespond to stopped vehicles and the tracker did not lose them; also notice that the trackerfollowed almost all of the vehicles even though the tra�c momentarily reached jam density andmost of the vehicles were partially occluded. This ®gure only shows the longitudinal positionalong the roadway, the vehicle tracker also extracts the lateral position. Thus, it is a trivial matterto detect lane changes within the surveillance region.After the tracker has extracted the vehicle trajectories, it is possible to send this data over a low
bandwidth communications link for scene reconstruction and automated surveillance at a remotelocation. It is also possible to extract a vehicle signature for vehicle reidenti®cation at a down-stream site and measure section data such as travel time and O/D patterns (see Huang and Rus-sell, 1998); thus, making it possible to quantify conditions between detectors even if there are noobservable e�ects at the individual detector stations.
7Note, the precise lane change location depends on which feature's track is selected to represent the vehicle trajec-tory. The important property of these measures is that at any instant, a given vehicle will only be counted in a singlelane.
B. Coifman et al./Transportation Research Part C 6 (1998) 271±288 281

6. Testing results
The tracking and grouping system has gone through two major phases of testing. First, thesystem was tested o�-line, using pre-digitized video sequences, largely for development purposes.This testing gave us a `microscopic' view of the system, allowing us to analyze errors such as falsedetections, false negatives, and overgroupings. For space considerations, detailed results are notpresented here, the interested reader is referred to the full report, Malik et al. (1997). Second, thereal-time system was tested on a large data set to see if the system could accurately measureaggregate tra�c parameters.
6.1. On-line testing of tra�c parameters
The second phase of testing evaluated the on-line system's ability to measure aggregate tra�cparameters. In particular, we tested ¯ow, average velocity and density. These parameters arecomputed separately for each lane of tra�c and are sampled over a user speci®ed sample period(taken to be 5min in the included examples).Generating manual ground truth data is very time consuming and labor intensive. It was
decided to use existing loop detectors to verify the vehicle tracker over a large data set. Groundtruth data came from inductive loop speed trap data collected concurrently with the video data.Each lane of tra�c has two loops separated by 6.1m (20 ft) and vehicle arrivals were recordedevery 1/60 s. Although a paired loop speed trap is usually operated as a single point detector, thetesting methodology used the vehicle arrival data to apply Edie's method to the speed trap data.
Fig. 5. Region, A, in the time-space plane, bounded by the length of the detection region, L, and user de®ned sampleduration, T. This region is used to measure the generalized tra�c parameters for a single lane.
282 B. Coifman et al./Transportation Research Part C 6 (1998) 271±288
The vehicle tracker followed vehicles for approximately 100m, but, to ensure that video and loopdata are compatible, tra�c parameters were only measured from the video data for the 6.1m overthe speed trap. Thus, referring to Fig. 5, L=6.1m and T=5min. It was recognized that loopdetectors can produce several errors, therefore, a random sample of data8 was manually calibratedto verify that the loops were in good operating condition: yielding accurate velocity measurementswithout over-counting or under-counting vehicles.The vehicle tracker was tested on approximately 44 lane-hours of video from the Florin Road
interchange along State Highway 99 in Sacramento, CA (see Fig. 4(B)±(C) for sample frames).The test set includes all observed operating conditions: day, night, twilight, long shadows andrain; congestion and free ¯ow. Lane 1, on the left, is a carpool (HOV) lane and exhibited little ifany congestion. Lane 3, on the right, exhibited some degree of congestion for approximately 20%of the tests. Finally, the loops in the center lane were bad and the lane was excluded from the ®nalanalysis. The ®nal test set included approximately 40,000 vehicle observations which were dis-tributed over 514 samples.
Fig. 6. Vehicle tracker output and ground truth as a shock wave passes the surveillance site.
8The total manual sample size was 1.75 lane-hours.
B. Coifman et al./Transportation Research Part C 6 (1998) 271±288 283

Fig. 7. Scatter plots comparing tracker performance to loop detector ground truth, 44 lane-hours of data aggregated
into 5 min samples: (A) velocity, (B) ¯ow.
284 B. Coifman et al./Transportation Research Part C 6 (1998) 271±288
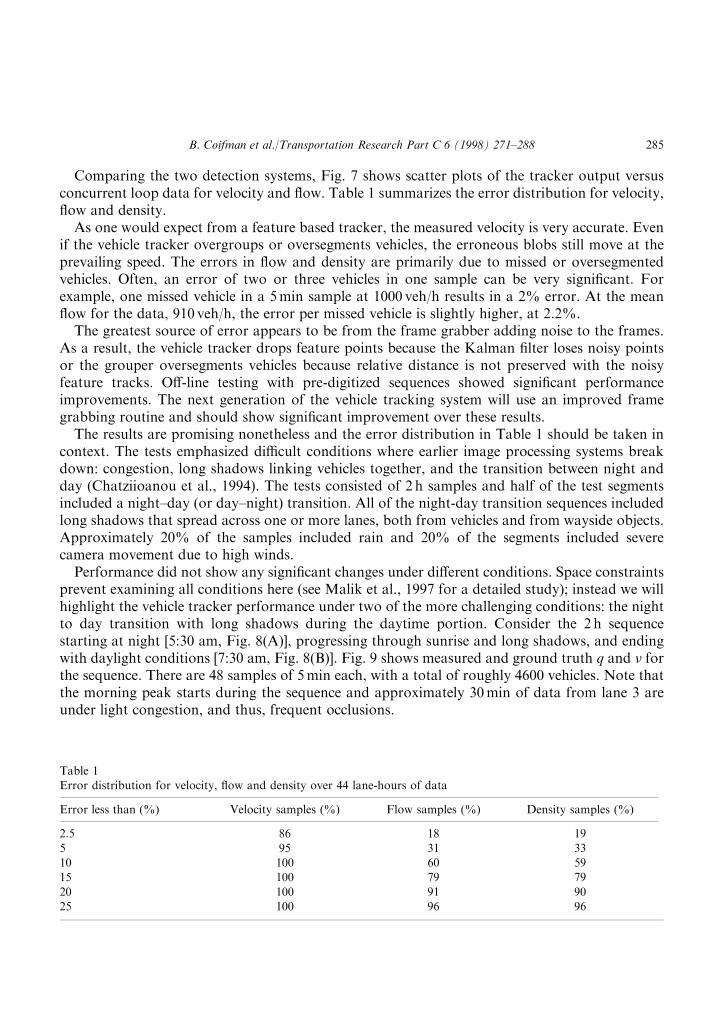
Comparing the two detection systems, Fig. 7 shows scatter plots of the tracker output versusconcurrent loop data for velocity and ¯ow. Table 1 summarizes the error distribution for velocity,¯ow and density.As one would expect from a feature based tracker, the measured velocity is very accurate. Even
if the vehicle tracker overgroups or oversegments vehicles, the erroneous blobs still move at theprevailing speed. The errors in ¯ow and density are primarily due to missed or oversegmentedvehicles. Often, an error of two or three vehicles in one sample can be very signi®cant. Forexample, one missed vehicle in a 5min sample at 1000 veh/h results in a 2% error. At the mean¯ow for the data, 910 veh/h, the error per missed vehicle is slightly higher, at 2.2%.The greatest source of error appears to be from the frame grabber adding noise to the frames.
As a result, the vehicle tracker drops feature points because the Kalman ®lter loses noisy pointsor the grouper oversegments vehicles because relative distance is not preserved with the noisyfeature tracks. O�-line testing with pre-digitized sequences showed signi®cant performanceimprovements. The next generation of the vehicle tracking system will use an improved framegrabbing routine and should show signi®cant improvement over these results.The results are promising nonetheless and the error distribution in Table 1 should be taken in
context. The tests emphasized di�cult conditions where earlier image processing systems breakdown: congestion, long shadows linking vehicles together, and the transition between night andday (Chatziioanou et al., 1994). The tests consisted of 2 h samples and half of the test segmentsincluded a night±day (or day±night) transition. All of the night-day transition sequences includedlong shadows that spread across one or more lanes, both from vehicles and from wayside objects.Approximately 20% of the samples included rain and 20% of the segments included severecamera movement due to high winds.Performance did not show any signi®cant changes under di�erent conditions. Space constraints
prevent examining all conditions here (see Malik et al., 1997 for a detailed study); instead we willhighlight the vehicle tracker performance under two of the more challenging conditions: the nightto day transition with long shadows during the daytime portion. Consider the 2 h sequencestarting at night [5:30 am, Fig. 8(A)], progressing through sunrise and long shadows, and endingwith daylight conditions [7:30 am, Fig. 8(B)]. Fig. 9 shows measured and ground truth q and � forthe sequence. There are 48 samples of 5min each, with a total of roughly 4600 vehicles. Note thatthe morning peak starts during the sequence and approximately 30min of data from lane 3 areunder light congestion, and thus, frequent occlusions.
Table 1Error distribution for velocity, ¯ow and density over 44 lane-hours of data
Error less than (%) Velocity samples (%) Flow samples (%) Density samples (%)
2.5 86 18 19
5 95 31 3310 100 60 5915 100 79 79
20 100 91 9025 100 96 96
B. Coifman et al./Transportation Research Part C 6 (1998) 271±288 285

Fig. 8. Two frames from the start and end of a continuous two hour sequence used to test the vehicle tracker, (A) 5.30
a.m. (B) 7.30 a.m.
Fig. 9. Time series ¯ow and velocity for the two hour night to day transition as shown in Fig. 8.
286 B. Coifman et al./Transportation Research Part C 6 (1998) 271±288

7. Conclusions
Recent evaluations of commercial VIPS found the existing systems have problems with con-gestion, occlusion, lighting transitions between night/day and day/night, camera vibration due towind, and long shadows linking vehicles together. We have presented a vehicle detection andtracking system that is designed to operate under these challenging conditions. Instead of trackingentire vehicles, vehicle features are tracked, which makes the system less sensitive to the problem ofpartial occlusion. The same algorithm is used for tracking in daylight, twilight and nighttime condi-tions, it is self-regulating by selecting the most salient features for the given conditions. Commonmotion over entire feature tracks is used to group features from individual vehicles and reduce theprobability that long shadows will link vehicles together. Finally, camera motion during highwind is accounted for by tracking a small number of ®ducial points.The resulting vehicle trajectories can be used to provide traditional tra�c parameters as well as
new metrics such as lane changes. The trajectories can be used as input to more sophisticated,automated surveillance applications, e.g. incident detection based on acceleration/decelerationand lane change maneuvers. The vehicle tracker is well suited both for permanent surveillanceinstallations and for short term tra�c studies such as examining vehicle movements in weavingsections. The vehicle tracking system can also extract vehicle signatures to match observationsbetween detector stations and quantify conditions over extended links.A real-time version of the system has been implemented using a network of DSP chips. The
system has been tested on approximately 44 lane-hours of data and has demonstrated good per-formance under the challenging conditions that have limited earlier VIPS.
Acknowledgements
This work was performed as part of the California PATH (Partners for Advanced Highways andTransit) Program of the University of California, in cooperation with the State of CaliforniaBusiness, Transportation and Housing Agency, Department of Transportation; and the UnitedStates Department of Transportation, Federal Highway Administration.
References
Baker, K, Sullivan, G. 1992. Performance assessment of model-based tracking. In: Proceedings of the IEEE Workshopon Applications of Computer Vision, Palm Springs, CA, pp. 28±35.
Beymer, D., McLauchlan, P., Coifman, B., Malik, J. 1997. A real-time computer vision system for measuring tra�c
parameters. In: Proceedings of the IEEE Computer Society Conference on Computer Vision and Pattern Recogni-tion, San Juan, Puerto Rico, pp. 495±501.
Chachich, A., Pau, A., Barber, A., Kennedy, K., Olejniczak, E., Hackney, J., Sun, Q., Mireles, E., 1996. Tra�c sensor
using a color vision method. In: Transportation Sensors and Controls: Collision Avoidance, Tra�c Management,and ITS, SPIE Proc. Vol. 2902, pp. 156±165.
Chao, T., Lau, B., Park, Y., 1996 Vehicle detection and classi®cation in shadowy tra�c images using wavelets andneural networks. In: Transportation Sensors and Controls: Collision Avoidance, Tra�c Management, and ITS,
SPIE Proc. Vol. 2902, pp. 136±147.
B. Coifman et al./Transportation Research Part C 6 (1998) 271±288 287

Chatziioanou, A., Hockaday, S., Ponce, L., Kaighn, S., Staley, C., 1994. Video Image Processing Systems Applications
in Transportation, Phase II. Final Report, California Polytechnic State Univ., San Luis Obispo, CA.Coifman, B., 1997. Time Space Diagrams for Thirteen Shock Waves, PATH Report No. UCB-ITS-PWP-97-1, Uni-versity of California, Berkeley, CA.
Condos, F., 1996. Tra�c surveillance and detection systems for intelligent transportation systems applications. In:Proceedings of the 1996 ITE Annual Conference, Minneapolis, MN, pp. 354±356.
Edie, L., 1963. Discussion of tra�c stream measurements and de®nitions. In: Proceedings of the Second InternationalSymposium on the Theory of Tra�c Flow, OECD, Paris, France, pp. 139±154.
Gelb, A., (ed.), 1974. Applied Optimal Estimation, MIT Press, Cambridge, MA.Hockaday, S., 1991. Evaluation of Image Processing Technology for Applications in Highway Operations-FinalReport, California Department of Transportation Technical Report 91-2. California Polytechnic State University.
Hoose, N., 1992. IMPACTS: an image analysis tool for motorway surveillance. Tra�c Engineering and Control 33(3),140±147.
Huang, T., Russell, S., 1998. Object identi®cation: A bayesian analysis with application to tra�c surveillance.. Arti®-
cial Intelligence 103, 1±17.JPL, 1997. Tra�c Surveillance and Detection Technology Development, Sensor Development Final Report, Jet Pro-pulsion Laboratory Publication No. 97±10.
Karmann, K., Brandt, A., 1990. Moving object recognition using an adaptive background memory. In: Cappellini, V.
(Ed.), Time-Varying Image Processing and Moving Object Recognition, vol. 2. Elsevier, Amsterdam.Kilger, M., 1992. A shadow handler in a video-based real-time tra�c monitoring system. IN: IEEE Workshop onApplications of Computer Vision, Palm Springs, CA, pp. 1060±1066.
Klein, L., Kelley, M., (Hughes Aircraft Company), 1996. Detection Technology for IVHS: Final Report, FHWAReport No. FHWA-RD-95-100.
Koller, D., Daniilidis, K., Nagel, H., 1993. Model-based object tracking in monocular image sequences of road tra�c
scenes.. International Journal of Computer Vision 10, 257±281..Koller, D., Weber, J., Malik, J., Robust multiple car tracking with occlusion reasoning. ECCV, Stockholm, Sweden,pp. 189±196.
Koller, D., Weber, J., Huang, T., Malik, J., Ogasawara, G., Rao, B., Russell, S., 1994b. Towards robust automatictra�c scene analysis in real-time. Vol.1, ICPR, Israel, pp. 126±131.
Malik, J., Beymer, D., Coifman, B., Huang, T., Lyddy, D., McLauchlan, P., Russell, S., Weber, J., 1997. Tra�c Sur-veillance and Detection Technology Development: New Tra�c Sensor Technology Final Report, PATH Report No.
UCB-ITS-PRR-97-6, University of California, Berkeley, CA.MNDOT, 1997. Field Test of Monitoring of Urban Vehicle Operations Using Non-Intrusive Technologies, FHWAReport No. FHWA-PL-97-018.
Nihan, N., Leth, M., Wong, A., 1995. Video Image Processing for freeway Monitoring and Control: Evaluation of theMobilizer, Washington State Department of Transportation Report No. WA-RD 398.1/TNW 95-03
Sullivan, G., 1992. Visual interpretation of known objects in constrained scenes.. Phil. Trans. Roy. Soc (B) 337, 361±
370.Zeng, N., Crisman, J., 1996. Evaluation of color categorization for representing vehicle colors. Transportation Sensorsand Controls: Collision Avoidance, Tra�c Management, and ITS, SPIE Proc 2902, 148±155.
288 B. Coifman et al./Transportation Research Part C 6 (1998) 271±288