a rapid multiclass method for antibiotic residues in goat
TRANSCRIPT

RESEARCH ARTICLE Open Access
A rapid multiclass method for antibioticresidues in goat dairy products by UPLC-quadrupole/electrostatic field orbitrap high-resolution mass spectrometryLu Zhang1* , Liang Shi2, Qiang He1 and Ying Li1
Abstract
Background: Sulfanilamides, quinolones, nitroimidazoles, tetracyclines, cephalosporins, macrolides, and β-lactam arecommon tools in agriculture and can be found in animal-based foods such as goat milk and goat dried milk. Toevaluate the risk of these species, reliable analytical methods are needed for accurate concentration determination,especially in goat milk and goat dried milk.
Method: We describe a method based on PRiME extraction coupled with UPLC-quadrupole/electrostatic fieldorbitrap high-resolution mass spectrometry to accomplish this task.
Result: Under optimal conditions, the limit of quantification for all antibiotics was 0.5–100 μg/L in goat milk andgoat dried milk samples. The recoveries were 60.6–110.0% for goat milk and 60.1–109.6% for goat dried milk with acoefficient of variation less than 15%. The detection limits were 0.5–1.0 μg/kg. The limits of quantification for theanalytes were 5.0–10.0 μg/kg. Finally, the method was used to screen veterinary antibiotics in 50 local goat milkand goat dried milk samples; metronidazole and enrofloxacin were detected in goat milk.
Conclusion: This method offers good reliability and the capacity for simultaneous detection can be used to detectresidual contents and evaluate health risks in goat milk and goat dried milk.
IntroductionVeterinary antibiotics are widely used to prevent infec-tions, increase reproduction, and improve animal hus-bandry (Han et al. 2015; Javorska et al. 2017; Li et al.2016; Tran et al. 2016; Reinholds et al. 2016; Serra-Compte et al. 2017; Cámara et al. 2013). However, thesedrugs are often used in discriminately in cattle and goatfeeding (Zorraquino et al. 2011), which can lead to ad-verse human health effects, especially for infants andchildren who consume large amounts of dairy products(Li et al. 2019; Li et al. 2017).To ensure the safety of human food, several countries
have established stringent food safety regulations for
these antibiotics in animal-based foods such as eggs,milk, kidney, liver, fat, and muscle (Han et al. 2012). Forexample, the maximum residue limits (MRLs) of benzyl-penicillin, chlortetracycline, and danofloxacinin bovinemilk are 4 μg/kg, 100 μg/kg, and 30 μg/kg, respectively,via the European Commission (Directives2006/141/ECand2003/89/EC). China’s MRL are published (GB31650-2019 National food safety standard-Maximumresidue limits for veterinary drugs in foods 2020) and setthe MRLs for benzylpenicillin, ampicillin, and moxicillinat 4 μg/kg. Other MRLs in bovine milk include 25 μg/kgsulfadimidine; 30 μg/kg oxacillin, danofloxacin, and clox-acillin; 40 μg/kg erythromycin; 50 μg/kg flumequine, tri-methoprim, tilmicosin, and sulfonamides (parent drug);
© The Author(s). 2021 Open Access This article is licensed under a Creative Commons Attribution 4.0 International License,which permits use, sharing, adaptation, distribution and reproduction in any medium or format, as long as you giveappropriate credit to the original author(s) and the source, provide a link to the Creative Commons licence, and indicate ifchanges were made. The images or other third party material in this article are included in the article's Creative Commonslicence, unless indicated otherwise in a credit line to the material. If material is not included in the article's Creative Commonslicence and your intended use is not permitted by statutory regulation or exceeds the permitted use, you will need to obtainpermission directly from the copyright holder. To view a copy of this licence, visit http://creativecommons.org/licenses/by/4.0/.
* Correspondence: [email protected] Centre of Xi’an Customs District P. R. China, Xi’an 710068, ChinaFull list of author information is available at the end of the article
Journal of Analytical Scienceand Technology
Zhang et al. Journal of Analytical Science and Technology (2021) 12:14 https://doi.org/10.1186/s40543-021-00268-4

100 μg/kg sulfonamides (expect sulfadimidine), tylosin,enrofloxacin, and ceftiofur; 150 μg/kg lincomycinas; and200 μg/kg spiramycin. These MRLs are quite low; thus,a sensitive and selective analytical method is needed.Liquid chromatography-tandem mass spectrometry
(LC-MS/MS) is a common tool in the analysis of veter-inary residues. Most studies of trace antibiotic levels arebased on triple quadrupole (TQ) mass spectrometry(Heller et al. 2006; Zorraquino et al. 2011; De Almeidaet al. 2015; Liu et al. 2016; Li et al. 2017; Zhang et al.2016; Forgacsova et al. 2019; Oyedeji et al. 2019; Kaza-kova et al. 2018; Socas-Rodríguez et al. 2017; Li et al.2018). Multiple reaction monitoring (MRM) and selectedreaction monitoring (SRM) are usually the standardquantification method. However, matrix effects and ioninterference in TQ-MS remain due to complicated foodcomposites. For better confirmation at ion and higherthroughout in analysis of multi-residue veterinaries,liquid-chromatography-high resolution mass spectrom-etry (LC-HRMS) has become increasingly popular, spe-cifically time-of-flight mass spectrometry (Li et al. 2016;Li et al. 2016; Berendsen et al. 2017; Zhang et al. 2015;Liu et al. 2019; Fu et al. 2018; Emhofer et al. 2019; Wenget al. 2020; Moreno-González et al. 2017; Pan et al.2016; Saito-Shida et al. 2018) and quadrupole/electro-static field orbitrap mass spectrometry (Jia et al. 2014b;Hu et al. 2019; Zhao et al. 2017; Jia et al. 2014a; Casadoet al. 2018; Paepe et al. 2019; Jia et al. 2017; Casado et al.2018; Jia et al. 2018a, 2018b; Jia et al. 2018a, 2018b;Casado et al. 2019; Rusko et al. 2019; Abdallah et al.2019; López-García et al. 2017; Paepe et al. 2018; Kimet al. 2018; Jia et al. 2017).Recently, new pre-treatment methods have been pro-
posed for extraction and clean-up of each class of veter-inary antibiotic residues in food samples. These includeliquid-liquid extraction (LLE) for macrolides extractionfrom milk samples (Şanli et al. 2011) as well as a modi-fied QuEChERS and solid-phase extraction (SPE) or dis-persive SPE for clean-up of complex food samples(Junza et al. 2011; Jia et al. 2014a; Kaufmann and Wid-mer 2013; Dubreil-Chéneau et al. 2014; Heller et al.2006; Chen et al. 2017). More recently, a novelphospholipids-removing SPE column–PriME HLB wasdeveloped based on the specific adsorption for phospho-lipids carrying fatty acid chains. In contrast to traditionalSPE methods, this procedure removes interferences, fats,and phospholipids while simultaneously extracting mul-tiple veterinary residues from milk and dried milk in oneloading step; the method is convenient, fast, affordable,and green.The objective of this study is to establish an effective
method to simultaneously determine 60 selected veterin-ary antibiotic residues, including 17 sulfanilamides, 16quinolones, 7 nitroimidazoles, 3 tetracyclines, 2
cephalosporins, 8 macrolides, and 7 β-lactams, in milkand dried milk samples by UPLC-quadrupole/electro-static field orbitrap high-resolution mass spectrometry.The resulting method was then successfully used toscreen veterinary antibiotic residues in local goat milkand goat dried milk samples.
ExperimentalChemicals and reagentsWe obtained the following from Dr. Ehrenstorfer GmbH(Augsburg, Germany): sulfamerazine (SMZ), sulfathiazole,trimethoprim (TMP), sulfamethizole, sulfisoxazole (SIZ),sulfadiazine (SD), sulfachlorpyridazine, sulfamethoxydiazine,sulfadimethoxypyrimidine, sulfaquinoxaline, sulfadimoxine(SDM), sulfamethoxypyridazine, sulfamethazine, sulfapyri-dine (SPD), sulfamethoxazole (SMX), sulfaguanidine, sulfa-phenazole, lomefloxacin (LOM), ciprofloxacin (CIP),enrofloxacin (ENR), ofloxacin (OFX), norfloxacin (NOR),orbifloxacin (ORB), danofloxacin (DAN), sparfloxacin (SPA),sarafloxacin (SAR), marbofloxacin (MAR), enoxacin (ENO),flumequine (FLU), fleroxacin (FLE), difloxacin (DIF), pefloxa-cin (PEF), nalidixic acid, erythromycin, lincomycin (LIN),spiramycin, roxithromycin, tilmicosin (TIL), tylosin (TYL),clindamycin, kitasamycin, dimetridazole, hydroxymetronida-zole, ipronidazole-OH, ipronidazole, ornidazole, metronida-zole, 2-methyl-5-nitroimidazole, chlortetracycline (CLT),doxycycline (DOX), demeclocycline (DEM), ceftiofur (TIL),cefapirin, oxacillin (OXAC), dicloxacillin (DICL), cloxacillin(CLOX), nafcillin (NAFC), ampicillin (AMPI), penicillin G(PEG), and penicillin V (PEV).Acetonitrile and methanol were HPLC gradient grade
and purchased from Merck (Darmstadt, Germany). For-mic acid and acetic acid were purchased from Anpu(Shanghai, China), and doubly deionized water was ob-tained from a Milli-Q gradient water system (Milipore,Bedford, MA).Stock solutions of individual compounds were pre-
pared in methanol (1000 mg L−1) and stored at − 20 °Cin dark glass bottles during the three-month validityperiod. The working mixed standard solution was thendiluted with 0.1% formic acid solution and kept at − 20°C in dark glass bottles for one month. PRiME HLB solidphase extraction cartridges (60 mg, 3CC) were obtainedfrom Waters (Milford, USA).
Sample preparationGoat milk sampleThe target analytes were extracted from 1 g of milk sam-ple with 4 mL of 0.2% formic acid/acetonitrile solutionand vortexed for 30 s. The mixture was then shaken for30 min and centrifuged at 10,000 r/min for 10 min at 4°C. The total supernatant fraction was directly loaded ona PRiME HLB. All elutes were collected in a centrifugaltube and evaporated under nitrogen gas at 40 °C. The
Zhang et al. Journal of Analytical Science and Technology (2021) 12:14 Page 2 of 16

Table
1UPLC-quadrup
ole/electrostatic
field
orbitrap
parametersof
the60
veterin
aryantib
iotic
residu
es
No.
Com
pou
ndRT (m
in)
Elem
ental
composition
Ionization
mod
eTh
eoreticalp
recu
rsor
(m/
z)Mea
suredprecu
rsor
(m/
z)Accuracy(△p
pm)
Prod
uction
1(m
/z)
Prod
uction
2(m
/z)
NCD
1Sulfagu
anidine
1.13
C7H
10N4O
2S[M
+H]+
215.05972
215.05916
−2.60
158.02707
149.02336
20
2Metronidazole-OH
1.47
C6H
9N3O
4[M
+H]+
188.06658
188.06615
−2.29
123.05563
126.03013
35
32-Methyl-5-nitroimidazole
1.50
C4H
5N3O
2[M
+H]+
128.04545
128.04562
1.33
98.04795
111.04313
90
4Metronidazole
1.83
C6H
9N3O
3[M
+H]+
172.07167
172.07126
−2.38
128.04578
–20,40,
60
5Cefapirin
2.02
C17H17N3O
6S2
[M+H]+
424.06315
424.06180
−3.18
292.0575
320.05334
16
6Sulfadiazine
2.34
C10H10N4O
2S[M
+H]+
251.05972
251.05910
−2.47
156.01151
98.98463
30
7Dim
etrid
azole
2.50
C5H
7N3O
2[M
+H]+
142.0611
142.06088
−1.55
95.06079
56.05011
70
8Sulfathiazole
2.77
C9H
9N3O
2S2
[M+H]+
256.02089
256.02014
−2.93
156.01149
108.04473
20,40,
60
9Sulfapyrid
ine
2.81
C11H11N3O
2S[M
+H]+
250.06447
250.06380
−2.68
156.01157
184.08719
35
10Lincom
ycin
2.86
C18H34N2O
6S[M
+H]+
407.22103
407.21994
−2.68
126.12802
–20,40,
60
11Sulfamerazine
2.96
C11H12N4O
2S[M
+H]+
265.07537
265.07462
−2.83
156.01152
190.02831
35
12Ampicillin
2.97
C16H19N3O
4S[M
+H]+
350.1169
350.11603
−2.48
106.0655
192.04791
20
13PenicillinG
2.98
C16H18N2O
4S[M
+H]+
335.106
335.10513
−2.60
128.05305
91.05464
50
14Trim
etho
prim
3.01
C14H18N4O
3[M
+H]+
291.14517
291.14441
−2.61
123.06679
261.09839
50
15Enoxacin
3.02
C15H17FN
4O3
[M+H]+
321.13575
321.13498
−2.40
206.07185
250.06224
60
16Marbo
floxacin
3.04
C17H19FN
4O4
[M+H]+
363.14631
363.14532
−2.73
72.08136
261.10376
20,40,
60
17Norfloxacin
3.05
C16H18FN
3O3
[M+H]+
320.1405
320.13971
−2.47
205.0784
233.10873
60
18Ofloxacin
3.07
C18H20FN
3O4
[M+H]+
362.15106
362.15015
−2.51
318.16141
261.10361
35
19Pefloxacin
3.08
C17H20FN
3O3
[M+H]+
334.15615
334.15521
−2.81
233.1087
205.07704
60
20Fleroxcain
3.08
C17H18F 3N3O
3[M
+H]+
370.1373
370.13626
−2.81
326.14755
269.08969
35
21Ciprofloxacin
3.08
C17H18FN
3O3
[M+H]+
332.1405
332.13953
−2.92
231.05676
98.9846
60
22Danofloxacin
3.12
C19H20FN
3O3
[M+H]+
358.15615
358.15521
−2.62
82.06564
96.08123
60
23Sulfadimetho
xine
3.11
C12H14N4O
2S[M
+H]+
279.09102
279.09018
−3.01
204.04398
124.08715
35
24Lomefloxacin
3.13
C17H19F 2N3O
3[M
+H]+
352.14672
352.14584
−2.50
265.1149
308.15735
35
25Sulfamethizole
3.16
C9H
10N4O
2S2
[M+H]+
271.03179
271.03110
−2.55
156.01154
108.04475
20,40,
60
26Ipronidazole-OH
3.16
C7H
11N3O
3[M
+H]+
186.08732
186.08690
−2.26
168.07701
82.06566
20,40,
60
27Sulfametho
xydiazine
3.16
C11H12N4O
3S[M
+H]+
281.07029
281.06946
−2.95
156.01154
126.06644
30
28Enrofloxacin
3.17
C19H22FN
3O3
[M+H]+
360.1718
360.17081
−2.75
245.10895
203.06152
60
29Sulfametho
xypyrid
azine
3.19
C11H12N4O
3S[M
+H]+
281.07029
281.06949
−2.85
156.01152
108.04471
30
Zhang et al. Journal of Analytical Science and Technology (2021) 12:14 Page 3 of 16

Table
1UPLC-quadrup
ole/electrostatic
field
orbitrap
parametersof
the60
veterin
aryantib
iotic
residu
es(Con
tinued)
No.
Com
pou
ndRT (m
in)
Elem
ental
composition
Ionization
mod
eTh
eoreticalp
recu
rsor
(m/
z)Mea
suredprecu
rsor
(m/
z)Accuracy(△p
pm)
Prod
uction
1(m
/z)
Prod
uction
2(m
/z)
NCD
30Ornidazole
3.21
C7H
10ClN
3O3
[M+H]+
220.04835
220.04778
−2.59
128.04572
–35
31Orbifloxacin
3.22
C19H20F 3N3O
3[M
+H]+
396.15295
396.15186
−2.75
295.10544
352.16312
35
32Dem
ethylchlortetracycline
3.28
C21H21ClN
2O8
[M+H]+
465.10592
465.10463
−2.77
448.07971
430.06918
20
33Sparfloxacin
3.32
C19H22F2N4O
3[M
+H]+
393.17327
393.17212
−2.92
292.12558
349.18362
35
34Sarafloxacin
3.30
C20H17F 2N3O
3[M
+H]+
386.13107
386.13007
−2.59
299.09912
342.14148
35
35Spiramycin
3.34
C43H74N2O
14[M
+H]+
843.52128
843.51898
−2.73
174.11266
142.12254
20
36Difloxacin
3.34
C21H19F 2N3O
3[M
+H]+
400.14672
400.14578
−2.35
299.0993
356.1571
40
37Sulfachlorpyridazine
3.34
C10H9ClN
4O2S
[M+H]+
285.02075
285.02002
−2.56
156.01147
108.04472
20,40,
60
38Nafcillin
3.36
C21H22N2O
5S[M
+H]+
415.13222
415.13104
−2.84
128.0531
256.0975
40
39Chlorotetracycline
3.34
C22H23ClN
2O8
[M+H]+
479.12157
479.12003
−3.21
462.095
444.08493
20
40Sulfametho
xazole
3.40
C10H11N3O
3S[M
+H]+
254.05939
254.05869
−2.76
156.01154
108.04475
35
41Clindamycin
3.41
C18H33ClN
2O5S
[M+H]+
425.18715
425.18610
−2.47
126.12799
–20,40,
60
42Sulfadimetho
xypyrim
idine
3.41
C12H14N4O
4S[M
+H]+
311.08085
311.07993
−2.96
156.0769
108.04472
35
43Sulfisoxazole
3.49
C11H13N3O
3S[M
+H]+
268.07504
268.07425
−2.95
156.01155
113.07126
20
44Ipronidazole
3.58
C7H
11N3O
2[M
+H]+
170.0924
170.09193
−2.76
109.07641
84.08131
60
45Doxycycline
3.50
C22H24N2O
8[M
+H]+
445.16054
445.15936
−2.65
428.13425
359.02859
20
46Ceftio
fur
3.50
C19H17N5O
7S3
[M+H]+
524.03629
524.03522
−2.04
241.03911
210.02065
20
47Sulfadimoxine
3.65
C12H14N4O
4S[M
+H]+
311.08085
311.07993
−2.96
156.01155
108.04476
35
48Sulfaqu
inoxaline
3.66
C14H12N4O
2S[M
+H]+
301.07537
301.07458
−2.62
156.0112
108.0445
35
49Sulfaph
enazole
3.68
C15H14N4O
2S[M
+H]+
315.09102
315.09003
−3.14
265.1149
308.15735
35
50Tilm
icosin
3.69
C46H80N2O
13[M
+H]+
869.57332
869.57434
1.17
174.11258
694.46985
30
51PenicillinV
3.69
C16H18N2O
5S[M
+H]+
351.10092
351.09982
−3.13
229.06467
257.05951
19
52Erythrom
ycin
3.83
C37H67NO13
[M+H]+
734.46852
734.46637
−2.93
158.11775
576.37396
15
53Tylosin
3.91
C46H77NO17
[M+H]+
916.52643
916.52716
0.80
174.11261
88.07617
20,40,
60
54Nalidixicacid
3.99
C12H12N2O
3[M
+H]+
233.09207
233.09232
1.07
205.06107
187.05046
60
55Oxacillin
4.01
C19H19N3O
5S[M
+H]+
402.11182
402.11185
0.07
160.04289
243.07666
17
56Flum
equine
4.06
C14H12NO3F
[M+H]+
262.0874
262.08774
1.30
220.04066
238.05119
70
57Cloxacillin
4.18
C19H18ClN
3O5S
[M+H]+
436.07285
436.07355
1.61
178.00571
220.01628
20
58Dicloxacillin
4.43
C19H17Cl 2N3O
5S[M
+H]+
470.03387
470.03674
6.11
160.04286
310.99814
15
59Ro
xithromycin
4.46
C41H76N2O
15[M
+H]+
837.53185
837.5387
8.18
679.43811
158.11763
15
60Josamycin
4.79
C42H69NO15
[M+H]+
828.474
828.47449
0.59
174.11267
109.06515
20
Zhang et al. Journal of Analytical Science and Technology (2021) 12:14 Page 4 of 16

residue was added to 1 mL acetonitrile: 0.1% formic acidsolution (1:9, v/v) and filtered with a 0.22-μm filtermembrane. The final extract solution was transferred tovial and injected into UPLC-quadrupole/electrostaticfield orbitrap mass spectrometer system under full ms/dd-ms2 optimized conditions for each compound.
Goat dried milkThe goat dried milk (0.45 g) was weighed in a centrifuge tube(50 mL) and dissolved with 3 mL water (40–50 °C). Next, 7mL of acetonitrile with 0.2% formic acid was added as an ex-traction solvent, and the tube was vigorously mixed for 30 s.The tube was then immediately shaken for 30 min and thencentrifuged for 20 min at 10,000 r/min at 4 °C. The upperlayer was submitted to a PRiME HLB. All elutes were col-lected into a centrifugal tube and evaporated under nitrogengas at 40 °C. The residue was added with 1 mL acetonitrile:0.1% formic acid solution (1:9, v/v), and filtered with a 0.22-μm filter membrane. The final extract solution was analyzedlike the goat milk samples.
UPLC-quadrupole /electrostatic field orbitrap massanalysisThe analytes were measured with an ultra-high perform-ance liquid chromatography system (Ultimate 3000,USA) coupled with a quadrupole/electrostatic field orbi-trap mass spectrometer (Thermo &Fisher Q Exactive,USA). A Thermo Hypersil GoldaQ (2.1 × 100 mm, 1.9μm) column was used for separation. Mobile phase con-sisting of elute A (water, 0.1% formic acid) and elute B(acetonitrile) was used at a flow rate of 0.3 mL/min. Allanalytes were separated using gradient method: 0–1min: 10% B; 1–6 min: 10% B to 80% B; 6–8 min: 80% B;8.1–12 min: 10% B. The optimized sample injection vol-ume was set at 10 μL. All 62 target analytes ware elutedover 0–6 min while the last 6 min were used for columncleaning and re-equilibration.The quadrupole/electrostatic field orbitrap was equipped
with a heated electrospray ionization (HESI) source. Thetemperature of the HESI was 350 °C, the capillarytemperature was 320 °C, and the spray voltage was 3.8 kV
Table 2 Matrix effect (ME) for 60 veterinary antibiotic residues spiked in blank milk and milk power sample for individual donors (n= 5)
No. Compound Sample type No. Compound Sample type No. Compound Sample type
Milk Milkpower
Milk Milkpower
Milk Milkpower
10 μg/kg (ME%)
10 μg/kg (ME%)
10 μg/kg (ME%)
10 μg/kg (ME%)
10 μg/kg (ME%)
10 μg/kg (ME%)
1 Sulfaguanidine 115.2 90.6 21 Sulfamethizole 107.6 88.8 41 Ornidazole 106.1 88.8
2 2-Methyl-5-nitroimidazole
101.5 115.3 22 Sulfamethoxydiazine 93.5 99.9 42 Sulfamethoxazole 115.0 97.6
3 Metronidazole 100.9 117.0 23 Ciprofloxacin 93.5 92.8 43 Sulfisoxazole 114.0 99.6
4 Cefapirin 90.2 87.5 24 Dimetridazole 99.2 108.7 44 Ipronidazole 101.8 100.2
5 Sulfadiazine 118.8 115.0 25 Marbofloxacin 101.8 101.9 45 Doxycycline 102.6 114.1
6 Sulfapyridine 117.5 115.0 26 Fleroxcain 89.7 101.1 46 Ceftiofur 110.1 114.0
7 Lincomycin 104.8 107.6 27 Orbifloxacin 91.5 109.3 47 Sulfaquinoxaline 114.1 95.1
8 Sulfathiazole 109.3 114.5 28 Enrofloxacin 106.2 97.0 48 Sulfaphenazole 106.1 112.5
9 Sulfamerazine 94.4 114.0 29 Sulfamethoxypyridazine 85.7 104.3 49 Sulfadimoxine 105.6 97.2
10 Ampicillin 114.4 92.6 30 Sparfloxacin 96.1 114.0 50 Erythromycin 113.0 100.3
11 Penicillin G 109.4 111.1 31 Demethylchlortetracycline 102.3 114.8 51 Tilmicosin 101.3 111.5
12 Trimethoprim 101.4 104.5 32 Sulfachlorpyridazine 97.0 109.6 52 Penicillin V 107.2 112.0
13 Metronidazole-OH 110.4 113.0 33 Difloxacin 95.5 115.4 53 Tylosin 82.1 110.0
14 Norfloxacin 89.7 100.5 34 Chlorotetracycline 92.6 114.0 54 Flumequine 90.8 111.2
15 Lomefloxacin 106.5 94.4 35 Spiramycin 90.2 92.8 55 Nalidixic acid 86.3 102.1
16 Enoxacin 112.8 100.2 36 Ipronidazole-OH 104.3 99.4 56 Oxacillin 114.0 106.2
17 Ofloxacin 92.5 96.1 37 Sulfadimethoxypyrimidine 104.7 84.3 57 Cloxacillin 102.2 92.3
18 Pefloxacin 98.5 99.2 38 Sarafloxacin 92.5 110.0 58 Dicloxacillin 101.6 110.6
19 Danofloxacin 91.2 98.3 39 Nafcillin 98.8 94.5 59 Roxithromycin 100.7 106.4
20 Sulfadimethoxine 103.6 97.6 40 Clindamycin 105.4 113.0 60 Josamycin 96.3 107.7
Zhang et al. Journal of Analytical Science and Technology (2021) 12:14 Page 5 of 16

for positive mode. All other quantitative data were acquiredin full scan mode. Full MS/dd-MS2 was used for qualitativeanalysis. Precursor ions were selected by the quadrupole sentto the S-Lens in consideration of the detection of target ana-lytes. The productions were then obtained from fragmentedprecursor ions via normalized collision energy (NCE).The MS parameters of full MS/dd-MS2 were as fol-
lows: Full MS, inclusion on, resolution 70,000, maximumIT 200 ms, and AGC target 3.0e6. The dd-MS2 settingswere as follows: inclusion on, resolution17,500, max-imum IT 6 ms, AGC target 2.0e5, and isolation window2.0 m/z. The accurate masses for the precursor ions andproductions are shown in Table 1.
ValidationThe method was validated according to the EU Commission2002/657/EC. The blank milk matrix samples were carefullyselected to account for the possible variation within a givenmatrix(e.g., fat content, protein content, and other organics).The method was evaluated for linearity, limit of detection(LOD), precision, and accuracy. In the experiment, matrix-matched instead of internal standard was used because of thelevel of matrix effects can by significantly reduced by matrix-matched calibration curve (Table 2). At the same time,
internal standard can be found in a few antibiotics. A matrix-matched calibration curve was established for each targetantibiotics separately. Six calibration levels were prepared byspiking the blank matrix with each antibiotic. The coefficientsof determination (r2) were higher than 0.99 in all matrices.The veterinary antibiotics were divided into two groups ac-cording to the response value of each target analyte to massspectrometry. Group1 included erythromycin, spiramycin,roxithromycin, TIL, TYL, clindamycin, CLT, DEM, ceftiofur,cefapirin, OXAC, DICL, CLOX, NAFC, AMPI, PEG, andPEV with the following spiking levels: 10, 20, and 50 μg/kg.Group 2 included SMZ, sulfathiazole, TMP, sulfamethizole,SIZ, SD, sulfachlorpyridazine, sulfamethoxydiazine, sulfa-methazine, sulfaquinoxaline, SDM, sulfamethoxypyridazine,sulfadimethoxypyrimidine, SPD, SMX, sulfaguanidine, sulfa-phenazole, LOM, CIP ENR, OFX, NOR, ORB, DAN, SPA,SAR, MAR, ENO, FLU, FLE, DIF, PEF, nalidixic acid, LIN,dimetridazole, metronidazole-OH, ipronidazole-OH, iproni-dazole, ornidazole, metronidazole, 2-methyl-5-nitroimidazole,doxycycline, and josamycin with the following spiking levels:5, 10, and 20 μg/kg. The accuracy was determined with re-covery experiments using blank samples at LOQ spikinglevels in triplicate. The repeat ability was evaluated via therelative standard deviation (RSD, %). The limits of detection
Fig. 1 Separation of 60 veterinary antibiotic residues in Thermo Hypersil GOLD aQ
Zhang et al. Journal of Analytical Science and Technology (2021) 12:14 Page 6 of 16

(LOD) and quantification (LOQ) were defined as lowest con-centrations with a signal-to-noise (S/N) ratio of 3 for LOD or10 for LOQ.The matrix effect (ME) was investigated by comparing
the peak area of each antibiotic spiked in blank sampleafter extraction procedure at same concentration level,with peak area of each antibiotic in water (withoutmatrix matched) at the same concentration. The peakarea of each antibiotic in water was set at 100% (Javorskaet al. 2017).
Results and discussionOptimization of the UPLC-quadrupole/electrostatic fieldorbitrap conditionsUltra-performance chromatography columns with sub-2-μm particles have outstanding separation capacity.They have facilitated the development of quantificationmethods for multi-residues within a short run time.Here, different types of chromatographic columns wereinvestigated. Under the same determination conditions,DICL and PEV were weak retention on a WatersACQUITY UPLC® BEH Shield RP 18 (100 mm × 2.1mm, 1.7 μm), and CLOX and OXAC were unreservedon a Waters ACQUITY UPLC® HSS T3 column (100mm × 2.1 mm,1.8 μm). However, the Thermo HypersilGOLD aQ (100 mm × 2.1 mm, 1.9 μm) showed goodperformance in the separation of 60 veterinary antibi-otics. The analysis process was completed within 12 min(Fig. 1).
Different solvents were tested to achieve better separ-ation and retention of target analytes including cetoni-trile, methanol, and 0.1% formic acid aqueous solutions.There needed to be some compromise between mobilephase composition and MS response for the 60 selectedveterinary antibiotics. Consideration of the sensitivity (S/N) and the peak shape showed that the target analyteshad better performance in acetonitrile than in methanol.When the aqueous solution was water, the peaks ofquinolones, macrolides, and tetracyclines were asymmet-rical and heavy-trailed. However, the shape of peak andthe retention were well when formic acid was added intothe aqueous solution. This is because the addition of for-mic acid improved the ionization efficiency. Therefore,acetonitrile and 0.1% formic acid were selected as themobile phase.The optimum mass spectrometric parameters for the
identification and quantification of 60 veterinary antibi-otics were obtained after analyzing the compounds byflow injection analysis. The sensitivity of target analyteswas investigated via the chromatograms in full scanmode in positive ionization mode. Due to adduct forma-tion with formic acid, all analytes showed strong formic/hydrogen adduct species ([M + H]+ ); these species ap-pear to be the precursor ions in the mass spectrum. Thetarget analytes could achieve better base separation withthe interference peak. This was more efficient and low-ered the matrix effects, thereby leading to a resolution of70,000 versus 17,500.
Fig. 2 Comparison the effect of different SPE on phospholipids
Zhang et al. Journal of Analytical Science and Technology (2021) 12:14 Page 7 of 16

The full MS/dd-MS2 mode led to a productionspectrum with accurate mass measurement according tothe inclusion list (a list of targeted accurate masses).This was defined as a data-dependent acquisition (dd-MS2). After full scan analysis, specific mass windowswere extracted to screen the data for the presence ofanalytes. The effect of the isolation window on analyteselectivity was tested. The best results were achievedwhen an isolation window of 2.0 ppm was employed.Table 1 shows the optimal parameters of the UPLC-quadrupole/electrostatic field orbitrap.
Optimization of the extraction procedureAccording to these reports, milk and dried milk con-tained a great deal of phospholipids. Two different solid-phase extraction (SPE) columns (PRiME HLB and Oasis-HLB) were compared to reduce the phospholipids of themilk samples. Twelve blank milk samples were preparedfollowing the “Sample preparation” section; four of thesamples were not treated with solid phase extraction col-umns, four were treated with HLB, and the last fourwere purified with PRiME HLB. All of these sampleswere injected into a UPLC-quadrupole/electrostatic fieldorbitrap analysis in full MS mode to acquire identifiesphospholipids in milk.Although the high-resolution quadrupole/electrostatic
field orbitrap is selective, the complicated matrix canstill affect target analyte ionization; this leads to ion sup-pression or enhancement. The recovery of veterinary
antibiotics in the Oasis HLB column tailed off at 25%versus the PRiME HLB. Many components, such asphospholipids, aminoacids, and fat, in milk can lead tointerference of mass response. As such, these compo-nents were not effectively removed by the PRiME HLBcolumn.Figure 2 shows that the peak intensities of phospho-
lipids were significantly different among the three treat-ment modes. The peak intensities of these compoundswere not influenced by HLB purification in milk samplesversus untreated milk samples. The peak intensities ofphospholipids significantly decreased, which confirmedthat one step of pretreating milk samples by PRiMEHLB led to effective removal of phospholipids for thehigh-throughput detection of multiple veterinary anti-biotic residues.Previous studies showed that PRiME HLB removes
phospholipids from milk via a single pretreatment step.There are no pre-equilibration and washing steps beforeeluting from the SPE. The effects of purifying the phos-pholipids including via absorption were compared forthe SPE.Here, different extraction solvents (pure acetonitrile,
acetonitrile acidified with formic acid, or water) were eval-uated, considering the acidic or basic character of theseveterinary antibiotics. Commission Decision 2002/657/ECand GB/T 27404-2008 were used as guidelines to calculaterecoveries and matrix effects (Fig. 3). Many target analyteshad low recovery with 80% aqueous acetonitrile. Probably,
Fig. 3 Effect of different extraction solutions on the extraction properties (experiments were performed at spike levels of 10 g/kg for 60 veterinaryantibiotic residues)
Zhang et al. Journal of Analytical Science and Technology (2021) 12:14 Page 8 of 16

Table
3Validationparametersfor60
veterin
aryantib
iotic
residu
esat
threeconcen
trationlevelsin
blankmilk
samples
andmilk
powde
rsamples.
Peak
Com
pou
ndSa
mple
Line
arrang
e(μg/L)
Spikingleve
l(μg/kg)
Reco
very
(Mea
n±SD
%)
Intra-day
(RSD
,n=
6)Inter-da
y(RSD
,n=
3)LO
D(μg/kg)
LOQ(μg/kg)
R2
1Sulfagu
anidine
Milk
0.5–20
510
20105.4±8.6
101.8±6.5
99.4±5.4
8.5
9.2
6.6
9.2
9.0
5.5
0.5
5.0
0.9957
Milk
powde
r81.2±8.6
91.2±6.6
98.2±2.3
8.6
6.4
2.5
9.5
7.5
3.1
0.5
5.0
0.9901
22-Methyl-5-nitroimidazole
Milk
0.5–20
510
20104.4±5.5
107.1±4.2
90.6±0.5
5.4
4.4
0.4
6.0
2.4
2.0
0.5
5.0
0.9965
Milk
powde
r78.0±7.8
87.8±6.9
97.6±2.2
7.5
6.4
2.0
8.9
7.1
3.3
0.5
5.0
0.9959
3Metronidazole
Milk
0.5–20
510
2062.1±7.5
86.4±3.8
90.3±2.5
8.0
4.2
3.2
9.7
5.9
4.8
0.5
5.0
0.9932
Milk
powde
r70.5±4.6
95.5±4.5
97.2±1.7
4.9
4.4
2.1
5.8
5.7
2.9
0.5
5.0
0.9930
4Cefapirin
Milk
1–100
1020
50101.2±7.3
97.6±5.8
94.0±4.2
6.5
5.4
4.8
8.4
6.1
5.2
1.0
10.0
0.9919
Milk
powde
r65.9±9.0
80.5±6.2
86.4±3.8
9.5
6.8
4.2
10.1
7.4
5.1
1.0
10.0
0.9919
5Sulfadiazine
Milk
0.5–20
510
2082.3±9.5
110.0±7.4
97.7±7.4
9.5
8.2
7.8
9.4
9.7
8.4
0.5
5.0
0.9955
Milk
powde
r74.7±9.2
88.6±8.0
101.5±3.7
9.5
8.9
4.5
9.8
9.5
5.2
0.5
5.0
0.9992
6Sulfapyrid
ine
Milk
0.5–20
510
20103.5±8.6
109.3±8.8
98.2±8.5
8.5
9.2
8.5
9.8
9.5
9.5
0.5
5.0
0.9968
Milk
powde
r80.8±8.2
103.7±3.5
93.7±4.9
8.8
3.9
3.2
8.5
4.4
6.0
0.5
5.0
0.9937
7Lincom
ycin
Milk
0.5–20
510
20106.1±9.1
108.9±7.0
87.6±7.0
9.5
9.2
8.4
9.1
8.8
9.0
0.5
5.0
0.9925
Milk
powde
r73.6±3.8
89.7±3.8
97.8±1.6
4.5
4.1
2.3
5.9
6.2
3.4
0.5
5.0
0.9917
8Sulfathiazole
Milk
0.5–20
510
2096.0±9.5
106.3±8.1
98.2±5.4
8.9
7.5
5.1
10.5
9.2
6.4
0.5
5.0
0.9935
Milk
powde
r75.6±3.2
83.6±1.6
98.2±3.4
4.2
2.5
4.1
5.9
3.1
5.5
0.5
5.0
0.9906
9Sulfamerazine
Milk
0.5–20
510
2093.6±7.9
103.6±3.7
98.8±8.6
8.9
3.0
7.8
9.5
4.0
9.5
0.5
5.0
0.9936
Milk
powde
r82.2±7.9
94.3±3.9
97.2±2.4
8.4
4.9
1.5
9.4
5.2
2.6
0.5
5.0
0.9947
10Ampicillin
Milk
1–100
1020
5064.7±9.8
70.3±9.3
91.6±7.2
9.1
9.5
8.2
10.2
10.1
9.5
1.0
10.0
0.9945
Milk
powde
r63.0±8.8
66.9±4.5
107.4±0.9
9.0
5.1
1.1
10.1
5.4
2.6
1.0
10.0
0.9902
11PenicillinG
Milk
1–100
1020
5061.3±9.1
62.3±9.2
71.5±4.1
9.4
9.5
5.4
10.7
10.2
6.5
1.0
10.0
0.9929
Milk
powde
r60.7±4.9
64.1±3.5
66.4±1.3
5.2
3.9
2.1
6.2
5.1
3.8
1.0
10.0
0.9912
12Trim
etho
prim
Milk
0.5–20
510
2092.4±5.8
108.4±4.7
98.1±5.0
6.8
5.4
4.5
7.4
6.8
5.5
0.5
5.0
0.9933
Milk
powde
r108.4±5.6
97.5±3.5
96.7±2.4
5.9
4.2
3.0
6.9
5.1
4.0
0.5
5.0
0.9946
13Metronidazole-OH
Milk
0.5–20
510
20103.7±8.5
109.1±7.4
87.2±9.2
8.5
7.4
10.5
9.5
8.5
11.1
0.5
5.0
0.9958
Milk
powde
r75.2±3.8
77.1±3.5
102.0±1.7
4.8
4.1
2.3
5.9
4.5
3.1
0.5
5.0
0.9948
14Norfloxacin
Milk
0.5–20
510
2092.2±6.3
101.6±4.5
85.6±3.1
7.3
5.5
3.2
8.1
5.6
4.8
0.5
5.0
0.9945
Milk
powde
r79.4±6.2
95.7±5.5
101.0±4.7
6.8
5.9
4.8
7.5
6.9
5.4
0.5
5.0
0.9942
15Lomefloxacin
Milk
0.5–20
510
20106.1±6.5
107.1±5.7
91.8±4.7
7.1
6.5
5.7
8.5
7.8
6.5
0.5
5.0
0.9937
Milk
powde
r82.7±8.9
84.5±4.5
99.5±3.1
9.0
4.8
3.2
9.2
6.1
4.5
0.5
5.0
0.9913
16Enoxacin
Milk
0.5–20
510
2083.1±8.7
100.6±5.0
95.6±5.0
9.8
6.8
4.5
9.1
7.2
6.4
0.5
5.0
0.9946
Milk
powde
r103.4±8.4
104.7±4.6
98.9±3.4
8.9
5.2
3.9
9.8
6.5
4.8
0.5
5.0
0.9951
Zhang et al. Journal of Analytical Science and Technology (2021) 12:14 Page 9 of 16

Table
3Validationparametersfor60
veterin
aryantib
iotic
residu
esat
threeconcen
trationlevelsin
blankmilk
samples
andmilk
powde
rsamples.(Co
ntinued)
Peak
Com
pou
ndSa
mple
Line
arrang
e(μg/L)
Spikingleve
l(μg/kg)
Reco
very
(Mea
n±SD
%)
Intra-day
(RSD
,n=
6)Inter-da
y(RSD
,n=
3)LO
D(μg/kg)
LOQ(μg/kg)
R2
17Ofloxacin
Milk
0.5–20
510
20105.3±6.3
104.4±3.3
94.6±3.0
7.4
5.6
4.5
7.8
6.2
5.2
0.5
5.0
0.9938
Milk
powde
r108.3±5.3
103.2±3.2
98.0±3.0
5.8
4.2
3.5
6.9
5.2
4.5
0.5
5.0
0.9976
18Pefloxacin
Milk
0.5–20
510
20100.3±8.6
109.5±7.8
93.2±3.6
9.1
8.8
4.5
9.2
9.2
5.4
0.5
5.0
0.9948
Milk
powde
r94.3±4.8
96.5±1.9
99.3±1.2
5.0
2.1
1.5
6.5
3.5
2.9
0.5
5.0
0.9972
19Danofloxacin
Milk
0.5–20
510
2087.2±9.7
98.2±6.6
83.7±8.5
9.5
7.8
7.5
8.1
7.0
8.0
0.5
5.0
0.9948
Milk
powde
r77.3±7.8
85.5±6.3
95.2±5.5
8.0
6.5
5.7
9.5
8.7
6.3
0.5
5.0
0.9937
20Sulfadimetho
xine
Milk
0.5–20
510
2093.1±5.8
108.1±3.8
101.4±4.2
5.5
4.1
4.5
6.0
4.5
5.2
0.5
5.0
0.9937
Milk
powde
r85.9±9.1
90.6±7.7
94.7±4.5
9.5
7.9
4.9
9.8
9.4
7.1
0.5
5.0
0.9914
21Sulfamethizole
Milk
0.5–20
510
20106.7±8.0
109.4±5.3
98.2±4.0
9.5
6.4
5.1
9.8
7.0
5.5
0.5
5.0
0.9920
Milk
powde
r90.1±9.3
102.4±7.2
99.6±9.0
9.8
7.4
8.9
9.2
9.5
9.1
0.5
5.0
0.9908
22Sulfametho
xydiazine
Milk
0.5–20
510
20101.9±9.3
107.6±7.7
94.1±8.0
9.9
8.1
7.9
9.5
8.2
9.0
0.5
5.0
0.9936
Milk
powde
r86.5±9.8
95.9±4.6
105.3±3.6
9.8
5.0
3.5
9.9
6.5
4.1
0.5
5.0
0.9911
23Ciprofloxacin
Milk
0.5–20
510
2098.3±5.8
92.9±4.2
109.6±3.2
6.8
5.4
4.2
7.4
5.9
5.1
0.5
5.0
0.9947
Milk
powde
r98.0±8.2
99.4±4.4
107.5±2.6
8.4
4.7
3.0
9.8
6.4
4.9
0.5
5.0
0.9961
24Dim
etrid
azole
Milk
0.5–20
510
20102.8±7.5
108.3±8.9
92.3±9.5
8.5
8.5
9.8
8.5
9.5
9.2
0.5
5.0
0.9909
Milk
powde
r81.6±4.4
108.6±5.5
100.9±2.9
4.9
5.7
3.1
5.7
6.5
4.1
0.5
5.0
0.9948
25Marbo
floxacin
Milk
0.5–20
510
2090.8±8.5
108.0±5.1
94.8±5.2
9.1
6.5
5.4
11.5
7.5
6.8
0.5
5.0
0.9940
Milk
powde
r93.5±6.7
95.6±6.5
100.6±4.6
7.0
6.8
4.9
8.9
7.9
5.8
0.5
5.0
0.9970
26Fleroxcain
Milk
0.5–20
510
2071.8±7.7
104.0±5.5
95.4±6.5
8.9
6.5
7.4
8.9
8.4
7.9
0.5
5.0
0.9938
Milk
powde
r94.0±8.6
95.2±8.9
98.3±3.6
8.4
8.7
4.1
9.9
9.5
5.2
0.5
5.0
0.9942
27Orbifloxacin
Milk
0.5–20
510
2079.9±9.8
102.3±6.3
99.5±9.0
10.5
7.4
9.4
9.5
8.5
9.8
0.5
5.0
0.9938
Milk
powde
r75.4±9.2
85.7±7.7
95.7±4.9
9.5
7.9
5.1
9.8
9.1
6.8
0.5
5.0
0.9908
28Enrofloxacin
Milk
0.5–20
510
2091.2±9.2
106.4±9.6
88.5±9.3
9.5
9.8
9.9
9.1
9.9
9.5
0.5
5.0
0.9936
Milk
powde
r80.2±8.0
99.7±3.7
99.7±1.7
9.7
4.1
1.9
9.9
5.4
2.8
0.5
5.0
0.9968
29Sulfametho
xypyrid
azine
Milk
0.5–20
510
2066.5±8.9
103.9±6.0
90.6±7.6
9.1
6.9
7.0
9.2
8.9
7.5
0.5
5.0
0.9911
Milk
powde
r77.2±8.0
97.6±7.8
108.5±8.0
9.2
9.4
8.5
9.1
9.5
9.4
0.5
5.0
0.9945
30Sparfloxacin
Milk
0.5–20
510
2060.6±7.8
73.9±6.5
86.7±5.6
8.2
6.9
6.5
9.5
7.2
7.0
0.5
5.0
0.9936
Milk
powde
r83.8±4.5
94.7±4.0
105.2±3.6
4.9
4.2
4.0
5.8
5.2
5.0
0.5
5.0
0.9925
31Dem
ethylchlortetracycline
Milk
1–100
1020
5060.6±8.6
65.5±7.1
78.9±6.5
9.5
9.5
8.4
9.1
9.5
8.1
1.0
10.0
0.9958
Milk
powde
r75.2±8.4
77.7±9.0
76.1±8.2
8.9
10.5
9.4
9.1
9.5
7.9
1.0
10.0
0.9954
32Sulfachlorpyridazine
Milk
0.5–20
510
2087.9±9.4
98.5±7.8
99.8±7.7
9.5
8.2
7.9
9.1
8.0
8.0
0.5
5.0
0.9956
Milk
powde
r68.0±8.2
73.1±8.7
90.7±8.3
8.8
8.9
9.0
9.5
9.7
9.8
0.5
5.0
0.9980
Zhang et al. Journal of Analytical Science and Technology (2021) 12:14 Page 10 of 16

Table
3Validationparametersfor60
veterin
aryantib
iotic
residu
esat
threeconcen
trationlevelsin
blankmilk
samples
andmilk
powde
rsamples.(Co
ntinued)
Peak
Com
pou
ndSa
mple
Line
arrang
e(μg/L)
Spikingleve
l(μg/kg)
Reco
very
(Mea
n±SD
%)
Intra-day
(RSD
,n=
6)Inter-da
y(RSD
,n=
3)LO
D(μg/kg)
LOQ(μg/kg)
R2
33Difloxacin
Milk
0.5–20
510
2087.4±8.1
90.5±9.8
87.1±9.1
8.5
9.1
9.5
9.0
9.5
9.5
0.5
5.0
0.9944
Milk
powde
r85.2±3.4
97.0±2.9
103.6±2.5
3.9
2.8
2.9
4.5
3.4
3.0
0.5
5.0
0.9942
34Chlorotetracycline
Milk
1–100
1020
5070.3±9.1
72.8±8.3
94.7±5.1
9.5
8.7
5.6
9.7
9.2
6.4
1.0
10.0
0.9955
Milk
powde
r73.4±9.0
88.0±9.1
85.4±5.7
9.5
8.7
6.5
9.7
8.9
6.8
1.0
10.0
0.9901
35Spiramycin
Milk
1–100
1020
5071.7±9.6
76.6±9.2
107.8±8.5
9.6
8.2
9.5
9.7
8.8
9.7
1.0
10.0
0.9928
Milk
powde
r63.6±6.7
102.6±5.8
93.7±3.0
6.8
5.7
3.2
7.5
6.9
4.1
1.0
10.0
0.9998
36Ipronidazole-OH
Milk
0.5–20
510
2065.9±9.7
105.2±7.8
89.8±3.0
9.9
8.8
4.0
10.9
9.4
5.5
0.5
5.0
0.9907
Milk
powde
r71.9±9.4
97.9±9.1
102.3±7.5
9.5
9.1
8.0
10.9
10.5
9.0
0.5
5.0
0.9924
37Sulfadimetho
xypyrim
idine
Milk
0.5–20
510
20109.6±9.4
106.9±9.3
96.0±8.7
9.4
9.6
9.0
10.5
10.3
9.5
0.5
5.0
0.9939
Milk
powde
r73.1±7.6
84.1±6.4
107.5±6.1
7.8
6.8
6.5
8.5
7.2
7.0
0.5
5.0
0.9951
38Sa
raflo
xacin
Milk
0.5–
205
1020
82.6
±8.9
104.1±9.1
98.5
±9.2
8.7
8.9
8.7
9.5
9.1
9.5
0.5
5.0
0.99
42
Milk
pow
der
94.9
±6.5
97.5
±6.0
103.5±6.0
6.8
6.2
5.9
7.8
7.1
7.0
0.5
5.0
0.99
76
39Nafcillin
Milk
1–100
1020
5060.5±8.6
64.7±4.5
87.7±3.6
8.5
5.1
3.7
9.5
5.5
4.5
1.0
10.0
0.9943
Milk
powde
r60.4±1.0
60.1±1.2
60.8±1.3
1.5
1.4
1.1
2.5
2.3
2.1
1.0
10.0
0.9904
40Clindamycin
Milk
1–100
1020
5060.1±8.8
71.7±7.9
89.9±4.9
8.1
8.7
4.7
8.5
8.0
5.9
1.0
10.0
0.9951
Milk
powde
r80.6±5.5
94.3±3.7
92.3±2.5
6.0
4.0
3.0
7.8
5.4
4.2
1.0
10.0
0.9928
41Ornidazole
Milk
0.5–20
510
2095.1±9.8
108.5±8.7
89.2±9.6
9.5
9.1
8.9
10.5
9.9
9.8
0.5
5.0
0.9937
Milk
powde
r75.4±8.6
73.9±7.4
103.5±5.6
8.5
7.3
6.1
9.2
8.2
7.5
0.5
5.0
0.9998
42Sulfametho
xazole
Milk
0.5–20
510
2081.2±8.5
103.8±8.5
89.5±9.1
8.1
8.9
9.2
9.1
9.5
9.2
0.5
5.0
0.9927
Milk
powde
r67.2±9.0
81.9±6.4
101.0±2.6
9.8
6.9
3.2
9.1
7.8
4.5
0.5
5.0
0.9953
43Sulfisoxazole
Milk
0.5–20
510
2060.7±9.5
108.4±4.6
94.0±5.8
9.4
5.4
5.0
9.9
6.5
6.0
0.5
5.0
0.9910
Milk
powde
r95.0±9.2
90.0±5.6
96.2±3.3
9.5
6.1
3.4
9.9
7.8
4.5
0.5
5.0
0.9962
44Ipronidazole
Milk
0.5–20
510
2079.3±9.8
103.8±9.5
95.1±9.2
9.4
9.1
9.8
9.2
9.5
9.0
0.5
5.0
0.9933
Milk
powde
r84.6±5.6
104.6±4.8
96.1±3.2
5.9
5.1
3.5
7.1
6.4
4.1
0.5
5.0
0.9915
45Doxycycline
Milk
0.5–20
510
2081.4±8.8
100.5±8.1
95.6±8.4
8.2
8.5
8.4
9.1
9.5
9.1
0.5
5.0
0.9961
Milk
powde
r91.0±7.8
89.3±6.6
102.4±4.6
8.0
6.9
5.1
9.5
7.8
5.9
0.5
5.0
0.9910
46Ceftio
fur
Milk
1–100
1020
5091.5±9.5
98.2±7.6
105.1±5.5
9.6
8.1
5.6
9.7
9.1
6.1
1.0
10.0
0.9931
Milk
powde
r93.2±2.7
104.7±1.8
100.1±1.3
2.9
1.9
1.5
3.5
2.9
4.1
1.0
10.0
0.9916
47Sulfaqu
inoxaline
Milk
0.5–20
510
2082.9±8.7
89.0±6.6
105.4±5.5
9.1
6.8
6.1
9.8
7.2
6.5
0.5
5.0
0.9953
Milk
powde
r81.8±9.0
93.1±8.8
98.3±7.9
9.5
9.0
8.0
9.5
9.8
9.0
0.5
5.0
0.9960
48Sulfaph
enazole
Milk
0.5–20
510
2098.5±6.9
93.1±4.5
86.9±5.1
7.9
5.0
5.6
8.2
6.2
5.9
0.5
5.0
0.9937
Milk
powde
r87.4±9.6
94.0±6.4
101.3±4.8
9.8
6.5
5.0
10.2
7.0
6.5
0.5
5.0
0.9958
Zhang et al. Journal of Analytical Science and Technology (2021) 12:14 Page 11 of 16

Table
3Validationparametersfor60
veterin
aryantib
iotic
residu
esat
threeconcen
trationlevelsin
blankmilk
samples
andmilk
powde
rsamples.(Co
ntinued)
Peak
Com
pou
ndSa
mple
Line
arrang
e(μg/L)
Spikingleve
l(μg/kg)
Reco
very
(Mea
n±SD
%)
Intra-day
(RSD
,n=
6)Inter-da
y(RSD
,n=
3)LO
D(μg/kg)
LOQ(μg/kg)
R2
49Sulfadimoxine
Milk
0.5–20
510
2082.6±8.9
95.5±7.4
88.8±8.2
8.5
8.4
8.1
9.2
9.2
8.7
0.5
5.0
0.9954
Milk
powde
r87.1±8.7
91.2±6.3
96.9±2.9
8.8
6.5
3.1
8.9
7.5
4.3
0.5
5.0
0.9937
50Erythrom
ycin
Milk
1–100
1020
5062.1±8.4
64.3±7.4
84.8±5.4
8.1
8.4
5.5
9.0
8.9
5.5
1.0
10.0
0.9906
Milk
powde
r78.8±8.2
71.5±7.9
78.0±6.7
8.9
8.0
6.9
9.9
9.1
7.8
1.0
10.0
0.9903
51Tilm
icosin
Milk
1–100
1020
5077.3±8.5
80.0±7.5
108.6±7.1
8.1
7.5
8.1
9.1
7.5
8.9
1.0
10.0
0.9928
Milk
powde
r85.3±8.2
109.2±6.0
92.8±6.2
8.5
6.5
6.0
9.7
7.8
7.1
1.0
10.0
0.9931
52PenicillinV
Milk
1–100
1020
5061.9±8.3
69.8±7.3
79.7±5.5
8.6
7.1
6.1
9.5
9.5
6.8
1.0
10.0
0.9971
Milk
powde
r71.5±9.4
76.9±7.9
94.8±3.0
9.5
9.1
3.2
9.5
9.9
4.5
1.0
10.0
0.9903
53Tylosin
Milk
1–100
1020
5063.0±5.5
67.8±4.1
94.5±3.8
5.4
4.2
3.9
6.8
5.9
4.9
1.0
10.0
0.9943
Milk
powde
r88.2±8.6
98.2±7.4
90.8±3.4
8.8
7.8
3.5
9.9
8.5
4.0
1.0
10.0
0.9948
54Flum
equine
Milk
0.5–20
510
2073.4±5.4
103.4±4.9
85.1±3.6
6.1
5.1
3.9
7.8
6.9
5.5
0.5
5.0
0.9944
Milk
powde
r88.7±6.0
101.0±4.5
109.1±2.6
6.5
4.9
3.1
7.8
5.9
5.0
0.5
5.0
0.9961
55Nalidixicacid
Milk
0.5–20
510
2089.3±9.9
90.5±8.6
85.2±3.3
10.1
8.7
3.4
9.1
9.2
3.5
0.5
5.0
0.9959
Milk
powde
r86.6±8.4
88.8±3.3
102.2±2.1
9.0
3.8
2.5
9.9
4.8
3.1
0.5
5.0
0.9938
56Oxacillin
Milk
1–100
1020
5090.8±7.7
93.7±5.2
103.3±4.5
7.8
5.3
4.9
9.8
6.5
5.9
1.0
10.0
0.9950
Milk
powde
r64.7±9.5
85.1±9.8
102.7±1.8
9.9
9.1
2.5
9.4
9.0
3.5
1.0
10.0
0.9919
57Cloxacillin
Milk
1–100
1020
5070.3±7.9
82.2±6.5
83.7±3.5
7.5
6.4
3.2
8.9
7.2
4.9
1.0
10.0
0.9959
Milk
powde
r63.9±6.3
64.5±6.0
82.5±3.9
6.8
6.5
4.1
7.8
7.0
5.4
1.0
10.0
0.9910
58Dicloxacillin
Milk
1–100
1020
5094.7±9.4
103.1±7.2
101.5±7.2
9.5
8.2
8.1
9.9
9.5
9.0
1.0
10.0
0.9996
Milk
powde
r62.5±9.7
68.5±8.1
94.0±5.6
9.9
8.4
5.8
9.1
9.8
6.4
1.0
10.0
0.9906
59Ro
xithromycin
Milk
1–100
1020
5082.9±9.2
86.4±7.7
103.8±6.5
9.8
7.8
6.4
9.5
8.5
7.2
1.0
10.0
0.9946
Milk
powde
r77.8±4.7
100.1±2.6
102.1±2.0
5.1
2.9
2.5
6.5
3.8
3.1
1.0
10.0
0.9905
60Josamycin
Milk
0.5–20
510
2066.8±8.5
108.1±6.3
96.0±3.8
9.5
7.5
4.2
8.7
8.9
6.1
0.5
5.0
0.9948
Milk
powde
r78.1±4.0
86.7±2.0
95.7±3.0
4.5
2.5
3.9
5.9
3.8
4.8
0.5
5.0
0.9944
Zhang et al. Journal of Analytical Science and Technology (2021) 12:14 Page 12 of 16

the effect of precipitation of protein was weakened inacetonitrile aqueous solution, in which caused highermatrix effect and lower extraction recoveries. Acidicacetonitrile and pure acetonitrile both had good recoveriesfor most veterinary antibiotics. These results indicatedthat these solvents could prevent the interference of pro-teins and phospholipids. However, certain antibiotics (e.g.,cefapirin, penicillin G, demethylchlortetracycline, chloro-tetracycline, doxycycline, erythromycin, and penicillin V)had recoveries that were too low (below 50%) with pureacetonitrile. It was difficult to extract some highly polarcomponents such as β-lactams when the concentration ofacetonitrile in the solvent was too high. Therefore, acidicacetonitrile could be used for extraction. The 0.2% formicacid acetonitrile extracted more than 95% veterinary anti-biotics spiked into blank milk samples and precipitatedprotein in milk sample; these results were better than ex-tracted by pure acetonitrile.
Method validationPRiME HLB could eliminate the matrix effects, andmatrix-matched calibration was also used to reduce theimpact of matrix effects on precision and accuracy ofthe UPLC-quadrupole/electrostatic field orbitrap massmethod.The ME was calculated via the method in the “Valid-
ation” section. The result showed that the ME was estab-lished for each antibiotic spiked into milk and dried milk
sample was not higher than 15%. Therefore, the matrix-matched calibration was applied for these matrices in-stead of internal standard. The results showed thematrix matched calibration can corrected the level ofmatrix effects (Table 2).The resultant matrix-matched calibration curves using
the instrument response were linear from 0.5 to 20 μg/Lfor sulfanilamides, quinolones, and nitroimidazoles. Therange was 1–100 μg/L for tetracyclines, macrolides, andβ-lactams. The response function was linear with a coef-ficient (r2) of 0.9906–0.9971 for milk samples and0.9901–0.9998 for dried milk samples (Table 3).The sen-sitivity was evaluated via the limit of detection (LOD)and limit of quantification (LOQ). The LOQs were cal-culated at a signal-to-noise ratio (S/N) of 10; LODs usedS/N of 3. These data are shown in Table 3.The LODswere 0.5 to 1.0 μg/kg and the LOQs ranged from5.0 to10.0 μg/kg.The intra-day and inter-day relative standard devia-
tions (RSDs) were adopted for precision validation. Theintra-day precision was evaluated via three repeated ana-lyses at different concentrations on three sequential runswith six replicates. The inter-day precision was per-formed by analyzing spiked samples over five days. TheRSDs were 0.4% to 10.5% for intra-day and 2.0% to11.5% for inter-day experiments; these values were allless than 15%. It indicated that the developed methodwas reliable and reproducible within its analytical range.
Fig. 4 Example of typical chromatography and spectra from a full MS/dd-MS2 experiment: (A1) extracted ion chromatogram of enrofloxacin [M +H]+ m/z 360.17081 in sample N0. 17; (A2) dd-MS2 total ion chromatogram of enrofloxacin of [M + H]+ m/z 245.10895 in sample No. 17
Zhang et al. Journal of Analytical Science and Technology (2021) 12:14 Page 13 of 16
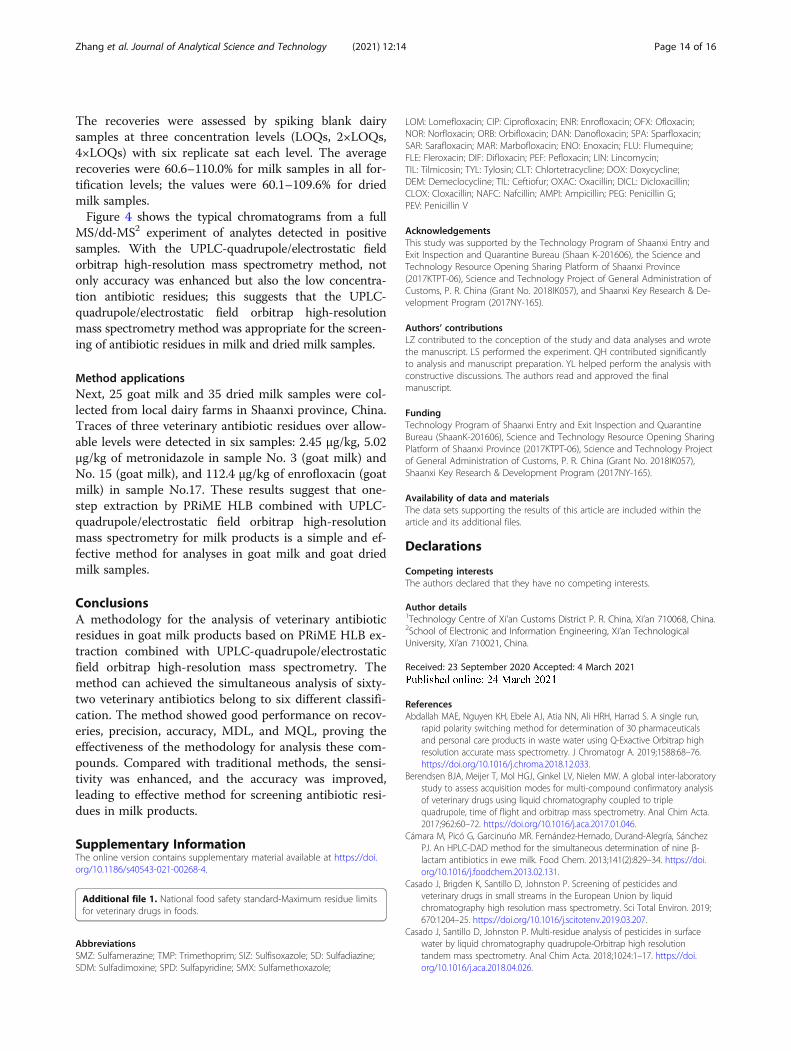
The recoveries were assessed by spiking blank dairysamples at three concentration levels (LOQs, 2×LOQs,4×LOQs) with six replicate sat each level. The averagerecoveries were 60.6–110.0% for milk samples in all for-tification levels; the values were 60.1–109.6% for driedmilk samples.Figure 4 shows the typical chromatograms from a full
MS/dd-MS2 experiment of analytes detected in positivesamples. With the UPLC-quadrupole/electrostatic fieldorbitrap high-resolution mass spectrometry method, notonly accuracy was enhanced but also the low concentra-tion antibiotic residues; this suggests that the UPLC-quadrupole/electrostatic field orbitrap high-resolutionmass spectrometry method was appropriate for the screen-ing of antibiotic residues in milk and dried milk samples.
Method applicationsNext, 25 goat milk and 35 dried milk samples were col-lected from local dairy farms in Shaanxi province, China.Traces of three veterinary antibiotic residues over allow-able levels were detected in six samples: 2.45 μg/kg, 5.02μg/kg of metronidazole in sample No. 3 (goat milk) andNo. 15 (goat milk), and 112.4 μg/kg of enrofloxacin (goatmilk) in sample No.17. These results suggest that one-step extraction by PRiME HLB combined with UPLC-quadrupole/electrostatic field orbitrap high-resolutionmass spectrometry for milk products is a simple and ef-fective method for analyses in goat milk and goat driedmilk samples.
ConclusionsA methodology for the analysis of veterinary antibioticresidues in goat milk products based on PRiME HLB ex-traction combined with UPLC-quadrupole/electrostaticfield orbitrap high-resolution mass spectrometry. Themethod can achieved the simultaneous analysis of sixty-two veterinary antibiotics belong to six different classifi-cation. The method showed good performance on recov-eries, precision, accuracy, MDL, and MQL, proving theeffectiveness of the methodology for analysis these com-pounds. Compared with traditional methods, the sensi-tivity was enhanced, and the accuracy was improved,leading to effective method for screening antibiotic resi-dues in milk products.
Supplementary InformationThe online version contains supplementary material available at https://doi.org/10.1186/s40543-021-00268-4.
Additional file 1. National food safety standard-Maximum residue limitsfor veterinary drugs in foods.
AbbreviationsSMZ: Sulfamerazine; TMP: Trimethoprim; SIZ: Sulfisoxazole; SD: Sulfadiazine;SDM: Sulfadimoxine; SPD: Sulfapyridine; SMX: Sulfamethoxazole;
LOM: Lomefloxacin; CIP: Ciprofloxacin; ENR: Enrofloxacin; OFX: Ofloxacin;NOR: Norfloxacin; ORB: Orbifloxacin; DAN: Danofloxacin; SPA: Sparfloxacin;SAR: Sarafloxacin; MAR: Marbofloxacin; ENO: Enoxacin; FLU: Flumequine;FLE: Fleroxacin; DIF: Difloxacin; PEF: Pefloxacin; LIN: Lincomycin;TIL: Tilmicosin; TYL: Tylosin; CLT: Chlortetracycline; DOX: Doxycycline;DEM: Demeclocycline; TIL: Ceftiofur; OXAC: Oxacillin; DICL: Dicloxacillin;CLOX: Cloxacillin; NAFC: Nafcillin; AMPI: Ampicillin; PEG: Penicillin G;PEV: Penicillin V
AcknowledgementsThis study was supported by the Technology Program of Shaanxi Entry andExit Inspection and Quarantine Bureau (Shaan K-201606), the Science andTechnology Resource Opening Sharing Platform of Shaanxi Province(2017KTPT-06), Science and Technology Project of General Administration ofCustoms, P. R. China (Grant No. 2018IK057), and Shaanxi Key Research & De-velopment Program (2017NY-165).
Authors’ contributionsLZ contributed to the conception of the study and data analyses and wrotethe manuscript. LS performed the experiment. QH contributed significantlyto analysis and manuscript preparation. YL helped perform the analysis withconstructive discussions. The authors read and approved the finalmanuscript.
FundingTechnology Program of Shaanxi Entry and Exit Inspection and QuarantineBureau (ShaanK-201606), Science and Technology Resource Opening SharingPlatform of Shaanxi Province (2017KTPT-06), Science and Technology Projectof General Administration of Customs, P. R. China (Grant No. 2018IK057),Shaanxi Key Research & Development Program (2017NY-165).
Availability of data and materialsThe data sets supporting the results of this article are included within thearticle and its additional files.
Declarations
Competing interestsThe authors declared that they have no competing interests.
Author details1Technology Centre of Xi’an Customs District P. R. China, Xi’an 710068, China.2School of Electronic and Information Engineering, Xi’an TechnologicalUniversity, Xi’an 710021, China.
Received: 23 September 2020 Accepted: 4 March 2021
ReferencesAbdallah MAE, Nguyen KH, Ebele AJ, Atia NN, Ali HRH, Harrad S. A single run,
rapid polarity switching method for determination of 30 pharmaceuticalsand personal care products in waste water using Q-Exactive Orbitrap highresolution accurate mass spectrometry. J Chromatogr A. 2019;1588:68–76.https://doi.org/10.1016/j.chroma.2018.12.033.
Berendsen BJA, Meijer T, Mol HGJ, Ginkel LV, Nielen MW. A global inter-laboratorystudy to assess acquisition modes for multi-compound confirmatory analysisof veterinary drugs using liquid chromatography coupled to triplequadrupole, time of flight and orbitrap mass spectrometry. Anal Chim Acta.2017;962:60–72. https://doi.org/10.1016/j.aca.2017.01.046.
Cámara M, Picó G, Garcinuńo MR. Fernández-Hernado, Durand-Alegría, SánchezPJ. An HPLC-DAD method for the simultaneous determination of nine β-lactam antibiotics in ewe milk. Food Chem. 2013;141(2):829–34. https://doi.org/10.1016/j.foodchem.2013.02.131.
Casado J, Brigden K, Santillo D, Johnston P. Screening of pesticides andveterinary drugs in small streams in the European Union by liquidchromatography high resolution mass spectrometry. Sci Total Environ. 2019;670:1204–25. https://doi.org/10.1016/j.scitotenv.2019.03.207.
Casado J, Santillo D, Johnston P. Multi-residue analysis of pesticides in surfacewater by liquid chromatography quadrupole-Orbitrap high resolutiontandem mass spectrometry. Anal Chim Acta. 2018;1024:1–17. https://doi.org/10.1016/j.aca.2018.04.026.
Zhang et al. Journal of Analytical Science and Technology (2021) 12:14 Page 14 of 16

Chen Q, Pan XD, Huang BF, Han JL. Quantification of 16 β-lactams in chickenmuscle by QuEChERS extraction and UPLC-Q-Orbitrap-MS with parallelreaction monitoring. J Pharm Biomed Anal. 2017;145(3399):525–30. https://doi.org/10.1016/j.jpba.2017.07.019.
De Almeida MP, Rezende CP, Ferreira FD, De Souza LF, De Assis DCS, DeFigueiredo TC, et al. Optimization and validation method to evaluate theresidues of β-lactams and tetracyclines in kidney tissue by UPLC-MS/MS.Talanta. 2015;144:922–32. https://doi.org/10.1016/j.talanta.2015.07.048.
Dubreil-Chéneau E, Pirotais Y, Verdon E, Hurtaud-Pessel D. Confirmation of 13sulfonamides in honey by liquid chromatography-tandem massspectrometry for monitoring plans: validation according to European Uniondecision 2002/657/EC. J Chromatogr A. 2014;1339(37):128–36. https://doi.org/10.1016/j.chroma.2014.03.003.
Emhofer L, Himmelsbach M, Buchberger W, Klampfl CW. High-performance liquidchromatography drift-tube ion-mobility quadrupole time-of-flight/massspectrometry for the identity confirmation and characterization ofmetabolites from three statins (lipid-lowering drugs) in the model plant cress(Lepidium sativum) after uptake from water. J Chromatogr A. 2019;1592:122–32. https://doi.org/10.1016/j.chroma.2019.01.049.
Forgacsova A, Galba J, Mojzisova J, Mikus P, Piestansky J, Kovac A. Ultra-highperformance hydrophilic interaction liquid chromatography–triple quadrupoletandem mass spectrometry method for determination of cysteine,homocysteine, cysteinyl-glycine and glutathione in rat plasma. J Pharm BiomedAnal. 2019;164:442–51. https://doi.org/10.1016/j.jpba.2018.10.053.
Fu Q, Liu DJ, Wang YY, Li XW, Wang LN, Yu FG, et al. Metabolomic profiling ofcampylobacter jejuni with resistance gene ermB by ultra-high performanceliquid chromatography-quadrupole time-of-flight mass spectrometry andtandem quadrupole mass spectrometry. J Chromatogr B. 2018;1079:62–8.https://doi.org/10.1016/j.jchromb.2018.02.009.
GB 31650-2019 National food safety standard-Maximum residue limits forveterinary drugs in foods. (2020).
Han RW, Wang JQ, Zhang N, Xu XM, Zhen YP, Qu XQ, et al. Main risk factoranalysis for milk quality and safety III.Veterinary drug residues. China AnimHusbandry Vet Drug Resid. 2012;39:1–4.
Han RW, Zheng N, Yu ZN, Wang J, Xu XM, Qu XY, et al. Simultaneous determinationof 38 veterinary antibiotic residues in raw milk by UPLC-MS/MS. Food Chem.2015;181:119–26. https://doi.org/10.1016/j.foodchem.2015.02.041.
Heller DN, Nochetto CB, Rummel NG, Thomas MH. Development of multiclassmethods for drug residues in eggs: hydrophilic solid-phase extractioncleanup and liquid chromatography/tandem mass spectrometry analysis oftetracycline, fluoroquinolone, sulfonamide, and β-lactam residues. J AgricFood Chem. 2006;54(15):5267–78. https://doi.org/10.1021/jf0605502.
Hu S, Zhao M, Mao Q, Fang C, Chen D, Yan P. Rapid one-step cleanupmethod to minimize matrix effects for residue analysis of alkalinepesticides in tea using liquid chromatography–high resolution massspectrometry. Food Chem. 2019;299(June):1–10. https://doi.org/10.1016/j.foodchem.2019.125146.
Javorska L, Krcmova LK, Solich P, Kaska M. Simple and rapid quantification ofvancomycin in serum, urine and peritoneal/pleural effusion via UHPLC–MS/MS applicable to personalized antibiotic dosing research. J Pharm BiomedAnal. 2017;142:59–65. https://doi.org/10.1016/j.jpba.2017.04.029.
Jia W, Chu X, Ling Y, Huang J, Chang J. High-throughput screening of pesticideand veterinary drug residues in baby food by liquid chromatographycoupled to quadrupole Orbitrap mass spectrometry. J Chromatogr A. 2014a;1347:122–8. https://doi.org/10.1016/j.chroma.2014.04.081.
Jia W, Chu X, Ling Y, Huang J, Chang J. Multi-mycotoxin analysis in dairyproducts by liquid chromatography coupled to quadrupole orbitrap massspectrometry. J Chromatogr A. 2014b;1345:107–14. https://doi.org/10.1016/j.chroma.2014.04.021.
Jia W, Chu XG, Chang J, Wang PG, Chen Y, Zhang F. High-throughput untargetedscreening of veterinary drug residues and metabolites in tilapia using highresolution orbitrap mass spectrometry. Anal Chim Acta. 2017;957:29–39.https://doi.org/10.1016/j.aca.2016.12.038.
Jia W, Shi L, Chu XG. Untargeted screening of sulfonamides and their metabolitesin salmon using liquid chromatography coupled to quadrupole Orbitrapmass spectrometry. Food Chem. 2018a;239:427–33. https://doi.org/10.1016/j.foodchem.2017.06.143.
Jia W, Shi L, Chu XG, Chang J, Chen Y, Zhang F. A strategy for untargetedscreening of macrolides and metabolites in bass by liquid chromatographycoupled to quadrupole orbitrap mass spectrometry. Food Chem. 2018b;262:110–7. https://doi.org/10.1016/j.foodchem.2018.04.090.
Junza A, Amatya R, Barrón D, Barbosa J. Comparative study of the LC-MS/MS andUPLC-MS/MS for the multi-residue analysis of quinolones, penicillins andcephalosporins in cow milk, and validation according to the regulation 2002/657/EC. J Chromatogr B Analyt Technol Biomed Life Sci. 2011;879(25):2601–10. https://doi.org/10.1016/j.jchromb.2011.07.018.
Kaufmann A, Widmer M. Quantitative analysis of polypeptide antibiotic residuesin a variety of food matrices by liquid chromatography coupled to tandemmass spectrometry. Anal Chim Acta. 2013;797:81–8. https://doi.org/10.1016/j.aca.2013.08.032.
Kazakova J, Fernández-Torres R, Ramos-Payán M, Bello-Lopez MA. Multiresiduedetermination of 21 pharmaceuticals in crayfish (Procambarus clarkii) usingenzymatic microwave-assisted liquid extraction and ultrahigh-performanceliquid chromatography-triple quadrupole mass spectrometry analysis. J PharmBiomed Anal. 2018;160:144–51. https://doi.org/10.1016/j.jpba.2018.07.057.
Kim CY, Ryu HD, Chung EG. Determination of 18 veterinary antibiotics inenvironmental water using high-performance liquid chromatography-q-orbitrap combined with on-line solid-phase extraction. J Chromatogr B. 2018;1084:158–65. https://doi.org/10.1016/j.jchromb.2018.03.038.
Li J, Ren XL, Diao YY, Chen Y, Wang QL, Jin WT, et al. Multiclass analysis of 25veterinary drugs in milk by ultra-high performance liquid chromatography-tandem mass spectrometry. Food Chem. 2018;257:259–64. https://doi.org/10.1016/j.foodchem.2018.02.144.
Li N, Ho KW, Ying GG, Deng WJ. Veterinary antibiotics in food, drinking water,and the urine of preschool children in Hong Kong. Environ Int. 2017;108(April):246–52. https://doi.org/10.1016/j.envint.2017.08.014.
Li SJ, Ju HY, Zhang JQ, Chen P, Ji MC, Ren JH, et al. Occurrence and distributionof selected antibiotics in the surface waters and ecological risk assessmentbased on the theory of natural disaster. Environ Sci Poll Res. 2019;26(27):28384–00. https://doi.org/10.1007/s11356-019-06060-7.
Li Y, Zhou G, Peng Y, Tu PF, Li XB. Screening and identification of three typicalphenylethanoid glycosides metabolites from Cistanches Herba by humanintestinal bacteria using UPLC/Q-TOF-MS. J Pharm Biomed Anal. 2016;118:167–76. https://doi.org/10.1016/j.jpba.2015.10.038.
Liu L, Aljathelah NM, Hassan H, Leitão A, Bayen S. Development of a liquidchromatography-quadrupole-time-of-flight-mass spectrometry based methodfor the targeted and suspect screening of contaminants in the pearl oysterPinctada imbricata radiate. Environ Pollut. 2019;253:841–9. https://doi.org/10.1016/j.envpol.2019.07.047.
Liu Y, Zhu K, Wang J, Huang X, Wang GL, Li CY, et al. Simultaneous detectionand comparative pharmacokinetics of amoxicillin, clavulanic acid andprednisolone in cows’ milk by UPLC-MS/MS. J Chromatogr B. 2016;1008:74–80. https://doi.org/10.1016/j.jchromb.2015.11.031.
López-García M, Romero-González R, Frenich AG. Determination of rodenticides andrelated metabolites in rabbit liver and biological matrices by liquidchromatography coupled to Orbitrap high resolution mass spectrometry. JPharm Biomed Anal. 2017;137:235–42. https://doi.org/10.1016/j.jpba.2017.01.043.
Moreno-González D, Hamed AM, Gilbert-López B, Gámiz-Gracia L, García-Campaña AM. Evaluation of a multiresidue capillary electrophoresis-quadrupole-time-of-flight mass spectrometry method for the determinationof antibiotics in milk samples. J Chromatogr A. 2017;1510:100–7. https://doi.org/10.1016/j.chroma.2017.06.055.
Oyedeji AO, Msagati TAM, Williams AB, Benson NU. Determination of antibioticresidues in frozen poultry by a solid-phase dispersion method using liquidchromatography-triple quadrupole mass spectrometry. Toxicol Rep. 2019;6:951–6. https://doi.org/10.1016/j.toxrep.2019.09.005.
Paepe ED, Meulebroek LV, Rombouts C, Huysman S, Verplanken K, Lapauw B,et al. A validated multi-matrix platform for metabolomic fingerprinting ofhuman urine, feces and plasma using ultra-high performance liquid-chromatography coupled to hybrid orbitrap high-resolution massspectrometry. Anal Chim Acta. 2018;1033:108–18. https://doi.org/10.1016/j.aca.2018.06.065.
Paepe ED, Wauters J, Borght MVD, Claes J, Huysman S, Croubels S, et al. Ultra-high-performance liquid chromatography coupled to quadrupole orbitraphigh-resolution mass spectrometry for multi-residue screening of pesticides,(veterinary) drugs and mycotoxins in edible insects. Food Chem. 2019;293:187–96. https://doi.org/10.1016/j.foodchem.2019.04.082.
Pan L, Lv B, Jiang XQ, Wang T, Ma XH, Chang NW, et al. Identification of NF-κBinhibitors following Shenfu injection and bioactivity-integrated UPLC/Q-TOF-MS and screening for related anti-inflammatory targets in vitro and in silico. JEthnopharmacol. 2016;194(February):658–67. https://doi.org/10.1016/j.jep.2016.10.052.
Zhang et al. Journal of Analytical Science and Technology (2021) 12:14 Page 15 of 16

Reinholds I, Pugajeva I, Bartkevičs V. Comparison of tandem quadrupole massspectrometry and orbitrap high resolution mass spectrometry for analysis ofpharmaceutical residues in biota samples. Mat Sci Appl Chem. 2016;33(1):5–10. https://doi.org/10.1515/msac-2016-0001.
Rusko J, Jansons M, Pugajeva I, Zacs D, Bartkevics V. Development andoptimization of confirmatory liquid chromatography—Orbitrap massspectrometry method for the determination of 17 anticoccidials in poultryand eggs. J Pharm Biomed Anal. 2019;1645:402–12. https://doi.org/10.1016/j.jpba.2018.10.056.
Saito-Shida S, Hamasaka T, Nemoto S, Akiyama H. Multiresidue determination ofpesticides in tea by liquid chromatography-high-resolution massspectrometry: comparison between Orbitrap and time-of-flight massanalyzers. Food Chem. 2018;256:140–8. https://doi.org/10.1016/j.foodchem.2018.02.123.
Şanli S, Palabiyik İM, Şanli N, Guzel-Seydim ZB, Alsancak G. Optimization of theexperimental conditions for macrolide antibiotics in high performance liquidchromatography by using response surface methodology and determinationof tylosin in milk samples. J Anal Chem. 2011;66(9):838–47. https://doi.org/10.1134/s1061934811090152.
Serra-Compte A, Álvarez-Muñoz D, Rodríguez-Mozaz S, Barceló D. Multi-residuemethod for the determination of antibiotics and some of their metabolitesin seafood. Food Chem Toxicol. 2017;104:3–13. https://doi.org/10.1016/j.fct.2016.11.031.
Socas-Rodríguez B, Herrera-Herrera AV, Hernández-Borges J, Rodríguez-DelgadoMÁ. Multiresidue determination of estrogens in different dairy products byultra-high-performance liquid chromatography triple quadrupole massspectrometry. J Chromatogr A. 2017;1496:58–67. https://doi.org/10.1016/j.chroma.2017.03.034.
Tran N, Chen H, Do TV, Reinhard M, Ngo HH, He YL, et al. Simultaneous analysisof multiple classes of antimicrobials in environmental water samples usingSPE coupled with UHPLC-ESI-MS/MS and isotope dilution. Talanta. 2016;159:163–73. https://doi.org/10.1016/j.talanta.2016.06.006.
Weng R, Lou ST, Pang X, Song Y, Su X, Xiao ZY, et al. Multi-residue analysis of 126pesticides in chicken muscle by ultra-high-performance liquid chromatographycoupled to quadrupole time-of-flight mass spectrometry. Food Chem. 2020;309:125503. https://doi.org/10.1016/j.foodchem.2019.125503.
Zhang D, Park JA, Kim SK, Cho SH, Jeong D, Cho SM, et al. Simultaneousdetection of flumethasone, dl-methylephedrine, and 2-hydroxy-4,6-dimethylpyrimidine in porcine muscle and pasteurized cow milk using liquidchromatography coupled with triple-quadrupole mass spectrometry. JChromatogr B. 2016;1012–1013:8–16. https://doi.org/10.1016/j.jchromb.2016.01.011.
Zhang YQ, Li X, Liu XM, Zhang JJ, Cao YZ, Shi ZH, et al. Multi-class, multi-residueanalysis of trace veterinary drugs in milk by rapid screening andquantification using ultra-performance liquid chromatography–quadrupoletime-of-flight mass spectrometry. J Dairy Sci. 2015;98(12):8433–44. https://doi.org/10.3168/jds.2015-9826.
Zhao F, Gao X, Tang ZX, Luo X, Wu MM, Xu JC, et al. Development of a simplemulti-residue determination method of 80 veterinary drugs in Oplegnathuspunctatus by liquid chromatography coupled to quadrupole Orbitrap massspectrometry. J Chromatogr B. 2017;1065–1066:20–8. https://doi.org/10.1016/j.jchromb.2017.09.013.
Zorraquino MA, Althaus RL, Roca M, Molina MP. Heat treatment effects on theantimicrobial activity of macrolide and lincosamide antibiotics in milk. J FoodProt. 2011;74(2):311–5. https://doi.org/10.4315/0362-028X.JFP-10-297.
Publisher’s NoteSpringer Nature remains neutral with regard to jurisdictional claims inpublished maps and institutional affiliations.
Zhang et al. Journal of Analytical Science and Technology (2021) 12:14 Page 16 of 16