a quick introduction to the powerful report … a quick introduction to the powerful report...
TRANSCRIPT

1
A Quick Introduction to the Powerful REPORT Procedure
or
33 Tricks With PROC REPORT
Ben Cochran The Bedford [email protected]
919.741.0370
2
Overview
This presentation illustrates how to use the REPORT
procedure to generate good looking reports. This step by
step process also shows how to use this procedure to do a
little data manipulation as well as adding a few ODS
features to enhance the appearance of the report.
3
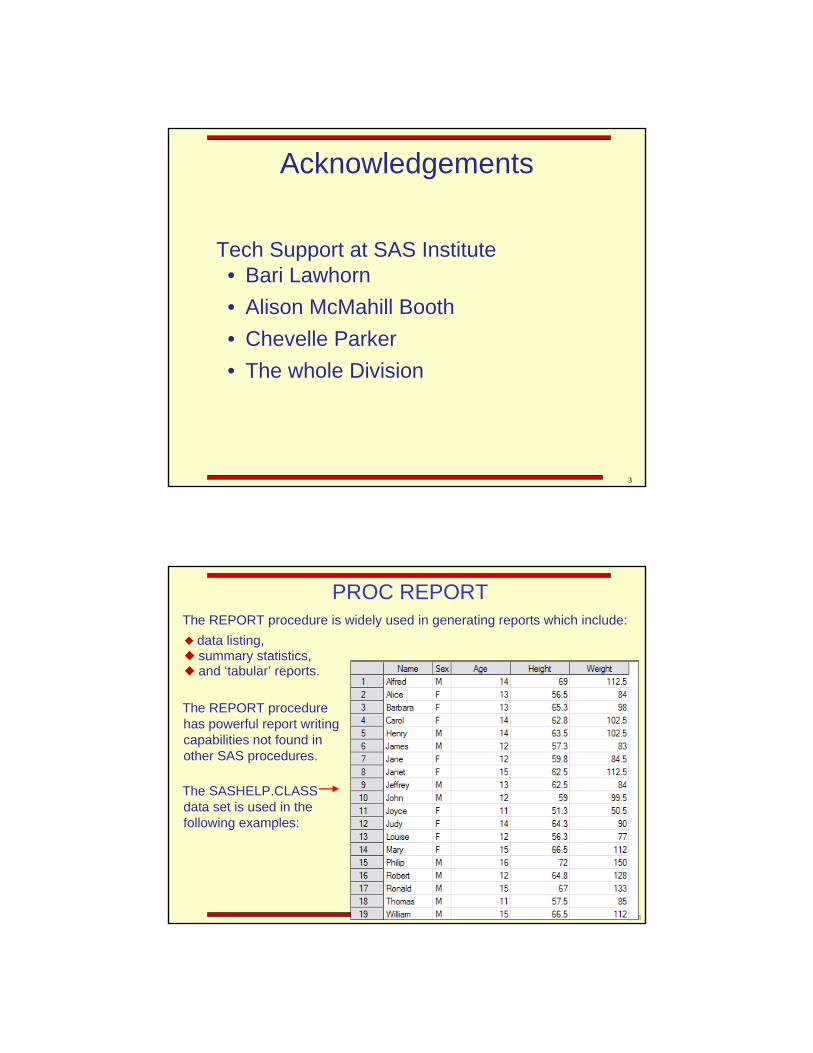
Acknowledgements
Tech Support at SAS Institute• Bari Lawhorn
• Alison McMahill Booth
• Chevelle Parker
• The whole Division
4 4
The REPORT procedure is widely used in generating reports which include:
data listing, summary statistics, and ‘tabular’ reports.
The REPORT procedurehas powerful report writing capabilities not found in other SAS procedures.
The SASHELP.CLASS data set is used in the following examples:
PROC REPORT

5
COLUMNS statement defines the columns and their order, DEFINE statements declare how each variable is to be used, COMPUTE blocks allow calculations in the report, BREAK/RBREAK allow physical breaks (ie. blank lines) in the report.
PROC REPORT data= SAS-data-set options ;COLUMNS variable_1 …. variable_n;DEFINE variable_1;DEFINE variable_2;. . .DEFINE variable_n;
COMPUTE blocks BREAK … ;RBREAK … ;
RUN;
The typical form of the REPORT procedure:
PROC REPORT
6
example
The REPORT procedure can be used in a window or a non-windowmode.
Selected options used on the PROCEDURE statement are :PROMPT - invokes the prompting mode NOWINDOWS - suppresses the REPORT window DATA = - names the data set REPORT = - names a stored report OUTREPT = - creates a report definitionOUT = - creates an output data setHEADLINE - creates a line under the column headingsHEADSKIP - creates a blank line under the column headingsCENTER - centers the REPORT windowSPLIT = - designates a character to be used in splitting lablesLS or LINESIZE - specifies the width of the lines in the report PS or PAGESIZE - specifies the number of lines in the report
PROC REPORT

7
output
Trick 1: Generate a default report using the REPORT procedure:
Notice the defaults…
PROC REPORT
8
GROUP observations into categories, DISPLAY values for each observation, ANALYSIS contribute values to a statistic, ORDER defines the order of the report rows, ACROSS creates columns for each of its values, COMPUTED values are created in a compute block.
output
Trick 2: Generate a basic report using the REPORT procedure:
Columns can be defined as:
PROC REPORT

9
more Any enhancements?
PROC REPORT
10
HEADLINE and HEADSKIP options, the COMPUTE block, the RBREAK statement output
Trick 3: Enhance the report by adding a blank line after the column names and calculating values for a new column… RATIO.
Notice the following:
PROC REPORT

11
more … more enhancements?
PROC REPORT
12
more
Trick 4: Find the Mean AGE, HEIGHT, WEIGHT, & RATIO for each gender.
PROC REPORT

13
new definition for SEX and AGE the new statistics in the COMPUTE block, the BREAK statement replaces the RBREAK statement, the new options on the BREAK statements. output
Trick 5: Rearrange the Columns and add a blank line after the Group variable. Re-define variables and add DOL, and DUL on the BREAK statement.
Notice the following:
PROC REPORT
14
% Here we see the AVERAGE AGE, HEIGHT, WEIGHT and RATIO
PROC REPORT

15
pgm
Trick 6: Enhance the report by calculating percentages so that they add up to 100 for each value of the Group variable (SEX).
Calculating Percentages
16
the WEIGHT_PCT column, the different statistics… (no statistic for WEIGHT in DEFINE statement) the new compute blocks output
Trick 6: Calculate percentages for each value of the Group variable (SEX).
Notice the following:
Calculating Percentages

17
Notice the Weight column. Does it ‘make sense’ to SUM weight?
Calculating Percentages
18
Suppressing Columns
pgm
Trick 7: Enhance the report by not displaying the WEIGHT column.

19
output
Trick 7: Enhance the report by not displaying the WEIGHT column.
Notice the NOPRINT definition for the WEIGHT column.
Suppressing Columns
20
Notice the absence of the WEIGHT column.
Suppressing Columns

21
pgm
Trick 8: Add WEIGHT to the report, calculate its’ AVERAGE for each group.
Calculating Percentages
22
the WEIGHT alias (WEIGHT2), the definitions of the 2 WEIGHT columns (2 stats for WEIGHT). output
Task 8: Add WEIGHT to the report, calculate its’ AVERAGE for each group.
Notice the following:
Calculating Percentages

23
Notice the WEIGHT column (WEIGHT2) now displays averages for each value of Sex. The percent column has no change from the last report.
Calculating Percentages
24
ppm
Task 9. Calculate two different statistics for the same column… WEIGHT.
The ‘trick’ that makes this work is to have a different ‘by variable’for each statistic. In this case, we need 2 different variables for GENDER: one for MEDIAN, andone for MEAN.
The DATA Step is used to prep the data.
data prep; length NAME $ 16;set SASHELP.CLASS;gender = sex;
run;
Calculating Multiple Statistics in a Column

25
Trick 9. Calculate two statistics for WEIGHT.
Calculating Multiple Statistics in a Column
output
26
In the program, notice the:
DATA Step, alias’ for WEIGHT, COMPUTE blocks, 3 NOPRINT variables,
Calculating Multiple Statistics in a Column
27
data
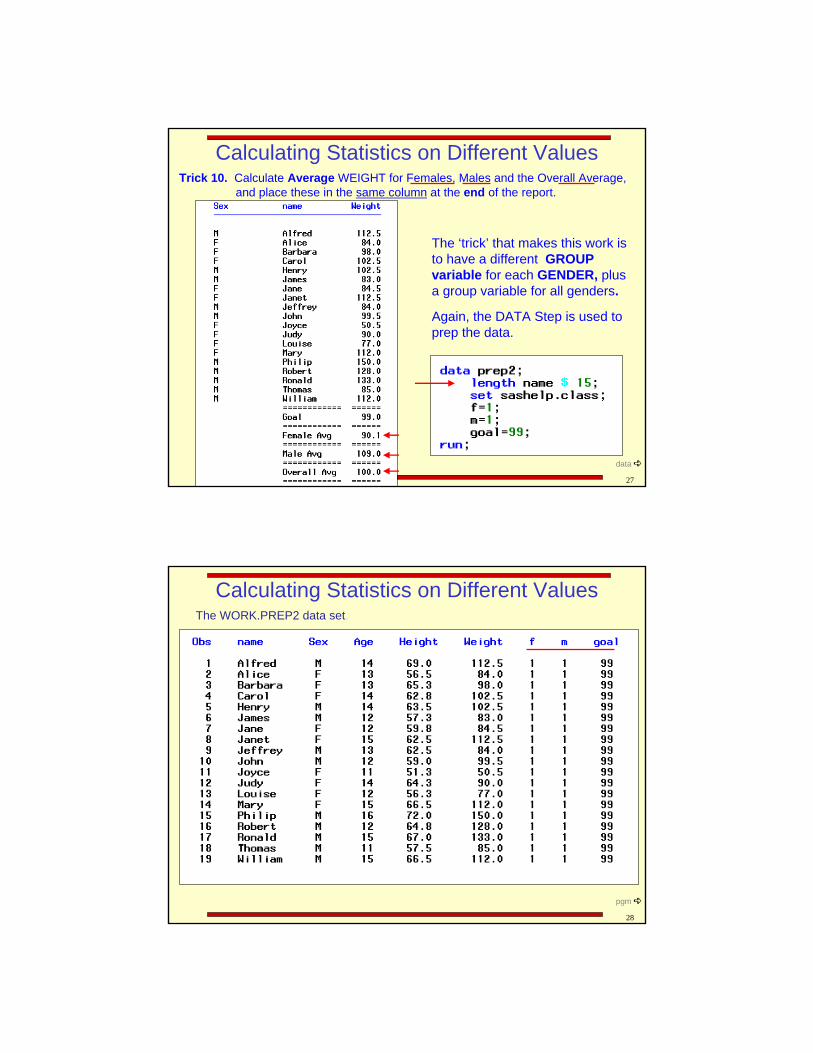
Trick 10. Calculate Average WEIGHT for Females, Males and the Overall Average,and place these in the same column at the end of the report.
The ‘trick’ that makes this work is to have a different GROUP variable for each GENDER, plus a group variable for all genders.
Again, the DATA Step is used to prep the data.
Calculating Statistics on Different Values
28
pgm
The WORK.PREP2 data set.
Calculating Statistics on Different Values

29
more
Task 10. Calculate Average WEIGHT for Females, Males and the Overall Average.
Notice the ‘Holding’ variables in this partial PROC REPORT step.
Notice the ‘Counter’ variables in this partial PROC REPORT step.
Calculating Statistics on Different Values
30
Notice the BREAK and RBREAK statements at the end of the PROC REPORT step.
Notice the reassigning of the NAME variable in each of the COMPUTE BLOCKS.
Calculating Statistics on Different Values

31
ods
Calculating Statistics on Different Values
32
Using ODS to Enhance the Report
HTML files, SAS data sets, RTF, PDF, Listing (default output destination, i.e. Output Window )
ODS destination-type destination;
PROC procedure data= SAS data set options ;… ;… ;
RUN;
ODS destination-type CLOSE;
example
The general syntax to send the output to a different destination is:
Selected destination types can be:

33
more
Using ODS to Enhance the Report
ods rtf file = ‘c:\sgf.rtf’ ;
previous PROC REPORT step . . . ;… ;… ;
RUN;
ods rtf CLOSE;
Trick 9. ‘Sandwich’ the previous PROC REPORT step in between basicODS statements.
This is the default appearance when using ODS to write to an RTF file. The report can be enhanced by using some new ODS syntax…
34
Using ODS STYLES to Enhance the Report
The typical form of the STYLE = option is:
STYLE = { attribute – 1 = value – 1 …attribute – n = value – n } ;
where ‘attribute’ is a report feature such as :
background foreground font
The STYLE = option can be abbreviated as S= .
The STYLE = option can be used to control just about every aspect of theReport’s appearance.

35
Using ODS STYLES to Enhance the Report
The STYLE = (COMPONENT) = {attribute = value } syntax can also beused to control the appearance of the report.
The following ‘COMPONENTS’ can be controlled by the STYLE = option:
Header = {background=cyan}
Summary = {font=‘Arial’ … }
Report = {background=yellow}
Column= {foreground=blue}
36
Using ODS STYLES to Enhance the Report
output Notice the STYLE options and their placement on the PROC statement.
Trick 10. Use ODS STYLES to enhance the report. Modify Trick 3’sexample.

37
Using ODS STYLES to Enhance the Report
output
Trick 10. Output.
Notice the font sizes.
38
Other ODS Examples

39
Other ODS Examples
40
output

41
Using ODS to Enhance the Report
This is the default appearance when using ODS to write to a PDF file.
This report can be enhanced by using some new ODS syntax…
42
Using ODS to Enhance the Report
The TEMPLATE procedure allows you to control the appearance of almost everyaspect of the report ... the font style, font weight, font face, and color.
Use the TEMPLATE procedure to define a style (NEW) that controls the backgroundcolor, font face, and font size of the data at the most detail level.
The background color: cx dddddd is a medium gray.
On the next page, ODS is invoked along with the NEW style…

43
1.
2.
3.4.
44
Using ODS to Enhance the Report
Notice the colors as well as the font size throughout the report. Alter the report so that ‘traffic lighting’ is applied to the PROFIT column.

45
Using ODS to Enhance the Report
Use the FORMAT procedure to create the traffic lighting format. Demonstrate the WHERE statement to subset the data.
1.
2.
Note: partial program
Step 1. Create the COLORFMT format. Step 2. Associate the format with the foreground attribute of PROFIT.
46
Notice the colors as well as the font size of the PROFIT column. Next, the CEOwants to see a similar report where there is a separate column for each YEAR.

47
Rotating the ReportModify the report to only show INCOME from the San Francisco HUB. Create a column for each year.
output
48
Rotating the Report
The final report.

49
More on Transposing Data in the Report
Task 11. Transpose the Data by defining AGE as an ACROSS variable.
50
Using ODS to Enhance the Report
Why does a ‘T’ appear in stead of the word ‘Total’ in the last row of the GENDER column?
Next, Let’s fix this as well as enhance this report.

51
Using ODS to Enhance the Report
Note the Data Set, the justification, and the LINE statements.
Task 12. Add ‘Footnote’ at the bottom of the report.
52
Using ODS to Enhance the Report
Not quite what was wanted. Notice the second line of the ‘footnote’does not indent.
Next, let’s fix this as well as enhance this report.

53
Task 13. Add a format, indent the ‘footnote’, and ‘embed’ a title.
Using ODS to Enhance the Report
54
Using ODS to Enhance the Report
Task 13. Add a format, indent the ‘footnote’, and ‘embed’ a title.
Note: ODS statements are NOT displayed, but were still executed.

55
Using ODS to Enhance the Report
56
More on Using an ACROSS ColumnThe following tasks will use the ‘Sales’ dataset shown below.
This data set has 1 row per weekday for 3 weeks. Managementwants a report with a column foreach day of the week. Thereneeds to be an eighth column onthe right that displays the Total.

57
Using an ACROSS ColumnAnalyze the report, then the program that was used to create it.
Notice the Columns statement… especially the use of parentheses to createthe ‘embedded’ title. Also notice the comma after Week_Day. Notice the Across variable. What is needed next is the Total column.
58
Proc REPORT has an ‘alias’for each column. Startingwith the left-most column, the alias names are _C1_, _C2_,_C3_, etc. Knowing this, we can create a TOTAL column as seen below.
Why wasn’t _C1_ used to calculate the value of TOTAL ?
Using an ACROSS Column : Create Row Totals

59
The ‘Sales’ dataset has been modified to include a column for Year.
This data will be used for the nextseveral examples. Notice the YEAR column in the report.
Using an ACROSS Column : Create Row Totals
60
Add YEAR and Define it as a GROUP variable.
Notice the computationfor Total. Why does it start with _C3_ ?
The Compute After blockgenerates the blank line after each Year.

61
Next, management has decided that they want TWO sub totals for the Week, a new one after Wednesday to total Sunday through Wednesday, as well asone after Saturday to total Thursday through Saturday. They still want to to total all seven days.
Using an ACROSS Column : Create Row Totals
62
To do this, the data has to bemanipulated to insert 2 newcolumns (‘Week days’).
First, write a DATA step thatwill ‘add’ 2 values to Week_Day.
Then write a Proc FORMAT step to create a format for theweek days.

63
Next, write a Proc REPORT step to generate the report. Create the weeklySub Totals and put them in Columns _C7_ and _C11_ .
64
The final report looks like this…
Using an ACROSS Column : Create Row Totals
The End

65
About the Speaker
Speaker
Office Location
TelephoneFax
Ben Cochran
The Bedford Group3224 Bedford Ave. Raleigh, NC 27607
(919) 831.1191(919) 831.1191
66
The final report should look like this…
Using an ACROSS Column : Create Column Totals
Notice that the Total Weight and Total Kids columns are summed while theAvg Weight columned is Averaged.
Needs Reworking.Drop Total Weight.

67
The next series of reportsuse the CLASS dataset.
Using an ACROSS Column : Create Column Totals
AGE is used as the ACROSS variable and
SEX is used as the GROUPvariable.
68
Using an ACROSS Column : Create Column Totals
Step 1. Create a temporary data set that has two new variables (nand a) and make the variable SEX have a length of 9.
Step 2. Write the PROC REPORT step and filter the dataset where age is less than 14. Notice the ANALYSIS variables and the BREAK statement and COMPUTE block.

69
The report has a Totals Row that contains Column totals.
Using an ACROSS Column : Create Column Totals
Next, a new row will be added that contains column Averages.
Lets say that we want to have only ONE column for Weight, but have a rowfor the SUM and a row for the AVERAGE.
70
Modifythe program as follows:
Using an ACROSS Column : Create Column Totals
Notice the NOPRINTs and the modified label.
Add the RBREAK statement and the compute block to generate the Averages row.

71
Using an ACROSS Column : Create Column Totals
The End
72
The End
73
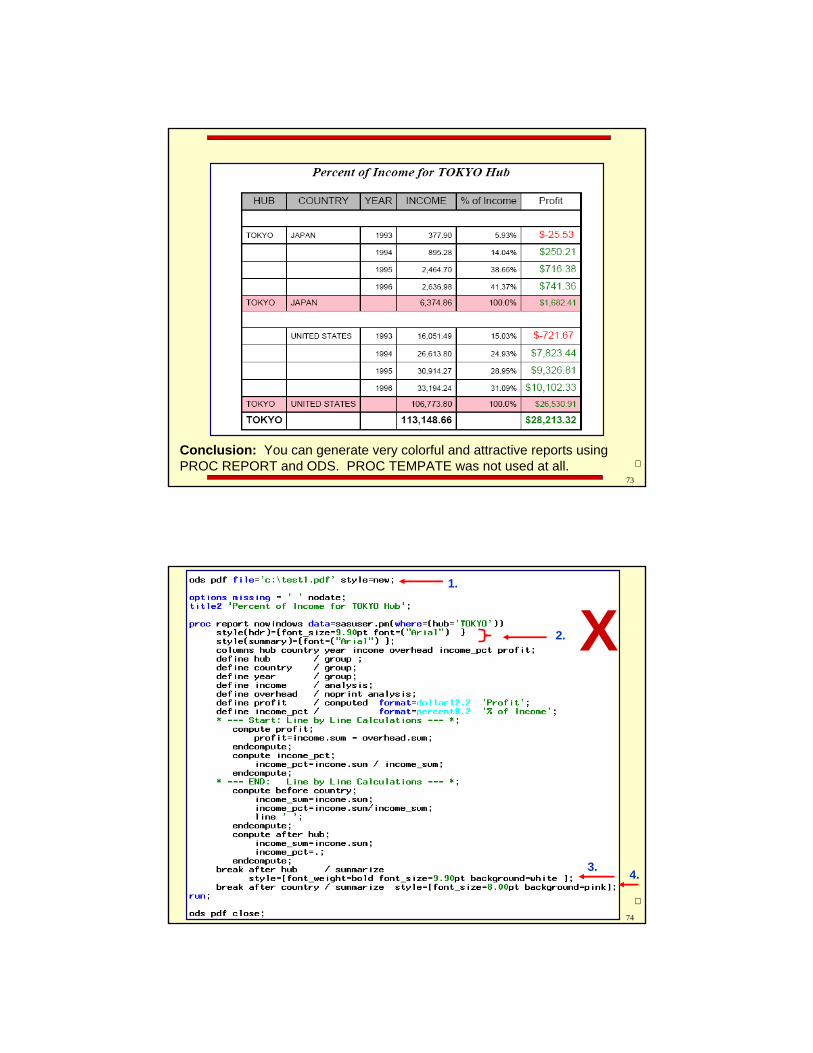
Conclusion: You can generate very colorful and attractive reports using PROC REPORT and ODS. PROC TEMPATE was not used at all.
74
1.
2.
3.4.
X

75
Using ODS to Enhance the Report Use the FORMAT procedure to create the traffic lighting format. Demonstrate the WHERE statement to subset the data.
1.
2.
Note: partial program
Step 1. Create the COLORFMT format. Step 2. Associate the format with the foreground attribute of PROFIT.
76
9.8 Proc ReportThe REPORT procedure is widely used in generating reports which include:
data listing, summary statistics, and ‘tabular’ reports.
The REPORT procedure has powerful report writing capabilities not found in other SAS procedures. The SASUSER.PM data set is used in the following examples:

77
PROC REPORT
COLUMN statement defines the columns and their order, DEFINE statements declare how each variable is to be used, COMPUTE blocks allow calculations in the report, BREAK/RBREAK allow physical breaks (blank lines) in the report.
PROC REPORT data= SAS-data-set options ;COLUMNS variable_1 …. variable_n;DEFINE variable_1;DEFINE variable_2;. . .DEFINE variable_n;
COMPUTE blocks BREAK … ;RBREAK … ;
RUN;
example
The typical form of the REPORT procedure: X
78
PROC REPORT
example
You can use the REPORT procedure in windowing or a non-windowing mode.
Selected options used on the PROCEDURE statement are :PROMPT - invokes the prompting mode NOWINDOWS - suppresses the REPORT window DATA = - names the data set REPORT = - names a stored report OUTREPT = - creates a report definitionOUT = - creates an output data setHEADLINE - creates a line under the column headingsHEADSKIP - creates a blank line under the column headingsCENTER - centers the REPORT windowSPLIT = - designates a character to be used in splitting titlesLS or LINESIZE - specifies the width of the lines in the report PS or PAGESIZE - specifies the number of lines in the report
X

79
PROC REPORT
GROUP observations into categories, DISPLAY values for each observation, ANALYSIS contribute values to a statistic, ORDER defines the order of the report rows, ACROSS creates columns for each of its values, COMPUTED values are created in a compute block. output
Generate a basic report using the REPORT procedure:
Columns can be defined as:
X
80
PROC REPORT
more Any enhancements?
X

81
PROC REPORT
HEADLINE and HEADSKIP options, the COMPUTE block, the new variable ( PROFIT ), the syntax within the compute block : the association of a statistic with
the variable name (for line by line calculations). output
Enhance the report by adding a blank line after the column names and calculating profit for each row.
Notice the following:
82
PROC REPORT
more Any enhancements?

83
PROC REPORT
BREAK statement, the new COMPUTE block, the new options on the DEFINE statements. output
Enhance the report by adding a blank line after each country and calculating profit for each country.
Notice the following:
84
PROC REPORT
more Any enhancements?

85
PROC REPORT
TYPE and YEAR have been dropped from the report, the variable on the COMPUTE block,
output
Enhance the report by having less detail, drop TYPE and YEAR, then change the variable on the BREAK statement from COUNTRY to HUB.
Notice the following:
86
PROC REPORT
Notice the level of summarization. Compare this report to the previous one.

87
Calculating Percentages
the SKIP option on the BREAK statement, the definition of INCOME_PCT the BEFORE option on the COMPUTE block at the HUB level, output
Enhance the report by calculating the Percent of Income by Country.
Notice the following:
88
Calculating Percentages
Notice the level of summarization. Compare this report to the previous one.

89
Calculating Percentages
the WHERE option in the PROC statement, the two BREAK statements and their options, output
Enhance the report by summarizing at the HUB and COUNTRY level.
Notice the following:
90
Calculating Percentages
Notice that percent adds up to 100 at the HUB level. What if we wanted it to add up to 100 at the COUNTRY level?

91
the COMPUTE AFTER HUB block, the OPTIONS statement. output
Modify the report so that Income % adds up to 100 at the country level.
Notice the :
92
Calculating Percentages
Notice that percent adds up to 100 at the COUNTRY level. Why is it blankat the HUB level?
The double lines over and under the % INCOME column need to be enhanced. How can we make this look better ?

93
output
9.9 Using ODS to Enhance the Report
What is ODS?
Beginning with Version 7, procedure output became much more flexible than earlier versions of the SAS System. The Output Delivery System (ODS) has been designed to overcome the limitations of traditional SAS output and to make it easy to make new formatting options available to users.
ODS is a method of delivering output in a variety of formats and of making the formatted output easy to access.
ODS combines data with one or more table definitions to produce one or more output objects. These objects can be sent to any or all ODS destinations.
The currently available ODS destinations can produce:
an output data set traditional monospace output output that is formatted for a high-resolution printer, and output that is formatted in HTML.
X
94
Using ODS to Enhance the Report
HTML files, SAS data sets, RTF, PDF, Listing (default output destination, i.e. Output Window )
ODS destination-type destination;
PROC procedure data= SAS data set options ;… ;… ;
RUN;
ODS destination-type CLOSE;
table
The general syntax to send the output to a different destination is:
Destination types can be:
X

95
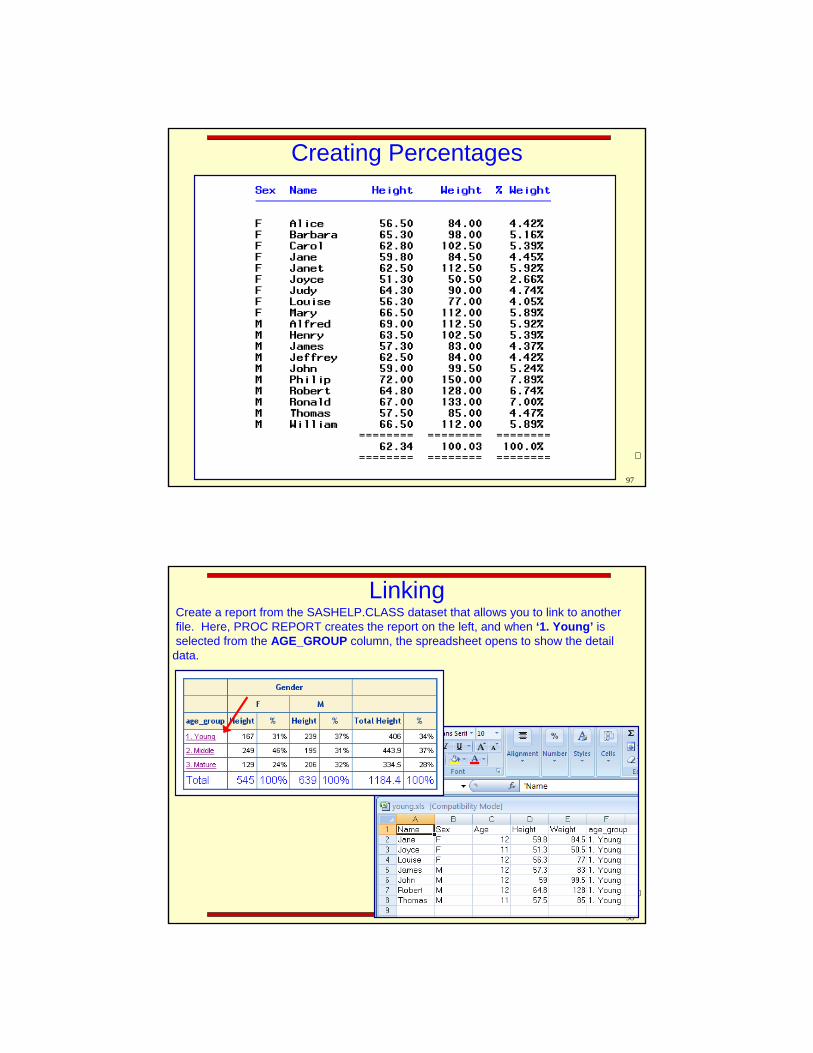
Creating PercentagesCreate a report that shows what percentage each person’s weight is of the whole class.
96
Creating PercentagesNotice the COLUMNS statement.
it is created from the WEIGHT column. the PCTSUM statistic used in the definition, the PERCENT. format used in the definition.
Notice the following about the WT_PC variable:
97
Creating Percentages
98
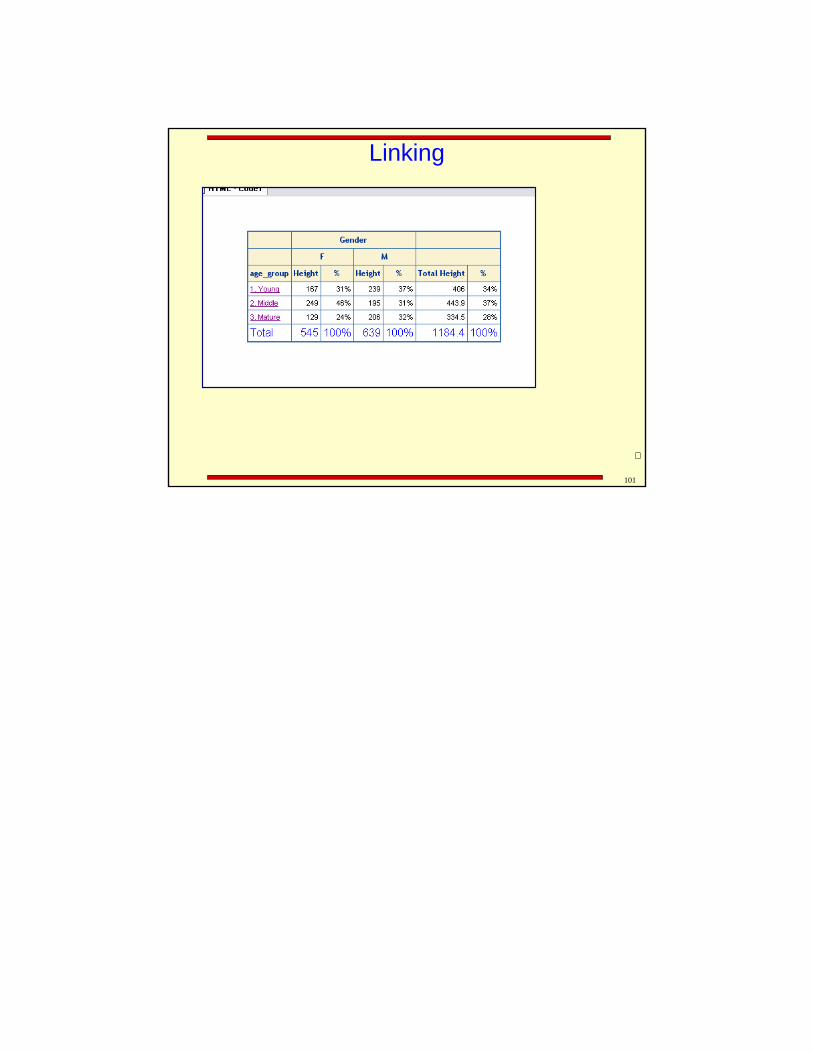
LinkingCreate a report from the SASHELP.CLASS dataset that allows you to link to anotherfile. Here, PROC REPORT creates the report on the left, and when ‘1. Young’ isselected from the AGE_GROUP column, the spreadsheet opens to show the detail
data.

99
LinkingThe first step is tocreate three age groups based on the value of age.
Next, create the spreadsheets that contain detail data by writing a series of PROC EXPORT steps.
Notice the use of the WHERE=option.
Notice the locationsof the spreadsheets.
100
Linking
The ‘=:’ combination means if the value of a variable starts with the contents of the quoted string. The CALL DEFINE statement associates the location of the spreadsheet with the current row.
101
Linking