a quick guide to systematic investment plan -...
TRANSCRIPT

MUTUAL FUND INVESTMENTS ARE SUBJECT TO MARKET RISKS, READ ALL SCHEME RELATED DOCUMENTS CAREFULLY.
A quick guide toSystematic Investment Plan

India Growth Story
2
Invest in the future!
Invest in the change we believe in...

India Financials – A Snapshot
• Savings Rate:- Around 28%
• Young Population
• GDP Growth rate:- Between 5-7% At this rate India GDP expected to be at ` 4.5 trillion very soon
• Per Capita now:- ` 1017
• Expected 2020:- ` 3213
3

Indian Economy
• Long term:- Bright prospects
• Demographics, Income growth & ‘India’ story
4
ROE Trend
India
BRIC
World
EM
Asia Pacex - Japan
0%
1995
1996
1997
1998
1999
2000
2001
2002
2003
2004
2005
2006
2007
2008
2009
5%
10%
5%
20%
25%

We simply attempt to be fearful
when others are greedy and to
be greedy only when others
are fearful.
Warren Buffett
5

1 year forward P/E of Sensex
6
25,000
20,000
15,000
10,000
5,000
May-910
5
10
15
20
25
30
35
40
45
May-94 May-97 May-00 May-03 May-06 May-09 May-12
Sensex(RIIS)Roll P/C

7
Healthy Savings

Indians areamongst
the highestsavers inthe world
France11.1%
Germany10.7%
Japan6.3%
UK5.5%
USA1.4%
Hou
seho
ld S
avin
gs R
ate
A C
ompa
riso
n
Savings – An Indian Religion
8

Current share of Household Savings
*Contractual savings comprisesLife Insurance,Provident & Pension Funds
Bank FDs43%
Small Savings18%
Shares & Debentures1%
Cash10%
ContractualSavings*28%
Investors does not seem to use equities to create long term wealth
Individual Investor: Savings Profile
9
10
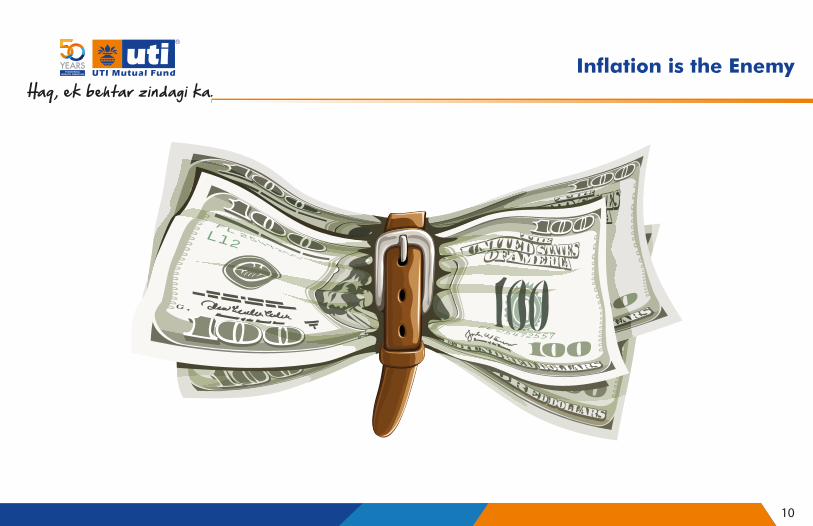
Inflation is the Enemy

Understanding Inflation
11
Inflation Rate8%*
` 6,805after
5 years… ` 4,631after
10 years… ` 2,145after
20 years…
` 10,000 today will
be worth …
` 993after
30 years

Impact of inflation on monthly expenses of ` 30,000 today
Value of ` 100,000 over time
Inflation @ 8%
30,000 44,080
95,165
1,39,829
Today 5 years 15 years 20 years
100,000
68,058
31,524 21,454
Today 5 years 15 years 20 years
Value of Money over time
12
Investors need to beat Inflation

13
Rules of Investing

Mr. Smart
Per month saving `5, 000
`75 Lacs `2.25 Cr
`15, 000
@ 8% p.a.*
How much would theyhave after 30 years
Mr. Intelligent
Rule1: How much you save makes a difference
14
The more you save the more your wealth will be!

Mr. Smart
Per month saving `5, 000
`75 Lacs
`15, 000
@ 8% p.a.*
How much would theyhave after 30 years
Mr. Intelligent
Mr. Smart will need to invest `12,700 p.m.to match the early starter
Mr. Smart Mr. IntelligentMonthly investment 7,500
20 Years
8%
18.00 Lakh
44 Lakh
5,000
30 Years
8%
18.00 Lakh
75 Lakh
Investment period
Rate of return
Total investment
Value at the end of the invt. term
Rule 2: Make time work for you!
15
The more you delay your start – the more you have to invest later to catch up

Mr. Smart
Per month saving `5, 000
`75 Lacs `3.5 Cr
`15, 000
@ 8% p.a.* @ 15% p.a.*
How much would theyhave after 30 years
Mr. Intelligent
This is for illustration purposes only. Calculations are based on assumed rate of return and actual return on your investments can be more or less than what has been used in this illustration. *Compounded monthly, all figures are rounded.
Rule 3: Boost your savings – Invest Right!
16
Earning the right return will help you to create more wealth
This is for illustration purposes only. Calculations are based on assumed rate of return and actual return on your investments can be more or less than what has been used in this illustration. *Compounded monthly, all figures are rounded.
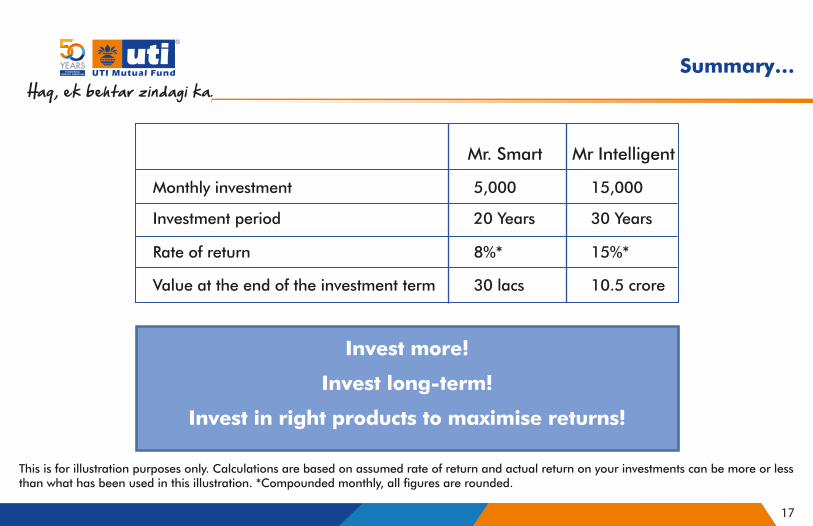
Mr. Smart Mr Intelligent
Monthly investment 5,000 15,000
Investment period 20 Years 30 Years
Rate of return 8%* 15%*
Value at the end of the investment term 30 lacs 10.5 crore
Invest more!
Invest long-term!
Invest in right products to maximise returns!
Summary…
17

18
Asset Classes

Equities outperform other asset classes over the long term
Source: IIFL, Internal; *1-3 year deposit rate; ^excluding dividends; data as at end FY2011
WPI Inflation Bank FD* BSE Sensex^
Cumulative annualizedreturns: 1982 to 2011
6.75%
8.96%
2.08%
16.75%
9.37%
Growth
Real Growth
Performances of Various Asset Classes
19

Individual Investors are scared of…
The Downside Risk in Equities
The Risk of Market Volatility
The Risk of Market Timing
20

21
Does Timing Work?
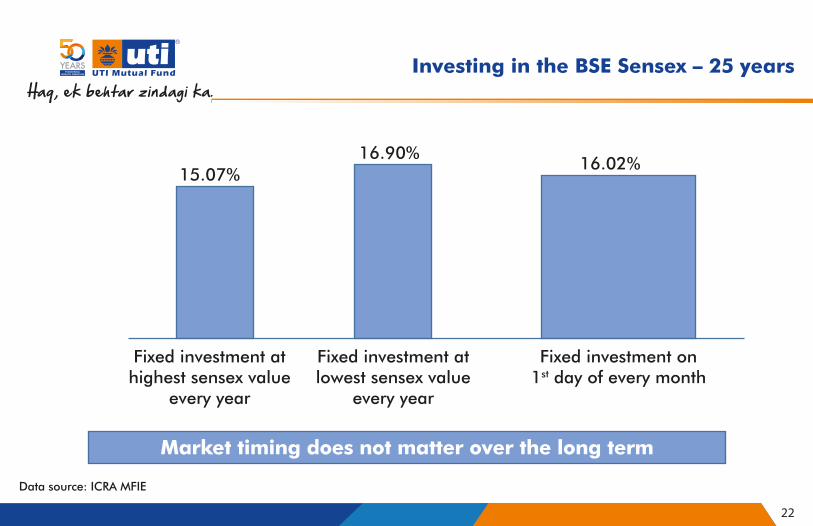
Market timing does not matter over the long term
Data source: ICRA MFIE
16.02% 16.90% 15.07%
Fixed investment athighest sensex value
every year
Fixed investment atlowest sensex value
every year
Fixed investment on1st day of every month
Investing in the BSE Sensex – 25 years
22

23
Power of Compounding – 8th Wonder of the World.

ExpectedReturn
9% 1,121,122 1,830,743 2,941,784
15% 3,243,530 6,923,280 14,677,180
18% 5,737,253 14,113,585 34,578,806
25 Yrs. 30 Yrs. 35 Yrs.
Amt. in `
Example : SIP of `1000/- p.m.
24

Table Illustrating the power of compounding (Assumed rate of return: 12% p.a.)
Monthly Investment(`)
12% return per annum
5 years 10 years 15 years 20 years 25 years
2,000 1.65 Lakh 4.65 Lakh 10.09 Lakh 19.98 Lakh 37.95 Lakh
5,000 4.12 Lakh 11.62 Lakh 25.23 Lakh 49.96 Lakh 94.88 Lakh
10,000 8.25 Lakh 23.23 Lakh 50.46 Lakh 99.91 Lakh 1.90 Crore
15,000 12.37 Lakh 34.85 Lakh 75.69 Lakh 1.50 Crore 2.85 Crore
20,000 16.50 Lakh 46.47 Lakh 1.01 Crore 2.00 Crore 3.80 Crore
25,000 20.62 Lakh 58.08 Lakh 1.26 Crore 2.50 Crore 4.74 Crore
50,000 41.24 Lakh 1.16 Crore 2.52 Crore 5.00 Crore 9.49 Crore
The above table is for illustration purpose only and not an indication of the performance of any of the schemes of UTI Mutual Fund.Calculations are based on assumed rate of return and actual return may be more, or less.
Source : Internal
Invest Systematically to Benefit from the Power of Compounding
The Power of Compounding: Illustration A
25

Table Illustrating the power of compounding (Assumed rate of return: 12% p.a.)
Monthly Investment(`)
12% return per annum
5 years 10 years 15 years 20 years 25 years
2,000 1.79 Lakh 5.57 Lakh 13.54 Lakh 30.32 Lakh 65.68 Lakh
5,000 4.48 Lakh 13.93 Lakh 33.84 Lakh 75.80 Lakh 1.64 Crore
10,000 8.97 Lakh 27.87 Lakh 67.69 Lakh 1.52 Crore 3.28 Crore
15,000 13.45 Lakh 41.80 Lakh 1.02 Crore 2.27 Crore 4.93 Crore
20,000 17.94 Lakh 55.73 Lakh 1.35 Crore 3.03 Crore 6.57 Crore
25,000 22.42 Lakh 69.66 Lakh 1.69 Crore 3.79 Crore 8.21 Crore
50,000 44.84 Lakh 1.39 Crore 3.38 Crore 7.58 Crore 16.42 Crore
The above table is for illustration purpose only and not an indication of the performance of any of the schemes of UTI Mutual Fund.Calculations are based on assumed rate of return and actual return may be more, or less.
Source : Internal
Invest Systematically to Benefit from the Power of Compounding
The Power of Compounding: Illustration B
26

Table Illustrating the power of compounding (Assumed rate of return: 20% p.a.)
Monthly Investment(`)
20% return per annum
5 years 10 years 15 years 20 years 25 years
2,000 2.07 Lakh 7.65 Lakh 22.69 Lakh 63.23 Lakh 1.73 Crore
5,000 5.17 Lakh 19.12 Lakh 56.71 Lakh 1.58 Crore 4.31 Crore
10,000 10.35 Lakh 38.24 Lakh 1.13 Crore 3.16 Crore 8.63 Crore
15,000 15.52 Lakh 57.35 Lakh 1.70 Crore 4.74 Crore 12.94 Crore
20,000 20.69 Lakh 76.47 Lakh 2.27 Crore 6.32 Crore 17.25 Crore
25,000 25.86 Lakh 95.59 Lakh 2.84 Crore 7.90 Crore 21.57 Crore
50,000 51.73 Lakh 1.91 Crore 5.67 Crore 15.81 Crore 43.13 Crore
The above table is for illustration purpose only and not an indication of the performance of any of the schemes of UTI Mutual Fund.Calculations are based on assumed rate of return and actual return may be more, or less.
The Power of Compounding: Illustration C
27
Source : Internal
Invest Systematically to Benefit from the Power of Compounding
28
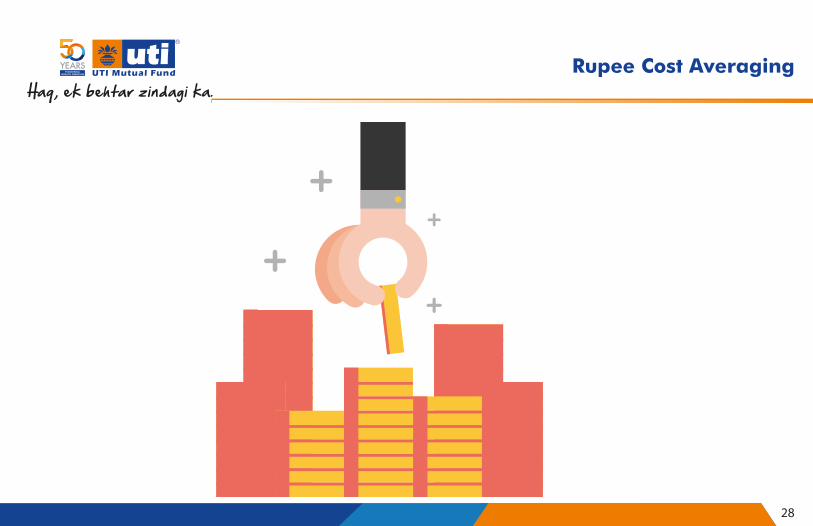
Rupee Cost Averaging

• Takes the guesswork out of “timing” the market
• Involves investing a set amount of money at regular intervals over a long period of time
• You automatically buy more units when prices are lower and fewer units when prices are higher
Total Investment `12,000, total no. of units purchased 1206.82 Average cost per unit 9.94 < 10
Lower average cost per unit over time
Benefit of SIP - Rupee Cost Averaging
29
Example for illustration purpose only
Month Amount Invested`
Purchase Price`
No. of unitspurchased
1 1000 10 100.00 2 1000 9 111.11 3 1000 10 100.00 4 1000 11 90.91 5 1000 12 83.33 6 1000 10 100.00 7 1000 09 111.11 8 1000 08 125.00 9 1000 11 90.9110 1000 09 111.1111 1000 10 100.0012 1000 12 83.33

Magic of SIP
30
You started from 20000 & ended at 20000 but
generated CompoundedReturn of 27%
Your monthly Investment ofRs.1000 (Total `36000) turned
into `54000
Sensex20000
Jan 2008
Sensex20000
Dec 2010
Sensex15000
Sensex15000Sensex
9000March2009

REGISTERED OFFICE: UTI Tower, 'Gn' Block, Bandra Kurla Complex, Bandra (E), Mumbai - 400051. . Phone: 022 – 66786666. STATUTORY DETAILS: UTI Mutual Fund has been set up as a Trust under the Indian Trust Act, 1882. SPONSORS: State Bank of India, Punjab National Bank, Bank of Baroda and Life Insurance Corporation of India (liability of sponsors limited to `10,000/-).
INVESTMENT MANAGER: UTI Asset Management Co. Ltd. (Incorporated under the Companies Act 1956). TRUSTEE: UTI Trustee Co. (P) Ltd. (incorporated under the Companies Act 1956).
RISK FACTORS: All investments in Mutual funds and securities are subject to market risks and the NAV of the units issued under the scheme may go up or down depending upon the factors and forces affecting the securities market. Past performance of the Sponsor / Mutual Fund / Scheme(s) / AMC is not necessarily an indication of future results and may not necessarily provide a basis for comparison with other investments. All Mutual Funds and Securities investments are subject to market risks and there can be no assurance or guarantee that the objectives of the scheme will be achieved. Statements/Observations made are subject to the laws of the land as they exist at any relevant point of time. Growth, appreciation and income, if any, referred are subject to the laws of the land as they exist from time to time. The name of the scheme does not in any manner indicate either the quality of the scheme, its future prospects or returns. The scheme is subject to risks relating to Credit, Interest Rates, Liquidity, Securities Lending, reinvestment risk , default risk and Investment in Overseas Markets, Trading in debt and equity derivatives (the specific risk could be Credit, Market, Illiquidity, Judgmental error, Interest rate swaps and Forward rate agreements), investment in securitised papers and scheme specific risk. Please contact the nearest UTI Financial Centre, Chief Representative or AMFI/ NISM certified UTI MF Independent Financial Advisor for a copy of the Key Information Memorandum cum Application Form and Scheme Information Document. Please read the Scheme Information Document carefully before investing.
Web site: www.utimf.com
Registrar: M/s Karvy Computershare Pvt. Ltd. Narayani Mansion, H. No. 1-90-2/10/E, Vittalrao Nagar, Madhapur, Hyderabad - 500 081. Tel.: 040 – 23421944 to 47, Fax: 040 - 23115503, Email:[email protected]
Benefit of SIP - Rupee Cost Averaging
31

MUTUAL FUND INVESTMENTS ARE SUBJECT TO MARKET RISKS,
READ ALL SCHEME RELATED DOCUMENTS CAREFULLY.
TOLL-FREE: 1800 22 1230 “UTIMF” to 5676756 [email protected] www.utimf.com | SMS