a quantitative titration model for evaluating …
TRANSCRIPT

A QUANTITATIVE TITRATION MODEL FOR EVALUATING CALCIUM HYDROXIDE
REMOVAL TECHNIQUES
A THESIS
SUBMITTED TO THE FACULTY OF THE GRADUATE SCHOOL
OF THE UNIVERSITY OF MINNESOTA
BY
MARK TERRANCE PHILLIPS
IN PARTIAL FULFILLMENT OF THE REQUIREMENTS
FOR THE DEGREE OF
MASTER OF SCIENCE
AUGUST 2011

©Mark Terrance Phillips, August 2011

i
Acknowledgements
Dr. McClanahan
Thank you for the opportunity to be a part of an excellent graduate program. I am very
appreciative of your expert guidance and advice, as well as unending encouragement.
Your mentorship will serve me well in future years.
Dr. Bowles
Thank you for your great contribution to my clinical and research training. I am thankful
for your valuable advice. This has made me a better dentist and enabled me to develop
better scientific and clinical judgment.
Dr. Baisden
Thank you for your leadership and contribution to my clinical and didactic training. I
have benefited from your encouragement and guidance. Your character and hard work
have positively impacted many students.
Dr. Darryl Hamamoto
Thank you for taking valuable time and effort to contribute greatly to my project. Your
insights have helped me consider my research from different perspectives.
Drs. Spitzmueller, Baumgartner, Edmunds, and Zucker
Thank you for your exceptional contributions in the graduate clinic. I have benefited
from your experience immensely.
Drs. Barsness, Harris, Andrew Wiswall, Read, Anders, Nguy, Jeff Wiswall, Meade, and
Bierma
Thank you for your camaraderie throughout the past two years.
Marlene, Lisa, Ling, Cecelia, Scott, Becky, Jane
Thank you for your valuable support and assistance. Your hard work has made an
important difference.

ii
Dedication
I dedicate this work to the memory of my father, Terrance George Phillips.
To my wife, Andrea
You have been a provider of incredible support during my residency. At every turn, you
have walked alongside me. I thank you for providing encouragement and assisting with
Alice. I look forward to our future years together. I love you.
To my mother, Bernadine Mary Phillips, and family
I thank you for your enduring prayers and support. You have provided me with the tools
and confidence needed to pursue higher education.
To my educators
I have been the beneficiary of your mentorship at all levels. I cannot express adequately
my gratitude for your contributions to my development professionally and personally.
iii
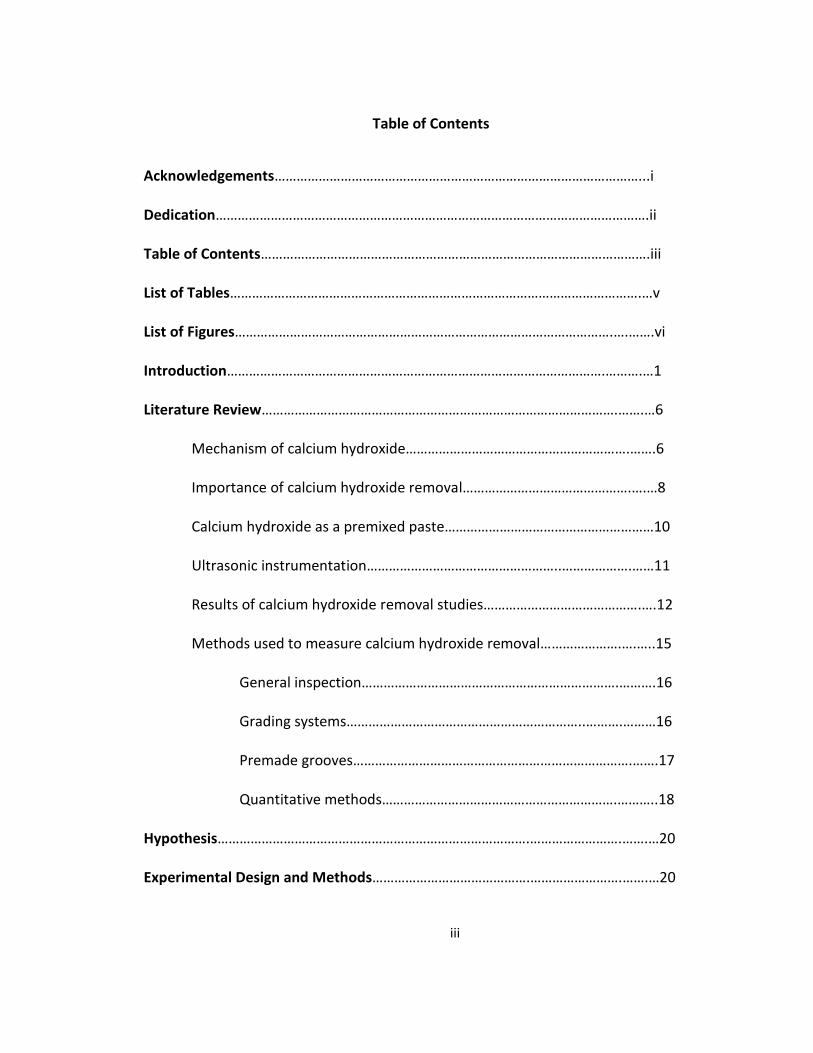
Table of Contents
Acknowledgements………………………………………………………………………………………...i
Dedication……………………………………………………………………………………………………….ii
Table of Contents…………………………………………………………………………………………….iii
List of Tables………………………………………………………………………………………………….…v
List of Figures………………………………………………………………………………………….….…….vi
Introduction………………………………………………………………………………………….……….…1
Literature Review…………………………………………………………………………………….…….…6
Mechanism of calcium hydroxide…………………………………………………….…….6
Importance of calcium hydroxide removal……………………………………….….…8
Calcium hydroxide as a premixed paste…………………………………………………10
Ultrasonic instrumentation……………………………………………..……………….……11
Results of calcium hydroxide removal studies…………………………………….….12
Methods used to measure calcium hydroxide removal………………….….…..15
General inspection…………………………………………………………….……….16
Grading systems………………………………………………………..……….………16
Premade grooves………………………………………………………………….…….17
Quantitative methods……………………………………………………….………..18
Hypothesis………………………………………………………………………….…………………….…….…20
Experimental Design and Methods…………………………………….…………………….…….…20

iv
Selection and preparation of teeth……………………………………………………….20
Glycerin transfer…………………………………………………………………………………..26
Titration of the mixture………………………………………………………………………..28
Standards……………………………………………………………………………………………..31
Translation of sample data using the standard equation………………………39
Positive and negative controls…………………………………………………….………..42
A "second" standard curve……………………………………………………….…………..43
Data analysis…………………………………………………………………………….…………..45
Results………………………………………………………………………………………………..……………46
Discussion………………………………………………………………………………………..………………49
Conclusions………………………………………………………………………………………………………58
Bibliography…………………………………………………………………………………………………….59
Appendices………………………………………………………………………………………………………68

v
List of Tables
Table 1. An approximate algorithm for HCL addition………………………….…………………...31
Table 2. Sample cumulative micromoles and calculated remaining Calasept®…………41
Table 3. Group means of Calasept®……………………………….……………………………….……….…46
Table 4. P-values for pairwise comparisons……………………………………………………..……….46

vi
List of Figures
Figure 1. Radiographs of tooth samples……………………………………………...…..…....…….23
Figure 2. Preparation and blinding scheme………………………………….………...….….…..…28
Figure 3. Approximate algorithm for HCL addition……………………..…………..….…..….…33
Figure 4. Representative titrations from groups 1 & 2.……………….…………...……...…..34
Figure 5. Representative titrations from groups 3 & 4.………………...…….…..…...………34
Figure 6. Standard curve………………………………………………………………………….….…..….…37
Figure 7. Example of sample titration and regression line………………………..….….……38
Figure 8. Second standard curve………………………………………………………….……..………….48
Figure 9. Bar graph of group means of residual Calasept®……………………………...….…46
Figure 10. Scanning electron micrographs…………………………………….………..………….….47

1
Introduction
Bacteria and their byproducts found within caries and the oral cavity invade the
root canal system and are the etiology of pulp and periradicular pathosis (Lin L., Di Fiore,
Lin J., & Rosenberg, 2006; Kakehashi, Stanley, & Fitzgerald, 1965). While innate
defenses of the pulp such as outward flow of fluid, antibodies, and the obstructive
odontoblast process combat these pathogens, destructive processes may ultimately
consume the pulp (Nagaoka, Miyazaki, Lui, Iwamoto, Kitano, Kawagoe, 1995).
The goal of endodontic therapy is to eliminate microorganisms by cleaning,
shaping, and obturation of the root canal system. Mechanical instrumentation of the
root canal with saline alone has been shown to eliminate over 90% of bacteria from the
root canal space (Siqueria, Lima, Magalhaes, Lopes, & de Uzeda, 1999). This high
percentage exists despite complex tooth anatomy such as ovoid canals, fins, isthmuses,
accessory canals, and C-shaped canals (Baisden, Kulild, & Weller, 1992; Melton, Krell, &
Fuller, 1991; Mannocci, Peru, Sheriff, Cook, and Pitt Ford, 2005). However, it has been
demonstrated that complete removal of all remnants of tissue, bacteria, and their
byproducts is seldom possible (Bystrom & Sundqvist, 1985).
In order to address microbes that are housed in these various dentin
architectures, irrigants such as ethanol, ethylene diaminetetraacetic acid (EDTA),
sodium hypochlorite (NaOCl), chlorhexidine (CHX), and citric acid are routinely used as
medicinal adjuncts. Other irrigants are used to mix with intracanal medicaments (ICMs)

2
and to remove these dressings. Many studies have examined which type or
concentration of irrigant is most effective. Buck, Cai, Eleazer, Staat, & Hurst (2001)
found that alkaline solutions such as NaOCl, CHX, and ethanol were effective at
detoxifying lipopolysaccharide. The ICM calcium hydroxide (Ca(OH)2) was also effective.
Intracanal medicaments of a variety of materials have been used throughout the
history of dentistry. Like endodontic irrigants, ICMs have been used for multiple
reasons. Chong and Pitt Ford (1992) suggested an ICM may be used for reduction of
bacteria, reduction of inflammatory mediators in periapical tissue, to render canals
inert, to neutralize tissue debris, act as a barrier against leakage, and help to dry
persistently wet canals. Without the use of an ICM, bacterial loads may rapidly increase
(Bystrom, Claesson, & Sundqvist, 1985).
Some outcome studies have supported the use of ICMs. In a prospective clinical
study, it was found there was a 10% greater healing rate in two step endodontic
therapies using Ca(OH)2 as an ICM; however, this difference was not statistically
significant (Trope, Delano, & Orstavik, 1999). Research using a dog model with
histological analysis determined that greater healing occurred in two visits (Katebzadeh,
Hupp, & Trope, 1999). The necessity of using ICMs in infected root canals has been
challenged recently. Penesis (2008) used mean periapical index scores to measure
lesion reduction at one year in a randomized clinical trial. Calcium hydroxide mixed with
CHX was used as an ICM. No difference was found in one versus two appointment

3
treatment. In a systematic review of the literature, Ng, Mann, Rahbaran, Lewsey, &
Gulabivala (2008) failed to identify the use of two appointments with ICMs as having a
strong effect on the outcome of root canal treatment. They describe the use of ICMs as
the main biological reason for multiple appointment endodontics. The debate for one
versus two appointment endodontics may continue, but the practicing clinician may find
circumstances in which another appointment is warranted—with the use of an ICM.
Calcium hydroxide has gained great favor as an ICM. The origin of the medicine
is CaCO3, or limestone. This can be heated to form calcium oxide, which combines with
water to form Ca(OH)2 (Fava & Sanders, 1999). Calcium hydroxide is used for many
purposes, and in endodontics a great body of literature supports its use as an ICM. An in
vitro study found that using Ca(OH)2 within the canal system for 7 days eliminated all
bacteria (Sjogren, Figdor, Spangberg, & Sundqvist, 1991). Hasselgren, Olsson, & Cvek
(1998) demonstrated that Ca(OH)2 may aid in the dissolution of necrotic tissue. Calcium
hydroxide can stimulate formation of calcified tissue, and has been used in apexification
as well as apexogenesis (Walia, Singh Chawla, & Gauba, 2001; Cvek, 1978).
Schilder (1967) describes the objectives of root canal treatment as cleaning,
shaping, sterilization, and total obturation of the root canal system. These points are an
effort to seal off the root canal system from the periodontal ligament and bone. Many
obturation methods and materials have sought to accomplish this "seal," often relying
on bonding or nonbonding sealers and core materials. Removal of debris and dental

4
materials such as Ca(OH)2 is a requirement of Schilder's original obturation objectives
and a requirement for predictable use of any obturation system. Residual Ca(OH)2 can
contribute to clinical problems. One study used spectroscopy to measure the
interaction of residual Ca(OH)2 with ZOE sealers. It was observed that when even a small
layer of Ca(OH)2 was exposed to ZOE sealers in vitro, a rapid reduction of eugenolate O-
H groups occurred within seconds. When compared to the standard spectroscopy
graphs at different time points, this represented a flash set of the ZOE sealer and
therefore interference with obturation (Margelos, Eliades, Verdelis, & Palaghias, 1997).
Many studies have attempted to measure removal of debris. Most use a direct
visualization measurement technique—removing Ca(OH)2, splitting the teeth, then
photographs (through a microscope or camera) or micrographs to count pixels on a grid
system where debris remains. Potential downfalls of this general approach include
inaccuracies from splitting teeth, two-dimensional quantification on a curved, three-
dimensional surface, inability to differentiate debris from Ca(OH)2, cumulative unknown
effects of reuse of the same samples using the Bramante technique, and difficulty in
translating percent debris to clinical practice (Bramante, Berbert, & Borgese, 1987).
Recently, micro CT studies have improved upon some aspects of this two-dimensional
counting approach.

5
This study addresses the question: "How well do we remove the premixed
calcium hydroxide paste Calasept® from the root canal system when it is used as an
intracanal medicament?"
The approach utilized in this investigation seeks to eliminate many of the
drawbacks of direct visualization by employing a quantitative chemical analysis to
determine the amount of the unknown reactant Ca(OH)2. In order to dissolve any
remaining Ca(OH)2, a glycerin solution will be used. Glycerin is a colorless, viscous
solution with hygroscopic properties and therefore is a good moistener. Glycerin has a
long history of being used to create paste mixes with Ca(OH)2 and barium sulphate as
well as other substances such parachlorophenol (Caliskan, Sen, & Ozinel, 1994; Fava and
Saunders, 1999). Pilot studies were used to determine that a 60% : 40% glycerin :
distilled water mixture was the best balance between dissolution and viscosity of the
premixed proprietary paste Calasept®. The canal system in each tooth will be filled with
a predetermined amount of Calasept® and different instrumentation techniques will be
used to remove as much Calasept® as possible. Next, any Ca(OH)2 left in the canal will
be quantified in the following manner: 1. the 60% glycerin solution will be used to
dissolve remaining Ca(OH)2 in the tooth, 2. the alkaline mixture will then be transferred
from the tooth to a tube where a titration with acid will be performed, and 3.
comparison to a standard curve will allow for translation of moles of acid into mg of
Calasept®.

6
Literature review has revealed very minimal use of quantitative chemical analysis
using titration in endodontics. Cohen and Lasfargues (1988) used titration of Ca(OH)2
and Ca(CO)3 with HCL in order to determine the rate of carbonation. This microtitration
model represents a novel approach to studying removal of Ca(OH)2 in endodontics.
Literature Review
Mechanism of Calcium Hydroxide
Ca(OH)2 as an intracanal medicament has been extensively studied and well
established in clinical use. In 1920 Hermann introduced Ca(OH)2 as an ICM. Calcium
hydroxide properties include antimicrobial activity, tissue dissolution, resorption
inhibition, and induction of hard tissue. In aqueous solution, Ca(OH)2 diffuses into
calcium and hydroxyl ions. Calcium hydroxide has a pH of 12.6. The large amount of
hydroxyl ions liberated interferes with the bacterial cytoplasmic membrane integrity
largely by interruption of transfer of nutrients and destruction of phospholipids from
unsaturated fatty acids (Estrela, Sydney, Bammann, & Felippe, 1995). It has also been
found that hydroxyl ions can create free radicals that can interfere not only with
bacterial membranes but also bacterial DNA replication. The alkaline pH can alter
enzyme activity and cellular metabolism. Also, Ca(OH)2 acts as a physical barrier to
bacterial proliferation that can raise the pH of dentin (Siqueira & Lopes, 1999). It has

7
been demonstrated that calcium ions diffuse across the dentin from the canal to the
external tooth surface (Tronstad, Barnett, Scwartzben, & Frasca, 1981). This diffusion
of ions improves with smear layer removal (Foster, Kulild, & Weller, 1993). In one in
vitro study of 12 teeth, holes were drilled in the cervical and apical regions at two
different depths. pH soon increased in the inner dentin, peaking at 10.8 cervically and
9.7 apically. In outer dentin pH peaked in 2-3 weeks at 9.3 cervically and 9.0 apically
(Nerwich, Figdor, & Messer, 1993). Heward and Sedley (2011) created simulated
external resorption defects in roots of extracted human incisors and showed an increase
in pH with Ca(OH)2 and MTA over 4 weeks by measurement on the external root
surface.
Calcium hydroxide has been shown to inactivate certain molecular virulence
factors in both gram negative and gram positive bacteria. It also hydrolyzes the lipid
moiety of bacterial LPS, resulting in the release of free hydroxyl fatty acids (Safavi &
Nichols, 1993). Enzyme-linked immunosorbant assay determined that Ca(OH)2 can
detoxify lipotechioic acid from E. faecalis (Baik et al., 2008). Additionally, Ca(OH)2
reduces TNF-alpha release from monocytes. In a DNA-DNA hybridization technique,
Ca(OH)2 as an ICM reduced pathogenic species associated with pulp necrosis (de Souza,
Teles, Souto, Chaves, & Colombo, 2005). Use of calcium hydroxide as an ICM reduces
postoperative pain in previously symptomatic teeth and decreases the amount of pain
in retreatment cases (Yoldas, Topuz, Isci, & Oztunc, 2004). When dog premolar roots

8
were filled with saline, endotoxin, or endotoxin plus Ca(OH)2, then simply left open,
histologically the endotoxin plus Ca(OH)2 group was similar to the control group. This
provides support for the effect of Ca(OH)2 against endotoxin (Silva, Nelson-Filho,
Leonardo, Rossi, & Pansani, 2002). However, Candida species as well as other
microorganisms such as Olsenella uli may be resistant to Ca(OH)2 (Waltimo, 1999; Rocas
& Siqueria, 2010).
Importance of Calcium Hydroxide Removal
While Ca(OH)2 is an effective antimicrobial ICM, its thorough removal before
final obturation is imperative. Ca(OH)2 may interfere with ZOE based sealer setting
reactions. Roth sealer is one such commonly used ZOE based sealer, and is considered
to be the gold standard other sealers are measured against. An in vitro study found that
residual Ca(OH)2 may interfere with sealer entrance into dentinal tubules and inhibit
bonding of resin with dentin (Calt & Serper, 1999). In another study using methylene
blue, leakage increased after Ca(OH)2 ICM in the dye leakage portion of the experiment,
but not fluid filtration (Kontakiotis, Wu, & Wesselink, 1997). Residual Ca(OH)2 was also
found to preferentially interact with eugenol in ZOE sealers, resulting in a flash set of
sealer (Margelos et al., 1997). On the other hand, Ca(OH)2 does not appear to interfere
with the seal with Resilon® and Realseal® (Wang, Debelian, Teixeira, 2006).

9
Residual Ca(OH)2 has been clearly shown to interfere with materials at the apex;
in one in vitro study using dye leakage, it was determined that canals previously
medicated with Ca(OH)2 using an ICM resulted in greater leakage (S. Kim & Y. Kim,
2002). Ca(OH)2 also interferes with white mineral trioxide aggregate (MTA), a material
that has been used in endodontics for a variety of applications, such as apexification,
perforation repair, obturation with open apices, obturation during retreatment, before
and after root end surgery, and in dens in dente cases (Stefopoulos, Tsatsas, Kerezoudis,
& Eliades, 2008; Whitworth, 2005; Bogen & Kuttler, 2009).
Some studies suggest residual Ca(OH)2 is not a concern. Medication with
Ca(OH)2 improved marginal adaption of the MTA apical barrier (Bidar, Disfani,
Gharagozloo, Khoynezhad, & Rouhani, 2010). Another investigation used extracted
canines and premolars with straight roots to examine how pretreatment with Ca(OH)2
affects apical leakage—results determined that the use of three different Ca(OH)2
preparations as ICMs decreased dye leakage over the no ICM control group (Porkaew,
Retief, Barfield, Lacefield, & Soong, 1990). An in vitro investigation demonstrated that
ICM of Ca(OH)2 did not interfere with methylene blue dye leakage (Holland, Alexandre,
Murata, Dos Santos, & Dezan, 1995).

10
Calcium Hydroxide as a Premixed Paste
Over the years Ca(OH)2 has been delivered to the root canal in multiple vehicles
in an attempt to improve radiopacity, flow, consistency, and antibacterial action.
Traditionally, Ca(OH)2 powder has been mixed with a sterile solution such as water or
saline and placed in the canal. Fava and Saunders (1999) classify Ca(OH)2 preparations
as aqueous, viscous, and oily. In aqueous preparations such as Calasept® and Ultracal®,
the pH is high and release of ions is rapid. Viscous vehicles such as Calen® provide
slower release for extended periods. Oily vehicles like Endoapex® and Vitapex® provide
the slowest diffusion and the lowest solubility. Siqueria and Lopez suggested that
because bacteria such as E. Faecalis can tolerate high pH (9-11) the delivery vehicle must
not alter the pH significantly. Some mixtures of Ca(OH)2, such as that with CMCP, have
been shown to increase antimicrobial efficacy (Siqueria & Lopez, 1999). Using an agar
diffusion model with various Ca(OH)2 concentrations and delivery vehicles, one study
found higher concentrations of Ca(OH)2 had greater inhibition. Ultracal®, which uses a
methylcellulose vehicle, was equally as effective at 35% Ca(OH)2 as higher percentage
Ca(OH)2 pastes. This suggests the vehicle of delivery rather than the concentration of
Ca(OH)2 has important effects on the ability to remove Ca(OH)2 paste (Blanscet, Tordik,
& Goodell, 2008).
Calasept® is a premixed paste commonly used in the United States. According to
Ghose, this formulation is made up of 52% Ca(OH)2, 8% calcium chloride, 4% sodium

11
bicarbonate, 8% potassium chloride, 0.35% sodium chloride, and 16% water (Ghose,
Baghdady, & Hykmat, 1987). According to the material safety data sheet, Calasept®
contains barium sulfate and has a pH of 12.4. The manufacturer's website states that
100 mg of Calasept contains 41.07 mg of Ca(OH)2, 8.33 mg of barium sulfate, and 50.6
mg of sterile isotonic saline (J.S. Dental Manufacturing, Inc., 2011).
Ultrasonic Instrumentation
Richman (1957) introduced a method of canal debridement that included
ultrasonics. Ultrasonic activation results in acoustic streaming, defined as the
generation of time-independent, steady unidirectional circulation of fluid in the vicinity
of a small vibrating object. Cunningham and Martin (1982) were among the first to
assess the ability of ultrasonics to assist in debridement of the root canal system. The
Endosonic Ultrasonic System was superior to conventional hand filing as determined by
SEM. Ahmad, Roy, & Kamaruden (1992) described the action of acoustic streaming
created by ultrasonics. Use of ultrasonics with small files, such as size #10-15 hand files,
created eddies of greatest velocity and greatest displacement velocities. Contact with
canal walls caused loss of this streaming phenomenon. Increased power setting on the
ultrasonic unit increased efficacy. Jiang et al. (2011) demonstrated in an in vitro model
that higher intensity resulted in a higher file amplitude and file oscillation, creating
cleaner canals.

12
Results of Calcium Hydroxide Removal Studies
Recent studies have examined the effectiveness of modern methods of removing
Ca(OH)2 from the root canal. Lambrianidis, Margelos, & Beltes (1999) found that
Ca(OH)2 is incompletely removed with various irrigation methods. They used hand filing
in combination with 3% NaOCl, 3% NaOCl + 17% EDTA, or normal saline. Results
determined that 45% of the surface area was still covered with Ca(OH)2. The same
authors demonstrated regardless of whether sterile saline, CHX gel, or CHX solution was
mixed with the Ca(OH)2, residual Ca(OH)2 remained (Lambrianidis, Margelos, & Beltes,
2006). Nandini, Velmurugan, & Kandaswamy (2006) found that various irrigants had
different removal abilities; citric acid worked better than EDTA in removing Metapex®, a
commercially available paste. Canals were significantly cleaner at the 1 mm level with
2.6% NaOCl than those cleaned using hand instrumentation alone.
Many studies have examined not only various irrigants but passive sonic and
ultrasonic instrumentation. An early investigation found that sonically cleaned canals
were not significantly cleaner than canals cleaned by hand alone, but it did increase
ease of preparation (Tronstad et al., 1985). Torabinejad (1994) described (but did not
test) a passive step back instrumentation technique; ultrasonics were used at 1 mm
from working length and alternated with files. Then a #15 hand file was ultrasonically
activated for 1-2 minutes. Lev, Reader, Beck, & Meyers (1987) found that the step back
ultrasonic technique was more effective at the 1 and 3 mm levels for isthmuses of

13
mandibular molars but not for canals. Stamos, Sadeghi, Haasch, & Gerstein (1987)
determined that at 1 mm from the apex, ultrasonic instrumentation produced the
cleanest canals—but there was no difference between hand and sonic instrumentation.
Lastly, ultrasonic activation also improves use of 2% CHX in removing Ca(OH)2 over
irrigation alone (van der Sluis, Wu, & Wesselink, 2007).
Different time periods have been used for passive ultrasonic instrumentation
(PUI). Balvedi, Versiani, Manna, and Biffi (2010) used 30 s of PUI for removing Ca(OH)2
mixed with various carriers and found the PUI more effective than irrigation + hand file
only. Another study used 5.25% NaOCl with 3 minutes of sonic and ultrasonic
instrumentation and quantified 15.1% of residual debris left with sonic and 16.7% with
ultrasonic instrumentation (Jensen, Walker, Hutter, & Nicoll, 1999). After hand
instrumentation alone, 31.6% of canal walls had residual debris. Another study that
utilized the 3 minute time period for PUI but was performed on teeth before extraction
found that PUI created canals with significantly cleaner walls than irrigation with 5.25%
NaOCl alone (Archer, Reader, Nist, Beck, & Meyers, 1992). Sabins, Johnson, and
Hellstein (2003) found 19.6% of canal walls had residual debris remaining after 30 s or 1-
minute sonic instrumentation and 15.4% rate with ultrasonic instrumentation, but hand
instrumentation alone left 36.7% of walls covered with debris. This was in close
agreement with Jensen et al. (1999); there was no difference between 30 and 60 s of
PUI.

14
Root curvature also influences the effect of PUI. While the last two mentioned
studies used curved molar roots, Crumpton, Goodell, and McClanahan (2005) utilized
straight roots with rotary nickel titanium file preparation. They found 9.18% of residual
debris on canal walls after rotary instrumentation alone and with no smear layer
removal—far less than previous studies using curved roots. Straight roots help isolate an
accurate measurement of residual Ca(OH)2 because removal of debris is more
predictable, especially when testing ultrasonics, which lose effectiveness when
instruments contact a canal wall (Ahmad, Pitt Ford, & Crum, 1987). Another study
examined routine irrigation, hydrodynamic irrigation, and PUI in straight and curved
roots; PUI was more effective in straight canals, and hydrodynamic stimulation was
more effective in curved canals (Amato, Vanoni-Heineken, Hecker, & Weiger, 2011).
Recently, removal of Calasept® was evaluated in extracted molar canals with
more than 15 degrees of curvature (Kenee, Allemang, Johnson, Hellstein, & Nichol,
2006). Four groups were used: NaOCl rinse alone, NaOCl with EDTA rinse, NaOCl with a
nickel titanium file rotated in the canal, and NaOCl with ultrasonic agitation. Rotary and
ultrasonic techniques were found to be significantly better in Ca(OH)2 when compared
to irrigants/#35 K file only. A weakness in this study is that twelve molar teeth were
reused several times to test the different categories. Cumulative effects of the EDTA, a
chelating agent, may have skewed the results. It was not indicated that statistical tests
took into account the reuse of the same specimens.

15
Computed tomography has also been used to examine removal of Ca(OH)2. One
study prepared 46 mandibular molars with root curvatures of 20 to 30° to study removal
of Ultracal®. Groups included rotary instruments only and rotary after sonic or
ultrasonic activation (for a total of 60 s of activation). Micro-CT was used to determine
volume of Ca(OH)2 remaining. Results indicated that rotary instrumentation plus PUI
produced significantly better removal than rotary plus sonic activation (Wiseman et al.,
2011). Nandini et al. (2006) used spiral CT to compare removal of Ca(OH)2 powder in
distilled water with the premixed Ca(OH)2 paste Metapex®. Ten percent citric acid
removed Ca(OH)2 powder better than Metapex®, suggesting the vehicle in which
Ca(OH)2 is prepared affects removal.
Methods Used to Measure Calcium Hydroxide Removal
Effectiveness of Ca(OH)2 removal from the root canal is affected by multiple
factors. Anatomic factors such as tooth type, root curvature, and canal morphology
may influence results. The packaging of Ca(OH)2 affects interaction with instruments
and irrigants like citric acid, EDTA, CHX, and NaOCl. Various PUI time periods have been
also tested. It is possible to hold these factors constant, but one must choose a model
to measure Ca(OH)2 removal. The method used has a bearing on whether the data is
parametric or nonparametric, the relevant statistical tests, and ultimately how the
results can be applied to clinical practice.
16
General Inspection Method: Early studies in the evolution of instrumentation
tactics used general inspection as a measurement technique. One such study utilized a
stereomicroscope to examine both halves of the split tooth and overall cleanliness,
smear layer removal, dentin chip removal, and tissue remnants were judged (Tronstad
et al., 1985). Cunningham and Martin (1982) used anterior teeth to study Ca(OH)2
removal. Teeth were split longitudinally and high and low power SEM was used to
broadly compare removal methods. Teeth were paired with and without ultrasonic
preparation. An observer determined which of the pair had the least debris and results
were compared with a sign test.
Grading Systems: An improvement over general inspection of the dentin wall
began with the use of grading systems. Various models have been used in which teeth
are split in half and a grading system is devised. Ahmad et al. (1987) used polystyrene
spheres to determine measurements of traverse displacement amplitude for acoustic
streaming. The results were used in various Ca(OH)2 removal methods in vitro. Teeth
were split with a mallet and chisel, then SEM was performed at 200x, 500x, and 800x
and representative sections were used to create a grading system. Three calibrated
judges then assigned scores of 0, 1, 2, or 3.
Premade Groove: Some studies have qualitatively evaluated premade internal
grooves that attempt to recreate internal anatomy variations. This type of data is
usually ordinal or nominal data, and statistical tests therefore are nonparametric. One

17
investigation created grooves in the internal dentin wall 2 mm by 0.2 mm by 0.5 mm
and filled them with Ultracal®. Digital photography was performed at 40x through a
microscope. A grading system was then devised to rank instrumentation methods for
the removal of Ca(OH)2 paste from the grooves (van der Sluis et al., 2007). Another
study created four shallow depressions at different points along the root, including one
groove positioned apically from the tip of the #25 file used for PUI. Teeth were
reapproximated with a prefabricated jig. This method has demonstrated reproducibility
in results. Digital images through a microscope were utilized, and grooves were judged
as either "clean" or "not clean” (Jiang et al., 2011). An advantage of this technique is
that the grooves created in the dentinal wall simulate irregularities seen in clinical
situations. However, these types of studies often reuse the same tooth specimen for
multiple measurements by reapproximating the tooth. Potential effects of reusing a
specimen for multiple measurements are a concern—especially when a chelating agent
such as EDTA was used. Another issue in the use of grading systems is that the area
being evaluated may vary considerably in debris amount. Debris is not always
distributed homogeneously, and an area being evaluated may give a higher or lower
grade than an adjacent area.
Quantitative Evaluation Method: Evolution of Ca(OH)2 removal studies has
resulted in development of quantification methods that include microscopic,
photographic, micrographic, and computed tomography. These methods usually

18
involved determining what percentage or volume residual debris/Ca(OH)2 is of the total
area. Microscopic methods included subjective analysis through a microscope of
remaining Ca(OH)2 or assignment of a grade, and scanning electron microscopes have
enabled the detection of minute amounts of debris. More recently, digital photographic
images imported into software programs have been used. These quantitative methods
have introduced the use of parametric data to debris removal studies.
Classic studies used creative techniques to quantify data. In 1987, Lev et al.
decalcified samples and cut them in cross section with an autocut microtome and a
carborundum knife at 1 and 3 mm from the apex. Histologic slides were projected on a
screen and traced to determine percentage of remaining debris. Stamos et al. (1987)
also made histologic sections and projected the slide to make tracings of remaining
debris. Jensen used photomicrographs of split teeth; projections were made onto a
screen to create a two by three foot image, and superimposition of a grid system
allowed the evaluator to count squares that contained debris. Remaining debris was
quantified (Jensen et al., 1999). Quantification of remaining tissue/debris has also been
examined using a pre-extraction tooth model. One study compared step back versus
step back + PUI in vivo, then immediately extracted the teeth. Histologic axial cross
sections were then used to determine the percent of cleanliness (Archer et al., 1992).
Modern software has allowed for new types of measurement. Sabins et al.
(2003) used a Nikon N90S digital camera to take an image of split teeth on which several

19
different removal techniques were used, and the digital image was then transferred into
Adobe Photoshop® 5.0 software and enlarged 100 times. Lines were superimposed at
the 3 and 6 mm level. Debris was traced and total number of pixels was counted by
using the program's "histogram" function. Percentage of debris of the root canal system
could then be calculated. One study used a Nikon Coolpix 4500 to take images. The
image was imported into Adobe Photoshop® 7.0 and enlarged 10x. The "lasso" and
"histogram" functions were used to quantify debris removal (Crumpton et al., 2005).
Kenee et al. (2006) also imported digital photographs into Photoshop® to perform a
pixel count; degree of enlargement was not specified. Several drawbacks exist for
quantification through counting pixels in a software program. High quality images
enhance our ability to enlarge photos—10x to 100x as discussed above. Since the
dentin wall is not flat but has a curvature of approximately 180°, a certain degree of
error is "built into” this method. What that error is has never been tested.
Hypothesis
Removal of the ICM, Calasept®, is improved with the use of PUI or a Greater
Taper file when compared to hand filing and irrigation alone.

20
Experimental Design and Methods
This study was approved by the Institutional Review Board at the University of
Minnesota.
Selection and Preparation of Teeth
Type of teeth: Extracted teeth with straight canals including single canal
maxillary, mandibular canines, and some mandibular premolars were collected from the
VA Medical Center and local oral surgery offices and stored in normal saline with 0.2%
sodium azide. Sodium azide was chosen as it has been shown to preserve the physical
characteristics of teeth (Reeh, Messer, & Douglass, 1989).
Preparation of teeth: Teeth were decoronated and the root length standardized
at 17.5 mm. A #10 K file was placed so it was just seen beyond the major foreman with
2.5x loupes (Surgitel®, Ann Arbor, MI). One mm was subtracted to determine working
length; if needed, additional tooth structure was removed from the coronal aspect to
standardize the WL at 17.5 mm.
Standardization of curvature: Teeth were radiographed from the buccal and
lingual view with the file in place as noted. Kodak RVG 6000 digital radiography was
used for all images throughout the experiment. The Pruett, Clement, and Carnes (1997)
method was used to determine angulation of canals. Canals with greater than 15°
curvature were excluded to standardize curvature.

21
Endodontic preparation: A #25 K flex-O hand file (Dentsply-Maillefer, Johnson
City, TN) was used to establish a glide path (Patino, Biedma, Liabana, Cantatore, &
Bahillo, 2005). Lexicon™ Gates-Glidden (GG) burs (Dentsply-Maillefer, Johnson City, TN)
were used to coronally flare prior to use of nitinol files (Davis, Marshall, & Baumgartner,
2002). A #4 GG bur (1.1 mm) was used to a 5 mm depth, a #3 GG bur (0.9 mm) was
used to a 7 mm depth, and a #2 (0.7 mm) GG bur used to 9 mm depth. The K3 file
system (SybronEndo, Cuyahoga Falls, OH) was chosen for its minimal canal aberration or
transportation and ability to stay centered in the canal (Schäfer, & Florek, 2003; Schafer
& Schlingemann, 2003). The K3 system also has been shown to have a reduced
remaining debris load than other systems (Kum, Kazemi, Cha, & Zhu, 2006). With K3
rotary files, the teeth were prepared using an alternating crown down method
according to the manufacturer's recommendation. A Model AEU-20 Aseptico rotary
handpiece motor (Woodinville, WA) was used for all preparation at an 8:1 ratio (300
RPM).
All preparations were done according to manufacturers’ recommendations.
Crown down began with the #60-0.06, then to the #50-0.04, and the preparation was
finished at the #50-0.06. If the #50-0.06 did not go to length, the #50-0.04 was
repeated. In some cases, the alternating crown down method was continued using a
#45-0.06, a #40-0.04, and a #35-0.06. The canal was then sequentially enlarged to a
#50-0.06. The canal taper was then enlarged to a 0.06 taper #50 for three reasons: to

22
allow for a greater volume of glycerin for the titration method, to ensure large enough
size so that all teeth were prepared to the same taper and apical size, and to reflect the
natural canal anatomy (Hecker, Bartha, Löst, & Weiger, 2010). Irrigation with one ml of
NaOCl 5.25% between files and recapitulation was performed between each file. The
end of the Maxi-I-probe (Dentsply, Elgin, IL) was set at 2 mm from the apex (Abou-Rass,
& Piccinino, 1982). A #20 file was pushed just slightly out the apex of the tooth to
remove any apical debris and to allow for later Calasept® to be expressed out the end,
ensuring a complete fill of calcium hydroxide. Thirty seconds of passive ultrasonic
irrigation with 5.25% NaOCl was used to remove residual debris (Balvedi, Versiani,
Manna, & Biffi, 2010; Sabins et al., 2003). A one minute soak with 17% EDTA was used
to remove the smear layer (Crumpton et al., 2005). A final 3 ml rinse of 5.2% NaOCl was
performed and canals dried with paper points. The teeth were transferred from their
NaZ-filled microcentrifuge storage containers (USA Scientific, Acala, FL) to pre-labeled
ice cube trays (with sample number). Teeth were rinsed externally with 2 ml of 5.25%
NaOCl and within the canal with 1 ml of NaOCl to remove any NaZ. Teeth were then
dried with paper points. Next, each tooth was labeled with its sample number using a
small piece of masking tape.
Filling of canal with calcium hydroxide: Pilot studies were used to test several
Ca(OH)2 placement methods including a reverse file spin and lentulo file placement
technique. Radiographs were used to judge placement. It was determined that no

23
method could provide a homogenous fill 100% of the time, but a very repeatable
density was obtained in the following manner. First, the Calasept® needle was inserted
until binding. Firm pressure was be used to force Calasept® out the apex until
visualized. The needle was then gently loosened and slowly reversed out of the canal
system while firm pressure was applied to the plunger. A spatula was used to wipe
excess Calasept® flush with the coronal end of the tooth.
Radiographic confirmation of calcium hydroxide fill: A strong correlation exists
between the radiographic appearance and the percent weight of Ca(OH)2 delivered
(Simcock & Hicks, 2006). Therefore, to verify complete filling of the canals, the teeth
were radiographed. If the canal was judged to be incompletely filled, the tooth was
Figure 1. Sample 9 (left) pre-preparation and sample 16 (right) after
Calasept® placement.

24
reinjected with Calasept® and radiographed again. Calasept® was wiped off the external
apical surface and fingernail varnish was applied in duplicate to the external surface of
the entire root to prevent extrusion of glycerin in a later step.
Temporization of the teeth: Pilot studies were used to determine the best way
to seal the coronal orifice. A very small sterile cotton pellet covered the canal orifice.
Then Fuji IV resin modified glass ionomer (GC Corporation, Tokyo, Japan) was expressed
over the pellet and cured with a Coltolux LED curing light (Coltene/Whaledent,
Cuyahoga Falls, OH). Samples were placed into an incubator (Precision Scientific,
Chennai, India) at 37° C for one week in a humid environment to simulate the clinical
time period between appointments. After incubation, removal techniques were
performed.
Calasept® removal groups: Four groups of removal techniques were used. For
each group, a #30 K file and a #50 K file were used to remove dry Calasept®. Then, each
of the following methods was performed:

25
1)
NaOCl 5.2% 3mL
EDTA 17% 3mL
NaOCl 5.2% 5mL
2)
NaOCl 5.2% 3mL
K3 #50-0.06 taper to WL
EDTA 17% 3mL
NaOCl 5.2% 5mL
3)
NaOCl 5.2% 3mL
Passive Ultrasonic Irrigation 30 seconds
EDTA 17% 3mL
NaOCl 5.2% 5mL
4)
NaOCl 5.2% 1.5mL
K3 #50-0.06 taper to WL
NaOCl 5.2% 1.5mL
Passive Ultrasonic Irrigation 30 seconds
EDTA 17% 3mL
NaOCl 5.2% 5mL
Negative control: No addition of Calasept® after initial instrumentation.
Positive Controls: Pilot studies were used to determine the optimal
concentration and volume of glycerin. However, these parameters were not chosen to
specifically dissolve the full canal-volume of Ca(OH)2. A very Ca(OH)2 saturated 100
microliter 60% glycerin solution—as determined through pilot studies—was chosen to
serve as a positive control.
26
Glyerin Transfer: Removal of Remaining Calasept® from the Tooth
Teeth were removed from the incubator. Temporary restorations were gently
removed with an excavator and the four experimental removal techniques applied.
After the clinical removal techniques were completed (see pg 25), the remaining
Ca(OH)2 left in the canal was evaluated. A preparation of 60% glycerin : 40% distilled
water at 40° Celsius was placed into the canal with a Ultradent® capillary tip (Ultradent®
Products, Inc., South Jordon, Utah). The glycerin was removed using a narrow
Ultradent® tip and a 10 ml syringe and the aliquot placed into a 1.5 ml microcentrifuge
tube. Passive ultrasonic instrumentation for 10 s was performed with a #15 Zipperer
(Roydent, Rochester Hills, MN) file at 2 mm from WL to help the remaining Calasept®
dissolve between each aliquot. Aliquots were repeated until the level on the
microcentrifuge tube reaches 1.1 mm—corresponding to 100 microliters. An
endodontic ruler was used to measure and mark the 1.1 mm level on each 1.5 µl
microcentrifuge tube (Fisher Scientific, Pittsburgh, PA). If the level did not quite reach
1.1 mm, glycerin was added to this point. Pilot studies were used to determine the least
viscous glycerin percentage but best dissolving ability and temperature for optimal
working characteristics. Pilot studies were also used to confirm that this percentage of
glycerin could fully dissolve the available Calasept®.
Calibration of micropipettes: A single 20 microliter pipetman® micropipette
(Gilson Inc., Middleton, WI) was used for all titrations. The tips were replaced when

27
aliquots concentrations were changed. Extensive care was taken to ensure the tip never
contacted the sides of either the storage beaker or the microcentrifuge tip. Delivery of
each 10 microliter volume was performed swiftly with depression using the thumb. This
ensured consistent technique.
Blinding of the operator: Using a random number table generated from
Microsoft Excel (Microsoft Corporation, Redmond, Washington), each sample or control
was given a random number. A second operator kept the "code," which matched the
original sample number to the random number. Using Excel, the random numbers were
arranged chronologically. The first twelve numbers were group 1, the next twelve were
group 2, and so on. The teeth were placed into groups after filling with Calasept® and
temporization, and before placement into the incubator for 1 week. Negative controls
were given random numbers that were the same number of digits as the other samples;
however, the negative controls were not placed into one of the four groups.
Before titration, the second operator covered up the random number with
opaque tape and wrote the original sample number on the tape so that the random
number could not be seen. Therefore, operator 1 did not know which group he was
measuring (titrating). Operator 1 only saw the original sample number, which provided
no information regarding the group. Immediately after each titration, the second
operator took the data to "break the code." Thus, each sample had an equal method of

28
being assigned to each group, and the operator was blinded in measurements both to
samples and negative controls.
Figure 2: Preparation and blinding scheme.
Titration of the Mixture
A mixture composed of 40% sterile water and 60% glycerin (Humco Corporation,
Texarkana, TX) was then titrated using 0.025, 0.05, 0.1, 0.5, 1, or 3 M HCL with 10
microliter aliquots using a micropipette. Each microcentrifuge tube was vortexed for 30
s and heated to 40 °C +/- 1° in a Hanau® low temperature water bath (Teledyne Water
Pick, Fort Collins, CO). Before each titration began, the microcentrifuge tube was
inspected visually to ensure there was no undissolved Ca(OH)2. The optical density of
the vial was inspected. Through pilot studies, it was discovered that the density as

29
judged by the naked eye provided a good indicator of the pH start point and the change
in pH in response to various molarities of HCL. A dense solution started 11.2 pH and
over and would respond to higher concentrations such as 0.5 M. A clear solution often
would measure in the pH of 10 range and the pH of the solution was reactive to smaller
concentrations of HCL such as 0.1 and 0.2. Good laboratory hygiene practices were
followed at each step of titration to ensure no contamination of samples occurred. The
decision of which molarity HCL and which aliquot volume was judged by the operator
according to experience during pilot studies. Also, pilot studies were used to develop an
algorithm to determine which molarities were appropriate for titration. Usually
titrations began with 10 microliters of 0.1 M. If the initial pH was higher, the operator
may have used a higher molarity such as 0.2 M. If the initial pH of the mixture was
lower (i.e. 11.0-11.4), the operator may have begun with a weaker concentration (i.e.
0.05 M HCL). Every attempt was made to equalize between samples the total volume of
the final solution. pH measurements were recorded after each addition of HCL using a
model HO4N-0001 semi-micro pH electrode (Lazar Research Laboratories, Los Angeles,
CA) and a Model 60 pH meter (Lazar Research Laboratories, Los Angeles, CA). After
each aliquot addition of acid to the microcentrifuge tube, the tube was vortexed for 10
s. Adequate time was given for each pH measurement—this was approximately 10-60 s
for the meter to equalize.

30
Rigid laboratory practices were employed to make each measurement identical.
The tip of the probe was inserted approximately 4 mm into the solution, and the holding
tray was adjusted until the probe did not contact the walls of the microcentrifuge tube.
The micro pH electrode and meter were calibrated with standard pH solutions (Omega
Scientific, Tarzana, CA). While the mixture was in the basic range, calibration was
performed with pH buffers 7 and 10. When the titration reached the acidic range, the
pH meter was recalibrated with buffers 4 and 7. After each pH measurement, the tip of
the electrode probe was thoroughly rinsed with distilled water and wiped with a Kim
Wipe® (Kimberley-Clark Professional, Mississauga, Ontario) to ensure the probe did not
contaminate the sample. Importantly, the microcentrifuge tube was vortexed for 10 s
with a Vortex Genie Mixer (Scientific Products, Evanston, Ill.) after each addition of HCL.
A single twenty microliter micropipette set at 10 microliters was used to deliver all
aliquots. The micropipette was calibrated by delivering a specific amount of water to a
microcentrifuge tube and weighing the tube. Then the weight was compared to the
expected weight i.e. 10 microliters equaled 0.01g. Approximately every 20 pH readings,
the pH meter and electrode was recalibrated.

31
Chemical reaction: Addition of HCL to Ca(OH)2 is described by the following
equation: 2 HCl + Ca(OH)2 ---> CaCl2 + 2H2O (Cohen & Lasfargues, 1988).
Standards
A standard curve is necessary to determine the weight of remaining Ca(OH)2 in
the instrumented canals. In order to develop a standard curve, thirty teeth were
selected. Due to limitations in available canines, some single canal premolar teeth were
also selected. The identical radiographic and preparation protocol was utilized for the
standard teeth and for the samples. Premolar teeth used for the standard curve were
randomly selected for Ca(OH)2 levels by drawing standards out of a hat (i.e. standard A1
had an equal chance of being a canine or a premolar). The standard teeth were allowed
to dry out for one day. Ten different standard weights were measured out from 0.0003
pH of sample Molarity Added
(10 microliters)
>11.9 0.5
11.2 to 11.9 0.2
10.3 to 11.2 0.1
7 to 10.3 0.05
Table 1: An approximate
algorithm for HCL addition.

32
to 0.003 mg. Each weight was done in triplicate (Table 2). In the same manner as the
samples, the glycerin/Calasept® mixtures were transferred to 1.5 ml microcentrifuge
tubes. If the volume of solution transferred was below 100 µl, the solution was added
to the 100 µl mark. Titration of each standard was performed in the exact manner as
the samples. While preparing standards, it was found that the Calasept® mix within the
manufacturer's tube was not always uniform. Some expressions of Ca(OH)2 seemed to
have more water content than others, but the operator attempted to ensure additions
of Calasept® to the tubes were uniform in appearance.
Determination of N: Using pilot study data, preliminary calculations were
performed. When the sample size in each of the four groups was 12, a one-way analysis
of variance was determined to have 80% power to detect at the 0.05 level a difference
in means characterized by an effect size (variance between means divided by a common
group variance) of 0.2483, assuming that the common standard deviation is 0.0004.
Titration curves: Each sample, standard, and positive and negative control was
titrated in the same fashion. The same solutions of differing molarities were used as
previously described. A total of 58 samples, 30 standards, 3 negative controls, and 3
positive controls were titrated. All laboratory conditions were held constant (See Table
2).

33
Sample 3, group 2
Sample 44, group 1
0
2
4
6
8
10
12
0 5 10 15 20 25
pH
µmoles of HCL (cumulative)
#3 Titration of Ca(OH)2with HCL
0
2
4
6
8
10
12
0 5 10 15 20 25
Titl
e
µmoles of HCL (cumulative)
#44 Titration of Ca(OH)2with HCL
Figure 3: Representative titrations from groups 1 & 2.

34
Sample 13, group 3
Sample 19, group 4
0
2
4
6
8
10
12
0 5 10 15 20 25
pH
µmoles of HCL (cumulative)
#13 Titration of Ca(OH)2with HCL
0
2
4
6
8
10
12
0 1 2 3 4 5 6 7
pH
µmoles of HCL (cumulative)
#19 Titration of Ca(OH)2with HCL
Figure 4: Representative titrations from groups 3 & 4.

35
Each standard was titrated to generate a curve. In order to take an accurate
reading at pH=7 for each standard, linear regression was applied to each curve. This
was accomplished by creating a new curve using data points around pH=7. The amount
of data points used differed from 2 to 5, depending on the how many points were near
pH=7. Most of the data points were between pH= 6 and 8, but in some cases points
outside this range were used. Figure 5 is an example of standard F3 and its
corresponding linear regression curve made using the original data but only three data
points. Excel was used to apply a regression line to the data and a corresponding
regression equation. To determine the cumulative µmoles at pH=7, the equation was
first solved for x (y = -1.55x + 15.265 => x = (y-15.265)/(-1.55)). In the example of
standard F3, "7" was substituted for y (pH=7). Therefore, x=(7-15.265)/(-1.55). In this
example x=cumulative µmoles of HCL=5.332258.
From each standard titration curve, two data points were used: the original
weight of Ca(OH)2 and the value of x. Appendix 1 demonstrates the weight and value of
x (cumulative µmoles at pH=7) for each standard. From the last two columns a scatter
plot was created. A trendline was fitted with an associated equation. This important
equation, y=6.1098x, was used to determine the original weight of Ca(OH)2 in each
experimental sample. From this point on, this equation will be referred to as the
standard equation.

36
An important point when making the standard line was that the y and x intercept
were set to equal zero. This makes the assumption at zero grams of Ca(OH)2 added to
100 µl of glycerin, the pH would not be above 7; therefore, no HCL would need to be
added. This assumption is justified because in two of three negative controls, the pH
was below 7 initially. In the third negative control, the pH was only slightly above 7.

37
y = -1.55x + 15.265
5.3
5.8
6.3
6.8
7.3
7.8
5 5.2 5.4 5.6 5.8 6 6.2 6.4
pH
Cumulative µmoles of HCL
Standard F3
3.4
4.4
5.4
6.4
7.4
8.4
9.4
10.4
11.4
0 2 4 6 8 10
pH
Cumulative µmoles of HCL
Standard F3
Figure 5. Above: An example of a standard curve titration. Below:
Three data points taken from the above graph. Linear regression was
applied and the resultant equation used to find cumulative
micromoles at pH=7. In Standard F3, x=(7-15.265)/(-1.55)=5.332258.

38
y = 6.1098x
0
5
10
15
20
25
0 0.5 1 1.5 2 2.5 3 3.5
Cu
mu
lati
ve m
icro
mo
les
HC
L at
p
H=7
Ca(OH)2 in mg
Standard Curve: Titration of Ca(OH)2
0
2
4
6
8
10
12
0 0.5 1 1.5 2 2.5 3
pH
#56 Titration of Ca(OH)2with HCL
y = -1.404x + 8.266
6
6.5
7
7.5
8
0.4 0.6 0.8 1 1.2 1.4
pH
Sample 56 --linear regression
Figure 6: Graphical representation of the standard curve. The equation
derived from the trendline is termed the "Standard Equation."
Figure 7. Sample of a
titration curve and
corresponding linear
regression line.

39
Translation of Sample Data using the Standard Equation
After generating a standard scatter plot, standard line, and standard equation, it
was then possible to determine the weights of Calasept® in the original samples. For
each sample titration curve, a linear regression plot was made and associated equation
was determined. This was done in identical fashion as the standard curves; every effort
was made to use data points just above and below pH=7 to capture the steep area of
the titration curve. From 2 to 5 data points were used, depending on how linear the
points were aligned around pH=7. The cumulative µmoles at pH=7 was determined in
the same fashion as the standards. The equation for each sample was solved for x when
y=7 (pH=7). Then each sample had a single known datum point, x. Using the standard
equation, y=6.1098x, the original weight of each sample of Calasept® was determined
(see Table 2). With the random number table that blinded the operator, the code was
broken and samples sorted into their respective groups.

40
Group Sample Cum µmo x Group Sample Cum µmo x
1 35 10.77691 1.763872 3 34 0.516991 0.084617
1 42 2.632353 0.430841 3 41 164.1563 26.8677
1 16 4.631825 0.758098 3 18 2.478346 0.405635
1 44 15.03125 2.460187 3 49 0.400735 0.065589
1 32 2.102211 0.344072 3 13 15.93245 2.607687
1 25 16.14286 2.642125 3 47 0.319444 0.052284
1 54 27.56607 4.511779 3 55 0.290094 0.04748
1 6 25.94505 4.246466 3 22 0.642176 0.105106
1 37 2.629361 0.430351 3 58 2.65871 0.435155
1 1 1.812727 0.296692 3 43 0.27146 0.04443
1 33 0.313333 0.051284 3 48 1.185096 0.193966
1 5 2.4829 0.40638 3 20 0.388873 0.063647
2 9 7.533607 1.233037 4 23 0.399194 0.065337
2 52 4.333254 0.70923 4 50 0.284574 0.046577
2 51 1.449545 0.237249 4 21 0.377119 0.061724
2 3 12.71081 2.080396 4 26 0.229565 0.037573
2 29 0.956731 0.15659 4 39 1.012426 0.165705
2 53 1.530423 0.250487 4 24 0.456585 0.07473
2 36 1.02141 0.167176 4 17 0.276227 0.04521
2 45 1.368285 0.223949 4 12 4.258772 0.697039
2 46 1.727117 0.28268 4 56 0.901709 0.147584
2 8 1.5667 0.256424 4 19 3.078431 0.503851
2 4 1638.49 268.1741 4 7 0.705446 0.115461
2 40 1.005682 0.164601 4 30 5.947236 0.973393
Control Grams mg X value Control Grams mg X value
N Con 57 0.010316 0.001688 P Con A 0.02955 29.55 233.8524
N Con 31 -0.00188 -0.00031 P Con B 0.03028 30.28 244.6577
N Con 28 -0.18757 -0.0307 P Con C 0.02992 29.92 233.7948
Table 2. Listed are the group by sample number, cumulative µmoles at pH=7, and calculated weight of Calasept® in mg using the standard equation (x=y/6.1098). The bottom columns represent the positive controls and negative controls with the same information.

41
Positive Controls
The positive controls consisted of three 1.5 ml microcentrifuge tubes. Calcium
hydroxide was added to a certain weight. The tube was filled to the 1.1 mm mark
(100µl) and titrated with HCL. The weight of Ca(OH)2 placed in the tubes was
determined by pilot studies that determined when 100 µl of glycerin was nearly fully
saturated. The positive control maximizes the impact of the dependent variable on the
independent variable. In this case, the dependent variable is the cumulative µmoles of
HCL and the independent variable is the weight of Ca(OH)2. A very large amount of
Calasept® paste causes the use of a large amount of cumulative µmoles of HCL.
Negative Controls
A negative control is used to eliminate the impact of the dependent variable on
the independent variable. In this study, teeth that were never filled with Ca(OH)2 were
used. The same amount of glycerin was added to these teeth and transferred to the
microcentrifuge tubes. In fact, the negative controls were titrated during the blinding
procedure so the operator did not know he was titrating a negative control. The results
of the titrations indicated that the initial pH readings were 5.96, 6.97, and 7.17 for
negative controls with sample numbers 28, 31, and 57 respectively. Applying the
standard equation, the negative controls had original amounts of Ca(OH)2 of 0.001688, -
0.00031, and -0.0307 mg. These figures are very close to zero. Of course, the negative

42
controls had zero Calasept® added, which confirmed that the titration method
measured Ca(OH)2 correctly. When no Calasept® was present in negative controls, the
titration indicated that no Calasept® was present. Therefore, no background
interference occurred in the measurements; the higher pH measurements of the
samples were due to Calasept® remaining in the tooth after the removal techniques
were applied.
A "Second" Standard Curve
Second Standard Curve: A second standard curve was calculated using only
Ca(OH)2 in microcentrifuge tubes and not placed in teeth. This was done to evaluate the
effect of dentin on Ca(OH)2 removal.
Second Standard Curve Procedure: In the second standard curve, Calasept® was
added to empty microcentrifuge tubes. The microcentrifuge tube was placed on the
measuring table with cover closed and upside down to ensure each measurement was
performed the same. The tubes were wiped with a Kim wipe before being placed on an
analytical scale (Ohaus Corporation, Pine Brook, NJ). After adding the Calasept®, the
tube was reweighed to determine to amount. Eleven weight designations were made in
triplicate (Appendix 1). Each triplicate sample was within 0.00003 g of the target
weight. The standard weight range was determined through pilot studies. Next, 100
microliters of 60% glycerin at 40° C was added to each microcentrifuge tube and
vortexed for 30 s to ensure full dissolution. A P200 pipetman® micropipette (Gilson Inc.,

43
Middleton, WI) was used to add 100 microliters of 60% glycerin. Note that the same
original mix of glycerin and sterile water was used for the entire study to minimize error.
A line was previously drawn at 1.1 mm from the bottom of the microcentrifuge tube to
cross check that the volume was equal in all standards. Titrations were performed as
noted previously. Since glycerin was added directly to microcentrifuge tubes rather
than to teeth, there was no "glycerin transfer" step. The second standard curve
demonstrates clearly that placement of Ca(OH)2 within a tooth versus microcentrifuge
tube greatly affects the results and thus only the first standard curve was used to
evaluate results that can be extrapolated to clinical use.
y = 13.582x
0
5
10
15
20
25
30
35
0 0.5 1 1.5 2 2.5
Cu
mu
lati
ve m
icro
mo
les
at p
H=7
Ca(OH)2 mg by weight
Second Standard Curve: Titration of Ca(OH)2
Figure 8. Second standard
curve.

44
Outlier Samples: Two samples were not included in the data, samples #4 and
#41. Both of these teeth were anatomical outliers. Examination of the radiographs of
these teeth revealed that the pulp chambers were unusually large and significantly
larger than other samples. Analysis of the data reflected that the corresponding mg of
Ca(OH)2 was quite large. These samples were not included in the data analysis.
Data Analysis
Sample Size Statement: When the sample size in each of the four groups was 12,
a one-way analysis of variance had 80% power to detect at the 0.05 level a difference in
means characterized by an effect size (variance between means divided by a common
group variance) of 0.2483, assuming that the common standard deviation is 0.0004.
Statistical Analysis: Means and standard deviations of Ca(OH)2 were calculated
for each group. A one-way analysis of variance (ANOVA) was used to test for differences
among the means of the four groups. If the ANOVA test was statistically significant,
pairwise comparisons were made using a Tukey-Kramer multiple comparisons
adjustment. P-values less than 0.05 were deemed statistically significant. SAS V9.1.3
(SAS Institute, Cary, NC) was used for the analysis.
45
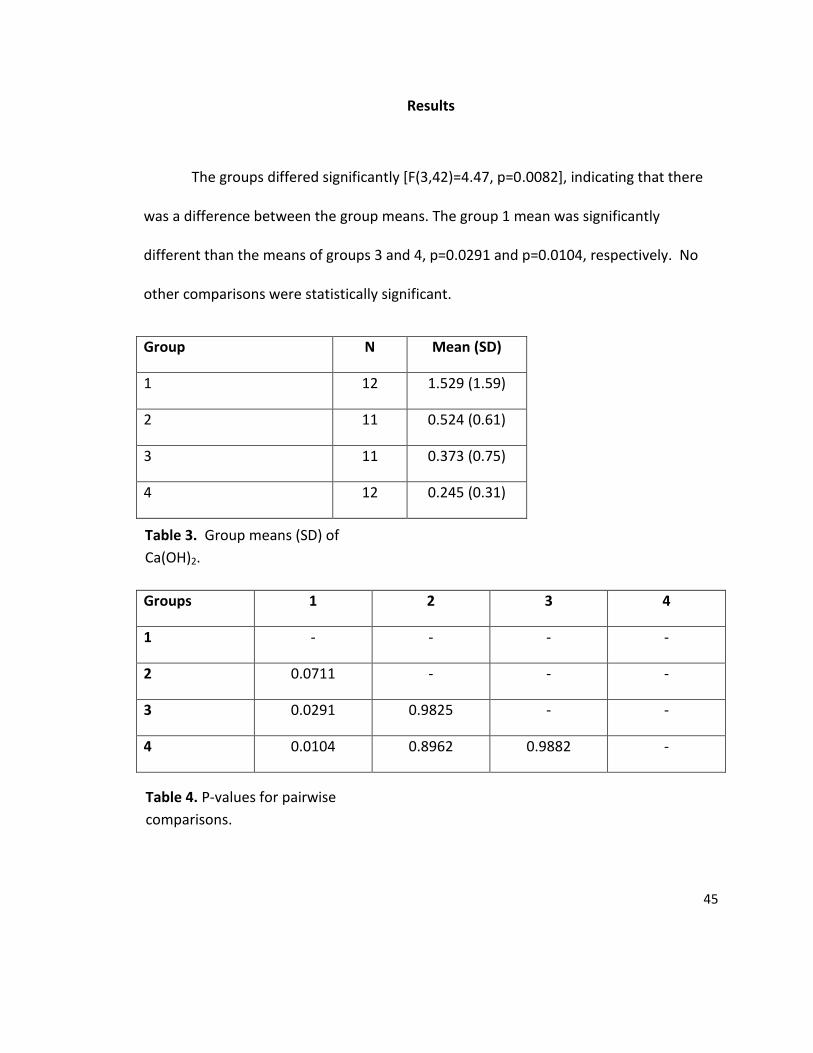
Results
The groups differed significantly [F(3,42)=4.47, p=0.0082], indicating that there
was a difference between the group means. The group 1 mean was significantly
different than the means of groups 3 and 4, p=0.0291 and p=0.0104, respectively. No
other comparisons were statistically significant.
Group N Mean (SD)
1 12 1.529 (1.59)
2 11 0.524 (0.61)
3 11 0.373 (0.75)
4 12 0.245 (0.31)
Groups 1 2 3 4
1 - - - -
2 0.0711 - - -
3 0.0291 0.9825 - -
4 0.0104 0.8962 0.9882 -
Table 3. Group means (SD) of
Ca(OH)2.
Table 4. P-values for pairwise
comparisons.

46
0
0.2
0.4
0.6
0.8
1
1.2
1.4
1.6
1.8
2
Group 1 Group 2 Group 3 Group 4
Mill
igra
ms
Group Means of Residual Calasept®*
* P=0.05
Figure 9. Bar graph of group means of residual Calasept® with
standard error of the mean.

47
Verification that all Calasept® was removed from tooth: After the experiment,
several representative teeth were split and SEM (Model TM3000 Table Top Microscope,
Hitachi High-Technologies Corporation, Tokyo, Japan) was performed to visually access
the tooth surface (Figure 10).
Figure 10. Scanning electron micrographs of standards A3 and J3 at various magnifications taken from the apical 1/3 after splitting teeth. Top left: J3 at 1500x, right: J3 at 1500x (different location), Bottom left: A3 at 800x, right: A3 at 800x (different location).

48
Discussion
The intracanal medicament calcium hydroxide has many indications in clinical
endodontics. Ultimately, most usages of the drug require removal for predictable
obturation. This study showed that no Ca(OH)2 removal technique successfully removed
all the Ca(OH)2 from the canal system. This is in agreement with Lambrianidis et al.
(1999) who found that with a hand file and various types of irrigant 25-40% of the walls
remained covered with Ca(OH)2.
One primary result of our study was that a combination of rotation of the final
apical greater taper file (K3 0.04 #50) with ultrasonic activation for 30 s produced
significantly better Ca(OH)2 removal than a hand file with irrigation. Also, statistically
significant was the 30 s use of an ultrasonically activated file which produced better
Ca(OH)2 removal than irrigation only groups. A trend existed that greater taper (group
II) produced better removal than a #50 hand file plus irrigation (group I), and statistical
significance was nearly achieved (p-value = 0.0711). These results are in disagreement
with one study that found sonic activation of hand files produced canals of similar
cleanliness as that of hand filing with irrigation (Tronstad et al., 1985).
Overall, the results of our study confirm a wealth of endodontic literature that
finds passive ultrasonic instrumentation more effective than irrigation only techniques
(Lev et al., 1987; Stamos et al., 1987; Jensen et al., 1999; Haidet & Reader, 1989; Archer

49
& Reader, 1992; Cunningham & Martin, 1982; Wiseman et al., 2011; and van der Sluis et
al., 2007). Our study supported 30 s of PUI over hand filing and irrigation which is in
agreement with other studies that found 30 s of PUI effective over other groups (Sabins
et al., 2003). This is in contrast to other studies that used longer time periods for PUI,
such as 3 minutes (Archer et al., 1992). The approach used in this study measures all
the Calasept® remaining in the canal by giving a single number—milligrams of Calasept®.
Whereas other studies used pixels counting, histologic cross sections, micro-CT, or other
approaches, our method dissolved remaining Ca(OH)2 and chemically quantified it. No
other Ca(OH)2 removal study has been able to express results in actual weight. Many
randomly measured small areas of the canal and projected that information to an
overall system. Close similarities in findings between a titration method and pixel-
counting methods reciprocally confirmed both methods. Our method confirmed others
regarding the effectiveness of ultrasonics.
Our study was similar in experimental group assignments to a recent
investigation by Kenee et al. (2006), with one major difference; they did not have a
greater taper rotary plus ultrasound group. Their study found both PUI and greater
taper final apical file groups were more effective than a hand file plus irrigation
technique alone. Our study agreed, as our ultrasonic (group III) was more effective than
irrigation (group I) (p=0.0291).

50
One contrast with Kenee et al. (2006) is that our data showed a trend towards
differences (p=0.0711) between the greater taper file (group II) and irrigation and hand
filing (group I). It may be that both results are correct, since Kenee et al. (2006)
expressed results in terms of percentage residual debris/Calasept® of the canal wall
area, and our results were expressed in mg of Calasept®. They found debris/Calasept®
levels were significantly lower in the Greater Taper group, but if a method that
specifically measured Calasept® was applied, this threshold may no longer be
statistically significant. A repeated measures ANOVA was not applied in their study,
despite the fact that samples were reused multiple times. Another explanation might
be that the glycerin transfer step in our study removed some Calasept® from dentinal
tubules. If this is true, the "surface area" measurement is only part of the Calasept®
measurement. If the glycerin/titration method is removing and measuring surface and
deeper dentinal tubule Calasept®, any differences in remaining Calasept® on the
dentinal surface becomes only a part of the overall measurement.
Examination of SEMs taken after our study revealed some debris mixed in with
the glycerin (Figure 10). Perhaps the glycerin transfer failed to remove all the Calasept®.
Or the glycerin transfer did remove all the Calasept®, and what was seen mixed in with
the remaining glycerin was actually dentinal debris. As part of the transfer of Ca(OH)2
into the microcentrifuge tubes, passive ultrasonic instrumentation was performed
between each transfer. This was done to ensure the Ca(OH)2 on the walls was

51
incorporated into solution, and likely would have also incorporated more debris into the
glycerin. One method to differentiate residual debris from Calasept® would be to
radiolabel Calasept® and apply removal studies. Then, an autoradiographic analysis
could be performed to determine "what we are actually looking at" after Ca(OH)2 is
removed. Allison, Weber, and Walton (1979) used such a technique with 45Ca to prove
that step back preparations had less leakage than serial preparation.
Recently, Wiseman et al. (2011) took serial micro-CT scans in order to determine
if ultrasonic instrumentation was better than sonic instrumentation when both types
were added to use of a greater taper type rotary file. Ultrasonic usage for three sets of
20 s was significantly better than sonic instrumentation. Results agree with the findings
that ultrasonic is better than hand and irrigation alone. Our study found statistical
difference and used 30 s of ultrasonic activation based on Sabins et al. (2003) while
Wiseman et al. (2011) used 60 s of ultrasound (both at 2 mm from WL in decoronated
teeth). Also, Ultracal® rather than Calasept® was the Ca(OH)2 paste used. One
potential limitation of their study is that micro-CT, while an incredible tool for studies in
endodontics, may not be able to differentiate between debris and Ca(OH)2. Results of
their study may inadvertently incorporate debris into the data set. Another interesting
point is that Wiseman et al. (2011) found no Ca(OH)2 in their negative controls, while
Kenee et al. (2006) found 0.615% debris. There may be a difference in sensitivity and
ability to detect Ca(OH)2 versus debris in a micro-CT and pixel-counting study. Our

52
negative controls indicate that the pH change is due to the Ca(OH)2; therefore we can
confidently conclude differences between groups are also due to Ca(OH)2 differences
rather than dentin debris.
In an in vitro study, van der Sluis et al. (2007) found that irrigation with 50 ml of
NaOCl and ultrasonic use was significantly better than irrigation alone when removing
Ultracal® from premade grooves. Our data confirmed their findings. One difference
between our study design and theirs was that we used a #50 hand file at WL before
irrigation. Our study found that ultrasonics improved removal over hand filing +
irrigation, not only over irrigation only as a group. Van der Sluis et al. (2007) also used
single rooted mandibular premolars, while others used molars (Wiseman et al., 2011;
Sabins et al., 2003). In our study, the majority of samples were canines with some
intermixed single canal premolars. The canine tooth is wide buccal-lingually (Figure 1),
while premolars and canines usually have smaller, more circular canals. Use of a greater
taper file did not achieve statistical significance in removal over hand filing and irrigation
(group I). One explanation for the finding is the wide buccal-lingual nature of the root
canals. A K3 FAF alone may not have been enough to remove Calasept® from buccal
and lingual irregularities, while the use of acoustic streaming was needed in these broad
canals.
While no difference was found between our groups III and IV, the latter group
with both ultrasound and a K3 0.06 file had the best removal. Our results using canine

53
teeth may be more applicable to other teeth with irregular canals such as the distal
canals of mandibular molars or the palatal canals of maxillary molars. Despite the fact
that more clinical time is needed, optimal removal of Ca(OH)2 in these situations may
warrant use of both a greater taper rotary and PUI.
Since this technique can measure removal of Ca(OH)2 from irregularities, future
studies should use the titration methodologies in various canals types. An exciting new
technology is the self adjusting file, which adapts to various canal shapes and is specially
designed for use in irregular canals (Metzger et al., 2010). To circumvent the challenge
of standardizing preparations, a device that accurately measures the amount of Ca(OH)2
dispensed could be used when filling the canal, and our titration model to measure
Ca(OH)2 removal could be applied. The amount of Ca(OH)2 retrieved versus amount
placed could be calculated; this method could even be performed in vivo. Another
future study would be to apply our titration technique to curved roots. Some Ca(OH)2
removal studies have utilized root curvature, and it would be interesting to directly
compare a pixel-counting method with the titration model.
A thought-provoking finding in this investigation occurred due to an error in
study design. The author first created a standard curve using known Calasept® amounts
in microcentrifuge tubes (termed the "second standard curve"). This was incorrect
because standards, like the experimental samples, needed to be performed in extracted
teeth; this was then performed. A comparison could be achieved between a standard

54
curve generated in teeth versus tubes (Figure 6 versus Figure 7). More Calasept® was
recovered from the tubes, but some factor was preventing full recovery of material from
teeth. Perhaps the microirregularites in the dentin wall made recovery worse.
Alternatively, diffusion of the Ca+ and OH- ions into dentinal tubules could have been
responsible for our inability to fully remove the Calasept. This provides support that we
are only removing a percentage of ICM we place, because the remainder diffuses
throughout the tooth as designed.
A limitation of the study is one inherent to the use of very small amounts of
liquid. While the largest available canals were used, each aliquot of glycerin transfer
was perhaps only 10-20 microliters. Despite diligence in transferring the glycerin
solution, some glycerin could have been imperfectly transferred, resulting in lost
solution containing Ca(OH)2. Also, during the passive ultrasonic instrumentation step
(as part of the glycerin transfer, not Ca(OH)2 removal), some vapor from the PUI may
have been lost due to decoronation. This might have resulted in some lost glycerin fluid
containing Ca(OH)2. One might also say that in the glycerin transfer not all the Ca(OH)2
dissolved. Efforts made to eliminate error included use of 10 aliquots in the transfer,
PUI between aliquots, pilot studies that were aimed at determining correct glycerin
percentages, and observation of the clarity of the solution. Often, later aliquots in the
glycerin transfer were completely clear while earlier aliquots were white in color.
Another difference between this and previous studies is in how the data are expressed.

55
This investigation found a raw number that represented remaining Calasept®, but no
location of that material. An advantage of pixel-counting type studies is that they can
quantify debris in certain regions of the root.
Another critique of this investigation is within the titrations. Because of the
small amount of glycerin being titrated, the volume of mixture after the addition of HCL
varied from 130 to 240 microliters. This variation in volume was due to challenges in
titrating a broad range of Ca(OH)2 that was represented in the samples. As a
counterpoint to this critique, it can be said that at pH=7, there was less variation in
cumulative volume of HCL added (usually 20-60 microliters). Any HCL added after pH=7
did not add meaningful data, but did allow for a complete titration curve. The number
of data points available to make a titration curve varied—subsequently, the number of
data points to make a linear regression line varied as well. Despite best efforts to gauge
which concentration of HCL to add in each aliquot (and therefore keep end volumes
approximately equal), these issues may have caused some curves to be more accurate
than others.
A substantial body of literature justifies the use of Ca(OH)2, but predictable
obturation requires removal. Various techniques have studied removal, nearly all of
which are a variation of counting areas and expressing the result as a percentage of the
canal wall (or histologic section) remaining covered with Ca(OH)2. The percentage is
then used in statistical comparison, and recommendations for certain techniques are

56
justified. Given how Ca(OH)2 removal studies are saturated with this technique,
drawbacks of the general model are rarely discussed. Overall, when a quantification
pixel-counting method has been used, the canals have often been circular. When
premade grooves were created in dentin walls to simulate irregularities, these studies
had other drawbacks such as reuse of specimens, multiple reapproximations of
specimens, and lack of parametric data. Regardless of the technique, splitting of the
teeth before quantification was mandatory. Another challenge in interpretation of
these studies is in the difficulty in translating "percent remaining debris of calcium
hydroxide" to clinical practice.
We desired to improve upon limitations of previous models by introduction of a
novel method that allowed for quantitative chemical measurement in large, somewhat
irregular canals. Agreement in results of other studies has verified this technique. In
modern endodontics, great emphasis is being placed on a higher level of evidence. By
applying this novel titration in vivo, endodontics may be able to better understand
exactly how well Ca(OH)2 removal is being performed in the mouth.

57
Conclusions
1. The novel glycerin transfer and micro titration technique described in this study is a
sensitive and accurate model that can be employed in future Ca(OH)2 removal studies.
The model circumvents drawbacks of previous studies including area measurements on
three dimensional surfaces, effects of reuse of samples, effects of splitting teeth, and
inability to directly measure amount of calcium hydroxide.
2. No removal method fully removed Calasept® from the root canal system.
3. The addition of passive ultrasonic instrumentation to a hand file and irrigation
resulted in significantly better Ca(OH)2 removal over hand filing and irrigation alone.
4. The 30 s time frame, rather than longer PUI times, was adequate to achieve
statistically better Ca(OH)2 removal.
5. Use of 30 s of passive ultrasonic instrumentation in combination with a K3 0.06 taper
rotary file after hand filing and irrigation provided the lowest group mean of Calasept®,
and may be most effective in very irregularly shaped canals.

58
Bibliography
Abou-Rass, M., & Piccinino, M.V. (1982). The effectiveness of four clinical irrigation
methods on the removal of root canal debris. Oral Surg, Oral Med, and Oral Pathol, 54
(3), 323-328.
Ahmad, M., Pitt Ford, T.J., & Crum, L.A. (1987). Ultrasonic debridement of root canals:
Acoustic streaming and its possible role. Journal of Endodontics, 13 (10), 490-499.
Ahmad, M., Roy, R.A., & Kamarudin, A.G. (1992). Observations of acoustic streaming
fields around an oscillating ultrasonic file. Endod Dent Traumatol, 8, 189-194.
Allison, D.A., Weber, C.R., & Walton, R.E. (1979). The influence of the method of canal
preparation on the quality of apical and coronal obturation. Journal of Endodontics, 5
(10), 298-304.
Amato, M., Vanoni-Heineken, I., Hecker, H., & Weiger, R. (2011). Curved versus straight
root canals: The benefit of activated irrigation techniques on dentin debris removal. Oral
Surg, Oral Med, Oral Pathol, Oral Radiol, Endod, 111 (4), 529-534.
Archer, R., Reader, A., Nist, R., Beck, M., & Meyers, W. (1992). An in vivo evaluation of
the efficacy of ultrasound after step-back preparation in mandibular molars. Journal of
Endodontics, 18 (11), 549-552.
Baik, E.J., Kum, K.-Y., Yun, C.-H., Lee, J.-K., Lee, K., Kim, K.K., & Han, S.H. (2008). Calcium
hydroxide inactivates lipoteichoic acid from Enterococcus faecalis. Journal of
Endodontics, 34 (11), 1355-1359.
Baisden, M.K., Kulild, J.C., & Weller, R.N. (1992). Root canal configuration of the
mandibular first premolar. Journal of Endodontics, 18 (10), 505-508.
Balvedi, R.P.A., Versiani, M.A., Manna, F.F., & Biffi, J.C.G. (2010). A comparison of two
techniques for the removal of calcium hydroxide from root canals. International
Endodontic Journal, 43, 763-768.
Bidar, M., Disfani, R., Gharagozloo, S., Khoynezhad, S., & Rouhani, A. (2010). Medication
with calcium hydroxide improved marginal adaptation of mineral trioxide aggregate
apical barrier. Journal of Endodontics, 36 (10), 1679-1682.

59
Blanscet, M.L., Tordik, P.A., & Goodell, G.G. (2008). An agar diffusion comparison of the
antimicrobial effect of calcium hydroxide at five different concentrations with three
different vehicles. Journal of Endodontics, 34 (10), 1246-1248.
Bogen, G., & Kuttler, S. (2009). Mineral trioxide aggregate: A review and case series.
Journal of Endodontics, 35, 777-790.
Bramante, C. M., Berbert, A., & Borges, R. P. (1987). A methodology for evaluation of
root canal instrumentation. Journal of Endodontics, 13(5), 243-245.
Buck, R.A., Cai, J., Eleazer, P.D., Staat, R.H., & Hurst, H.E. (2001). Detoxification of
endotoxin by endodontic irrigants and calcium hydroxide. Journal of Endodontics, 27 (5),
325-327.
Byström, A., Claesson, R., & Sundqvist, G. (1985). The antibacterial effect of
camphorated paramonochlorophenol, camphorated phenol and calcium hydroxide in
the treatment of infected root canals. Endod Dent Traumatol, 1, 170-175.
Byström, A., Sundqvist, G. (1985). The antibacterial action of sodium hypochlorite and
EDTA in 60 cases of endodontic therapy. International Endodontic Journal, 18, 35-40.
Caliskan M., Sen B., Ozinel M. (1994). Treatment of extraoral sinus tracts from
traumatized teeth with apical periodontitis. Endodontics and Dental Traumatology 10,
115-120.
Calt, S., & Serper, A., (1999). Dentinal tubule penetration of root canal sealers after root
canal dressing with calcium hydroxide. Journal of Endodontics, 25 (6), 431-433.
Chong, B.S., & Pitt Ford, T.R. (1992). The role of intracanal medication in root canal
treatment. International Endodontic Journal, 25 (2), 97-106.
Cohen, F., & Lasfargues, J.-J. (1988). Quantitative chemical study of root canal
preparations with calcium hydroxide. Endod Dent Traumatol, 4, 108-113.
Crumpton, B.J., Goodell, G.G., & McClanahan, S.B. (2005). Effects on smear layer and
debris removal with varying volumes of 17% REDTA after rotary instrumentation.
Journal of Endodontics, 31 (7), 536-538.
60
Cunningham, W.T., & Martin, H. (1982). A scanning electron microscope evaluation of
root canal debridement with the endosonic ultrasonic synergistic system. Oral Surg, Oral
Med, Oral Pathol, 53 (5), 527-531.
Cvek, M. (1978). A clinical report on partial pulpotomy and capping with calcium
hydroxide in permanent incisors with complicated crown fracture. Journal of
Endodontics, 4 (8), 232-237.
Davis, R.D., Marshall, J.G., & Baumgartner, J.C. (2002). Effect of early coronal flaring on
working length change in curved canals using rotary nickel titanium versus stainless
steel instruments. Journal of Endodontics, 28, 438-442.
de Souza, C.A.S., Teles, R.P., Souto, R., Chaves, M.A.E., & Colombo, A.P.V. (2005).
Endodontic therapy associated with calcium hydroxide as an intracanal dressing:
Microbiologic evaluation by the checkerboard DNA-DNA hybridization technique.
Journal of Endodontics, 31 (2), 79-83.
Estrela, C., Sydney, G.B., Bammann, L.L., & Felippe, J.O. (1995). Mechanism of action of
calcium and hydroxyl ions of calcium hydroxide on tissue and bacteria. Braz Dent J, 6,
85-90.
Fava, L.R., & Saunders, W.P. (1999). Calcium hydroxide pastes: Classification and clinical
indications. International Endodontic Journal, 32 (4), 257-282.
Foster, K.H., Kulild, J.C., & Weller, R.N. (1993). Effect of smear layer removal on the
diffusion of calcium hydroxide through radicular dentin. Journal of Endodontics, 19 (3),
136-140.
Ghose, U., Baghdady, V.S., & Hykmat, B.Y.M. (1987). Apexification on immature apices
of pulpless permanent anterior teeth with calcium hydroxide. Journal of Endodontics,
13, 285-290.
Haidet J., Reader A., Beck M., Meyers W. (1989) An in vitro Comparison of the Step-back
technique Versus a Step-back/Ultrasonic Technique in Human Mandibular Molars.
Journal of Endodontics 15 (5), 195-199.
Hasselgren, G., Olsson, B., & Cvek, M. (1988). Effects of calcium hydroxide and sodium
hypochlorite on the dissolution of necrotic porcine muscle tissue. Journal of
Endodontics, 14 (3), 125-127.

61
Hecker, H., Bartha, T., Löst, C., & Weiger, R. (2010). Determining the apical preparation
size in premolars: Part III. Oral Surg, Oral Med, Oral Pathol, and Endod, 110 (1), 118-124.
Hermann, B.W. (1920). Calciumhydroxyd als mittel zum behandein und fuellen von
zahnwurzelkana elen (dissertation). Wuerzburg Med Diss, 29.
Heward S., Sedgley C., Effects of intracanal mineral trioxide aggregate and calcium
hydroxide during four weeks on pH changes in simulated root surface resorption
defects: an in vitro study using matched pairs of human teeth (2011). Journal of
Endodontics, 37, 40-44.
Holland, R., Alexandre, A.C., Murata, S.S., dos Santos, C.A., & Dezan, J.E. (1995). Apical
leakage following root canal dressing with calcium hydroxide. Endod Dent Traumatol, 11
(6), 261-263.
Jensen, S.A., Walker, T.L., Hutter, J.W., & Nicoll, B.K. (1999). Comparison of the cleaning
efficacy of passive sonic activation and passive ultrasonic activation after hand
instrumentation in molar root canals. Journal of Endodontics, 25 (11), 735-738.
Jiang, L.-M., Verhaagen, B., Versluis, M., Langedijk, J., Wesselink, P., & van der Sluis,
L.W.M. (2011). The influence of the ultrasonic intensity of the cleaning efficacy of
passive ultrasonic irrigation. Journal of Endodontics, 37 (5), 688-692.
J.S. Dental Manufacturing, Inc. (2011). Calasept. Retrieved from
http://www.jsdental.com/calasept.php
Kakehashi, S., Stanley, H.R., & Fitzgerald, R.J. (1965). The effects of surgical exposures of
dental pulps in germ-free and conventional laboratory rats. Oral Surgery, Oral Medicine,
Oral Pathology, 20 (3), 340-349.
Katebzadeh, N., Hupp, J., & Trope, M. (1999). Histological periapical repair after
obturation of infected root canals in dogs. Journal of Endodontics, 25 (5), 364-368.
Kenee, D.M., Allemang, J.D., Johnson, J.D., Hellstein, J., & Nichol, B.K. (2006). A
quantitative assessment of efficacy of various calcium hydroxide removal techniques.
Journal of Endodontics, 32 (6), 563-565.
Kim, S.K., & Kim, Y.O. (2002). Influence of calcium hydroxide intracanal medication on
apical seal. International Endodontic Journal, 35 (7), 623-628.

62
Kontakiotis, E.G., Wu, M.-K., & Wesselink, P.R. (1997). Effect of calcium hydroxide
dressing on seal of permanent root filling. Endod Dent Traumatol, 13, 281-284.
Kum, K.-Y., Kazemi, R.B., Cha, B.Y., & Zhu, Q. (2006). Smear layer production of K3 and
ProFile Ni-Ti rotary instruments in curved root canals: A comparative SEM study. Oral
Surg, Oral Med, Oral Pathol, Oral Radiol, and Endod, 101 (4), 536-541.
Lambrianidis, T., Margelos, J., & Beltes, P. (1999). Removal efficacy of calcium hydroxide
dressing from the root canal. Journal of Endodontics, 25 (2), 85-88.
Lambrianidis, T., Margelos, J., & Beltes, P. (2006). Removal efficacy of various calcium
hydroxide/CHX medicaments from the root canal. International Endodontic Journal, 39
(1), 55-61.
Lev R., Reader, A., Beck, M., & Meyers, W. (1987). An in vitro comparison of the step-
back technique versus a step-back/ultrasonic technique for 1 and 3 minutes. Journal of
Endodontics, 13 (11), 523-530.
Lin l., Di Fiore P., Lin J., & Rosenberg P., (2006). Histologic study of periradicular
responses to uninfected and infected devitalized pulps in dogs. Journal of Endodontics,
32, 34-38.
Mannocci, F., Peru, M., Sheriff, M., Cook, R. & Pitt Ford, T.R. (2005). The isthmuses of
the mesial root of mandibular molars: a micro-computed tomographic study.
International Endodontic Journal, 38 (8), 558-563.
Margelos, J., Eliades, G., Verdelis, C., & Palaghias, G. (1997). Interaction of calcium
hydroxide with zinc oxide-eugenol type sealers: A potential clinical problem. Journal of
Endodontics, 23 (1), 43-48.
Melton, D.C., Krell, K.V., & Fuller, M.W. (1991). Anatomical and histological features of
C-shaped canals in mandibular second molars. Journal of Endodontics, 17 (8), 384-388.
Metzger, Z., Teperovich, E., Zary, R., Cohen, R., & Hof, R. (2010). The self-adjusting file
(SAF). Part 1: Respecting the root canal anatomy—a new concept of endodontic files
and its implementation. Journal of Endodontics, 36 (4), 679-690.

63
Nagaoka S., Miyazaki Y., Lui H., Iwamoto Y., Kitano M., Kawagoe M., (1995). Bacteria
invasion into dentainal tubules of human vital and nonvital teeth. Journal of
Endodontics, 21 (2), 70-73.
Nandini, S., Velmurugan, N., & Kandaswamy, D. (2006). Removal efficiency of calcium
hydroxide intracanal medicament with two calcium chelators: Volumetric analysis using
spiral CT, an in vitro study. Journal of Endodontics, 32 (11), 1097-1101.
Nerwich, A., Figdor, D., & Messer, H.H. (1993). pH changes in root dentin over a 4-week
period following root canal dressing with calcium hydroxide. Journal of Endodontics, 19
(6), 302-306.
Ng, Y-L., Mann, V., Rahbaran, S., Lewsey, J., & Gulabivala, K. (2008). Outcome of primary
root canal treatment: Systematic review of the literature – Part 2. Influence of clinical
factors. International Endodontic Journal, 41, 6-31.
Patiño, P.V., Biedma, B.M., Liébana, C.R., Cantatore, G., & Bahillo, J.G. (2005). The
influence of a manual glide path on the separation rate of NiTi rotary instruments.
Journal of Endodontics, 31 (2), 114-116.
Penesis, V. (2008). Outcome of one-visit and two-visit endodontic treatment of necrotic
teeth with apical periodontitis: A randomized controlled trial with one-year evaluation.
Journal of Endodontics, 34 (3), 251-257.
Porkaew, P., Retief, H., Barfield, R.D., Lacefield, W.R., & Soong, S.-J. (1990). Effects of
calcium hydroxide paste as an intracanal medicament on apical seal. Journal of
Endodontics, 16 (8), 369-374.
Pruett, J.P., Clement, D.J., & Carnes, D.L. (1997). Cyclic fatigue testing of nickel-titanium
endodontic instrument. Journal of Endodontics, 23 (2), 77-85.
Reeh, E.S., Messer, H.H., Douglas, W.H. (1989). Reduction in tooth stiffness as a result of
endodontic and restorative procedures. Journal of Endodontics, 15, 512-516.
Richman M.J. (1957). Use of ultrasonics in root canal therapy and root resections.
Journal of Dental Medicine, 12, 12-18.
Rocas, I., Siqueria J. (2010). Identification of bacteria enduring endodontic treatment

64
procedures by a combined reverse transcriptase–polymerase chain reaction and reverse-capture checkerboard approach. Journal of Endodontics, 36, 45-52. Sabins, R.A., Johnson, J.D., & Hellstein, J.W. (2003). A comparison of the cleaning
efficacy of short-term sonic and ultrasonic passive irrigation after hand instrumentation
in molar root canals. Journal of Endodontics, 29 (10), 674-678.
Safavi, K.E., & Nichols, F.C. (1993). Effect of calcium hydroxide on bacterial
lipopolysaccharide. Journal of Endodontics, 19 (2), 76-78.
Schäfer, E., & Florek, H. (2003). Efficiency of rotary nickel-titanium K3 instruments
compared with stainless steel hand K-Flexofile: Part 1. Shaping ability in simulated
curved canals. International Endodontic Journal, 36 (3), 199-207.
Schäfer, E., & Schlingemann, R. (2003). Efficiency of rotary nickel-titanium K3
instruments compared with stainless steel hand K-Flexofile: Part 2. Cleaning
effectiveness and shaping ability in severely curved root canals of extracted teeth.
International Endodontic Journal, 36 (3), 208-217.
Schilder, H. (1967). Filling root canals in three dimensions. Journal of Endodontics, 32
(4), 281-290.
Silva, L.A.B., Nelson-Filho, P., Leonardo, M.R., Rossi, M.A., & Pansani, C.A. (2002). Effect
of calcium hydroxide on bacterial endotoxin in vivo. Journal of Endodontics, 28 (2), 94-
98.
Simcock, R.M., & Hicks, M.L. (2006). Delivery of calcium hydroxide: Comparison of four
filling techniques. Journal of Endodontics, 32 (7), 680-682.
Siquiera, J.F., Lima, K.C., Magalhāes, Lopes, H.P., & de Uzeda, M. (1999). Mechanical
reduction of the bacterial population in the root canal by three instrumentation
techniques. Journal of Endodontics, 25 (5), 332-335.
Siquiera, J.F., & Lopes, H.P. (1999). Mechanisms of antimicrobial activity of calcium
hydroxide: A critical review. International Endodontic Journal, 32 (5), 361-369.
Sjögren, U., Figdor, D., Spangberg, L., & Sundqvist, G. (1991). The antimicrobial effect of
calcium hydroxide as a short-term intracanal dressing. International Endodontic Journal,
24, 119-125.

65
Stamos, D.E., Sadeghi, E.M., Haasch, G.C., & Gerstein, H. (1987). An in vitro comparison
study to quantitate the debridement ability of hand, sonic, and ultrasonic
instrumentation. Journal of Endodontics, 13 (9), 434-440.
Stefopoulos, S., Tsatsas, D.V., Kerezoudis, N.P., & Eliades, G. (2008). Comparative in vitro
study of the sealing efficiency of white vs. grey ProRoot mineral trioxide aggregate
formulas as apical barriers. Dental Traumatology, 24 (2), 207-213.
Torabinejad, M. (1994). Passive step-back technique: A sequential use of ultrasonic and
hand instruments. Oral Surg, Oral Med, Oral Pathol, 77 (4), 402-405.
Tronstad, L., Barnett, F., Scwartzben, L., & Frasca, P. (1985). Effectiveness and safety of a
sonic vibratory endodontic instrument. Endod Dent Traumatol, 1, 69-76.
Trope M., Delano O., & Orstavik D., (1999). Endodontic treatment of teeth with apical
periodontitis: single versus multiple visit treatment. Journal of Endodontics, 25 (5), 345-
350.
van der Sluis, L.W.M., Wu, M.K., & Wesselink, P.R. (2007). The evaluation of removal of
calcium hydroxide paste from an artificial standardized groove in the apical root canal
using different irrigation methodologies. International Endodontic Journal, 40 (1), 52-57.
Walia, T., Singh Chawla, H., & Gauba, K. (2001). Management of wide open apices in
non-vital permanent teeth with Ca(OH)2 paste. Journal of Clinical Pediatric Dentistry, 25
(1), 51-56.
Waltimo, T.M.T. (1999). Susceptibility of oral Candida species to calcium hydroxide in
vitro. International Endodontic Journal, 32 (2), 94.
Wang, C., Debelian, G., Teixeira, F. (2006). Effect of intracanal medicament on the
sealing ability of root canals filled with Resilon. Journal of Endodontics, 32 (6), 532-536.
Whitworth, J. (2005). Methods of filling root canals: Principles and practices. Endod
Topics, 12, 2-24.
Wiseman, A., Cox, T.C., Paranjpe, A., Flake, N.M., Cohenca, N. & Johnson, J.D. (2011).
Efficacy of sonic and ultrasonic activation for removal of calcium hydroxide from mesial
canals of mandibular molars: A microtomographic study. Journal of Endodontics, 37 (2),
235-238.

66
Yoldas, O., Topuz, A., Isci, A.S., Oztunc, H. (2004). Postoperative pain after endodontic
retreatment: Single- versus two-visit treatment. Oral Surg Oral Med Oral Pathol Oral
Radiol Endod, 98, 483-487.

67
Appendix I.
Standard specimens with respective weights in grams (left middle) and milligrams (right middle) and cumulative micromoles at pH=7.
TOOTH WEIGHT Mg µmoles
a1 0.00031 0.31 0.466682
a2 0.00028 0.28 0.70592
a3 0.00029 0.29 0.410099
b1 0.00061 0.61 1.675192
b2 0.00056 0.56 2.306818
b3 0.00065 0.65 0.768775
c1 0.0009 0.9 6.759696
c2 0.00087 0.87 4.104956
c3 0.00089 0.89 4.987356
d1 0.00123 1.23 9.637615
d2 0.00117 1.17 3.629442
d3 0.00124 1.24 6.430928
e1 0.00153 1.53 11.87791
e2 0.0015 1.5 14.11789
e3 0.00147 1.47 8.96129
f1 0.00175 1.75 11.83333
f2 0.00184 1.84 12.8758
f3 0.00185 1.85 5.332258
g1 0.00209 2.09 15.40984
g2 0.00212 2.12 8.525
g3 0.00214 2.14 15.10189
h1 0.00238 2.38 19.58756
h2 0.00237 2.37 17.08889
h3 0.00243 2.43 13.73379
i1 0.00272 2.72 5.709302
i2 0.0027 2.7 16.21135
i3 0.00271 2.71 17.60976
j1 0.00297 2.97 23.09556
j2 0.00297 2.97 23.6198
j3 0.00302 3.02 13.07781

68
Appendix II.
A "second" standard curve. These standards, while not used in data analysis, were used to make a standard curve. Titrations were performed in tubes rather than teeth.
Standard Grams mg µmoles
2a 0.00015 0.15 2.872024
2b 0.00013 0.13 2.589273
2c 0.00015 0.15 1.604167
3a 0.00031 0.31 1.604167
3b 0.00029 0.29 2.72508
3c 0.00028 0.28 6.531965
4a 0.00046 0.46 7.019822
4b 0.00045 0.45 5.743468
4c 0.00042 0.42 7.863128
5a 0.00061 0.61 12.12228
5b 0.0006 0.6 7.091503
5c 0.00062 0.62 9.976754
6a 0.00073 0.73 12.71756
6b 0.00078 0.78 8.729026
6c 0.00078 0.78 13.0936
7a 0.00098 0.98 16.14678
7b 0.00097 0.97 13.08324
7c 0.00102 1.02 11.99044
8a 0.00132 1.32 13.18905
8b 0.00129 1.29 13.88438
8c 0.00133 1.33 20.10061
9a 0.00161 1.61 27.21519
9b 0.00162 1.62 15.50127
9c 0.00161 1.61 22.08586
10a 0.00189 1.89 25.15714
10b 0.00192 1.92 30.57806
10c 0.00187 1.87 25.21717
11a 0.00219 2.19 27.61638
11b 0.00217 2.17 27.60047
11c 0.00219 2.19 31.71593

69
Appendix III.
Titration data for Samples. Columns from left to right: pH readings, concentration of HCL added, volume of HCL added, moles of HCL added, cumulative moles of HCL added,
cumulative micromoles of HCL added, and pH (listed again).
pH [HCl] HCl (L) HCl Added (mol)HCl Cumulative (mol)Micromoles (cumulative)pH
8.72 - - - 0.00000000 0 8.72
7.52 0.025 0.00001 0.00000025 0.00000025 0.25 7.52
6.83 0.025 0.00001 0.00000025 0.00000050 0.5 6.83
6.31 0.025 0.00001 0.00000025 0.00000075 0.75 6.31
5.26 0.05 0.00001 0.00000050 0.00000125 1.25 5.26
2.91 0.1 0.00001 0.00000100 0.00000225 2.25 2.91
2.08 0.2 0.00001 0.00000200 0.00000425 4.25 2.08
Sample 1
pH [HCl] HCl (L) HCl Added (mol)HCl Cumulative (mol)Micromoles (cumulative)pH
11.17 - - - 0.00000000 0 11.17
10.89 0.5 0.00001 0.00000500 0.00000500 5 10.89
10.51 0.2 0.00001 0.00000200 0.00000700 7 10.51
8.67 0.2 0.00001 0.00000200 0.00000900 9 8.67
8.36 0.025 0.00001 0.00000025 0.00000925 9.25 8.36
8.19 0.025 0.00001 0.00000025 0.00000950 9.5 8.19
8.06 0.025 0.00001 0.00000025 0.00000975 9.75 8.06
8 0.025 0.00001 0.00000025 0.00001000 10 8
7.89 0.025 0.00001 0.00000025 0.00001025 10.25 7.89
7.62 0.05 0.00001 0.00000050 0.00001075 10.75 7.62
7.14 0.1 0.00001 0.00000100 0.00001175 11.75 7.14
6.74 0.2 0.00001 0.00000200 0.00001375 13.75 6.74
1.85 1 0.00001 0.00001000 0.00002375 23.75 1.85
Sample 3
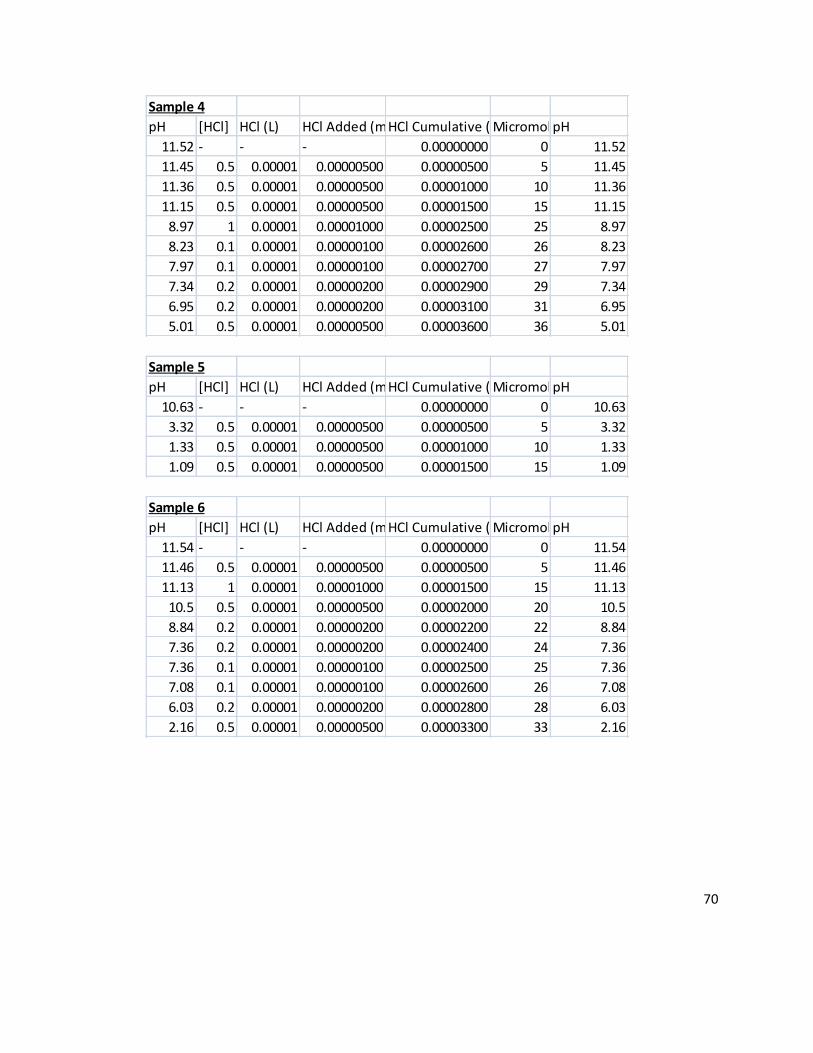
70
pH [HCl] HCl (L) HCl Added (mol)HCl Cumulative (mol)Micromoles (cumulative)pH
11.52 - - - 0.00000000 0 11.52
11.45 0.5 0.00001 0.00000500 0.00000500 5 11.45
11.36 0.5 0.00001 0.00000500 0.00001000 10 11.36
11.15 0.5 0.00001 0.00000500 0.00001500 15 11.15
8.97 1 0.00001 0.00001000 0.00002500 25 8.97
8.23 0.1 0.00001 0.00000100 0.00002600 26 8.23
7.97 0.1 0.00001 0.00000100 0.00002700 27 7.97
7.34 0.2 0.00001 0.00000200 0.00002900 29 7.34
6.95 0.2 0.00001 0.00000200 0.00003100 31 6.95
5.01 0.5 0.00001 0.00000500 0.00003600 36 5.01
Sample 4
pH [HCl] HCl (L) HCl Added (mol)HCl Cumulative (mol)Micromoles (cumulative)pH
10.63 - - - 0.00000000 0 10.63
3.32 0.5 0.00001 0.00000500 0.00000500 5 3.32
1.33 0.5 0.00001 0.00000500 0.00001000 10 1.33
1.09 0.5 0.00001 0.00000500 0.00001500 15 1.09
Sample 5
pH [HCl] HCl (L) HCl Added (mol)HCl Cumulative (mol)Micromoles (cumulative)pH
11.54 - - - 0.00000000 0 11.54
11.46 0.5 0.00001 0.00000500 0.00000500 5 11.46
11.13 1 0.00001 0.00001000 0.00001500 15 11.13
10.5 0.5 0.00001 0.00000500 0.00002000 20 10.5
8.84 0.2 0.00001 0.00000200 0.00002200 22 8.84
7.36 0.2 0.00001 0.00000200 0.00002400 24 7.36
7.36 0.1 0.00001 0.00000100 0.00002500 25 7.36
7.08 0.1 0.00001 0.00000100 0.00002600 26 7.08
6.03 0.2 0.00001 0.00000200 0.00002800 28 6.03
2.16 0.5 0.00001 0.00000500 0.00003300 33 2.16
Sample 6

71
pH [HCl] HCl (L) HCl Added (mol)HCl Cumulative (mol)Micromoles (cumulative)pH
8.67 - - - 0.00000000 0 8.67
8.3 0.025 0.00001 0.00000025 0.00000025 0.25 8.3
7.37 0.025 0.00001 0.00000025 0.00000050 0.5 7.37
7 0.025 0.00001 0.00000025 0.00000075 0.75 7
6.36 0.025 0.00001 0.00000025 0.00000100 1 6.36
1.66 0.5 0.00001 0.00000500 0.00000600 6 1.66
1.3 0.5 0.00001 0.00000500 0.00001100 11 1.3
Sample 7
pH [HCl] HCl (L) HCl Added (mol)HCl Cumulative (mol)Micromoles (cumulative)pH
10.2 - - - 0.00000000 0 10.2
6.57 0.2 0.00001 0.00000200 0.00000200 2 6.57
6.31 0.025 0.00001 0.00000025 0.00000225 2.25 6.31
6.07 0.025 0.00001 0.00000025 0.00000250 2.5 6.07
4.93 0.05 0.00001 0.00000050 0.00000300 3 4.93
3.04 0.1 0.00001 0.00000100 0.00000400 4 3.04
1.94 0.2 0.00001 0.00000200 0.00000600 6 1.94
Sample 8
pH [HCl] HCl (L) HCl Added (mol)HCl Cumulative (mol)Micromoles (cumulative)pH
11.12 - - - 0.00000000 0 11.12
10.16 0.5 0.00001 0.00000500 0.00000500 5 10.16
7.25 0.2 0.00001 0.00000200 0.00000700 7 7.25
7.2 0.025 0.00001 0.00000025 0.00000725 7.25 7.2
6.88 0.05 0.00001 0.00000050 0.00000775 7.75 6.88
6.61 0.05 0.00001 0.00000050 0.00000825 8.25 6.61
6.3 0.1 0.00001 0.00000100 0.00000925 9.25 6.3
5.44 0.2 0.00001 0.00000200 0.00001125 11.25 5.44
1.96 0.5 0.00001 0.00000500 0.00001625 16.25 1.96
Sample 9

72
pH [HCl] HCl (L) HCl Added (mol)HCl Cumulative (mol)Micromoles (cumulative)pH
10.67 - - - 0.00000000 0 10.67
10.43 0.1 0.00001 0.00000100 0.00000100 1 10.43
7.71 0.2 0.00001 0.00000200 0.00000300 3 7.71
7.4 0.025 0.00001 0.00000025 0.00000325 3.25 7.4
7.33 0.025 0.00001 0.00000025 0.00000350 3.5 7.33
7.25 0.025 0.00001 0.00000025 0.00000375 3.75 7.25
7.13 0.025 0.00001 0.00000025 0.00000400 4 7.13
6.99 0.025 0.00001 0.00000025 0.00000425 4.25 6.99
6.25 0.05 0.00001 0.00000050 0.00000475 4.75 6.25
1.87 0.5 0.00001 0.00000500 0.00000975 9.75 1.87
Sample 12
pH [HCl] HCl (L) HCl Added (mol)HCl Cumulative (mol)Micromoles (cumulative)pH
11.27 - - - 0.00000000 0 11.27
11.06 0.5 0.00001 0.00000500 0.00000500 5 11.06
10.38 0.5 0.00001 0.00000500 0.00001000 10 10.38
8.51 0.2 0.00001 0.00000200 0.00001200 12 8.51
7.81 0.1 0.00001 0.00000100 0.00001300 13 7.81
7.66 0.05 0.00001 0.00000050 0.00001350 13.5 7.66
7.58 0.05 0.00001 0.00000050 0.00001400 14 7.58
7.23 0.1 0.00001 0.00000100 0.00001500 15 7.23
7.05 0.05 0.00001 0.00000050 0.00001550 15.5 7.05
7.04 0.025 0.00001 0.00000025 0.00001575 15.75 7.04
6.98 0.05 0.00001 0.00000050 0.00001625 16.25 6.98
6.72 0.1 0.00001 0.00000100 0.00001725 17.25 6.72
2.62 0.5 0.00001 0.00000500 0.00002225 22.25 2.62
Sample 13
pH [HCl] HCl (L) HCl Added (mol)HCl Cumulative (mol)Micromoles (cumulative)pH
10.78 - - - 0.00000000 0 10.78
10.33 0.2 0.00001 0.00000200 0.00000200 2 10.33
7.22 0.2 0.00001 0.00000200 0.00000400 4 7.22
7.21 0.025 0.00001 0.00000025 0.00000425 4.25 7.21
7 0.05 0.00001 0.00000050 0.00000475 4.75 7
6.47 0.1 0.00001 0.00000100 0.00000575 5.75 6.47
4.48 0.2 0.00001 0.00000200 0.00000775 7.75 4.48
1.67 0.5 0.00001 0.00000500 0.00001275 12.75 1.67
Sample 16
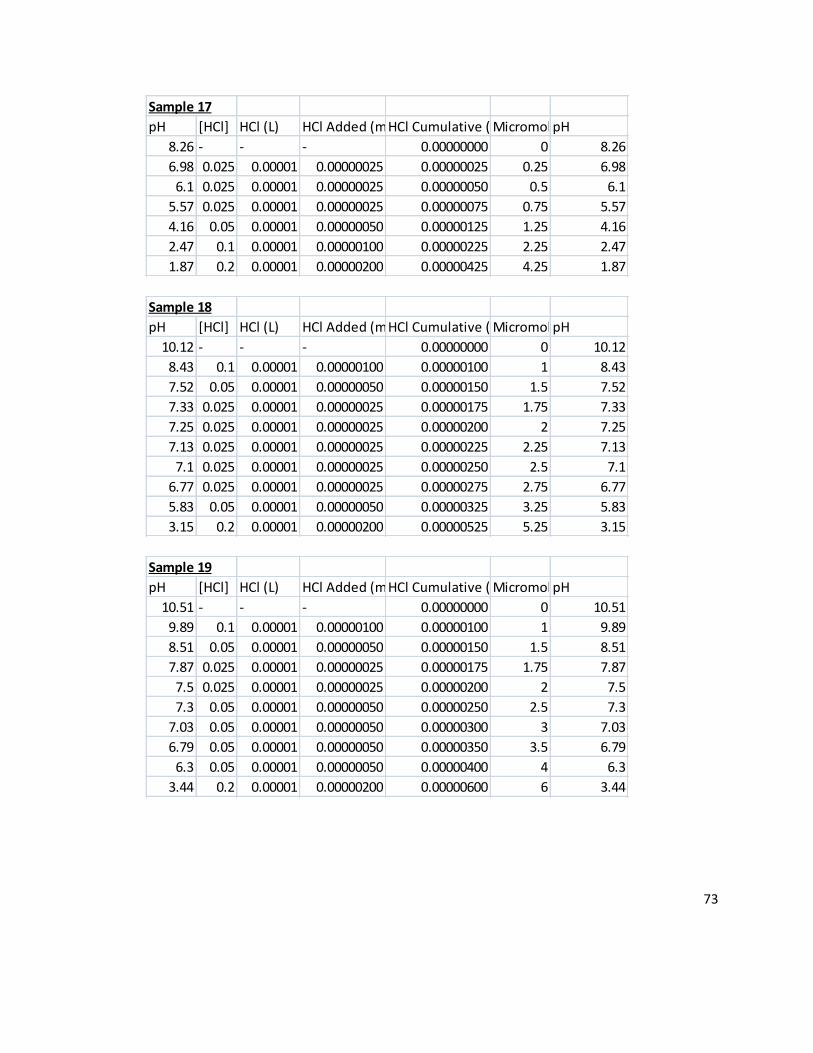
73
pH [HCl] HCl (L) HCl Added (mol)HCl Cumulative (mol)Micromoles (cumulative)pH
8.26 - - - 0.00000000 0 8.26
6.98 0.025 0.00001 0.00000025 0.00000025 0.25 6.98
6.1 0.025 0.00001 0.00000025 0.00000050 0.5 6.1
5.57 0.025 0.00001 0.00000025 0.00000075 0.75 5.57
4.16 0.05 0.00001 0.00000050 0.00000125 1.25 4.16
2.47 0.1 0.00001 0.00000100 0.00000225 2.25 2.47
1.87 0.2 0.00001 0.00000200 0.00000425 4.25 1.87
Sample 17
pH [HCl] HCl (L) HCl Added (mol)HCl Cumulative (mol)Micromoles (cumulative)pH
10.12 - - - 0.00000000 0 10.12
8.43 0.1 0.00001 0.00000100 0.00000100 1 8.43
7.52 0.05 0.00001 0.00000050 0.00000150 1.5 7.52
7.33 0.025 0.00001 0.00000025 0.00000175 1.75 7.33
7.25 0.025 0.00001 0.00000025 0.00000200 2 7.25
7.13 0.025 0.00001 0.00000025 0.00000225 2.25 7.13
7.1 0.025 0.00001 0.00000025 0.00000250 2.5 7.1
6.77 0.025 0.00001 0.00000025 0.00000275 2.75 6.77
5.83 0.05 0.00001 0.00000050 0.00000325 3.25 5.83
3.15 0.2 0.00001 0.00000200 0.00000525 5.25 3.15
Sample 18
pH [HCl] HCl (L) HCl Added (mol)HCl Cumulative (mol)Micromoles (cumulative)pH
10.51 - - - 0.00000000 0 10.51
9.89 0.1 0.00001 0.00000100 0.00000100 1 9.89
8.51 0.05 0.00001 0.00000050 0.00000150 1.5 8.51
7.87 0.025 0.00001 0.00000025 0.00000175 1.75 7.87
7.5 0.025 0.00001 0.00000025 0.00000200 2 7.5
7.3 0.05 0.00001 0.00000050 0.00000250 2.5 7.3
7.03 0.05 0.00001 0.00000050 0.00000300 3 7.03
6.79 0.05 0.00001 0.00000050 0.00000350 3.5 6.79
6.3 0.05 0.00001 0.00000050 0.00000400 4 6.3
3.44 0.2 0.00001 0.00000200 0.00000600 6 3.44
Sample 19

74
pH [HCl] HCl (L) HCl Added (mol)HCl Cumulative (mol)Micromoles (cumulative)pH
8.6 - - - 0.00000000 0 8.6
7.26 0.025 0.00001 0.00000025 0.00000025 0.25 7.26
6.82 0.025 0.00001 0.00000025 0.00000050 0.5 6.82
6.24 0.025 0.00001 0.00000025 0.00000075 0.75 6.24
5.36 0.05 0.00001 0.00000050 0.00000125 1.25 5.36
4.54 0.05 0.00001 0.00000050 0.00000175 1.75 4.54
2.55 0.2 0.00001 0.00000200 0.00000375 3.75 2.55
Sample 20
pH [HCl] HCl (L) HCl Added (mol)HCl Cumulative (mol)Micromoles (cumulative)pH
8.48 - - - 0.00000000 0 8.48
7.3 0.025 0.00001 0.00000025 0.00000025 0.25 7.3
6.71 0.025 0.00001 0.00000025 0.00000050 0.5 6.71
5.6 0.025 0.00001 0.00000025 0.00000075 0.75 5.6
5.3 0.025 0.00001 0.00000025 0.00000100 1 5.3
4.61 0.05 0.00001 0.00000050 0.00000150 1.5 4.61
2.77 0.2 0.00001 0.00000200 0.00000350 3.5 2.77
Sample 21
pH [HCl] HCl (L) HCl Added (mol)HCl Cumulative (mol)Micromoles (cumulative)pH
8.87 - - - 0.00000000 0 8.87
7.79 0.025 0.00001 0.00000025 0.00000025 0.25 7.79
7.11 0.025 0.00001 0.00000025 0.00000050 0.5 7.11
7.08 0.025 0.00001 0.00000025 0.00000075 0.75 7.08
6.26 0.025 0.00001 0.00000025 0.00000100 1 6.26
5.3 0.05 0.00001 0.00000050 0.00000150 1.5 5.3
2.66 0.2 0.00001 0.00000200 0.00000350 3.5 2.66
Sample 22
pH [HCl] HCl (L) HCl Added (mol)HCl Cumulative (mol)Micromoles (cumulative)pH
8.39 - - - 0.00000000 0 8.39
7.31 0.025 0.00001 0.00000025 0.00000025 0.25 7.31
6.87 0.025 0.00001 0.00000025 0.00000050 0.5 6.87
6.07 0.025 0.00001 0.00000025 0.00000075 0.75 6.07
5.35 0.05 0.00001 0.00000050 0.00000125 1.25 5.35
3.78 0.1 0.00001 0.00000100 0.00000225 2.25 3.78
2.45 0.2 0.00001 0.00000200 0.00000425 4.25 2.45
Sample 23

75
pH [HCl] HCl (L) HCl Added (mol)HCl Cumulative (mol)Micromoles (cumulative)pH
8.49 - - - 0.00000000 0 8.49
7.53 0.025 0.00001 0.00000025 0.00000025 0.25 7.53
6.99 0.025 0.00001 0.00000025 0.00000050 0.5 6.99
6.11 0.025 0.00001 0.00000025 0.00000075 0.75 6.11
5.28 0.05 0.00001 0.00000050 0.00000125 1.25 5.28
2.63 0.2 0.00001 0.00000200 0.00000325 3.25 2.63
1.9 0.5 0.00001 0.00000500 0.00000825 8.25 1.9
Sample 24
pH [HCl] HCl (L) HCl Added (mol)HCl Cumulative (mol)Micromoles (cumulative)pH
11.44 - - - 0.00000000 0 11.44
11.26 0.5 0.00001 0.00000500 0.00000500 5 11.26
10.57 0.5 0.00001 0.00000500 0.00001000 10 10.57
7.45 0.5 0.00001 0.00000500 0.00001500 15 7.45
7.4 0.025 0.00001 0.00000025 0.00001525 15.25 7.4
7.1 0.05 0.00001 0.00000050 0.00001575 15.75 7.1
6.96 0.05 0.00001 0.00000050 0.00001625 16.25 6.96
6.77 0.05 0.00001 0.00000050 0.00001675 16.75 6.77
6.47 0.1 0.00001 0.00000100 0.00001775 17.75 6.47
2.34 0.5 0.00001 0.00000500 0.00002275 22.75 2.34
Sample 25
pH [HCl] HCl (L) HCl Added (mol)HCl Cumulative (mol)Micromoles (cumulative)pH
8.4 - - - 0.00000000 0 8.4
6.92 0.025 0.00001 0.00000025 0.00000025 0.25 6.92
5.3 0.025 0.00001 0.00000025 0.00000050 0.5 5.3
3.62 0.05 0.00001 0.00000050 0.00000100 1 3.62
2.58 0.1 0.00001 0.00000100 0.00000200 2 2.58
1.86 0.5 0.00001 0.00000500 0.00000700 7 1.86
Sample 26

76
pH [HCl] HCl (L) HCl Added (mol)HCl Cumulative (mol)Micromoles (cumulative)pH
5.96 - - - 0.00000000 0 5.96
3.96 0.025 0.00001 0.00000025 0.00000025 0.25 3.96
2.81 0.025 0.00001 0.00000025 0.00000050 0.5 2.81
2.58 0.05 0.00001 0.00000050 0.00000100 1 2.58
2.33 0.1 0.00001 0.00000100 0.00000200 2 2.33
2.06 0.2 0.00001 0.00000200 0.00000400 4 2.06
Sample 28
pH [HCl] HCl (L) HCl Added (mol)HCl Cumulative (mol)Micromoles (cumulative)pH
9.57 - - - 0.00000000 0 9.57
7.54 0.05 0.00001 0.00000050 0.00000050 0.5 7.54
7.09 0.025 0.00001 0.00000025 0.00000075 0.75 7.09
7.01 0.025 0.00001 0.00000025 0.00000100 1 7.01
6.86 0.025 0.00001 0.00000025 0.00000125 1.25 6.86
6.62 0.025 0.00001 0.00000025 0.00000150 1.5 6.62
5.49 0.05 0.00001 0.00000050 0.00000200 2 5.49
3.81 0.1 0.00001 0.00000100 0.00000300 3 3.81
Sample 29
pH [HCl] HCl (L) HCl Added (mol)HCl Cumulative (mol)Micromoles (cumulative)pH
10.91 - - - 0.00000000 0 10.91
10.78 0.1 0.00001 0.00000100 0.00000100 1 10.78
10.03 0.2 0.00001 0.00000200 0.00000300 3 10.03
8.06 0.1 0.00001 0.00000100 0.00000400 4 8.06
7.57 0.05 0.00001 0.00000050 0.00000450 4.5 7.57
7.38 0.05 0.00001 0.00000050 0.00000500 5 7.38
7.19 0.05 0.00001 0.00000050 0.00000550 5.5 7.19
6.97 0.05 0.00001 0.00000050 0.00000600 6 6.97
5.84 0.1 0.00001 0.00000100 0.00000700 7 5.84
3.44 0.2 0.00001 0.00000200 0.00000900 9 3.44
Sample 30
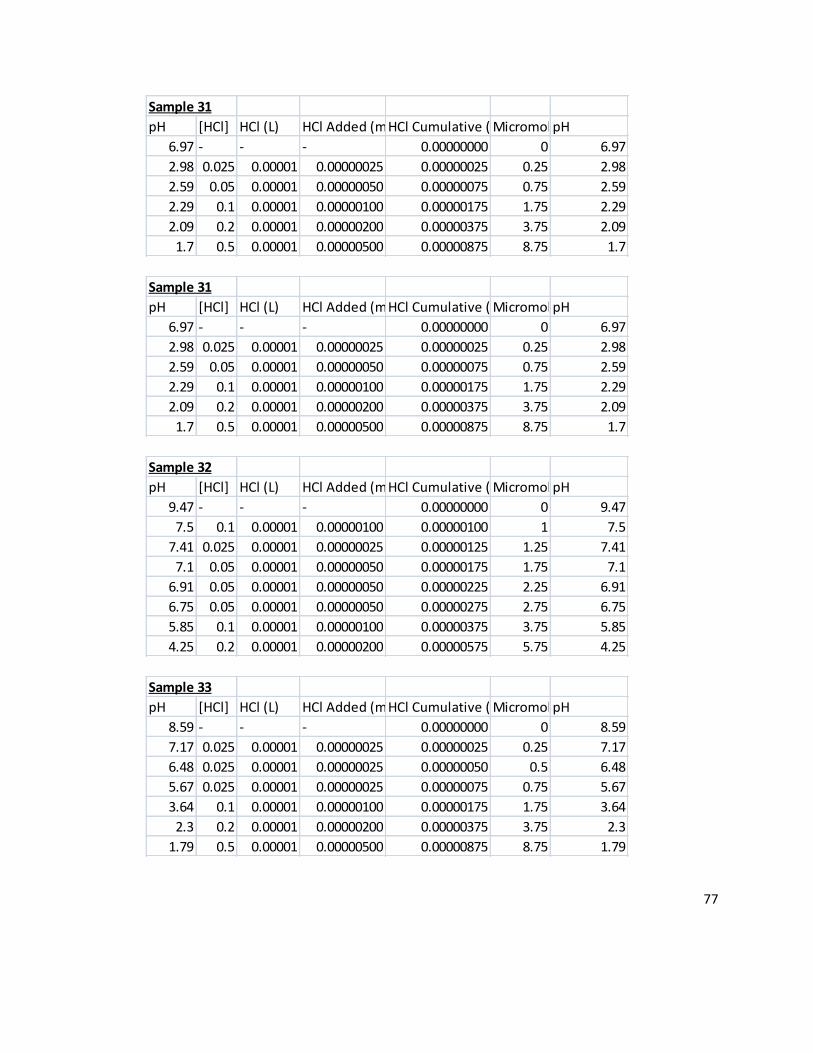
77
Sample 31
pH [HCl] HCl (L) HCl Added (mol)HCl Cumulative (mol)Micromoles (cumulative)pH
6.97 - - - 0.00000000 0 6.97
2.98 0.025 0.00001 0.00000025 0.00000025 0.25 2.98
2.59 0.05 0.00001 0.00000050 0.00000075 0.75 2.59
2.29 0.1 0.00001 0.00000100 0.00000175 1.75 2.29
2.09 0.2 0.00001 0.00000200 0.00000375 3.75 2.09
1.7 0.5 0.00001 0.00000500 0.00000875 8.75 1.7
pH [HCl] HCl (L) HCl Added (mol)HCl Cumulative (mol)Micromoles (cumulative)pH
9.47 - - - 0.00000000 0 9.47
7.5 0.1 0.00001 0.00000100 0.00000100 1 7.5
7.41 0.025 0.00001 0.00000025 0.00000125 1.25 7.41
7.1 0.05 0.00001 0.00000050 0.00000175 1.75 7.1
6.91 0.05 0.00001 0.00000050 0.00000225 2.25 6.91
6.75 0.05 0.00001 0.00000050 0.00000275 2.75 6.75
5.85 0.1 0.00001 0.00000100 0.00000375 3.75 5.85
4.25 0.2 0.00001 0.00000200 0.00000575 5.75 4.25
Sample 32
pH [HCl] HCl (L) HCl Added (mol)HCl Cumulative (mol)Micromoles (cumulative)pH
8.59 - - - 0.00000000 0 8.59
7.17 0.025 0.00001 0.00000025 0.00000025 0.25 7.17
6.48 0.025 0.00001 0.00000025 0.00000050 0.5 6.48
5.67 0.025 0.00001 0.00000025 0.00000075 0.75 5.67
3.64 0.1 0.00001 0.00000100 0.00000175 1.75 3.64
2.3 0.2 0.00001 0.00000200 0.00000375 3.75 2.3
1.79 0.5 0.00001 0.00000500 0.00000875 8.75 1.79
Sample 33

78
pH [HCl] HCl (L) HCl Added (mol)HCl Cumulative (mol)Micromoles (cumulative)pH
8.68 - - - 0.00000000 0 8.68
7.55 0.025 0.00001 0.00000025 0.00000025 0.25 7.55
7.09 0.025 0.00001 0.00000025 0.00000050 0.5 7.09
6.47 0.025 0.00001 0.00000025 0.00000075 0.75 6.47
5.62 0.025 0.00001 0.00000025 0.00000100 1 5.62
3.81 0.1 0.00001 0.00000100 0.00000200 2 3.81
2.4 0.2 0.00001 0.00000200 0.00000400 4 2.4
Sample 34
pH [HCl] HCl (L) HCl Added (mol)HCl Cumulative (mol)Micromoles (cumulative)pH
11.28 - - - 0.00000000 0 11.28
11 0.5 0.00001 0.00000500 0.00000500 5 11
7.39 0.5 0.00001 0.00000500 0.00001000 10 7.39
7.32 0.025 0.00001 0.00000025 0.00001025 10.25 7.32
7.02 0.05 0.00001 0.00000050 0.00001075 10.75 7.02
6.86 0.025 0.00001 0.00000025 0.00001100 11 6.86
6.71 0.05 0.00001 0.00000050 0.00001150 11.5 6.71
5.45 0.2 0.00001 0.00000200 0.00001350 13.5 5.45
2.01 0.5 0.00001 0.00000500 0.00001850 18.5 2.01
Sample 35
pH [HCl] HCl (L) HCl Added (mol)HCl Cumulative (mol)Micromoles (cumulative)pH
9.3 - - - 0.00000000 0 9.3
7.57 0.05 0.00001 0.00000050 0.00000050 0.5 7.57
7.2 0.025 0.00001 0.00000025 0.00000075 0.75 7.2
7.04 0.025 0.00001 0.00000025 0.00000100 1 7.04
6.81 0.025 0.00001 0.00000025 0.00000125 1.25 6.81
5.97 0.05 0.00001 0.00000050 0.00000175 1.75 5.97
2.69 0.2 0.00001 0.00000200 0.00000375 3.75 2.69
Sample 36

79
pH [HCl] HCl (L) HCl Added (mol)HCl Cumulative (mol)Micromoles (cumulative)pH
10.26 - - - 0.00000000 10.26
9.05 0.1 0.00001 0.00000100 0.00000100 1 9.05
7.4 0.05 0.00001 0.00000050 0.00000150 1.5 7.4
7.3 0.025 0.00001 0.00000025 0.00000175 1.75 7.3
7.22 0.025 0.00001 0.00000025 0.00000200 2 7.22
7.05 0.05 0.00001 0.00000050 0.00000250 2.5 7.05
7.01 0.025 0.00001 0.00000025 0.00000275 2.75 7.01
6.82 0.025 0.00001 0.00000025 0.00000300 3 6.82
6.43 0.05 0.00001 0.00000050 0.00000350 3.5 6.43
4.04 0.2 0.00001 0.00000200 0.00000550 5.5 4.04
Sample 37
pH [HCl] HCl (L) HCl Added (mol)HCl Cumulative (mol)Micromoles (cumulative)pH
9.63 - - - 0.00000000 9.63
7.71 0.05 0.00001 0.00000050 0.00000050 0.5 7.71
7.2 0.025 0.00001 0.00000025 0.00000075 0.75 7.2
6.95 0.025 0.00001 0.00000025 0.00000100 1 6.95
6.49 0.05 0.00001 0.00000050 0.00000150 1.5 6.49
4.83 0.1 0.00001 0.00000100 0.00000250 2.5 4.83
2.5 0.2 0.00001 0.00000200 0.00000450 4.5 2.5
Sample 39
pH [HCl] HCl (L) HCl Added (mol)HCl Cumulative (mol)Micromoles (cumulative)pH
9.41 - - - 0.00000000 0 9.41
7.01 0.1 0.00001 0.00000100 0.00000100 1 7.01
6.57 0.025 0.00001 0.00000025 0.00000125 1.25 6.57
6.4 0.025 0.00001 0.00000025 0.00000150 1.5 6.4
5.3 0.05 0.00001 0.00000050 0.00000200 2 5.3
3.93 0.1 0.00001 0.00000100 0.00000300 3 3.93
2.3 0.2 0.00001 0.00000200 0.00000500 5 2.3
Sample 40

80
pH [HCl] HCl (L) HCl Added (mol)HCl Cumulative (mol)Micromoles (cumulative)pH
11.8 - - - 0.00000000 0 11.8
11.86 1 0.00001 0.00001000 0.00001000 10 11.86
11.76 1 0.00001 0.00001000 0.00002000 20 11.76
11.85 3 0.00001 0.00003000 0.00005000 50 11.85
11.66 3 0.00001 0.00003000 0.00008000 80 11.66
11.6 1 0.00001 0.00001000 0.00009000 90 11.6
11.58 1 0.00001 0.00001000 0.00010000 100 11.58
11.1 3 0.00001 0.00003000 0.00013000 130 11.1
10.85 1 0.00001 0.00001000 0.00014000 140 10.85
9.15 1 0.00001 0.00001000 0.00015000 150 9.15
7.74 0.5 0.00001 0.00000500 0.00015500 155 7.74
7.71 0.2 0.00001 0.00000200 0.00015700 157 7.71
7.16 0.5 0.00001 0.00000500 0.00016200 162 7.16
6.75 0.5 0.00001 0.00000500 0.00016700 167 6.75
1.1 3 0.00001 0.00003000 0.00019700 197 1.1
Sample 41
pH [HCl] HCl (L) HCl Added (mol)HCl Cumulative (mol)Micromoles (cumulative)pH
9.86 - - - 0.00000000 9.86
8.21 0.05 0.00001 0.00000050 0.00000050 0.5 8.21
7.99 0.025 0.00001 0.00000025 0.00000075 0.75 7.99
7.63 0.05 0.00001 0.00000050 0.00000125 1.25 7.63
7.45 0.05 0.00001 0.00000050 0.00000175 1.75 7.45
7.19 0.05 0.00001 0.00000050 0.00000225 2.25 7.19
6.95 0.05 0.00001 0.00000050 0.00000275 2.75 6.95
6.68 0.05 0.00001 0.00000050 0.00000325 3.25 6.68
5.25 0.1 0.00001 0.00000100 0.00000425 4.25 5.25
Sample 42
pH [HCl] HCl (L) HCl Added (mol)HCl Cumulative (mol)Micromoles (cumulative)pH
8.68 - - - 0.00000000 8.68
7.1 0.025 0.00001 0.00000025 0.00000025 0.25 7.1
6.05 0.025 0.00001 0.00000025 0.00000050 0.5 6.05
5.08 0.025 0.00001 0.00000025 0.00000075 0.75 5.08
4.17 0.025 0.00001 0.00000025 0.00000100 1 4.17
3.36 0.025 0.00001 0.00000025 0.00000125 1.25 3.36
2.97 0.025 0.00001 0.00000025 0.00000150 1.5 2.97
Sample 43

81
pH [HCl] HCl (L) HCl Added (mol)HCl Cumulative (mol)Micromoles (cumulative)pH
- - -
11.34 0 11.34
11.07 0.5 0.00001 0.00000500 0.00000500 5 11.07
10.44 0.5 0.00001 0.00000500 0.00001000 10 10.44
8.41 0.2 0.00001 0.00000200 0.00001200 12 8.41
7.6 0.1 0.00001 0.00000100 0.00001300 13 7.6
7.42 0.05 0.00001 0.00000050 0.00001350 13.5 7.42
7.3 0.05 0.00001 0.00000050 0.00001400 14 7.3
7.17 0.05 0.00001 0.00000050 0.00001450 14.5 7.17
7.01 0.05 0.00001 0.00000050 0.00001500 15 7.01
6.85 0.05 0.00001 0.00000050 0.00001550 15.5 6.85
6.4 0.1 0.00001 0.00000100 0.00001650 16.5 6.4
5.9 0.2 0.00001 0.00000200 0.00001850 18.5 5.9
2.97 0.5 0.00001 0.00000500 0.00002350 23.5 2.97
Sample 44
pH [HCl] HCl (L) HCl Added (mol)HCl Cumulative (mol)pH micromoles
9.28 - - -
7.47 0.05 0.00001 0.00000050 0.00000050 7.47 0.5
7.44 0.025 0.00001 0.00000025 0.00000075 7.44 0.75
7.05 0.05 0.00001 0.00000050 0.00000125 7.05 1.25
6.93 0.025 0.00001 0.00000025 0.00000150 6.93 1.5
6.15 0.05 0.00001 0.00000050 0.00000200 6.15 2
4.6 0.1 0.00001 0.00000100 0.00000300 4.6 3
2.41 0.2 0.00001 0.00000200 0.00000500 2.41 5
Sample 45
Sample 46
pH [HCl] HCl (L) HCl Added (mol)HCl Cumulative (mol)Micromoles (cumulative)pH
10.31 0.00000000 0 10.31
9.82 0.05 0.00001 0.00000050 0.00000050 0.5 9.82
7.85 0.05 0.00001 0.00000050 0.00000100 1 7.85
7.36 0.025 0.00001 0.00000025 0.00000125 1.25 7.36
7.15 0.025 0.00001 0.00000025 0.00000150 1.5 7.15
7.1 0.025 0.00001 0.00000025 0.00000175 1.75 7.1
6.9 0.025 0.00001 0.00000025 0.00000200 2 6.9
6.15 0.05 0.00001 0.00000050 0.00000250 2.5 6.15
4.54 0.1 0.00001 0.00000100 0.00000350 3.5 4.54
1.88 0.5 0.00001 0.00000500 0.00000850 8.5 1.88

82
Sample 47
pH [HCl] HCL (L) HCl Added (mol)HCl Cumulative (mol)Micromoles (cumulative)pH
8.44 0.00000000 0 8.44
7.2 0.025 0.00001 0.00000025 0.00000025 0.25 7.2
6.48 0.025 0.00001 0.00000025 0.00000050 0.5 6.48
5.32 0.025 0.00001 0.00000025 0.00000075 0.75 5.32
4.87 0.025 0.00001 0.00000025 0.00000100 1 4.87
3.62 0.05 0.00001 0.0000005 0.00000150 1.5 3.62
2.49 0.1 0.00001 0.000001 0.00000250 2.5 2.49
Sample 48
pH [HCl] HCL (L) HCl Added (mol)HCl Cumulative (mol)Micromoles (cumulative)pH
9.01 0.00000000 0 9.01
7.95 0.025 0.00001 0.00000025 0.00000025 0.25 7.95
7.66 0.025 0.00001 0.00000025 0.00000050 0.5 7.66
7.37 0.025 0.00001 0.00000025 0.00000075 0.75 7.37
7.1 0.025 0.00001 0.00000025 0.00000100 1 7.1
7.03 0.025 0.00001 0.00000025 0.00000125 1.25 7.03
6.7 0.025 0.00001 0.00000025 0.00000150 1.5 6.7
5.52 0.05 0.00001 0.0000005 0.00000200 2 5.52
3.5 0.1 0.00001 0.000001 0.00000300 3 3.5
Sample 49
pH [HCl] HCL (L) HCl Added (mol)HCl Cumulative (mol)Micromoles (cumulative)pH
8.81 0.00000000 0 8.81
7.41 0.025 0.00001 0.00000025 0.00000025 0.25 7.41
6.73 0.025 0.00001 0.00000025 0.00000050 0.5 6.73
5.76 0.025 0.00001 0.00000025 0.00000075 0.75 5.76
5.14 0.025 0.00001 0.00000025 0.00000100 1 5.14
3.99 0.05 0.00001 0.0000005 0.00000150 1.5 3.99
2.66 0.1 0.00001 0.000001 0.00000250 2.5 2.66

83
Sample 50
pH [HCl] HCL (L) HCl Added (mol)HCl Cumulative (mol)Micromoles (cumulative)pH
8.36 0.00000000 0 8.36
7.13 0.025 0.00001 0.00000025 0.00000025 0.25 7.13
6.19 0.025 0.00001 0.00000025 0.00000050 0.5 6.19
5.16 0.025 0.00001 0.00000025 0.00000075 0.75 5.16
4.39 0.025 0.00001 0.00000025 0.00000100 1 4.39
3.69 0.025 0.00001 0.00000025 0.00000125 1.25 3.69
2.44 0.1 0.00001 0.000001 0.00000225 2.25 2.44
Sample 51
pH [HCl] HCL (L) HCl Added (mol)HCl Cumulative (mol)Micromoles (cumulative)pH
9.15 0.00000000 0 9.15
7.58 0.05 0.00001 0.0000005 0.00000050 0.5 7.58
7.43 0.025 0.00001 0.00000025 0.00000075 0.75 7.43
7.25 0.025 0.00001 0.00000025 0.00000100 1 7.25
7.11 0.025 0.00001 0.00000025 0.00000125 1.25 7.11
7.01 0.025 0.00001 0.00000025 0.00000150 1.5 7.01
6.78 0.025 0.00001 0.00000025 0.00000175 1.75 6.78
6.11 0.05 0.00001 0.0000005 0.00000225 2.25 6.11
4.59 0.1 0.00001 0.000001 0.00000325 3.25 4.59
2.29 0.2 0.00001 0.000002 0.00000525 5.25 2.29
Sample 52
pH [HCl] HCL (L) HCl Added (mol)HCl Cumulative (mol)Micromoles (cumulative)pH
11.1 0.00000000 0 11.1
10.69 0.2 0.00001 0.000002 0.00000200 2 10.69
7.26 0.2 0.00001 0.000002 0.00000400 4 7.26
7.02 0.025 0.00001 0.00000025 0.00000425 4.25 7.02
6.97 0.025 0.00001 0.00000025 0.00000450 4.5 6.97
6.4 0.05 0.00001 0.0000005 0.00000500 5 6.4
4.75 0.2 0.00001 0.000002 0.00000700 7 4.75
1.8 0.5 0.00001 0.000005 0.00001200 12 1.8

84
Sample 53
pH [HCl] HCL (L) HCl Added (mol)HCl Cumulative (mol)Micromoles (cumulative)pH
10.35 0.00000000 0 10.35
9.18 0.05 0.00001 0.0000005 0.00000050 0.5 9.18
7.4 0.05 0.00001 0.0000005 0.00000100 1 7.4
7.21 0.025 0.00001 0.00000025 0.00000125 1.25 7.21
7.03 0.025 0.00001 0.00000025 0.00000150 1.5 7.03
6.83 0.025 0.00001 0.00000025 0.00000175 1.75 6.83
5.93 0.05 0.00001 0.0000005 0.00000225 2.25 5.93
4.35 0.1 0.00001 0.000001 0.00000325 3.25 4.35
1.71 0.5 0.00001 0.000005 0.00000825 8.25 1.71
Sample 54
pH [HCl] HCL (L) HCl Added (mol)HCl Cumulative (mol)Micromoles (cumulative)pH
11.65 0.00000000 0 11.65
11.57 0.5 0.00001 0.000005 0.00000500 5 11.57
11.2 1 0.00001 0.00001 0.00001500 15 11.2
10.34 0.5 0.00001 0.000005 0.00002000 20 10.34
8.43 0.2 0.00001 0.000002 0.00002200 22 8.43
8.06 0.1 0.00001 0.000001 0.00002300 23 8.06
7.96 0.05 0.00001 0.0000005 0.00002350 23.5 7.96
7.78 0.1 0.00001 0.000001 0.00002450 24.5 7.78
7.12 0.2 0.00001 0.000002 0.00002650 26.5 7.12
7.04 0.1 0.00001 0.000001 0.00002750 27.5 7.04
6.83 0.1 0.00001 0.000001 0.00002850 28.5 6.83
3.1 0.2 0.00001 0.000002 0.00003050 30.5 3.1
Sample 55
pH [HCl] HCL (L) HCl Added (mol)HCl Cumulative (mol)Micromoles (cumulative)pH
8.52 0.00000000 0 8.52
7.17 0.025 0.00001 0.00000025 0.00000025 0.25 7.17
6.11 0.025 0.00001 0.00000025 0.00000050 0.5 6.11
5.01 0.025 0.00001 0.00000025 0.00000075 0.75 5.01
4.15 0.025 0.00001 0.00000025 0.00000100 1 4.15
3.08 0.05 0.00001 0.0000005 0.00000150 1.5 3.08
2.35 0.1 0.00001 0.000001 0.00000250 2.5 2.35

85
Sample 56
pH [HCl] HCL (L) HCl Added (mol)HCl Cumulative (mol)Micromoles (cumulative)pH
9.67 0.00000000 0 9.67
7.55 0.05 0.00001 0.0000005 0.00000050 0.5 7.55
7.2 0.025 0.00001 0.00000025 0.00000075 0.75 7.2
6.93 0.025 0.00001 0.00000025 0.00000100 1 6.93
6.47 0.025 0.00001 0.00000025 0.00000125 1.25 6.47
5.51 0.05 0.00001 0.0000005 0.00000175 1.75 5.51
4.01 0.1 0.00001 0.000001 0.00000275 2.75 4.01
Sample 57
pH [HCl] HCL (L) HCl Added (mol)HCl Cumulative (mol)Micromoles (cumulative)pH
7.17 0.00000000 0 7.17
3.05 0.025 0.00001 0.00000025 0.00000025 0.25 3.05
2.46 0.025 0.00001 0.00000025 0.00000050 0.5 2.46
2.34 0.025 0.00001 0.00000025 0.00000075 0.75 2.34
2.24 0.05 0.00001 0.0000005 0.00000125 1.25 2.24
2 0.1 0.00001 0.000001 0.00000225 2.25 2
1.71 0.2 0.00001 0.000002 0.00000425 4.25 1.71
Sample 58
pH [HCl] HCL (L) HCl Added (mol)HCl Cumulative (mol)Micromoles (cumulative)pH
9.47 0.00000000 0 9.47
8.13 0.05 0.00001 0.0000005 0.00000050 0.5 8.13
7.86 0.025 0.00001 0.00000025 0.00000075 0.75 7.86
7.58 0.05 0.00001 0.0000005 0.00000125 1.25 7.58
7.29 0.05 0.00001 0.0000005 0.00000175 1.75 7.29
7.11 0.05 0.00001 0.0000005 0.00000225 2.25 7.11
6.98 0.05 0.00001 0.0000005 0.00000275 2.75 6.98
6.52 0.05 0.00001 0.0000005 0.00000325 3.25 6.52
5.67 0.1 0.00001 0.000001 0.00000425 4.25 5.67
2.02 0.5 0.00001 0.000005 0.00000925 9.25 2.02

86
Appendix IV.
Titration graphs and linear regression graphs for samples.
0
1
2
3
4
5
6
7
8
9
10
0 1 2 3 4 5
pH
Micromoles of HCL (cumulative)
#1 Titration of Ca(OH)2with HCL
y = -0.605x + 8.09676.2
6.4
6.6
6.8
7
7.2
7.4
7.6
0 0.5 1 1.5 2 2.5 3 3.5
pH
Micromoles of HCL (cumulative)
#1 Regression

87
0
2
4
6
8
10
12
0 5 10 15 20 25
pH
Micro moles of HCL (cumulative)
#3 Titration of Ca(OH)2with HCL
y = -0.3202x + 11.076.6
6.8
7
7.2
7.4
7.6
7.8
8
10 11 12 13 14
pH
Micromoles of HCL (cumulative)
#3 Regression
0
5
10
15
0 10 20 30 40
pH
Micromoles of HCL (cumulative)
#4Titration of Ca(OH)2with HCL

88
y = -0.255x + 14.8156.8
7
7.2
7.4
7.6
7.8
8
8.2
26 27 28 29 30 31 32
pH
Micromoles of HCL (cumulative)
#4 Regression
0
2
4
6
8
10
12
0 5 10 15 20
pH
Micromoles of HCL (cumulative)
#5 Titration of Ca(OH)2with HCL
y = -1.462x + 10.63
0
2
4
6
8
10
12
0 1 2 3 4 5 6
pH
Micromoles of HCL (cumulative)
#5 Regression

89
0
5
10
15
0 10 20 30 40
pH
Micromoles of HCL (cumulative)
#6 Titration of Ca(OH)2with HCL
y = -0.455x + 18.805
5
5.5
6
6.5
7
7.5
8
24.5 25 25.5 26 26.5 27 27.5 28 28.5
pH
Micromoles of HCL (cumulative)
#6 Regression
0
2
4
6
8
10
0 2 4 6 8 10 12
pH
Micromoles of HCL (cumulative)
#7 Titration of Ca(OH)2with HCL

90
y = -2.02x + 8.425
6.2
6.4
6.6
6.8
7
7.2
7.4
7.6
0.4 0.5 0.6 0.7 0.8 0.9 1 1.1
pH
Micromoles of HCL (cumulative)
#7 Regression
0
5
10
15
0 2 4 6 8
pH
Micromoles of HCL (cumulative)
#8 Titration of Ca(OH)2with HCL
y = -1x + 8.5667
6
6.1
6.2
6.3
6.4
6.5
6.6
1.7 1.9 2.1 2.3 2.5 2.7
pH
Micromoles of HCL (cumulative)
#8 Regression

91
0
2
4
6
8
10
12
0 5 10 15 20
pH
Micromoles of HCL (cumulative)
#9 Titration of Ca(OH)2with HCL
y = -0.5356x + 11.0356.56.66.76.86.9
77.17.27.37.4
6.5 7 7.5 8 8.5
pH
Micromoles of HCL (cumulative)
#9 Regression
0
2
4
6
8
10
12
0 2 4 6 8 10 12
pH
Micromoles of HCL (cumulative)
#12 Titration of Ca(OH)2with HCL

92
y = -0.456x + 8.942
6.95
7
7.05
7.1
7.15
7.2
7.25
7.3
7.35
7.4
3.2 3.4 3.6 3.8 4 4.2 4.4
pH
Micromoles of HCL (cumulative)
#12 Regression
0
5
10
15
0 5 10 15 20 25
pH
µmoles of HCL (cumulative)
#13 Titration of Ca(OH)2with HCL
y = -0.2783x + 11.4346.8
7
7.2
7.4
7.6
7.8
13.5 14 14.5 15 15.5 16 16.5
pH
Micromoles of HCL (cumulative)
#13 Regression

93
0
2
4
6
8
10
12
0 5 10 15
pH
Micromoles of HCL (cumulative)
#16 Titration of Ca(OH)2with HCL
y = -0.4487x + 9.07836.4
6.6
6.8
7
7.2
7.4
3.5 4 4.5 5 5.5 6
pH
Micromoles of HCL (cumulative)
#16 Regression
0
2
4
6
8
10
0 1 2 3 4 5
pH
Micromoles of HCL (cumulative)
#17 Titration of Ca(OH)2with HCL

94
y = -4.32x + 8.1933
0
2
4
6
8
10
0 0.1 0.2 0.3 0.4 0.5 0.6
pH
Micromoles of HCL (cumulative)
#17 Regression
0
2
4
6
8
10
12
0 1 2 3 4 5 6
pH
Micromoles of HCL (cumulative)
#18 Titration of Ca(OH)2with HCL
y = -0.508x + 8.259
6.76.86.9
77.17.27.37.47.5
1.5 1.7 1.9 2.1 2.3 2.5 2.7 2.9
pH
Micromoles of HCL (cumulative)
#18 Regression

95
0
2
4
6
8
10
12
0 1 2 3 4 5 6 7
pH
µmoles of HCL (cumulative)
#19 Titration of Ca(OH)2with HCL
y = -0.51x + 8.576.76.86.9
77.17.27.37.4
2.4 2.6 2.8 3 3.2 3.4 3.6
pH
Micromoles of HCL (cumulative)
#19 Regression
0
2
4
6
8
10
0 1 2 3 4
pH
Micromoles of HCL (cumulative)
#20 Titration of Ca(OH)2with HCL

96
y = -2.04x + 7.7933
66.26.46.66.8
77.27.4
0.2 0.3 0.4 0.5 0.6 0.7 0.8
pH
Micromoles of HCL (cumulative)
#20 Regression
02468
10
0 1 2 3 4
pH
Micromoles of HCL (cumulative)
#21 Titration of Ca(OH)2with HCL
y = -2.36x + 7.89
6.6
6.7
6.8
6.9
7
7.1
7.2
7.3
7.4
0.2 0.25 0.3 0.35 0.4 0.45 0.5 0.55
pH
Micromoles of HCL (cumulative)
#21 Regression

97
0
5
10
0 1 2 3 4
pH
Micromoles of HCL (cumulative)
#22 Titration of Ca(OH)2with HCL
y = -1.7x + 8.0917
6.2
6.4
6.6
6.8
7
7.2
7.4
0.4 0.5 0.6 0.7 0.8 0.9 1 1.1
pH
Micromoles of HCL (cumulative)
#22 Regression
0
5
10
0 1 2 3 4 5
pH
Micromoles of HCL (cumulative)
#23Titration of Ca(OH)2with HCL
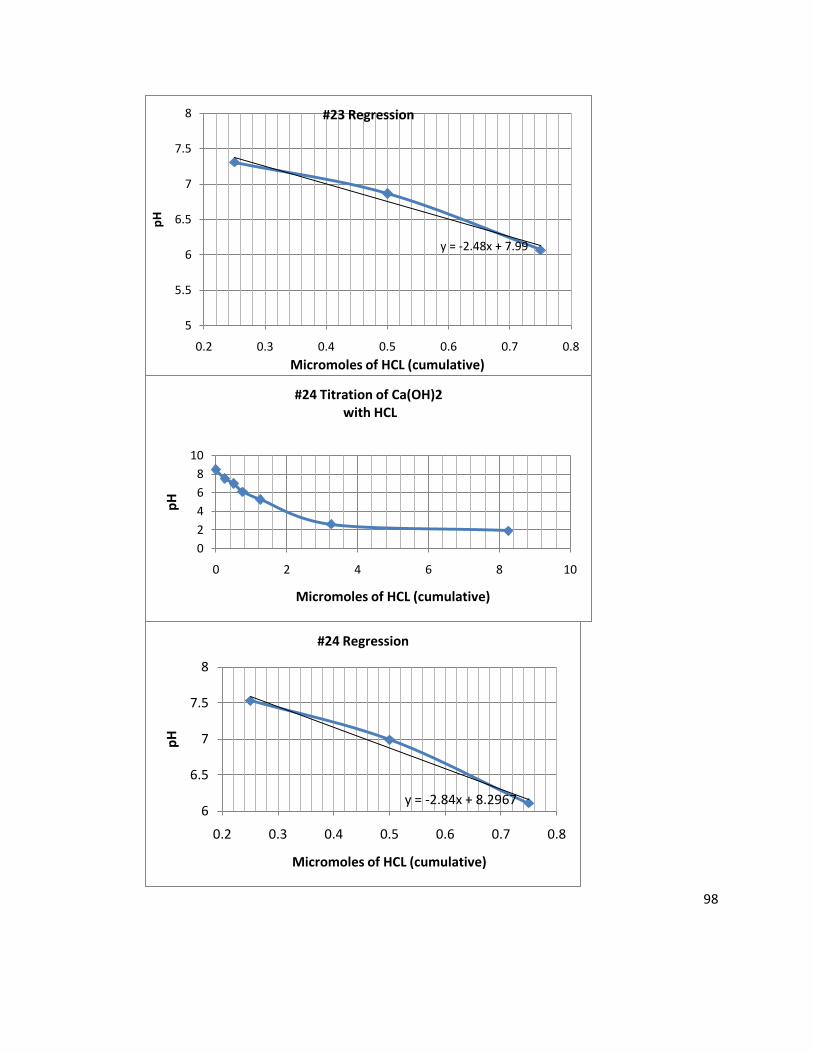
98
y = -2.48x + 7.99
5
5.5
6
6.5
7
7.5
8
0.2 0.3 0.4 0.5 0.6 0.7 0.8
pH
Micromoles of HCL (cumulative)
#23 Regression
0
2
4
6
8
10
0 2 4 6 8 10
pH
Micromoles of HCL (cumulative)
#24 Titration of Ca(OH)2with HCL
y = -2.84x + 8.29676
6.5
7
7.5
8
0.2 0.3 0.4 0.5 0.6 0.7 0.8
pH
Micromoles of HCL (cumulative)
#24 Regression

99
0
2
4
6
8
10
12
14
0 5 10 15 20 25
pH
Micromoles of HCL (cumulative)
#25 Titration of Ca(OH)2with HCL
y = -0.406x + 13.5546.76.86.9
77.17.27.37.47.5
15 15.5 16 16.5 17
pH
Micromoles of HCL (cumulative)
#25 Regression
0
2
4
6
8
10
0 2 4 6 8
pH
Micromoles of HCL (cumulative)
#26Titration of Ca(OH)2with HCL

100
y = -6.2x + 8.4233
0
1
2
3
4
5
6
7
8
9
0 0.1 0.2 0.3 0.4 0.5 0.6
pH
Micromoles of HCL (cumulative)
#26 Regression
0
2
4
6
8
0 1 2 3 4 5
pH
Micromoles of HCL (cumulative)
#28 Titration of Ca(OH)2with HCL
y = -6.3x + 5.8183
0
1
2
3
4
5
6
7
0 0.1 0.2 0.3 0.4 0.5 0.6
pH
Micromoles of HCL (cumulative)
#28 Regression

101
0
5
10
0 0.5 1 1.5 2 2.5 3 3.5
pH
Micromoles of HCL (cumulative)
#29 Titration of Ca(OH)2with HCL
y = -0.624x + 7.597
6.5
6.6
6.7
6.8
6.9
7
7.1
7.2
0.6 0.8 1 1.2 1.4 1.6
pH
Micromoles of HCL (cumulative)
#29 Regression
02468
1012
0 2 4 6 8 10
pH
Micromoles of HCL (cumulative)
#30Titration of Ca(OH)2with HCL

102
y = -0.398x + 9.3676.9
7
7.1
7.2
7.3
7.4
7.5
7.6
7.7
4.5 5 5.5 6 6.5
pH
Micromoles of HCL (cumulative)
#30 Regression
0
2
4
6
8
0 2 4 6 8 10
pH
Micromoles of HCL (cumulative)
#31Titration of Ca(OH)2with HCL
y = -15.96x + 6.97
0
1
2
3
4
5
6
7
8
0 0.05 0.1 0.15 0.2 0.25 0.3
pH
Micromoles of HCL (cumulative)
#31 Regression

103
0
5
10
0 1 2 3 4 5 6 7
pH
Micromoles of HCL (cumulative)
#32Titration of Ca(OH)2with HCL
y = -0.4432x + 7.93176.6
6.8
7
7.2
7.4
7.6
0.7 1.2 1.7 2.2 2.7 3.2
pH
Micromoles of HCL (cumulative)
#32 Regression
0
2
4
6
8
10
0 2 4 6 8 10
pH
Micromoles of HCL (cumulative)
#33Titration of Ca(OH)2with HCL

104
y = -3x + 7.94
5
5.5
6
6.5
7
7.5
0.2 0.3 0.4 0.5 0.6 0.7 0.8
pH
Micromoles of HCL (cumulative)
#33 Regression
0
2
4
6
8
10
0 1 2 3 4 5
pH
Micromoles of HCL (cumulative)
#34 Titration of Ca(OH)2with HCL
y = -2.16x + 8.11676.4
6.6
6.8
7
7.2
7.4
7.6
7.8
0.2 0.3 0.4 0.5 0.6 0.7 0.8
pH
Micromoles of HCL (cumulative)
#34 Regression

105
0
2
4
6
8
10
12
0 5 10 15 20
pH
Micromoles of HCL (cumulative)
#35Titration of Ca(OH)2with HCL
y = -0.6114x + 13.589
6.8
6.9
7
7.1
7.2
7.3
7.4
10.2 10.4 10.6 10.8 11 11.2
pH
Micromoles of HCL (cumulative)
#35 Regression
0
2
4
6
8
10
0 1 2 3 4
pH
Micromoles of HCL (cumulative)
#36 Titration of Ca(OH)2with HCL

106
y = -0.78x + 7.7967
6.7
6.8
6.9
7
7.1
7.2
7.3
0.7 0.8 0.9 1 1.1 1.2 1.3
pH
Micromoles of HCL (cumulative)
#36 Regression
0
2
4
6
8
10
0 1 2 3 4 5 6
pH
Micromoles of HCL (cumulative)
#37 Titration of Ca(OH)2with HCL
y = -0.3726x + 7.9797
6.7
6.8
6.9
7
7.1
7.2
7.3
1.8 2 2.2 2.4 2.6 2.8 3 3.2
pH
Micromoles of HCL (cumulative)
#37 Regression

107
0
2
4
6
8
10
0 1 2 3 4 5
pH
Micromoles of HCL (cumulative)
#39 Titration of Ca(OH)2with HCL
y = -1.1669x + 8.1814
6.2
6.4
6.6
6.8
7
7.2
7.4
7.6
7.8
0.4 0.6 0.8 1 1.2 1.4 1.6
pH
Micromoles of HCL (cumulative)
#39 Regression
0
2
4
6
8
10
0 1 2 3 4 5 6
pH
Micromoles of HCL (cumulative)
#40 Titration of Ca(OH)2with HCL

108
y = -1.76x + 8.776.5
6.6
6.7
6.8
6.9
7
7.1
0.95 1 1.05 1.1 1.15 1.2 1.25 1.3
pH
Micromoles of HCL (cumulative)
#40 Regression
0
2
4
6
8
10
12
14
0 50 100 150 200 250
pH
Micromoles of HCL (cumulative)
#41Titration of Ca(OH)2with HCL
y = -0.096x + 22.7596.6
6.8
7
7.2
7.4
7.6
7.8
156 158 160 162 164 166 168
pH
Micromoles of HCL (cumulative)
#41 Regression

109
0
2
4
6
8
10
0 1 2 3 4 5
pH
Micromoles of HCL (cumulative)
#42 Titration of Ca(OH)2with HCL
y = -0.51x + 8.3425
6.6
6.7
6.8
6.9
7
7.1
7.2
7.3
7.4
7.5
1.5 2 2.5 3 3.5
pH
Micromoles of HCL (cumulative)
#42 Regression
0
2
4
6
8
0 0.5 1 1.5 2
pH
Micromoles of HCL (cumulative)
#43Titration of Ca(OH)2with HCL

110
y = -4.04x + 8.09675
5.5
6
6.5
7
7.5
0.2 0.3 0.4 0.5 0.6 0.7 0.8
pH
Micromoles of HCL (cumulative)
#43 Regression
0
2
4
6
8
10
12
0 5 10 15 20 25
pH
Micromoles of HCL (cumulative)
#44Titration of Ca(OH)2with HCL
y = -0.32x + 11.816.8
6.85
6.9
6.95
7
7.05
7.1
7.15
7.2
14.4 14.6 14.8 15 15.2 15.4 15.6
pH
Micromoles of HCL (cumulative)
#44 Regression

111
0
2
4
6
8
0 1 2 3 4 5 6
pH
Micromoles of HCL (cumulative)
#45Titration of Ca(OH)2with HCL
y = -0.6943x + 7.95
6.8
6.9
7
7.1
7.2
7.3
7.4
7.5
0.6 0.8 1 1.2 1.4 1.6
pH
Micromoles of HCL (cumulative)
#45 Regression
0
2
4
6
8
10
12
0 2 4 6 8 10
pH
Micromoles of HCL (cumulative)
#46 Titration of Ca(OH)2
with HCL

112
y = -0.933x + 8.6114
6
6.2
6.4
6.6
6.8
7
7.2
7.4
7.6
1 1.5 2 2.5 3
pH
Micromoles of HCL (cumulative)
#46 Regression
0
2
4
6
8
10
0 0.5 1 1.5 2 2.5 3
pH
Micromoles of HCL (cumulative)
#47 Titration of Ca(OH)2
with HCL
y = -2.88x + 7.926.46.56.66.76.86.9
77.17.27.3
0.2 0.25 0.3 0.35 0.4 0.45 0.5 0.55
pH
Micromoles of HCL (cumulative)
#47 Regression
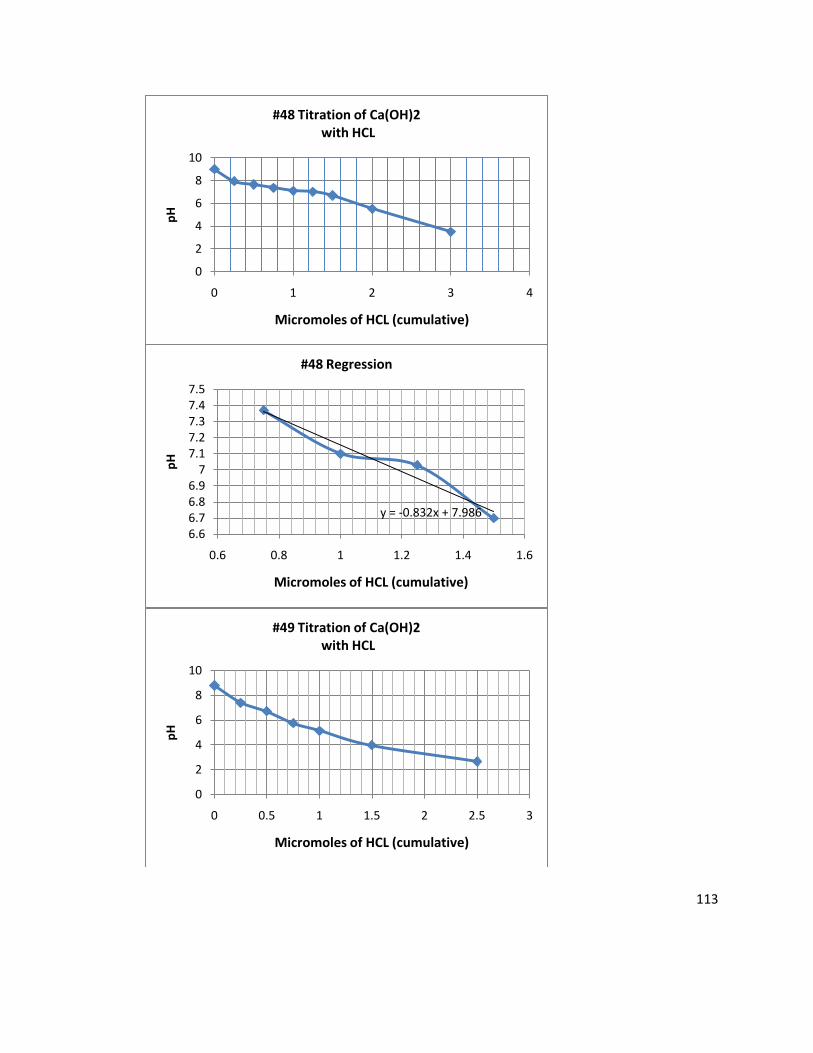
113
0
2
4
6
8
10
0 1 2 3 4
pH
Micromoles of HCL (cumulative)
#48 Titration of Ca(OH)2with HCL
y = -0.832x + 7.986
6.66.76.86.9
77.17.27.37.47.5
0.6 0.8 1 1.2 1.4 1.6
pH
Micromoles of HCL (cumulative)
#48 Regression
0
2
4
6
8
10
0 0.5 1 1.5 2 2.5 3
pH
Micromoles of HCL (cumulative)
#49 Titration of Ca(OH)2with HCL

114
y = -2.72x + 8.096.6
6.8
7
7.2
7.4
7.6
0.2 0.3 0.4 0.5 0.6
pH
Micromoles of HCL (cumulative)
#49 Regression
0
5
10
0 0.5 1 1.5 2 2.5
pH
Micromoles of HCL (cumulative)
#50 Titration of Ca(OH)2with HCL
y = -3.76x + 8.076
6.26.46.66.8
77.2
0.2 0.3 0.4 0.5 0.6
pH
Micromoles of HCL (cumulative)
#50 Regression

115
0
2
4
6
8
10
0 1 2 3 4 5 6
pH
Micromoles of HCL (cumulative)
#51 Titration of Ca(OH)2with HCL
y = -0.66x + 7.9567
6.7
6.8
6.9
7
7.1
7.2
1.1 1.3 1.5 1.7 1.9
pH
Micromoles of HCL (cumulative)
#51 Regression
0
2
4
6
8
10
12
0 5 10 15
pH
Micromoles of HCL (cumulative)
#52 Titration of Ca(OH)2with HCL

116
y = -0.8354x + 10.62
6.2
6.4
6.6
6.8
7
7.2
7.4
3.9 4.1 4.3 4.5 4.7 4.9 5.1
pH
Micromoles of HCL (cumulative)
#52 Regression
0
2
4
6
8
10
12
0 2 4 6 8 10
pH
Micromoles of HCL (cumulative)
#53 Titration of Ca(OH)2with HCL
y = -0.756x + 8.1576.8
6.9
7
7.1
7.2
7.3
7.4
7.5
0.8 1 1.2 1.4 1.6 1.8
pH
Micromoles of HCL (cumulative)
#53 Regression

117
0
2
4
6
8
10
12
14
0 5 10 15 20 25 30 35
pH
Micromoles of HCL (cumulative)
#54 Titration of Ca(OH)2with HCL
y = -0.2346x + 13.467
6.6
6.8
7
7.2
7.4
7.6
7.8
8
24 25 26 27 28 29
pH
Micromoles of HCL (cumulative)
#54 Regression
0
2
4
6
8
10
0 0.5 1 1.5 2 2.5 3
pH
Micromoles of HCL (cumulative)
#55 Titration of Ca(OH)2with HCL

118
y = -4.24x + 8.236
6.2
6.4
6.6
6.8
7
7.2
7.4
0.2 0.25 0.3 0.35 0.4 0.45 0.5 0.55
pH
Micromoles of HCL (cumulative)
#55 Regression
0
2
4
6
8
10
12
0 0.5 1 1.5 2 2.5 3
pH
Micromoles of HCL (cumulative)
#56 Titration of Ca(OH)2with HCL
y = -1.404x + 8.2666.4
6.6
6.8
7
7.2
7.4
7.6
7.8
0.4 0.6 0.8 1 1.2 1.4
pH
Micromoles of HCL (cumulative)
#56 Regression

119
0
1
2
3
4
5
6
7
8
0 1 2 3 4 5
pH
Micromoles of HCL (cumulative)
#57 Titration of Ca(OH)2with HCL
y = -16.48x + 7.17
0
2
4
6
8
0 0.05 0.1 0.15 0.2 0.25 0.3
pH
Micromoles of HCL (cumulative)
#57 Regression
0
2
4
6
8
10
0 2 4 6 8 10
pH
Micromoles of HCL (cumulative)
#58 Titration of Ca(OH)2
with HCL
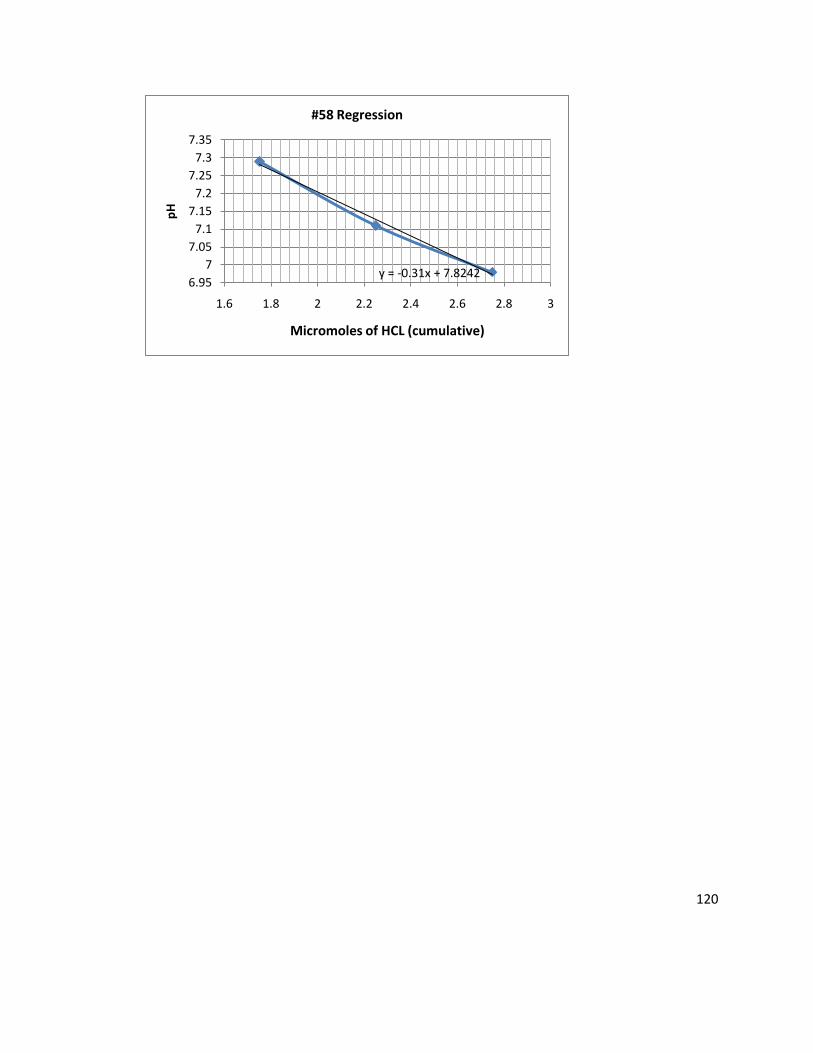
120
y = -0.31x + 7.82426.95
7
7.05
7.1
7.15
7.2
7.25
7.3
7.35
1.6 1.8 2 2.2 2.4 2.6 2.8 3
pH
Micromoles of HCL (cumulative)
#58 Regression

121
Appendix V.
Titration data for Standards. Columns from left to right: pH readings, concentration of HCL added, volume of HCL added, moles of HCL added, cumulative moles of HCL added,
cumulative micromoles of HCL added, and pH (listed again).
Standard A1
pH [HCl] HCl (L) HCl Added (mol)HCl Cumulative (mol)Micromoles (cumulative)pH
8.89 0 0 8.89
7.55 0.025 0.00001 0.00000025 0.00000025 0.25 7.55
6.78 0.025 0.00001 0.00000025 0.0000005 0.5 6.78
6.45 0.025 0.00001 0.00000025 0.00000075 0.75 6.45
5.41 0.025 0.00001 0.00000025 0.000001 1 5.41
4.84 0.05 0.00001 0.0000005 0.0000015 1.5 4.84
Standard A2
pH [HCl] HCl (L) HCl Added (mol)HCl Cumulative (mol)Micromoles (cumulative)pH
10.1 0 0 10.1
8.37 0.025 0.00001 0.00000025 0.00000025 0.25 8.37
7.38 0.025 0.00001 0.00000025 0.0000005 0.5 7.38
6.88 0.025 0.00001 0.00000025 0.00000075 0.75 6.88
6.51 0.025 0.00001 0.00000025 0.000001 1 6.51
5.98 0.05 0.00001 0.0000005 0.0000015 1.5 5.98
5.58 0.05 0.00001 0.0000005 0.000002 2 5.58
4.98 0.05 0.00001 0.0000005 0.0000025 2.5 4.98
Standard A3
pH [HCl] HCl (L) HCl Added (mol)HCl Cumulative (mol)Micromoles (cumulative)pH
8.84 0 0 8.84
7.45 0.025 0.00001 0.00000025 0.00000025 0.25 7.45
6.8 0.025 0.00001 0.00000025 0.0000005 0.5 6.8
5.93 0.025 0.00001 0.00000025 0.00000075 0.75 5.93
5.35 0.025 0.00001 0.00000025 0.000001 1 5.35
4.64 0.05 0.00001 0.0000005 0.0000015 1.5 4.64
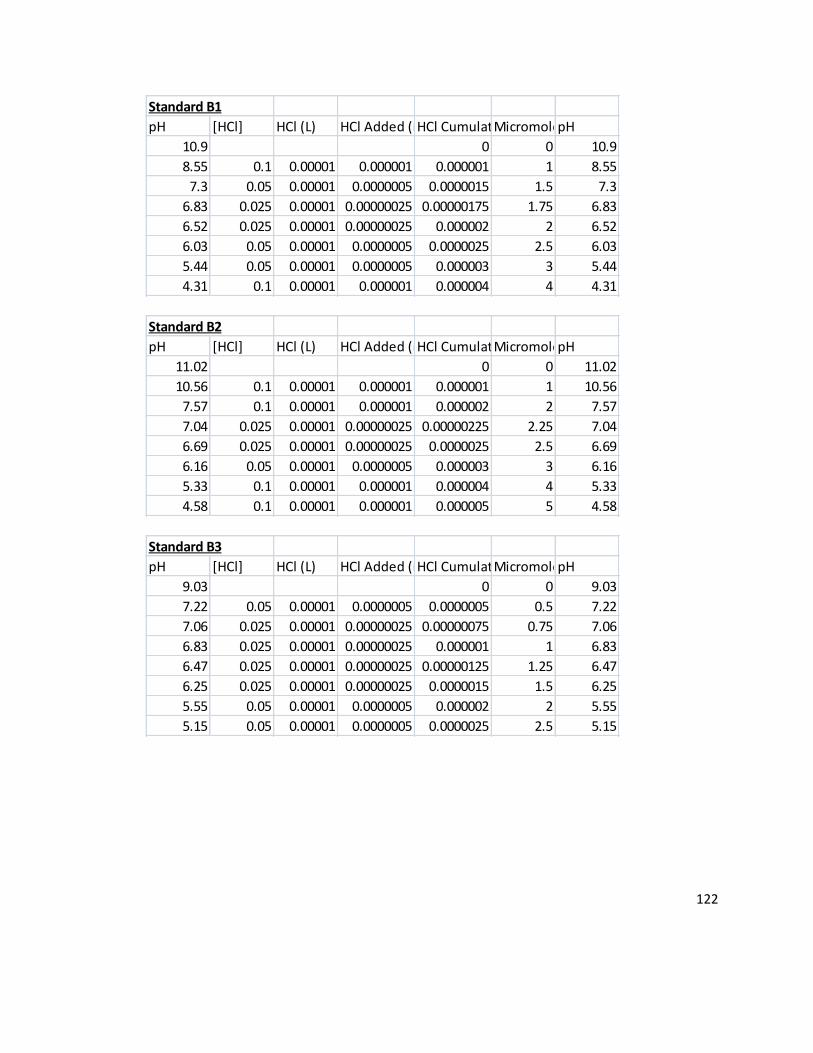
122
Standard B1
pH [HCl] HCl (L) HCl Added (mol)HCl Cumulative (mol)Micromoles (cumulative)pH
10.9 0 0 10.9
8.55 0.1 0.00001 0.000001 0.000001 1 8.55
7.3 0.05 0.00001 0.0000005 0.0000015 1.5 7.3
6.83 0.025 0.00001 0.00000025 0.00000175 1.75 6.83
6.52 0.025 0.00001 0.00000025 0.000002 2 6.52
6.03 0.05 0.00001 0.0000005 0.0000025 2.5 6.03
5.44 0.05 0.00001 0.0000005 0.000003 3 5.44
4.31 0.1 0.00001 0.000001 0.000004 4 4.31
Standard B2
pH [HCl] HCl (L) HCl Added (mol)HCl Cumulative (mol)Micromoles (cumulative)pH
11.02 0 0 11.02
10.56 0.1 0.00001 0.000001 0.000001 1 10.56
7.57 0.1 0.00001 0.000001 0.000002 2 7.57
7.04 0.025 0.00001 0.00000025 0.00000225 2.25 7.04
6.69 0.025 0.00001 0.00000025 0.0000025 2.5 6.69
6.16 0.05 0.00001 0.0000005 0.000003 3 6.16
5.33 0.1 0.00001 0.000001 0.000004 4 5.33
4.58 0.1 0.00001 0.000001 0.000005 5 4.58
Standard B3
pH [HCl] HCl (L) HCl Added (mol)HCl Cumulative (mol)Micromoles (cumulative)pH
9.03 0 0 9.03
7.22 0.05 0.00001 0.0000005 0.0000005 0.5 7.22
7.06 0.025 0.00001 0.00000025 0.00000075 0.75 7.06
6.83 0.025 0.00001 0.00000025 0.000001 1 6.83
6.47 0.025 0.00001 0.00000025 0.00000125 1.25 6.47
6.25 0.025 0.00001 0.00000025 0.0000015 1.5 6.25
5.55 0.05 0.00001 0.0000005 0.000002 2 5.55
5.15 0.05 0.00001 0.0000005 0.0000025 2.5 5.15

123
Standard C1
pH [HCl] HCl (L) HCl Added (mol)HCl Cumulative (mol)Micromoles (cumulative)pH
11.67 0 0 11.67
9.96 0.5 0.00001 0.000005 0.000005 5 9.96
7.84 0.1 0.00001 0.000001 0.000006 6 7.84
7.45 0.025 0.00001 0.00000025 0.00000625 6.25 7.45
7.2 0.025 0.00001 0.00000025 0.0000065 6.5 7.2
7.1 0.025 0.00001 0.00000025 0.00000675 6.75 7.1
6.66 0.025 0.00001 0.00000025 0.000007 7 6.66
6.01 0.1 0.00001 0.000001 0.000008 8 6.01
5.11 0.1 0.00001 0.000001 0.000009 9 5.11
Standard C2
pH [HCl] HCl (L) HCl Added (mol)HCl Cumulative (mol)Micromoles (cumulative)pH
11.25 0 0 11.25
10.7 0.2 0.00001 0.000002 0.000002 2 10.7
6.92 0.2 0.00001 0.000002 0.000004 4 6.92
6.64 0.025 0.00001 0.00000025 0.00000425 4.25 6.64
6.17 0.05 0.00001 0.0000005 0.00000475 4.75 6.17
5.36 0.1 0.00001 0.000001 0.00000575 5.75 5.36
4.39 0.1 0.00001 0.000001 0.00000675 6.75 4.39
Standard C3
pH [HCl] HCl (L) HCl Added (mol)HCl Cumulative (mol)Micromoles (cumulative)pH
11.57 0 0 11.57
11.44 0.2 0.00001 0.000002 0.000002 2 11.44
10.5 0.2 0.00001 0.000002 0.000004 4 10.5
7.02 0.1 0.00001 0.000001 0.000005 5 7.02
6.46 0.025 0.00001 0.00000025 0.00000525 5.25 6.46
6.15 0.025 0.00001 0.00000025 0.0000055 5.5 6.15
5.45 0.05 0.00001 0.0000005 0.000006 6 5.45
4.52 0.1 0.00001 0.000001 0.000007 7 4.52

124
Standard D1
pH [HCl] HCl (L) HCl Added (mol)HCl Cumulative (mol)Micromoles (cumulative)pH
10.94 0 0 10.94
10.84 0.2 0.00001 0.000002 0.000002 2 10.84
10.74 0.2 0.00001 0.000002 0.000004 4 10.74
10.58 0.2 0.00001 0.000002 0.000006 6 10.58
10.03 0.2 0.00001 0.000002 0.000008 8 10.03
7.76 0.1 0.00001 0.000001 0.000009 9 7.76
7.02 0.05 0.00001 0.0000005 0.0000095 9.5 7.02
6.67 0.05 0.00001 0.0000005 0.00001 10 6.67
5.94 0.1 0.00001 0.000001 0.000011 11 5.94
5.53 0.1 0.00001 0.000001 0.000012 12 5.53
3.87 0.2 0.00001 0.000002 0.000014 14 3.87
Standard D2
pH [HCl] HCl (L) HCl Added (mol)HCl Cumulative (mol)Micromoles (cumulative)Micromoles (cumulative)
10.66 0 0 10.66
10.28 0.2 0.00001 0.000002 0.000002 2 10.28
6.06 0.2 0.00001 0.000002 0.000004 4 6.06
4.44 0.1 0.00001 0.000001 0.000005 5 4.44
3.45 0.1 0.00001 0.000001 0.000006 6 3.45
1.94 0.1 0.00001 0.000001 0.000007 7 1.94
Standard D3
pH [HCl] HCl (L) HCl Added (mol)HCl Cumulative (mol)Micromoles (cumulative)pH
10.72 0 0 10.72
10.67 0.2 0.00001 0.000002 0.000002 2 10.67
10.4 0.2 0.00001 0.000002 0.000004 4 10.4
9.4 0.1 0.00001 0.000001 0.000005 5 9.4
8.37 0.05 0.00001 0.0000005 0.0000055 5.5 8.37
7.43 0.05 0.00001 0.0000005 0.000006 6 7.43
6.91 0.05 0.00001 0.0000005 0.0000065 6.5 6.91
6.46 0.05 0.00001 0.0000005 0.000007 7 6.46
6.11 0.1 0.00001 0.000001 0.000008 8 6.11
5.7 0.1 0.00001 0.000001 0.000009 9 5.7

125
Standard E1
pH [HCl] HCl (L) HCl Added (mol)HCl Cumulative (mol)Micromoles (cumulative)pH
10.96 0 0 10.96
10.88 0.2 0.00001 0.000002 0.000002 2 10.88
10.85 0.2 0.00001 0.000002 0.000004 4 10.85
10.84 0.2 0.00001 0.000002 0.000006 6 10.84
10.65 0.2 0.00001 0.000002 0.000008 8 10.65
10.09 0.2 0.00001 0.000002 0.00001 10 10.09
8.51 0.1 0.00001 0.000001 0.000011 11 8.51
6.79 0.1 0.00001 0.000001 0.000012 12 6.79
5.95 0.1 0.00001 0.000001 0.000013 13 5.95
4.58 0.2 0.00001 0.000002 0.000015 15 4.58
Standard E2
pH [HCl] HCl (L) HCl Added (mol)HCl Cumulative (mol)Micromoles (cumulative)pH
11.05 0 0 11.05
10.92 0.5 0.00001 0.000005 0.000005 5 10.92
10.76 0.2 0.00001 0.000002 0.000007 7 10.76
10.67 0.2 0.00001 0.000002 0.000009 9 10.67
10.44 0.2 0.00001 0.000002 0.000011 11 10.44
8.42 0.2 0.00001 0.000002 0.000013 13 8.42
7.01 0.1 0.00001 0.000001 0.000014 14 7.01
6.62 0.05 0.00001 0.0000005 0.0000145 14.5 6.62
5.6 0.1 0.00001 0.000001 0.0000155 15.5 5.6
4.95 0.2 0.00001 0.000002 0.0000175 17.5 4.95
Standard E3
pH [HCl] HCl (L) HCl Added (mol)HCl Cumulative (mol)Micromoles (cumulative)pH
10.96 0 0 10.96
10.64 0.5 0.00001 0.000005 0.000005 5 10.64
10.29 0.2 0.00001 0.000002 0.000007 7 10.29
9.1 0.1 0.00001 0.000001 0.000008 8 9.1
7.71 0.05 0.00001 0.0000005 0.0000085 8.5 7.71
6.95 0.05 0.00001 0.0000005 0.000009 9 6.95
6.16 0.05 0.00001 0.0000005 0.0000095 9.5 6.16
5.46 0.1 0.00001 0.000001 0.0000105 10.5 5.46
4.33 0.2 0.00001 0.000002 0.0000125 12.5 4.33

126
Standard F1
pH [HCl] HCl (L) HCl Added (mol)HCl Cumulative (mol)Micromoles (cumulative)pH
11.06 0 0 11.06
11 0.05 0.00001 0.0000005 0.0000005 0.5 11
10.96 0.1 0.00001 0.000001 0.0000015 1.5 10.96
10.9 0.2 0.00001 0.000002 0.0000035 3.5 10.9
10.87 0.2 0.00001 0.000002 0.0000055 5.5 10.87
10.74 0.2 0.00001 0.000002 0.0000075 7.5 10.74
10.4 0.2 0.00001 0.000002 0.0000095 9.5 10.4
8.34 0.1 0.00001 0.000001 0.0000105 10.5 8.34
7.8 0.05 0.00001 0.0000005 0.000011 11 7.8
7.24 0.05 0.00001 0.0000005 0.0000115 11.5 7.24
6.84 0.05 0.00001 0.0000005 0.000012 12 6.84
6.32 0.1 0.00001 0.000001 0.000013 13 6.32
5.5 0.1 0.00001 0.000001 0.000014 14 5.5
4.42 0.2 0.00001 0.000002 0.000016 16 4.42
Standard F2
pH [HCl] HCl (L) HCl Added (mol)HCl Cumulative (mol)Micromoles (cumulative)pH
10.93 0 0 10.93
10.9 0.2 0.00001 0.000002 0.000002 2 10.9
10.85 0.2 0.00001 0.000002 0.000004 4 10.85
10.77 0.2 0.00001 0.000002 0.000006 6 10.77
10.63 0.2 0.00001 0.000002 0.000008 8 10.63
10.23 0.2 0.00001 0.000002 0.00001 10 10.23
9.41 0.1 0.00001 0.000001 0.000011 11 9.41
8 0.1 0.00001 0.000001 0.000012 12 8
7.25 0.05 0.00001 0.0000005 0.0000125 12.5 7.25
6.92 0.05 0.00001 0.0000005 0.000013 13 6.92
5.83 0.1 0.00001 0.000001 0.000014 14 5.83
4.97 0.2 0.00001 0.000002 0.000016 16 4.97

127
Standard F3
pH [HCl] HCl (L) HCl Added (mol)HCl Cumulative (mol)Micromoles (cumulative)pH
10.87 0 0 10.87
10.76 0.02 0.00001 0.0000002 0.0000002 0.2 10.76
10.52 0.2 0.00001 0.000002 0.0000022 2.2 10.52
9.35 0.2 0.00001 0.000002 0.0000042 4.2 9.35
7.22 0.1 0.00001 0.000001 0.0000052 5.2 7.22
6.4 0.05 0.00001 0.0000005 0.0000057 5.7 6.4
5.67 0.05 0.00001 0.0000005 0.0000062 6.2 5.67
5.03 0.1 0.00001 0.000001 0.0000072 7.2 5.03
4.25 0.2 0.00001 0.000002 0.0000092 9.2 4.25
Standard G1
pH [HCl] HCl (L) HCl Added (mol)HCl Cumulative (mol)Micromoles (cumulative)pH
11.52 0 0 11.52
11.5 0.2 0.00001 0.000002 0.000002 2 11.5
11.46 0.5 0.00001 0.000005 0.000007 7 11.46
10.55 0.5 0.00001 0.000005 0.000012 12 10.55
8.95 0.1 0.00001 0.000001 0.000013 13 8.95
7.81 0.1 0.00001 0.000001 0.000014 14 7.81
7.45 0.05 0.00001 0.0000005 0.0000145 14.5 7.45
7.17 0.05 0.00001 0.0000005 0.000015 15 7.17
6.98 0.05 0.00001 0.0000005 0.0000155 15.5 6.98
6.5 0.1 0.00001 0.000001 0.0000165 16.5 6.5
6 0.2 0.00001 0.000002 0.0000185 18.5 6
Standard G2
pH [HCl] HCl (L) HCl Added (mol)HCl Cumulative (mol)Micromoles (cumulative)pH
11.85 0 0 11.85
11.23 0.5 0.00001 0.000005 0.000005 5 11.23
5.23 0.5 0.00001 0.000005 0.00001 10 5.23
4.16 0.2 0.00001 0.000002 0.000012 12 4.16
3.24 0.2 0.00001 0.000002 0.000014 14 3.24
2.15 0.2 0.00001 0.000002 0.000016 16 2.15
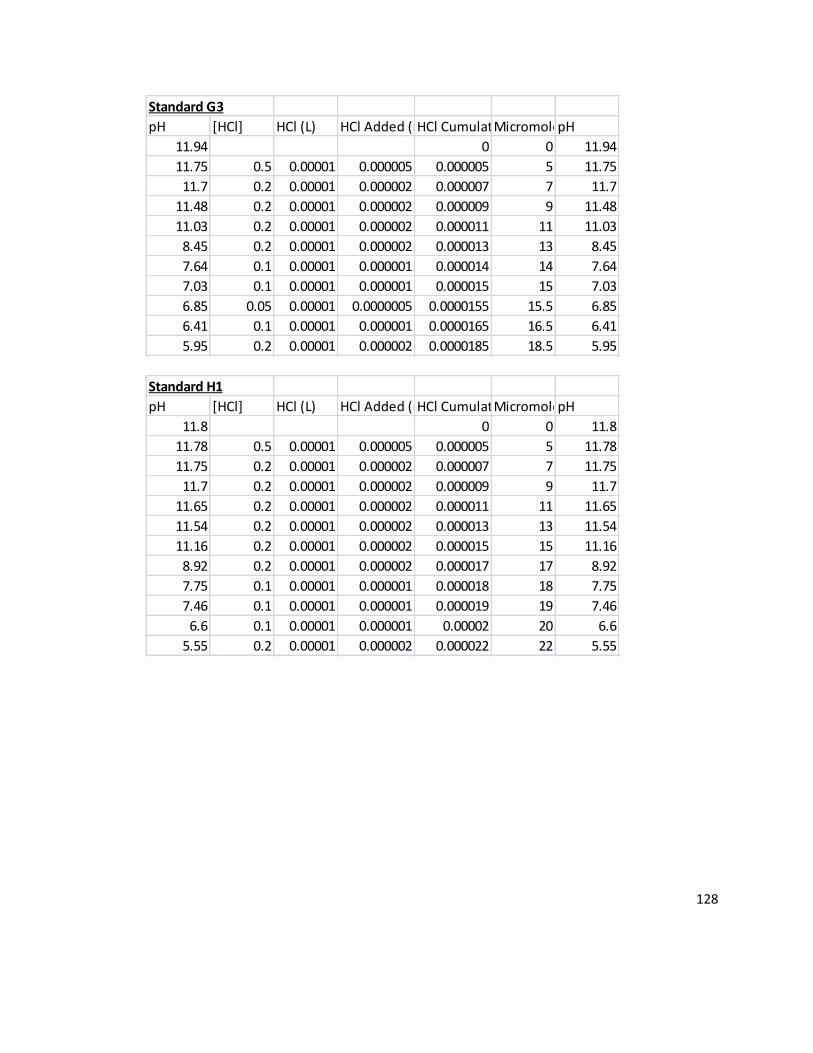
128
Standard G3
pH [HCl] HCl (L) HCl Added (mol)HCl Cumulative (mol)Micromoles (cumulative)pH
11.94 0 0 11.94
11.75 0.5 0.00001 0.000005 0.000005 5 11.75
11.7 0.2 0.00001 0.000002 0.000007 7 11.7
11.48 0.2 0.00001 0.000002 0.000009 9 11.48
11.03 0.2 0.00001 0.000002 0.000011 11 11.03
8.45 0.2 0.00001 0.000002 0.000013 13 8.45
7.64 0.1 0.00001 0.000001 0.000014 14 7.64
7.03 0.1 0.00001 0.000001 0.000015 15 7.03
6.85 0.05 0.00001 0.0000005 0.0000155 15.5 6.85
6.41 0.1 0.00001 0.000001 0.0000165 16.5 6.41
5.95 0.2 0.00001 0.000002 0.0000185 18.5 5.95
Standard H1
pH [HCl] HCl (L) HCl Added (mol)HCl Cumulative (mol)Micromoles (cumulative)pH
11.8 0 0 11.8
11.78 0.5 0.00001 0.000005 0.000005 5 11.78
11.75 0.2 0.00001 0.000002 0.000007 7 11.75
11.7 0.2 0.00001 0.000002 0.000009 9 11.7
11.65 0.2 0.00001 0.000002 0.000011 11 11.65
11.54 0.2 0.00001 0.000002 0.000013 13 11.54
11.16 0.2 0.00001 0.000002 0.000015 15 11.16
8.92 0.2 0.00001 0.000002 0.000017 17 8.92
7.75 0.1 0.00001 0.000001 0.000018 18 7.75
7.46 0.1 0.00001 0.000001 0.000019 19 7.46
6.6 0.1 0.00001 0.000001 0.00002 20 6.6
5.55 0.2 0.00001 0.000002 0.000022 22 5.55

129
Standard H2
pH [HCl] HCl (L) HCl Added (mol)HCl Cumulative (mol)Micromoles (cumulative)pH
11.75 0 0 11.75
11.54 0.5 0.00001 0.000005 0.000005 5 11.54
11.4 0.2 0.000002 0.000007 7 11.4
10.7 0.2 0.00001 0.000002 0.000009 9 10.7
9.18 0.2 0.00001 0.000002 0.000011 11 9.18
8.7 0.1 0.00001 0.000001 0.000012 12 8.7
8.12 0.1 0.00001 0.000001 0.000013 13 8.12
7.8 0.1 0.00001 0.000001 0.000014 14 7.8
7.5 0.1 0.00001 0.000001 0.000015 15 7.5
7.25 0.1 0.00001 0.000001 0.000016 16 7.25
7.01 0.1 0.00001 0.000001 0.000017 17 7.01
6.8 0.1 0.00001 0.000001 0.000018 18 6.8
6.4 0.2 0.00001 0.000002 0.00002 20 6.4
Standard H3
pH [HCl] HCl (L) HCl Added (mol)HCl Cumulative (mol)Micromoles (cumulative)pH
11.9 0 0 11.9
11.72 0.5 0.00001 0.000005 0.000005 5 11.72
11.12 0.5 0.00001 0.000005 0.00001 10 11.12
9.02 0.2 0.00001 0.000002 0.000012 12 9.02
7.56 0.1 0.00001 0.000001 0.000013 13 7.56
6.75 0.1 0.00001 0.000001 0.000014 14 6.75
6.11 0.1 0.00001 0.000001 0.000015 15 6.11
5.3 0.2 0.00001 0.000002 0.000017 17 5.3
Standard I1
pH [HCl] HCl (L) HCl Added (mol)HCl Cumulative (mol)Micromoles (cumulative)pH
10.88 0 0 10.88
10.66 0.2 0.00001 0.000002 0.000002 2 10.66
9.94 0.2 0.00001 0.000002 0.000004 4 9.94
6.5 0.2 0.00001 0.000002 0.000006 6 6.5
5.06 0.2 0.00001 0.000002 0.000008 8 5.06
4.18 0.2 0.00001 0.000002 0.00001 10 4.18

130
Standard I2
pH [HCl] HCl (L) HCl Added (mol)HCl Cumulative (mol)Micromoles (cumulative)pH
11.24 0 0 11.24
11.17 0.2 0.00001 0.000002 0.000002 2 11.17
11.16 0.2 0.00001 0.000002 0.000004 4 11.16
10.87 0.5 0.00001 0.000005 0.000009 9 10.87
10.57 0.2 0.00001 0.000002 0.000011 11 10.57
8.71 0.2 0.00001 0.000002 0.000013 13 8.71
7.4 0.2 0.00001 0.000002 0.000015 15 7.4
7.02 0.1 0.00001 0.000001 0.000016 16 7.02
6.99 0.05 0.00001 0.0000005 0.0000165 16.5 6.99
6.54 0.1 0.00001 0.000001 0.0000175 17.5 6.54
5.95 0.2 0.00001 0.000002 0.0000195 19.5 5.95
Standard I3
pH [HCl] HCl (L) HCl Added (mol)HCl Cumulative (mol)Micromoles (cumulative)pH
11.3 0 0 11.3
11.16 0.5 0.00001 0.000005 0.000005 5 11.16
10.97 0.5 0.00001 0.000005 0.00001 10 10.97
10.72 0.2 0.00001 0.000002 0.000012 12 10.72
10.3 0.2 0.00001 0.000002 0.000014 14 10.3
8 0.2 0.00001 0.000002 0.000016 16 8
7.28 0.1 0.00001 0.000001 0.000017 17 7.28
6.78 0.1 0.00001 0.000001 0.000018 18 6.78
6.46 0.1 0.00001 0.000001 0.000019 19 6.46
5.87 0.2 0.00001 0.000002 0.000021 21 5.87

131
Standard J1
pH [HCl] HCl (L) HCl Added (mol)HCl Cumulative (mol)Micromoles (cumulative)pH
11.38 0 0 11.38
11.25 0.5 0.00001 0.000005 0.000005 5 11.25
11.3 0.5 0.00001 0.000005 0.00001 10 11.3
11.05 0.5 0.00001 0.000005 0.000015 15 11.05
10.76 0.2 0.00001 0.000002 0.000017 17 10.76
10.45 0.2 0.00001 0.000002 0.000019 19 10.45
8.3 0.2 0.00001 0.000002 0.000021 21 8.3
7.5 0.1 0.00001 0.000001 0.000022 22 7.5
7.03 0.1 0.00001 0.000001 0.000023 23 7.03
6.6 0.1 0.00001 0.000001 0.000024 24 6.6
5.97 0.2 0.00001 0.000002 0.000026 26 5.97
Standard J2
pH [HCl] HCl (L) HCl Added (mol)HCl Cumulative (mol)Micromoles (cumulative)pH
11.59 0 0 11.59
11.54 0.5 0.00001 0.000005 0.000005 5 11.54
11.4 0.5 0.00001 0.000005 0.00001 10 11.4
11.1 0.5 0.00001 0.000005 0.000015 15 11.1
10.97 0.2 0.00001 0.000002 0.000017 17 10.97
10.7 0.2 0.00001 0.000002 0.000019 19 10.7
8.9 0.2 0.00001 0.000002 0.000021 21 8.9
7.9 0.1 0.00001 0.000001 0.000022 22 7.9
7.15 0.1 0.00001 0.000001 0.000023 23 7.15
6.89 0.1 0.00001 0.000001 0.000024 24 6.89
5.74 0.2 0.00001 0.000002 0.000026 26 5.74
Standard J3
pH [HCl] HCl (L) HCl Added (mol)HCl Cumulative (mol)Micromoles (cumulative)pH
11.55 0 0 11.55
11.38 0.5 0.00001 0.000005 0.000005 5 11.38
10.16 0.5 0.00001 0.000005 0.00001 10 10.16
7.53 0.2 0.00001 0.000002 0.000012 12 7.53
7.05 0.1 0.00001 0.000001 0.000013 13 7.05
6.85 0.05 0.00001 0.0000005 0.0000135 13.5 6.85
6.21 0.1 0.00001 0.000001 0.0000145 14.5 6.21
5.82 0.2 0.00001 0.000002 0.0000165 16.5 5.82

132
Appendix VI.
Titration graphs and linear regression graphs for the actual standard curve.
4
5
6
7
8
9
10
0 0.5 1 1.5 2
pH
Micromoles of HCL (cumulative)
Standard A1 Titration of Ca(OH)2with HCL
y = -2.2x + 8.0267
6.2
6.4
6.6
6.8
7
7.2
7.4
7.6
7.8
0.2 0.3 0.4 0.5 0.6 0.7 0.8
pH
Micromoles of HCL (cumulative)
A1 Regression
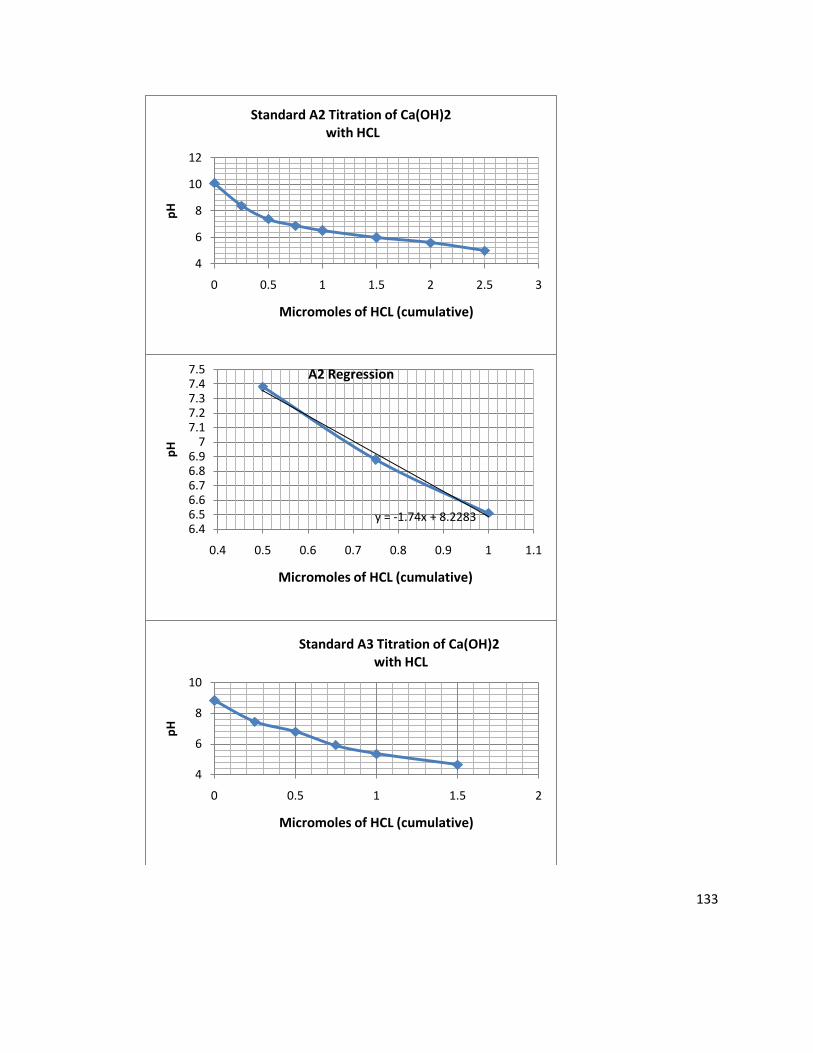
133
4
6
8
10
12
0 0.5 1 1.5 2 2.5 3
pH
Micromoles of HCL (cumulative)
Standard A2 Titration of Ca(OH)2with HCL
y = -1.74x + 8.22836.46.56.66.76.86.9
77.17.27.37.47.5
0.4 0.5 0.6 0.7 0.8 0.9 1 1.1
pH
Micromoles of HCL (cumulative)
A2 Regression
4
6
8
10
0 0.5 1 1.5 2
pH
Micromoles of HCL (cumulative)
Standard A3 Titration of Ca(OH)2with HCL

134
y = -3.04x + 8.2467
5.5
6
6.5
7
7.5
8
0.2 0.3 0.4 0.5 0.6 0.7 0.8
pH
Micromoles of HCL (cumulative)
A3 Regression
4
6
8
10
12
0 1 2 3 4 5
pH
Micromoles of HCL (cumulative)
Standard B1 Titration of Ca(OH)2with HCL
y = -1.56x + 9.61336.4
6.6
6.8
7
7.2
7.4
1.4 1.5 1.6 1.7 1.8 1.9 2 2.1
pH
Micromoles of HCL (cumulative)
B1 Regression

135
456789
101112
0 1 2 3 4 5 6
pH
Micromoles of HCL (cumulative)
Standard B2 Titration of Ca(OH)2with HCL
y = -1.76x + 11.066.6
6.8
7
7.2
7.4
7.6
7.8
1.9 2 2.1 2.2 2.3 2.4 2.5 2.6
pH
Micromoles of HCL (cumulative)
B2 Regression
5
6
7
8
9
10
0 0.5 1 1.5 2 2.5 3
pH
Micromoles of HCL (cumulative)
Standard B3 Titration of Ca(OH)2with HCL

136
y = -1.012x + 7.778
6
6.2
6.4
6.6
6.8
7
7.2
7.4
0.4 0.6 0.8 1 1.2 1.4 1.6
pH
Micromoles of HCL (cumulative)
B3 Regression
0
5
10
15
0 2 4 6 8 10
pH
Micromoles of HCL (cumulative)
Standard C1 Titration of Ca(OH)2with HCL
y = -0.8277x + 12.595
5.5
6
6.5
7
7.5
8
6 6.5 7 7.5 8 8.5
pH
Micromoles of HCL (cumulative)
C1 Regression

137
4
6
8
10
12
0 2 4 6 8
pH
Micromoles of HCL (cumulative)
Standard C2 Titration of Ca(OH)2with HCL
y = -1.7154x + 14.046
7
8
9
10
11
1.6 2.1 2.6 3.1 3.6 4.1 4.6 5.1
pH
Micromoles of HCL (cumulative)
C2 Regression
0
2
4
6
8
10
12
14
0 2 4 6 8
pH
Micromoles of HCL (cumulative)
Standard C3 Titration of Ca(OH)2with HCL

138
y = -1.74x + 15.6786
6.2
6.4
6.6
6.8
7
7.2
4.9 5 5.1 5.2 5.3 5.4 5.5 5.6
pH
Micromoles of HCL (cumulative)
C3 Regression
0
2
4
6
8
10
12
0 5 10 15
pH
Micromoles of HCL (cumulative)
Standard D1 Titration of Ca(OH)2with HCL
Series1
y = -1.09x + 17.505
6.4
6.6
6.8
7
7.2
7.4
7.6
7.8
8
8.8 9 9.2 9.4 9.6 9.8 10 10.2
pH
Micromoles of HCL (cumulative)
D1 Regression

139
0
2
4
6
8
10
12
0 2 4 6 8
pH
Micromoles of HCL (cumulative)
Standard D2 Titration of Ca(OH)2with HCL
y = -1.97x + 14.154
5
6
7
8
9
10
11
1.8 2.3 2.8 3.3 3.8 4.3 4.8 5.3
pH
Micromoles of HCL (cumulative)
D2 Regression
02468
1012
0 2 4 6 8 10
pH
Micromoles of HCL (cumulative)
Standard D3 Titration of Ca(OH)2with HCL

140
y = -0.97x + 13.238
6.2
6.4
6.6
6.8
7
7.2
7.4
7.6
5.8 6 6.2 6.4 6.6 6.8 7 7.2
pH
Micromoles of HCL (cumulative)
D3 Regression
0
2
4
6
8
10
12
0 5 10 15 20
pH
Micromoles of HCL (cumulative)
Standard E1 Titration of Ca(OH)2with HCL
y = -1.72x + 27.43
6
6.5
7
7.5
8
8.5
9
10.9 11.1 11.3 11.5 11.7 11.9 12.1
pH
Micromoles of HCL (cumulative)
E1 Regression

141
4
5
6
7
8
9
10
11
12
0 5 10 15 20
pH
Micromoles (cumulative)
Standard E2 Titration of Ca(OH)2 with HCL
y = -1.23x + 24.365
6
6.5
7
7.5
8
8.5
9
12.5 13 13.5 14 14.5 15
pH
Micromoles of HCL (cumulative)
E2 Regression
0
2
4
6
8
10
12
0 2 4 6 8 10 12 14
pH
Micromoles of HCL (cumulative)
Standard E3 Titration of Ca(OH)2with HCL

142
y = -1.55x + 20.896
6.5
7
7.5
8
8.4 8.6 8.8 9 9.2 9.4 9.6
pH
Micromoles of HCL (cumulative)
E3 Regression
0
2
4
6
8
10
12
0 5 10 15 20
pH
Micromoles of HCL (cumulative)
Standard F1 Titration of Ca(OH)2with HCL
y = -0.6x + 14.16.2
6.4
6.6
6.8
7
7.2
7.4
11.4 11.9 12.4 12.9 13.4
pH
Micromoles of HCL (cumulative)
F1 Regression

143
0
2
4
6
8
10
12
0 5 10 15 20
pH
Micromoles of HCL (cumulative)
Standard F2 Titration of Ca(OH)2with HCL
y = -1.0491x + 20.508
5
5.5
6
6.5
7
7.5
8
8.5
11.5 12 12.5 13 13.5 14 14.5
pH
Micromoles of HCL (cumulative)
F2 Regression
3.4
5.4
7.4
9.4
11.4
0 2 4 6 8 10
pH
Micromoles of HCL (cumulative)
Standard F3 Titration of Ca(OH)2with HCL

144
y = -1.55x + 15.265
5.3
5.8
6.3
6.8
7.3
7.8
5 5.2 5.4 5.6 5.8 6 6.2 6.4
pH
Micromoles of HCL (cumulative)
F3 Regression
0
246
8
10
1214
0 5 10 15 20
pH
Micromoles of HCL (cumulative)
Standard G1 Titration of Ca(OH)2with HCL
y = -0.4514x + 13.956
6.4
6.5
6.6
6.7
6.8
6.9
7
7.1
7.2
7.3
14.9 15.4 15.9 16.4 16.9
pH
Micromoles of HCL (cumulative)
G1 Regression

145
0
5
10
15
0 5 10 15 20
pH
Micromoles of HCL (cumulative)
Standard G2 Titration of Ca(OH)2with HCL
y = -1.2x + 17.23
4
5
6
7
8
9
10
11
12
4 5 6 7 8 9 10 11
pH
Micromoles of HCL (cumulative)
G2 Regression
0
2
4
6
8
10
12
14
0 5 10 15 20
pH
Micromoles of HCL (cumulative)
Standard G3 Titration of Ca(OH)2with HCL

146
y = -0.4171x + 13.299
6.36.46.56.66.76.86.9
77.1
14.5 15 15.5 16 16.5 17
pH
Micromoles of HCL (cumulative)
G3 Regression
0
2
4
6
8
10
12
14
0 5 10 15 20 25
pH
Micromoles of HCL (cumulative)
Standard H1 Titration of Ca(OH)2with HCL
y = -0.6207x + 19.158
5
5.5
6
6.5
7
7.5
8
18.5 19 19.5 20 20.5 21 21.5 22 22.5
pH
Micromoles of HCL (cumulative)
H1 Regression

147
6
7
8
9
10
11
12
13
0 5 10 15 20 25
pH
Micromoles (cumulative)
Standard H2 Titration of Ca(OH)2 with HCL
y = -0.225x + 10.845
6.7
6.8
6.9
7
7.1
7.2
7.3
15.8 16.3 16.8 17.3 17.8 18.3
pH
Micromoles of HCL (cumulative)
H2 Regression
0
2
4
6
8
10
12
14
0 5 10 15 20
pH
Micromoles of HCL (cumulative)
Standard H3 Titration of Ca(OH)2with HCL

148
y = -0.725x + 16.9576
6.5
7
7.5
8
12.8 13.3 13.8 14.3 14.8 15.3
pH
Micromoles of HCL (cumulative)
H3 Regression
0
2
4
6
8
10
12
0 2 4 6 8 10 12
pH
Micromoles of HCL (cumulative)
Standard I1 Titration of Ca(OH)2with HCL
y = -1.72x + 16.826
7
8
9
10
11
3.9 4.4 4.9 5.4 5.9 6.4
pH
Micromoles of HCL (cumulative)
I1 Regression

149
5.5
6.5
7.5
8.5
9.5
10.5
11.5
12.5
0 5 10 15 20 25
pH
Micromoles of HCL (cumulative)
Standard I2 Titration of Ca(OH)2 with HCL
y = -0.3331x + 12.4
6.4
6.6
6.8
7
7.2
7.4
7.6
14.5 15 15.5 16 16.5 17 17.5 18
pH
Micromoles of HCL (cumulative)
I2 Regression
0
2
4
6
8
10
12
0 5 10 15 20 25
pH
Micromoles of HCL (cumulative)
Standard I3 Titration of Ca(OH)2
with HCL

150
y = -0.41x + 14.22
6.2
6.4
6.6
6.8
7
7.2
7.4
16.5 17 17.5 18 18.5 19 19.5
pH
Micromoles of HCL (cumulative)
I3 Regression
0
2
4
6
8
10
12
0 5 10 15 20 25 30
pH
Micromoles of HCL (cumulative)
Standard J1 Titration of Ca(OH)2
with HCL
y = -0.45x + 17.393
6.4
6.6
6.8
7
7.2
7.4
7.6
21.5 22 22.5 23 23.5 24 24.5
pH
Micromoles of HCL (cumulative)
J1 Regression
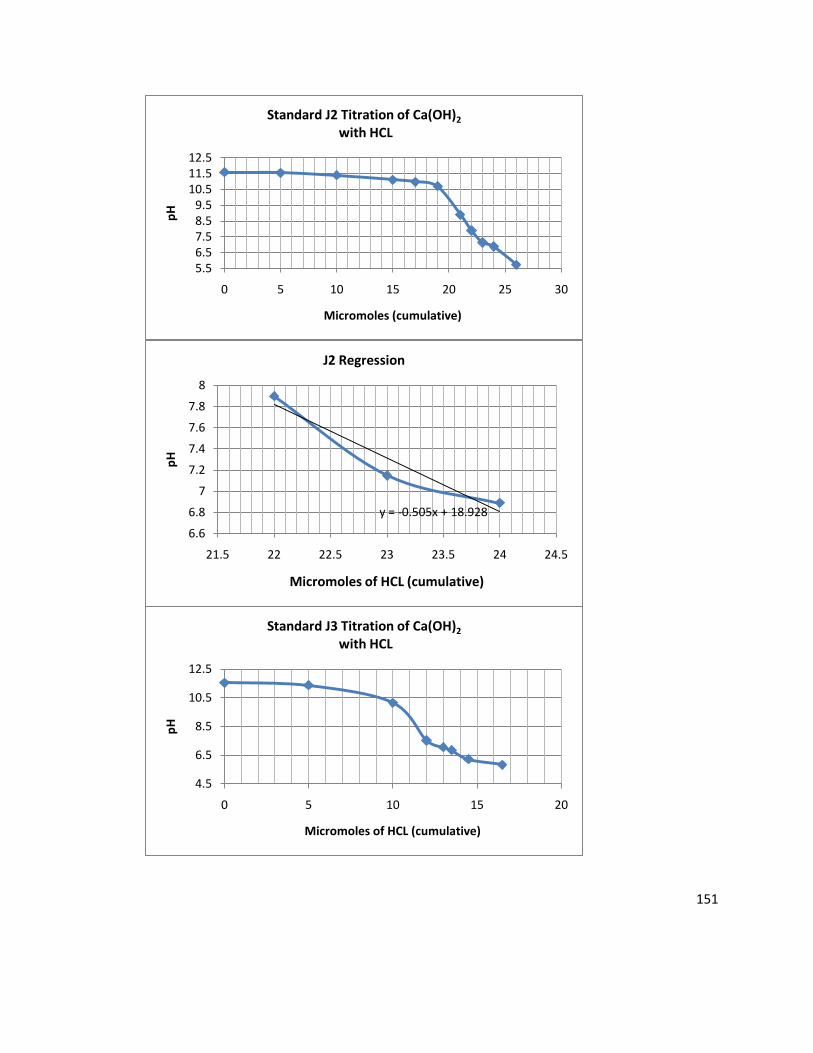
151
5.56.57.58.59.5
10.511.512.5
0 5 10 15 20 25 30
pH
Micromoles (cumulative)
Standard J2 Titration of Ca(OH)2
with HCL
y = -0.505x + 18.928
6.6
6.8
7
7.2
7.4
7.6
7.8
8
21.5 22 22.5 23 23.5 24 24.5
pH
Micromoles of HCL (cumulative)
J2 Regression
4.5
6.5
8.5
10.5
12.5
0 5 10 15 20
pH
Micromoles of HCL (cumulative)
Standard J3 Titration of Ca(OH)2
with HCL

152
y = -0.5231x + 13.841
6
6.2
6.4
6.6
6.8
7
7.2
7.4
7.6
7.8
11.7 12.2 12.7 13.2 13.7 14.2 14.7
pH
Micromoles of HCL (cumulative)
J3 Regression

153
Appendix VII.
Titration data for the second standards. Columns from left to right: pH readings, concentration of HCL added, volume of HCL added, moles of HCL added, cumulative moles of HCL added, cumulative micromoles of HCL added, and pH (listed again).
Second Standard 2A
pH [HCl] HCl (L) HCl Added (mol)HCl Cumulative (mol)Micromoles (cumulative)pH
10.81 0 0 10.81
10.58 0.1 0.00001 0.000001 0.000001 1 10.58
10.2 0.1 0.00001 0.000001 0.000002 2 10.2
9.5 0.05 0.00001 0.0000005 0.0000025 2.5 9.5
6.14 0.05 0.00001 0.0000005 0.000003 3 6.14
5.44 0.025 0.00001 2.5E-07 3.25E-06 3.25 5.44
4.33 0.05 0.00001 0.0000005 3.75E-06 3.75 4.33
2.73 0.1 0.00001 0.000001 4.75E-06 4.75 2.73
Second Standard 2B
pH [HCl] HCl (L) HCl Added (mol)HCl Cumulative (mol)Micromoles (cumulative)pH
10.87 0.00000000 0 10.87
10.62 0.1 0.00001 0.000001 0.00000100 1 10.62
9.99 0.1 0.00001 0.000001 0.00000200 2 9.99
7.46 0.05 0.00001 0.0000005 0.00000250 2.5 7.46
6.18 0.025 0.00001 2.5E-07 0.00000275 2.75 6.18
5.36 0.025 0.00001 2.5E-07 0.00000300 3 5.36
4.16 0.05 0.00001 0.0000005 0.00000350 3.5 4.16
2.74 0.1 0.00001 0.000001 0.00000450 4.5 2.74
Second Standard 2C
pH [HCl] HCl (L) HCl Added (mol)HCl Cumulative (mol)Micromoles (cumulative)pH
10.43 0 0 10.43
10.23 0.05 0.00001 0.0000005 0.0000005 0.5 10.23
9.5 0.05 0.00001 0.0000005 0.000001 1 9.5
7.6 0.025 0.00001 2.5E-07 1.25E-06 1.25 7.6
7.75 0.025 0.00001 2.5E-07 0.0000015 1.5 7.75
6.45 0.025 0.00001 2.5E-07 1.75E-06 1.75 6.45
5.8 0.025 0.00001 2.5E-07 0.000002 2 5.8
4.9 0.05 0.00001 0.0000005 0.0000025 2.5 4.9
2.9 0.1 0.00001 0.000001 0.0000035 3.5 2.9

154
Second Standard 3A
pH [HCl] HCl (L) HCl Added (mol)HCl Cumulative (mol)Micromoles (cumulative)pH
11.33 0 0 11.33
11.21 0.1 0.00001 0.000001 0.000001 1 11.21
10.96 0.2 0.00001 0.000002 0.000003 3 10.96
10.76 0.1 0.00001 0.000001 0.000004 4 10.76
10.36 0.1 0.00001 0.000001 0.000005 5 10.36
5.47 0.2 0.00001 0.000002 0.000007 7 5.47
3.29 0.1 0.00001 0.000001 0.000008 8 3.29
2.27 0.2 0.00001 0.000002 0.00001 10 2.27
Second Standard 3B
ph [HCl] HCl (L) HCl Added (mol)HCl Cumulative (mol) ph
10.94 0 0 10.94
10.24 0.2 0.00001 0.000002 0.000002 2 10.24
5.52 0.1 0.00001 0.000001 0.000003 3 5.52
4.91 0.025 0.00001 2.5E-07 3.25E-06 3.25 4.91
4.25 0.025 0.00001 2.5E-07 0.0000035 3.5 4.25
2.66 0.1 0.00001 0.000001 0.0000045 4.5 2.66
2.16 0.2 0.00001 0.000002 0.0000065 6.5 2.16
Second Standard 3C
pH [HCl] HCl (L) HCl Added (mol)HCl Cumulative (mol) pH
11.3 0 0 11.3
11.04 0.2 0.00001 0.000002 0.000002 2 11.04
10.83 0.1 0.00001 0.000001 0.000003 3 10.83
10.7 0.1 0.00001 0.000001 0.000004 4 10.7
10.57 0.1 0.00001 0.000001 0.000005 5 10.57
9.71 0.1 0.00001 0.000001 0.000006 6 9.71
7.02 0.05 0.00001 0.0000005 0.0000065 6.5 7.02
6 0.025 0.00001 2.5E-07 6.75E-06 6.75 6
4.59 0.05 0.00001 0.0000005 7.25E-06 7.25 4.59
2.43 0.2 0.00001 0.000002 9.25E-06 9.25 2.43

155
Second Standard 4A
pH [HCl] HCl (L) HCl Added (mol)HCl Cumulative (mol) pH
11.34 0 0 11.34
11.17 0.2 0.00001 0.000002 0.000002 2 11.17
10.92 0.2 0.00001 0.000002 0.000004 4 10.92
10.22 0.2 0.00001 0.000002 0.000006 6 10.22
7.25 0.1 0.00001 0.000001 0.000007 7 7.25
5.33 0.05 0.00001 0.0000005 0.0000075 7.5 5.33
3.16 0.1 0.00001 0.000001 0.0000085 8.5 3.16
2.24 0.2 0.00001 0.000002 0.0000105 10.5 2.24
Second Standard 4B
pH [HCl] HCl (L) HCl Added (mol)HCl Cumulative (mol)
11.23 0 0 11.23
11.11 0.2 0.00001 0.000002 0.000002 2 11.11
10.67 0.2 0.00001 0.000002 0.000004 4 10.67
6.46 0.2 0.00001 0.000002 0.000006 6 6.46
5.43 0.025 0.00001 2.5E-07 6.25E-06 6.25 5.43
3.11 0.1 0.00001 0.000001 7.25E-06 7.25 3.11
2.19 0.2 0.00001 0.000002 9.25E-06 9.25 2.19
Second Standard 4C
pH [HCl] HCl (L) HCl Added (mol)HCl Cumulative (mol)
11.35 0 0 11.35
11.1 0.2 0.00001 0.000002 0.000002 2 11.1
11.03 0.2 0.00001 0.000002 0.000004 4 11.03
10.66 0.2 0.00001 0.000002 0.000006 6 10.66
10.09 0.1 0.00001 0.000001 0.000007 7 10.09
6.51 0.1 0.00001 0.000001 0.000008 8 6.51
3.86 0.1 0.00001 0.000001 0.000009 9 3.86
2.28 0.2 0.00001 0.000002 0.000011 11 2.28

156
Second Standard 5A
pH [HCl] HCl (L) HCl Added (mol)HCl Cumulative (mol) pH
11.58 0 0 11.58
11.24 0.5 0.00001 0.000005 0.000005 5 11.24
11.13 0.2 0.00001 0.000002 0.000007 7 11.13
10.84 0.2 0.00001 0.000002 0.000009 9 10.84
10.24 0.2 0.00001 0.000002 0.000011 11 10.24
7.53 0.1 0.00001 0.000001 0.000012 12 7.53
6.41 0.025 0.00001 2.5E-07 1.225E-05 12.25 6.41
4.73 0.05 0.00001 0.0000005 1.275E-05 12.75 4.73
2.43 0.2 0.00001 0.000002 1.475E-05 14.75 2.43
Second Standard 5B
pH [HCl] HCl (L) HCl Added (mol)HCl Cumulative (mol) pH
11.39 0 0 11.39
10.75 0.5 0.00001 0.000005 0.000005 5 10.75
7.56 0.2 0.00001 0.000002 0.000007 7 7.56
6.03 0.025 0.00001 2.5E-07 7.25E-06 7.25 6.03
5.35 0.025 0.00001 2.5E-07 0.0000075 7.5 5.35
4.18 0.05 0.00001 0.0000005 0.000008 8 4.18
2.3 0.2 0.00001 0.000002 0.00001 10 2.3
1.77 0.5 0.00001 0.000005 0.000015 15 1.77
Second Standard 5C
pH [HCl] HCl (L) HCl Added (mol)HCl Cumulative (mol) pH
11.51 0 0 11.51
11.06 0.5 0.00001 0.000005 0.000005 5 11.06
10.7 0.2 0.00001 0.000002 0.000007 7 10.7
9.66 0.2 0.00001 0.000002 0.000009 9 9.66
7.97 0.05 0.00001 0.0000005 0.0000095 9.5 7.97
7.42 0.025 0.00001 2.5E-07 9.75E-06 9.75 7.42
7.14 0.025 0.00001 2.5E-07 0.00001 10 7.14
6.28 0.025 0.00001 2.5E-07 1.025E-05 10.25 6.28
4.98 0.05 0.00001 0.0000005 1.075E-05 10.75 4.98
1.96 0.5 0.00001 0.000005 1.575E-05 15.75 1.96

157
Second Standard 6A
pH [HCl] HCl (L) HCl Added (mol)HCl Cumulative (mol) pH
11.59 0 0 11.59
11.3 0.5 0.00001 0.000005 0.000005 5 11.3
10.85 0.5 0.00001 0.000005 0.00001 10 10.85
9.82 0.2 0.00001 0.000002 0.000012 12 9.82
5.89 0.1 0.00001 0.000001 0.000013 13 5.89
3.61 0.1 0.00001 0.000001 0.000014 14 3.61
1.81 0.5 0.00001 0.000005 0.000019 19 1.81
Second Standard 6B
pH [HCl] HCl (L) HCl Added (mol)HCl Cumulative (mol) pH
11.34 0 0 11.34
10.94 0.5 0.00001 0.000005 0.000005 5 10.94
10.39 0.2 0.00001 0.000002 0.000007 7 10.39
9.88 0.1 0.00001 0.000001 0.000008 8 9.88
8.08 0.05 0.00001 0.0000005 0.0000085 8.5 8.08
6.81 0.025 0.00001 2.5E-07 8.75E-06 8.75 6.81
4.91 0.05 0.00001 0.0000005 9.25E-06 9.25 4.91
2.45 0.2 0.00001 0.000002 1.125E-05 11.25 2.45
1.8 0.5 0.00001 0.000005 1.625E-05 16.25 1.8
Second Standard 6C
pH [HCl] HCl (L) HCl Added (mol)HCl Cumulative (mol) pH
11.48 0 0 11.48
11.27 0.5 0.00001 0.000005 0.000005 5 11.27
10.82 0.5 0.00001 0.000005 0.00001 10 10.82
10.11 0.2 0.00001 0.000002 0.000012 12 10.11
9.29 0.05 0.00001 0.0000005 0.0000125 12.5 9.29
7.16 0.05 0.00001 0.0000005 0.000013 13 7.16
6.27 0.025 0.00001 2.5E-07 1.325E-05 13.25 6.27
5.42 0.025 0.00001 2.5E-07 0.0000135 13.5 5.42
4.29 0.05 0.00001 0.0000005 0.000014 14 4.29
1.97 0.5 0.00001 0.000005 0.000019 19 1.97

158
Second Standard 7A
pH [HCl] HCl (L) HCl Added (mol)HCl Cumulative (mol) pH
12.02 0 0 12.02
11.7 0.5 0.00001 0.000005 0.000005 5 11.7
11.51 0.2 0.00001 0.000002 0.000007 7 11.51
11.4 0.2 0.00001 0.000002 0.000009 9 11.4
11.3 0.2 0.00001 0.000002 0.000011 11 11.3
11.1 0.2 0.00001 0.000002 0.000013 13 11.1
10.43 0.2 0.00001 0.000002 0.000015 15 10.43
8.55 0.1 0.00001 0.000001 0.000016 16 8.55
3.27 0.05 0.00001 0.0000005 0.0000165 16.5 3.27
1.74 0.5 0.00001 0.000005 0.0000215 21.5 1.74
Second Standard 7B
pH [HCl] HCl (L) HCl Added (mol)HCl Cumulative (mol) pH
11.55 0 0 11.55
11.35 0.5 0.00001 0.000005 0.000005 5 11.35
10.82 0.5 0.00001 0.000005 0.00001 10 10.82
10.1 0.2 0.00001 0.000002 0.000012 12 10.1
7.1 0.1 0.00001 0.000001 0.000013 13 7.1
6.8 0.025 0.00001 2.5E-07 1.325E-05 13.25 6.8
5.34 0.025 0.00001 2.5E-07 0.0000135 13.5 5.34
3.62 0.1 0.00001 0.000001 0.0000145 14.5 3.62
1.81 0.5 0.00001 0.000005 0.0000195 19.5 1.81
Second Standard 7C
pH [HCl] HCl (L) HCl Added (mol)HCl Cumulative (mol) pH
11.54 0 0 11.54
11.27 0.5 0.00001 0.000005 0.000005 5 11.27
10.4 0.5 0.00001 0.000005 0.00001 10 10.4
6.84 0.2 0.00001 0.000002 0.000012 12 6.84
6.78 0.025 0.00001 2.5E-07 1.225E-05 12.25 6.78
4.77 0.1 0.00001 0.000001 1.325E-05 13.25 4.77
3.1 0.2 0.00001 0.000002 1.525E-05 15.25 3.1
1.76 0.5 0.00001 0.000005 2.025E-05 20.25 1.76

159
Second Standard 8A
pH [HCl] HCl (L) HCl Added (mol)HCl Cumulative (mol) pH
11.65 0 0 11.65
11.42 0.5 0.00001 0.000005 0.000005 5 11.42
11 0.5 0.00001 0.000005 0.00001 10 11
10.43 0.2 0.00001 0.000002 0.000012 12 10.43
7.84 0.1 0.00001 0.000001 0.000013 13 7.84
6.59 0.025 0.00001 2.5E-07 1.325E-05 13.25 6.59
4.92 0.05 0.00001 0.0000005 1.375E-05 13.75 4.92
3.55 0.1 0.00001 0.000001 1.475E-05 14.75 3.55
1.77 0.5 0.00001 0.000005 1.975E-05 19.75 1.77
Second Standard 8B
pH [HCl] HCl (L) HCl Added (mol)HCl Cumulative (mol) pH
11.58 0 0 11.58
11.39 0.5 0.00001 0.000005 0.000005 5 11.39
11.03 0.5 0.00001 0.000005 0.00001 10 11.03
10.65 0.2 0.00001 0.000002 0.000012 12 10.65
10.05 0.1 0.00001 0.000001 0.000013 13 10.05
6.91 0.1 0.00001 0.000001 0.000014 14 6.91
5.46 0.025 0.00001 2.5E-07 1.425E-05 14.25 5.46
4.43 0.05 0.00001 0.0000005 1.475E-05 14.75 4.43
2.59 0.2 0.00001 0.000002 1.675E-05 16.75 2.59
Second Standard 8C
pH [HCl] HCl (L) HCl Added (mol)HCl Cumulative (mol) pH
12.03 0 0 12.03
11.89 0.5 0.00001 0.000005 0.000005 5 11.89
11.7 0.5 0.00001 0.000005 0.00001 10 11.7
11.58 0.5 0.00001 0.000005 0.000015 15 11.58
7.66 0.5 0.00001 0.000005 0.00002 20 7.66
6.02 0.025 0.00001 2.5E-07 2.025E-05 20.25 6.02
4.27 0.05 0.00001 0.0000005 2.075E-05 20.75 4.27
1.78 0.5 0.00001 0.000005 2.575E-05 25.75 1.78

160
Second Standard 9A
pH [HCl] HCl (L) HCl Added (mol)HCl Cumulative (mol)
11.92 0 0 11.92
11.9 0.5 0.00001 0.000005 0.000005 5 11.9
11.61 1 0.00001 0.00001 0.000015 15 11.61
11.35 0.5 0.00001 0.000005 0.00002 20 11.35
10.69 0.5 0.00001 0.000005 0.000025 25 10.69
7.68 0.2 0.00001 0.000002 0.000027 27 7.68
6.1 0.05 0.00001 0.0000005 0.0000275 27.5 6.1
2.36 0.2 0.00001 0.000002 0.0000295 29.5 2.36
1.59 0.5 0.00001 0.000005 0.0000345 34.5 1.59
Second Standard 9B
pH [HCl] HCl (L) HCl Added (mol)HCl Cumulative (mol) pH
11.95 0 0 11.95
11.75 0.5 0.00001 0.000005 0.000005 5 11.75
11.47 0.5 0.00001 0.000005 0.00001 10 11.47
11.34 0.2 0.00001 0.000002 0.000012 12 11.34
10.93 0.2 0.00001 0.000002 0.000014 14 10.93
5.81 0.2 0.00001 0.000002 0.000016 16 5.81
4.27 0.05 0.00001 0.0000005 0.0000165 16.5 4.27
1.75 0.5 0.00001 0.000005 0.0000215 21.5 1.75
Second Standard 9C
pH [HCl] HCl (L) HCl Added (mol)HCl Cumulative (mol) pH
11.5 0 0 11.5
11.46 0.5 0.00001 0.000005 0.000005 5 11.46
11.25 1 0.00001 0.00001 0.000015 15 11.25
10.55 0.5 0.00001 0.000005 0.00002 20 10.55
7.34 0.2 0.00001 0.000002 0.000022 22 7.34
6.35 0.025 0.00001 2.5E-07 2.225E-05 22.25 6.35
4.62 0.1 0.00001 0.000001 2.325E-05 23.25 4.62
1.82 0.5 0.00001 0.000005 2.825E-05 28.25 1.82
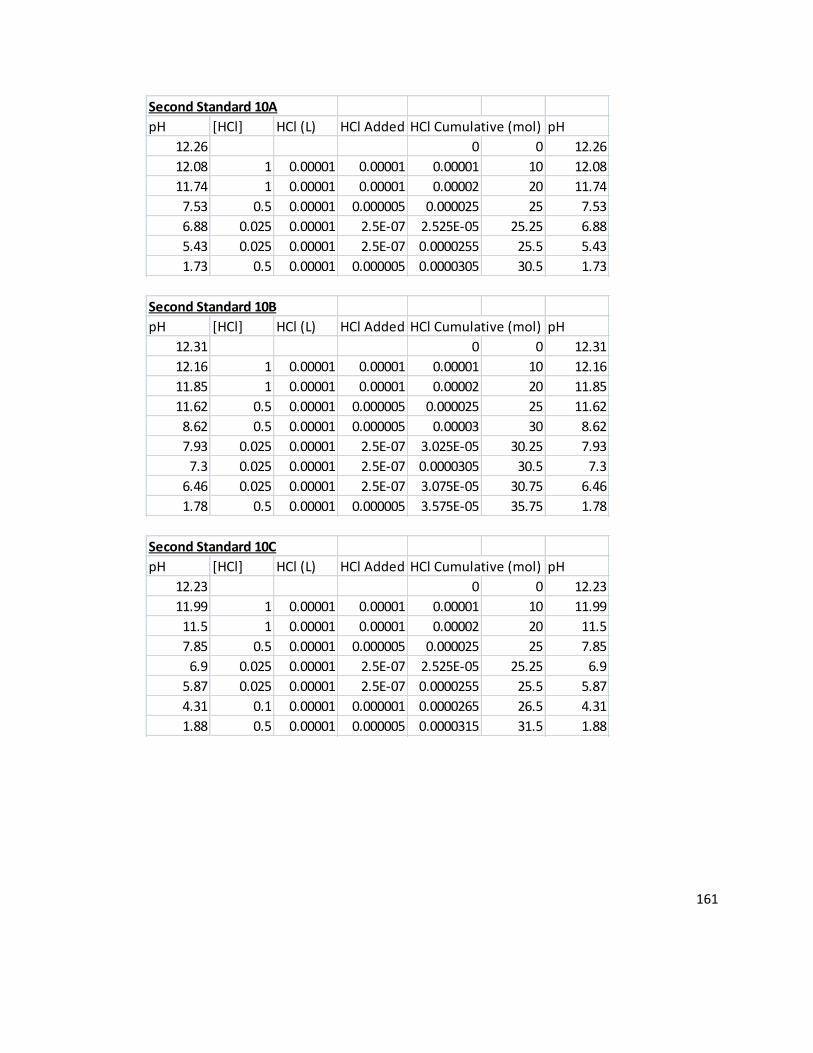
161
Second Standard 10A
pH [HCl] HCl (L) HCl Added (mol)HCl Cumulative (mol) pH
12.26 0 0 12.26
12.08 1 0.00001 0.00001 0.00001 10 12.08
11.74 1 0.00001 0.00001 0.00002 20 11.74
7.53 0.5 0.00001 0.000005 0.000025 25 7.53
6.88 0.025 0.00001 2.5E-07 2.525E-05 25.25 6.88
5.43 0.025 0.00001 2.5E-07 0.0000255 25.5 5.43
1.73 0.5 0.00001 0.000005 0.0000305 30.5 1.73
Second Standard 10B
pH [HCl] HCl (L) HCl Added (mol)HCl Cumulative (mol) pH
12.31 0 0 12.31
12.16 1 0.00001 0.00001 0.00001 10 12.16
11.85 1 0.00001 0.00001 0.00002 20 11.85
11.62 0.5 0.00001 0.000005 0.000025 25 11.62
8.62 0.5 0.00001 0.000005 0.00003 30 8.62
7.93 0.025 0.00001 2.5E-07 3.025E-05 30.25 7.93
7.3 0.025 0.00001 2.5E-07 0.0000305 30.5 7.3
6.46 0.025 0.00001 2.5E-07 3.075E-05 30.75 6.46
1.78 0.5 0.00001 0.000005 3.575E-05 35.75 1.78
Second Standard 10C
pH [HCl] HCl (L) HCl Added (mol)HCl Cumulative (mol) pH
12.23 0 0 12.23
11.99 1 0.00001 0.00001 0.00001 10 11.99
11.5 1 0.00001 0.00001 0.00002 20 11.5
7.85 0.5 0.00001 0.000005 0.000025 25 7.85
6.9 0.025 0.00001 2.5E-07 2.525E-05 25.25 6.9
5.87 0.025 0.00001 2.5E-07 0.0000255 25.5 5.87
4.31 0.1 0.00001 0.000001 0.0000265 26.5 4.31
1.88 0.5 0.00001 0.000005 0.0000315 31.5 1.88

162
Second Standard 11A
pH [HCl] HCl (L) HCl Added (mol)HCl Cumulative (mol) pH
12.24 0 0 12.24
12.05 1 0.00001 0.00001 0.00001 10 12.05
11.85 1 0.00001 0.00001 0.00002 20 11.85
11.5 0.05 0.00001 0.0000005 0.0000205 20.5 11.5
11.42 0.2 0.00001 0.000002 0.0000225 22.5 11.42
11.13 0.2 0.00001 0.000002 0.0000245 24.5 11.13
10.22 0.2 0.00001 0.000002 0.0000265 26.5 10.22
7.48 0.1 0.00001 0.000001 0.0000275 27.5 7.48
6.5 0.025 0.00001 2.5E-07 2.775E-05 27.75 6.5
3.28 0.1 0.00001 0.000001 2.875E-05 28.75 3.28
Second Standard 11B
pH [HCl] HCl (L) HCl Added (mol)HCl Cumulative (mol) pH
12.11 0.00000000 0 12.11
12.01 1 0.00001 0.00001 0.00001000 10 12.01
11.5 1 0.00001 0.00001 0.00002000 20 11.5
10.82 0.5 0.00001 0.000005 0.00002500 25 10.82
10.45 0.1 0.00001 0.000001 0.00002600 26 10.45
8.3 0.1 0.00001 0.000001 0.00002700 27 8.3
7.72 0.025 0.00001 2.5E-07 0.00002725 27.25 7.72
7.23 0.025 0.00001 2.5E-07 0.00002750 27.5 7.23
6.2 0.025 0.00001 2.5E-07 0.00002775 27.75 6.2
2.1 0.5 0.00001 0.000005 0.00003275 32.75 2.1

163
Appendix VIII.
Titration graphs and linear regression graphs for second standard curve.
0
5
10
15
0 1 2 3 4 5
pH
Micromoles of HCL (cumulative)
Standard 2a Titration of Ca(OH)2with HCL
y = -6.72x + 26.35.5
6.5
7.5
8.5
9.5
10.5
2.4 2.6 2.8 3 3.2
pH
Micromoles of HCL (cumulative)
2a Regression
02468
1012
0 1 2 3 4 5
pH
Micromoles of HCL (cumulative)
Standard 2b Titration of Ca(OH)2with HCL

164
y = -5.0771x + 20.146
5
6
7
8
9
10
11
1.8 2 2.2 2.4 2.6 2.8
pH
Micromoles of HCL (cumulative)
2b Regression
0
2
4
6
8
10
12
0 1 2 3 4
pH
Micromoles of HCL (cumulative)
Standard 2c Titration of Ca(OH)2with HCL
y = -3.6x + 12.7756
6.5
7
7.5
8
8.5
9
9.5
10
0.9 1.1 1.3 1.5 1.7 1.9
pH
Micromoles of HCL (cumulative)
2c Regression

165
0
2
4
6
8
10
12
0 2 4 6 8 10 12
pH
Micromoles of HCL (cumulative)
Standard 3a Titration of Ca(OH)2with HCL
y = -2.445x + 22.585
4.2
5.2
6.2
7.2
8.2
9.2
10.2
11.2
4.5 5 5.5 6 6.5 7 7.5
pH
Micromoles of HCL (cumulative)
3a Regression
0
2
4
6
8
10
12
0 1 2 3 4 5 6 7
pH
Micromoles of HCL (cumulative)
Standard 3b Titration of Ca(OH)2with HCL

166
y = -4.3943x + 18.9744
5
6
7
8
9
10
11
1.7 2.2 2.7 3.2 3.7
pH
Micromoles of HCL (cumulative)
3b Regression
0
2
4
6
8
10
12
0 2 4 6 8 10
pH
Micromoles of HCL (cumulative)
Standard 3c Titration of Ca(OH)2with HCL
y = -5.0086x + 39.715
0
2
4
6
8
10
12
5.8 6 6.2 6.4 6.6 6.8
pH
Micromoles of HCL (cumulative)
3c Regression

167
0
2
4
6
8
10
12
0 2 4 6 8 10 12
pH
Micromoles of HCL (cumulative)
Standard 4a Titration of Ca(OH)2with HCL
y = -3.2186x + 29.594
4
5
6
7
8
9
10
11
5.9 6.4 6.9 7.4 7.9
pH
Micromoles of HCL (cumulative)
4a Regression
0
2
4
6
8
10
12
0 2 4 6 8 10
pH
Title
Standard 4b Titration of Ca(OH)2with HCL

168
y = -2.105x + 19.096
7
8
9
10
11
3.6 4.1 4.6 5.1 5.6 6.1 6.6
pH
Title
4b Regression
0
2
4
6
8
10
12
0 2 4 6 8 10 12
pH
Micromoles of HCL (cumulative)
Standard 4c Titration of Ca(OH)2with HCL
y = -3.58x + 35.156
6.57
7.58
8.59
9.510
10.5
6.8 7 7.2 7.4 7.6 7.8 8 8.2
pH
Micromoles of HCL (cumulative)
4c Regression

169
02468
101214
0 5 10 15 20
pH
Micromoles of HCL (cumulative)
Standard 5a Titration of Ca(OH)2with HCL
y = -3.68x + 51.614.5
5
5.5
6
6.5
7
7.5
8
11.8 12 12.2 12.4 12.6 12.8
pH
Micromoles of HCL (cumulative)
5a Regression
0
2
4
6
8
10
12
0 5 10 15 20
pH
Micromoles of HCL (cumulative)
Standard 5b Titration of Ca(OH)2with HCL

170
y = -6.12x + 50.4
5
5.5
6
6.5
7
7.5
8
6.95 7 7.05 7.1 7.15 7.2 7.25 7.3
pH
Micromoles of HCL (cumulative)
5b Regression
0
5
10
15
0 5 10 15 20
pH
Micromoles of HCL (cumulative)
Standard 5c Titration of Ca(OH)2with HCL
y = -2.28x + 29.7476.2
6.4
6.6
6.8
7
7.2
7.4
7.6
9.7 9.8 9.9 10 10.1 10.2 10.3
pH
Micromoles of HCL (cumulative)
5c Regression

171
0
2
4
6
8
10
12
14
0 5 10 15 20
pH
Micromoles of HCL (cumulative)
Standard 6a Titration of Ca(OH)2with HCL
y = -3.93x + 56.98
4
5
6
7
8
9
10
11
11.8 12 12.2 12.4 12.6 12.8 13 13.2
pH
Micromoles of HCL (cumulative)
6a Regression
0
2
4
6
8
10
12
0 5 10 15 20
pH
Micromoles of HCL (cumulative)
Standard 6b Titration of Ca(OH)2with HCL
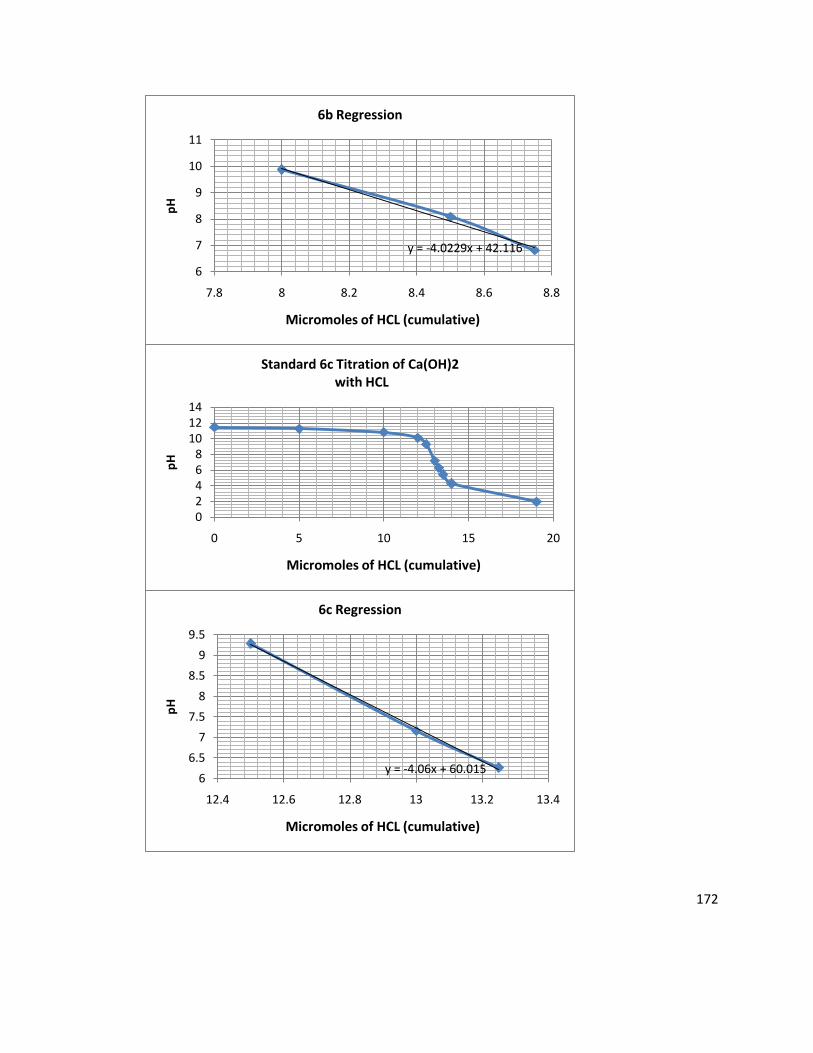
172
y = -4.0229x + 42.116
6
7
8
9
10
11
7.8 8 8.2 8.4 8.6 8.8
pH
Micromoles of HCL (cumulative)
6b Regression
02468
101214
0 5 10 15 20
pH
Micromoles of HCL (cumulative)
Standard 6c Titration of Ca(OH)2with HCL
y = -4.06x + 60.0156
6.5
7
7.5
8
8.5
9
9.5
12.4 12.6 12.8 13 13.2 13.4
pH
Micromoles of HCL (cumulative)
6c Regression

173
0
24
6
810
12
14
0 5 10 15 20 25
pH
Micromoles of HCL (cumulative)
Standard 7a Titration of Ca(OH)2with HCL
y = -10.56x + 177.51
2
3
4
5
6
7
8
9
15.9 16 16.1 16.2 16.3 16.4 16.5 16.6
pH
Micromoles of HCL (cumulative)
7a Regression
0
2
4
6
8
10
12
14
0 5 10 15 20 25
pH
Micromoles of HCL (cumulative)
Standard 7b Titration of Ca(OH)2with HCL
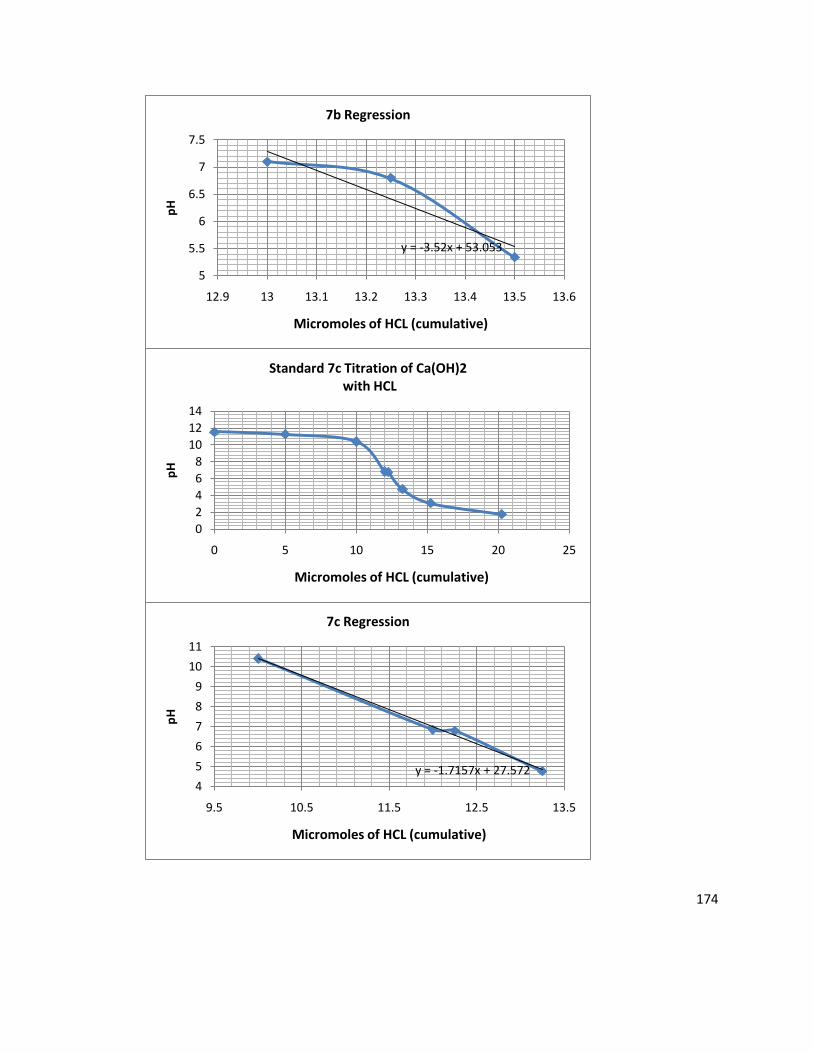
174
y = -3.52x + 53.053
5
5.5
6
6.5
7
7.5
12.9 13 13.1 13.2 13.3 13.4 13.5 13.6
pH
Micromoles of HCL (cumulative)
7b Regression
0
2
4
6
8
10
12
14
0 5 10 15 20 25
pH
Micromoles of HCL (cumulative)
Standard 7c Titration of Ca(OH)2with HCL
y = -1.7157x + 27.5724
5
6
7
8
9
10
11
9.5 10.5 11.5 12.5 13.5
pH
Micromoles of HCL (cumulative)
7c Regression

175
0
2
4
6
8
10
12
14
0 5 10 15 20 25
pH
Micromoles of HCL (cumulative)
Standard 8a Titration of Ca(OH)2with HCL
y = -3.8143x + 57.307
4
4.5
5
5.5
6
6.5
7
7.5
8
8.5
12.8 13 13.2 13.4 13.6 13.8
pH
Micromoles of HCL (cumulative)
8a Regression
0
2
4
6
8
10
12
14
0 5 10 15 20
pH
Micromoles of HCL (cumulative)
Standard 8b Titration of Ca(OH)2with HCL

176
y = -3.52x + 55.873
0
2
4
6
8
10
12
12.8 13 13.2 13.4 13.6 13.8 14 14.2 14.4
pH
Micromoles of HCL (cumulative)
8b Regression
0
2
4
6
8
10
12
14
0 5 10 15 20 25 30
pH
Micromoles of HCL (cumulative)
Standard 8c Titration of Ca(OH)2with HCL
y = -6.56x + 138.866
6.5
7
7.5
8
19.95 20 20.05 20.1 20.15 20.2 20.25 20.3
pH
Micromoles of HCL (cumulative)
8c Regression

177
0
2
4
6
8
10
12
14
0 10 20 30 40
pH
Micromoles of HCL (cumulative)
Standard 9a Titration of Ca(OH)2with HCL
y = -3.16x + 935.9
6.4
6.9
7.4
7.9
26.9 27 27.1 27.2 27.3 27.4 27.5 27.6
pH
Micromoles of HCL (cumulative)
9a Regression
0
2
4
6
8
10
12
14
0 5 10 15 20 25
pH
Micromoles of HCL (cumulative)
Standard 9b Titration of Ca(OH)2with HCL

178
y = -2.6343x + 47.835
2.9
4.9
6.9
8.9
10.9
12.9
13.5 14 14.5 15 15.5 16 16.5 17
pH
Micromoles of HCL (cumulative)
9b Regression
0
2
4
6
8
10
12
14
0 5 10 15 20 25 30
pH
Micromoles of HCL (cumulative)
Standard 9c Titration of Ca(OH)2with HCL
y = -3.96x + 94.46
6.2
6.4
6.6
6.8
7
7.2
7.4
21.95 22 22.05 22.1 22.15 22.2 22.25 22.3
pH
Micromoles of HCL (cumulative)
9c Regression

179
0
5
10
15
0 5 10 15 20 25 30 35
pH
Micromoles of HCL (cumulative)
Standard 10a Titration of Ca(OH)2with HCL
y = -4.2x + 112.66
5.1
5.6
6.1
6.6
7.1
7.6
8.1
24.9 25 25.1 25.2 25.3 25.4 25.5 25.6
pH
Micromoles of HCL (cumulative)
10a Regression
0
2
4
6
8
10
12
14
0 10 20 30 40
pH
Micromoles of HCL (cumulative)
Standard 10b Titration of Ca(OH)2with HCL

180
y = -2.844x + 93.964
6
6.5
7
7.5
8
8.5
9
29.9 30.1 30.3 30.5 30.7 30.9
pH
Micromoles of HCL (cumulative)
10b Regression
0
2
4
6
8
10
12
14
0 5 10 15 20 25 30 35
pH
Micromoles of HCL (cumulative)
Standard 10c Titration of Ca(OH)2with HCL
y = -3.96x + 106.865.8
6.3
6.8
7.3
7.8
8.3
24.9 25 25.1 25.2 25.3 25.4 25.5 25.6
pH
Micromoles of HCL (cumulative)
10c Regression

181
0
2
4
6
8
10
12
14
0 5 10 15 20 25 30 35
pH
Micromoles of HCL (cumulative)
Standard 11a Titration of Ca(OH)2with HCL
y = -2.9086x + 87.325
6
7
8
9
10
11
26.4 26.6 26.8 27 27.2 27.4 27.6 27.8 28
pH
Micromoles of HCL (cumulative)
11a Regression
0
2
4
6
8
10
12
14
0 5 10 15 20 25 30 35
pH
Micromoles of HCL (cumulative)
Standard 11b Titration of Ca(OH)2with HCL

182
y = -2.14x + 66.065
77.27.47.6
7.88
8.28.4
26.9 27 27.1 27.2 27.3 27.4 27.5 27.6
pH
Micromoles of HCL (cumulative)
11b Regression
0
2
4
6
8
10
12
14
0 10 20 30 40
pH
Micromoles of HCL (cumulative)
Standard 11c Titration of Ca(OH)2with HCL
y = -1.2314x + 46.055
6
6.5
7
7.5
8
30.8 31 31.2 31.4 31.6 31.8 32 32.2 32.4
pH
Micromoles of HCL (cumulative)
11c Regression

183
Appendix IX.
Titration data for positive controls. Columns from left to right: pH readings, concentration of HCL added, volume of HCL added, moles of HCL added, cumulative
moles of HCL added, cumulative micromoles of HCL added, and pH (listed again).
Pos Control A
pH [HCl] HCl (L) HCl Added (mol)HCl Cumulative (mol) pH
12.29 0 0 12.29
11.96 5.3 0.00001 0.000053 0.000053 53 11.96
11.95 3 0.00001 0.00003 0.000083 83 11.95
11.94 3 0.00001 0.00003 0.000113 113 11.94
11.65 5.3 0.00001 0.000053 0.000166 166 11.65
11.42 3 0.00001 0.00003 0.000196 196 11.42
10.5 3 0.00001 0.00003 0.000226 226 10.5
8.96 0.5 0.00001 0.000005 0.000231 231 8.96
7.69 0.2 0.00001 0.000002 0.000233 233 7.69
6.85 0.1 0.00001 0.000001 0.000234 234 6.85
6.2 0.1 0.00001 0.000001 0.000235 235 6.2
0.71 3 0.00001 0.00003 0.000265 265 0.71
Positive Control B
pH [HCl] HCl (L) HCl Added (mol)HCl Cumulative (mol) pH
12.27 0 0 12.27
11.96 5.6 0.00001 0.000056 0.000056 56 11.96
11.7 5.6 0.00001 0.000056 0.000112 112 11.7
11.67 3 0.00001 0.00003 0.000142 142 11.67
11.55 3 0.00001 0.00003 0.000172 172 11.55
11.55 3 0.00001 0.00003 0.000202 202 11.55
11.13 3 0.00001 0.00003 0.000232 232 11.13
1.36 3 0.00001 0.00003 0.000262 262 1.36

184
Positive Control C
pH [HCl] HCl (L) HCl Added (mol)HCl Cumulative (mol) pH
12.28 0 0 12.28
11.95 5.6 0.00001 0.000056 0.000056 56 11.95
11.66 5.6 0.00001 0.000056 0.000112 112 11.66
11.64 3 0.00001 0.00003 0.000142 142 11.64
11.6 3 0.00001 0.00003 0.000172 172 11.6
11.45 3 0.00001 0.00003 0.000202 202 11.45
8.8 3 0.00001 0.00003 0.000232 232 8.8
3.78 0.5 0.00001 0.000005 0.000237 237 3.78
0.67 3 0.00001 0.00003 0.000267 267 0.67

185
Appendix X.
Titration graphs and linear regression graphs positive controls.
0
2
4
6
8
10
12
14
0 50 100 150 200 250 300
pH
Micromoles of HCL (cumulative)
Standard Positive Control A Titration of Ca(OH)2with HCL
y = -0.6936x + 169.2
6.5
7
7.5
8
8.5
9
9.5
230.5 231 231.5 232 232.5 233 233.5 234 234.5
pH
Micromoles of HCL (cumulative)
Positive Control A Regression
0
2
4
6
8
10
12
14
0 50 100 150 200 250 300
pH
Micromoles of HCL (cumulative)
Standard Positive Control B Titration of Ca(OH)2with HCL

186
y = -0.3257x + 86.6850
5
10
15
230 235 240 245 250 255 260 265
pH
Micromoles of HCL (cumulative)
Positive Control B Regression
0
2
4
6
8
10
12
14
0 50 100 150 200 250 300
pH
Micromoles of HCL (cumulative)
Standard Positive Control C Titration of Ca(OH)2with HCL
y = -1.004x + 241.73
3
4
5
6
7
8
9
10
231 232 233 234 235 236 237 238
pH
Micromoles of HCL (cumulative)
Positive Control C Regression