quantitative research methods - nova … · creswell, j. w. (2008). educational research: ... what...
TRANSCRIPT

QUANTITATIVE RESEARCH METHODS Prepared by Jennifer Reeves, Ph.D.

Overview
Research Paradigms Quantitative Research Designs
Experimental Designs Nonexperimental Designs Survey Research Causal Comparative Correlational

Research Paradigms
Quantitative Qualitative Mixed Methods
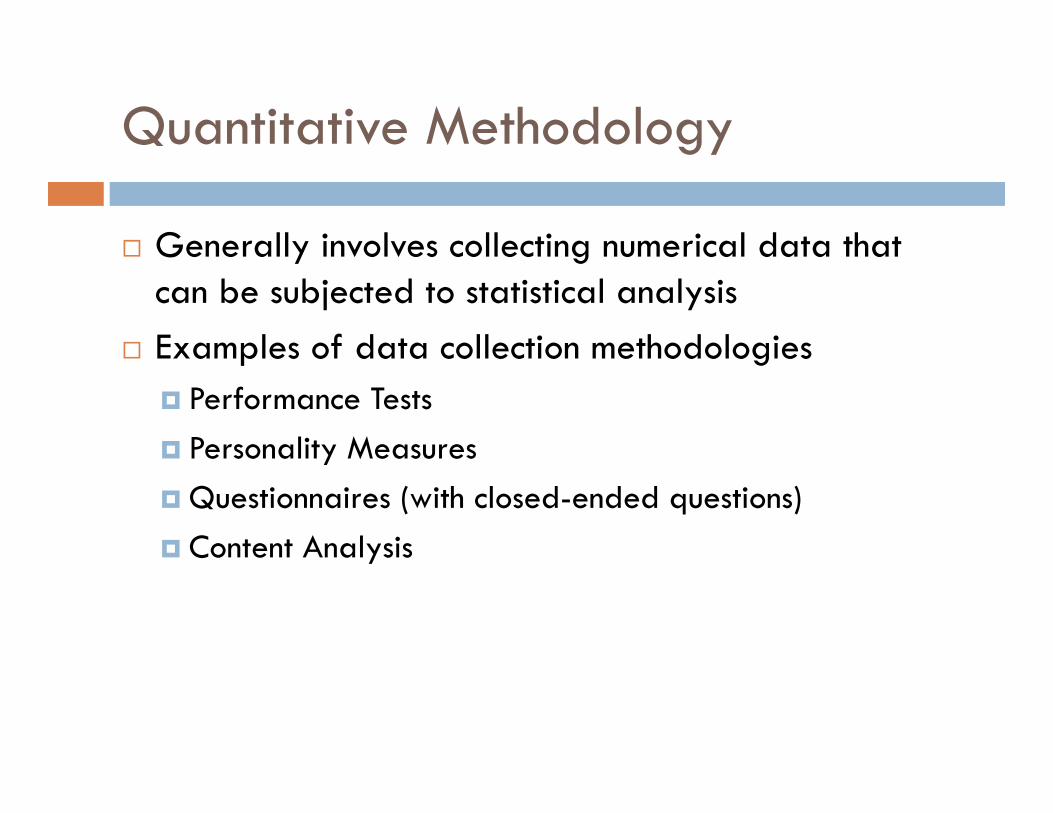
Quantitative Methodology
Generally involves collecting numerical data that can be subjected to statistical analysis
Examples of data collection methodologies Performance Tests Personality Measures Questionnaires (with closed-ended questions) Content Analysis

Quantitative Research
Trying to quantify variables of interest; questions must be measureable
Key characteristic: data involves numbers Questions frequently address “how well or how
much” Example:
What is the relationship between graduate students’ level of interaction, measured by the number of ‘hits’ in the course, and students’ grades in an online research methods course?

Qualitative Methodology
Generally involves listening to the participants’ voice and subjecting the data to analytic induction (e.g., finding common themes)
More Exploratory in nature Examples of data collection methods
Interviews Open-ended questionnaires Observations Content analysis Focus Groups

Qualitative Research
“There are times we wish to know not how many or how well, but simply how” (Shulman, 1988, p. 7).
Key characteristic: data involves words or images Example:
What are the factors that influence a graduate student’s experience in an online research methods course?
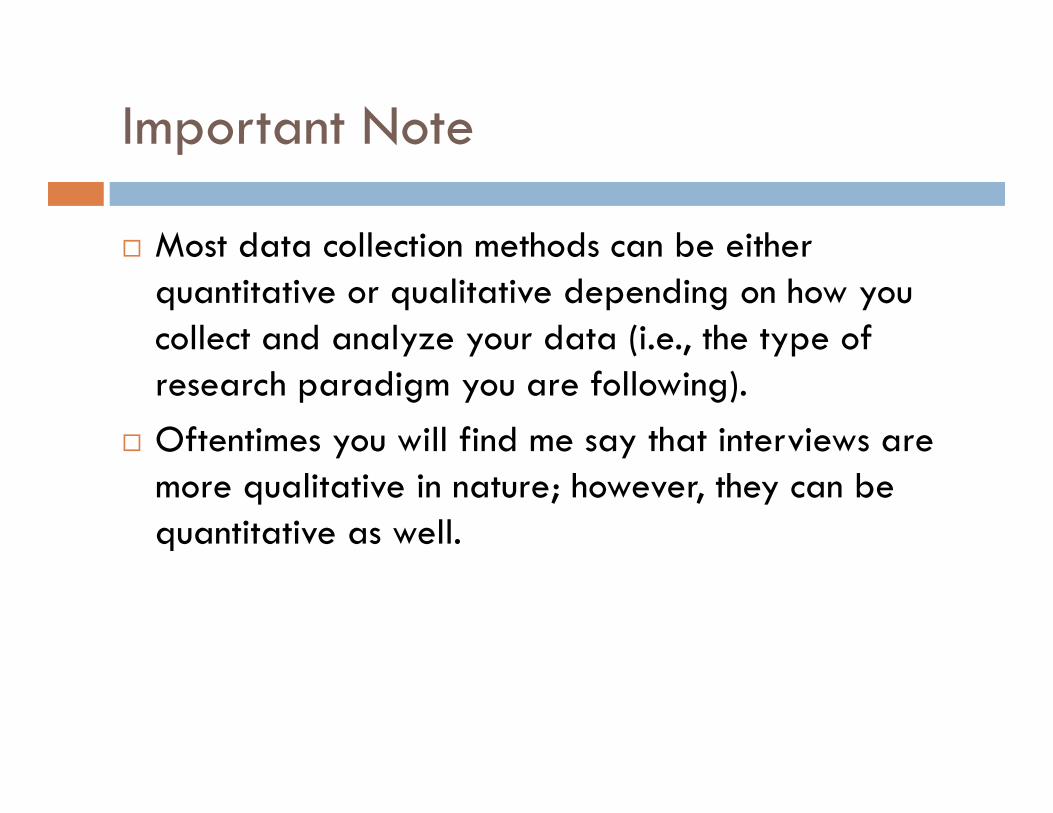
Important Note
Most data collection methods can be either quantitative or qualitative depending on how you collect and analyze your data (i.e., the type of research paradigm you are following).
Oftentimes you will find me say that interviews are more qualitative in nature; however, they can be quantitative as well.

Quantitative Research Designs

Research Design Overview
Experimental Designs Nonexperimental Research Designs
Survey Designs Causal-Comparative Correlational Designs
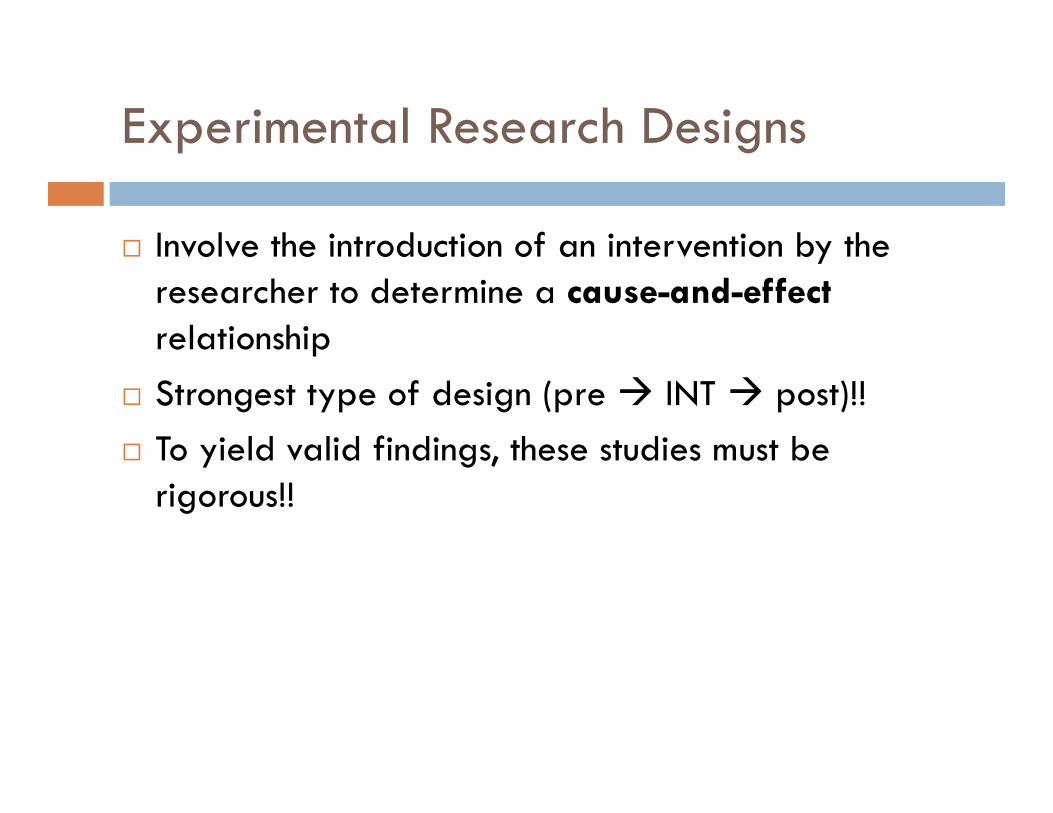
Experimental Research Designs
Involve the introduction of an intervention by the researcher to determine a cause-and-effectrelationship
Strongest type of design (pre INT post)!! To yield valid findings, these studies must be
rigorous!!

Validity Issues in Experimental Research
Can the change in the posttest be attributed only to the experimental treatment that was manipulated by the researcher?
Must be able to control extraneous variables that could have undue influence!!

Internal Validity
Extent to which these variables have been controlled by the researcher so that any observed effect can be attributed to the treatment variable.
Factors affecting internal validity?

Threats to Internal Validity
Attrition/Mortality Instrumentation Statistical Regression History Diffusion Maturation
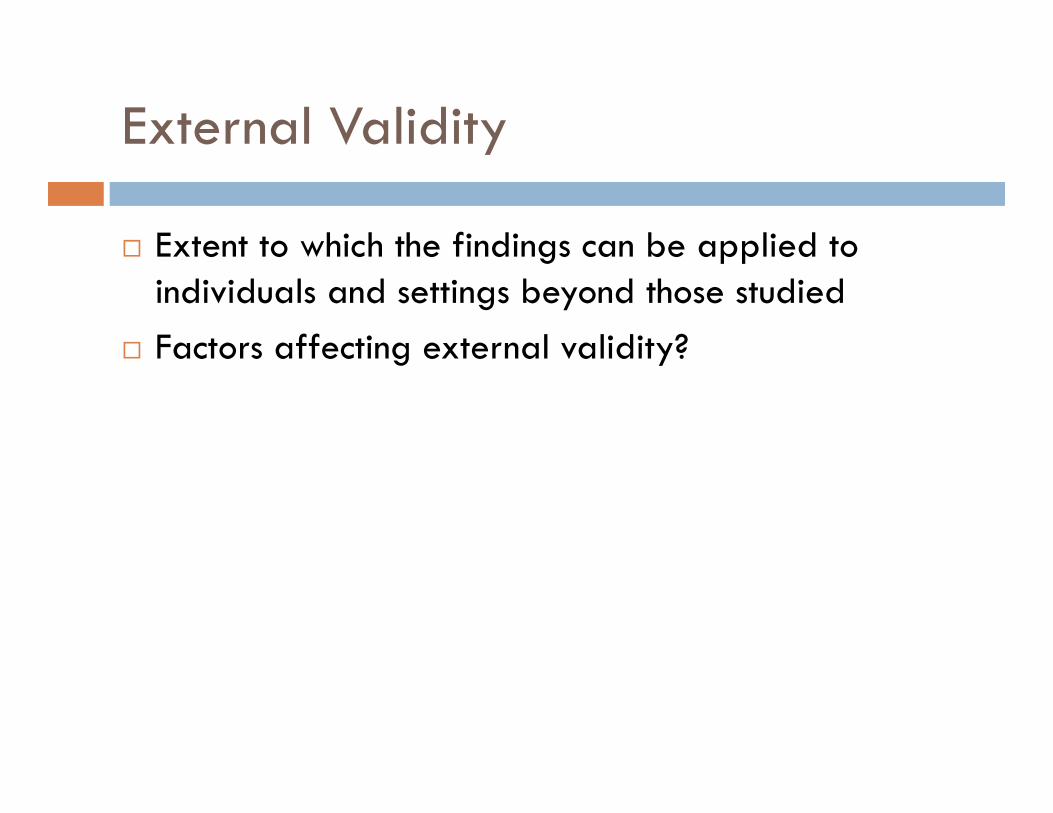
External Validity
Extent to which the findings can be applied to individuals and settings beyond those studied
Factors affecting external validity?

Threats to External Validity
Sample characteristics/selection Stimulus characteristics and settings Treatment variations

Types of Experimental Research Designs
Control-Group Designs Strongest type of design!! Random assignment to experimental and control group Experimental group: pre INT post Control group: pre NO post Example?

Types of Experimental Research Designs (cont’d)
Single-Group Designs When use of a control group is not possible All individuals in the study receive the treatment Design: pre INT post Example? Biggest drawback?

Experimental Research Designs (cont’d)
Quasi-Experimental Research Designs Random assignment of subjects is not possible (e.g.,
using a convenience sample) Biggest problem??? We can control this through our data analysis (e.g.,
including a covariate).
Non-Equivalent Control Group
Often times we want to evaluate the effectiveness of a program that is already in place, and we are not able to construct a treatment and a control group.
For example, suppose we wanted to evaluate the effectiveness of public schools vs. private schools on academic achievement. We looked at the average NAEP math scores for 4th grade students in public and private schools and found the following:
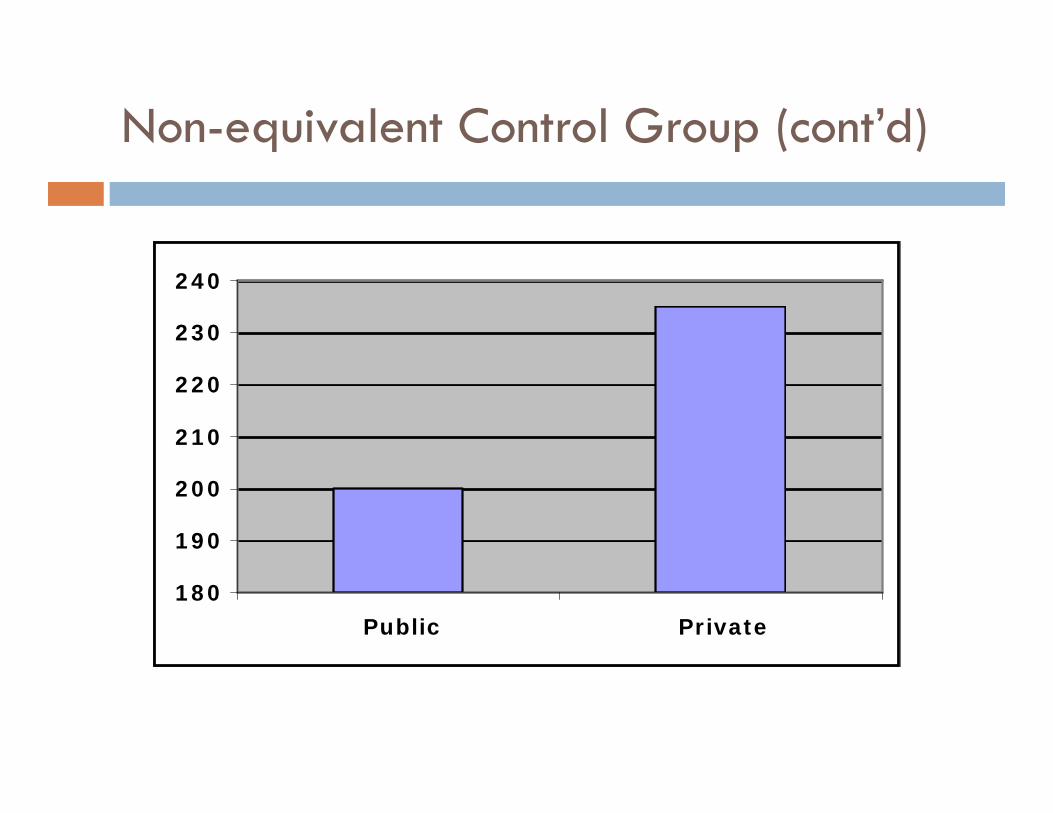
Non-equivalent Control Group (cont’d)
180
190
200
210
220
230
240
Public Private

Non-equivalent Control Group (cont’d)
What happens when we control for an extraneous variable such as SES (i.e., use SES as a covariate).

Non-equivalent Control Group (cont’d)
0
50
100
150
200
250
300
Low SES Mid SES High SES
PublicPrivate

Non-equivalent Control Group (cont’d)
When we compare public and private students of the same SES, we find there is little difference in their achievement. But because there are more high SES students in private schools, the overall comparison is misleading.
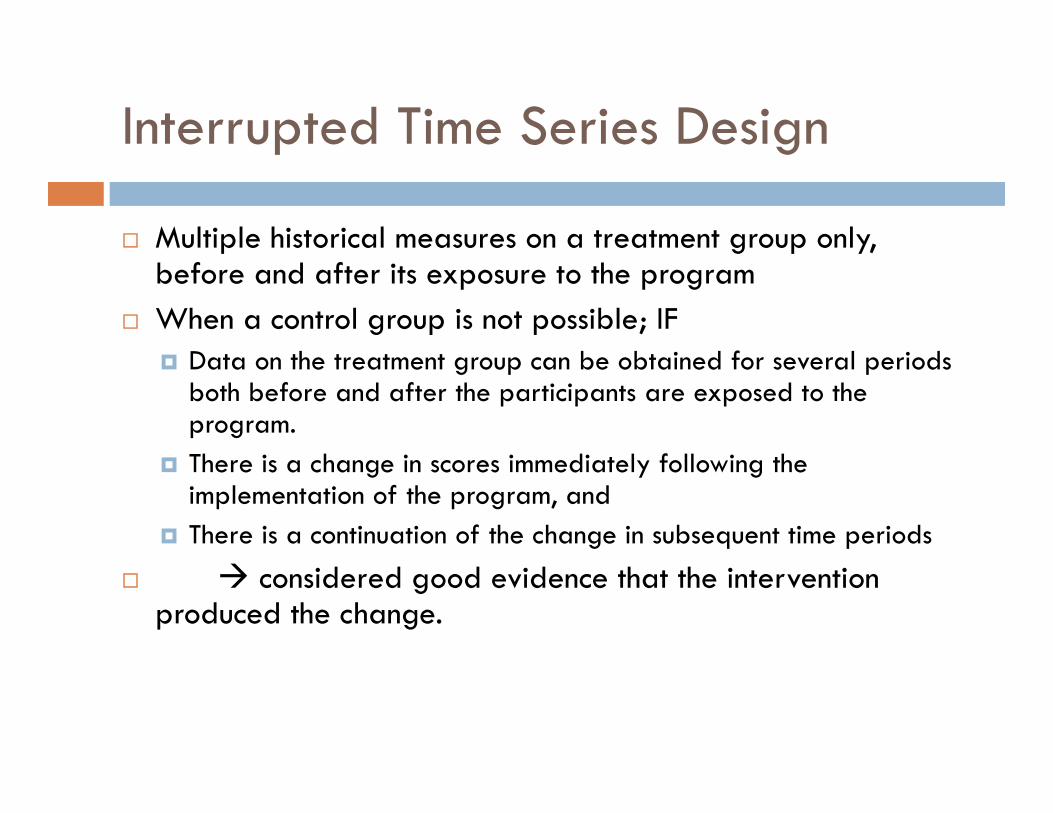
Interrupted Time Series Design
Multiple historical measures on a treatment group only, before and after its exposure to the program
When a control group is not possible; IF Data on the treatment group can be obtained for several periods
both before and after the participants are exposed to the program.
There is a change in scores immediately following the implementation of the program, and
There is a continuation of the change in subsequent time periods
considered good evidence that the intervention produced the change.
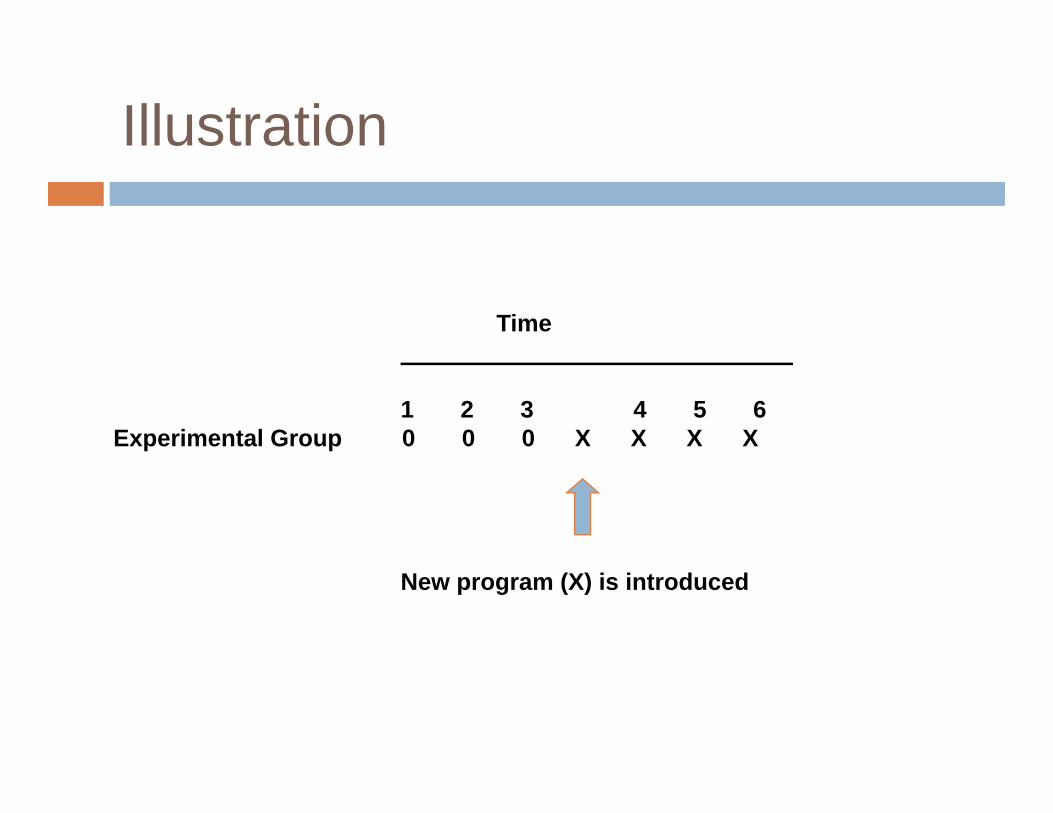
Illustration
Time
1 2 3 4 5 6 Experimental Group 0 0 0 X X X X
New program (X) is introduced

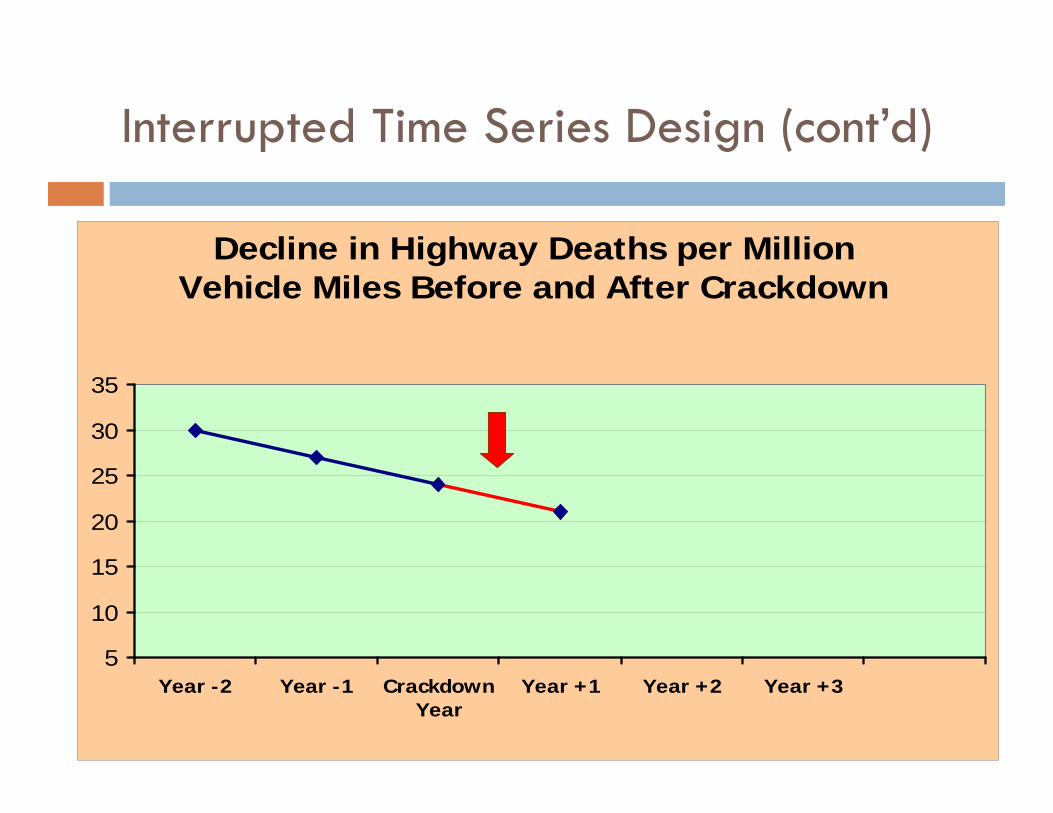
Campbell’s Example of the Interrupted Time Series Design
Decline in Highway Deaths per Million Vehicle Miles Before and After Crackdown
5
10
15
20
25
30
35
Year -2 Year -1 CrackdownYear
Year +1 Year +2 Year +3

Example (cont’d)
Number of highway deaths went down after the Police cracked down; therefore, the crackdown must have been an effective method for decreasing the number of highway deaths.
Or was it? Let’s look at the data more closely.

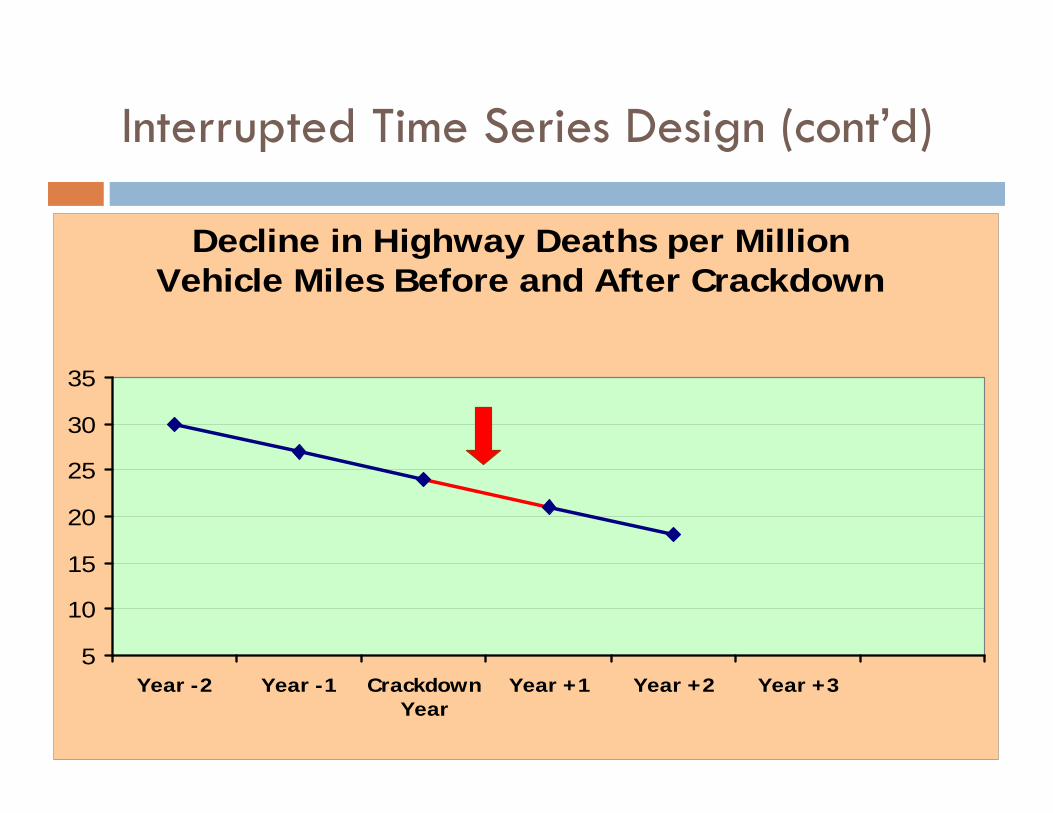
Interrupted Time Series Design (cont’d)
Decline in Highway Deaths per Million Vehicle Miles Before and After Crackdown
5
10
15
20
25
30
35
Year -2 Year -1 CrackdownYear
Year +1 Year +2 Year +3
Interrupted Time Series Design (cont’d)
Decline in Highway Deaths per Million Vehicle Miles Before and After Crackdown
5
10
15
20
25
30
35
Year -2 Year -1 CrackdownYear
Year +1 Year +2 Year +3
Interrupted Time Series Design (cont’d)
Decline in Highway Deaths per Million Vehicle Miles Before and After Crackdown
5
10
15
20
25
30
35
Year -2 Year -1 CrackdownYear
Year +1 Year +2 Year +3
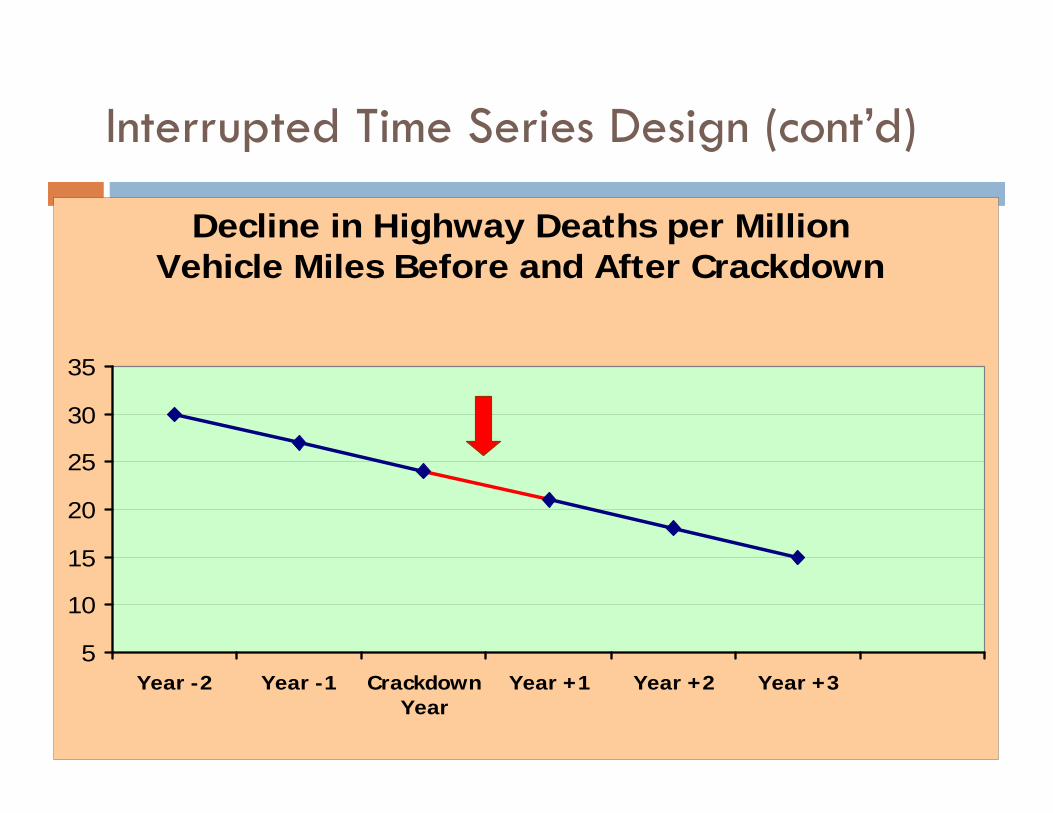
Interrupted Time Series Design (cont’d)
Decline in Highway Deaths per Million Vehicle Miles Before and After Crackdown
5
10
15
20
25
30
35
Year -2 Year -1 CrackdownYear
Year +1 Year +2 Year +3

Example (cont’d)
The trend in the data suggests the number of highway deaths were decreasing steadily anyway and that the crackdown had no effect on the number of deaths.

Simple Before-After
0102030405060
1 2 3 4 5 6
Program
Scores
Testing Times
Time Series Showing Program Impact
0
20
40
60
1 2 3 4 5 6
Program
Time Series Showing No Program Impact
020406080
1 2 3 4 5 6
Program

Experimental Research Designs (cont’d)
Factorial Designs The researcher determines the effect of two or more
IVs (factors) on a DV Example: Effects of home language and curriculum on
reading comprehension.
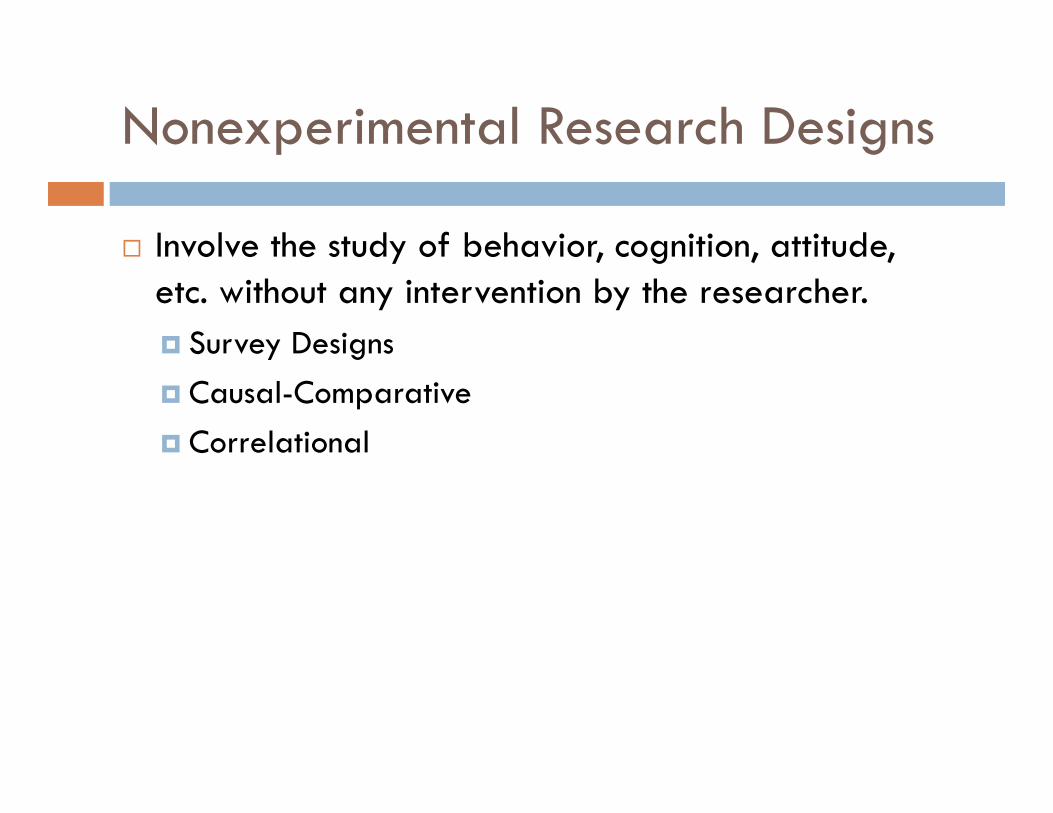
Nonexperimental Research Designs
Involve the study of behavior, cognition, attitude, etc. without any intervention by the researcher. Survey Designs Causal-Comparative Correlational

Survey Designs
Procedures in quantitative research in which investigators administer a survey to a sample or to the entire population of people in order to describe the attitudes, opinions, behaviors, or characteristics of the population.
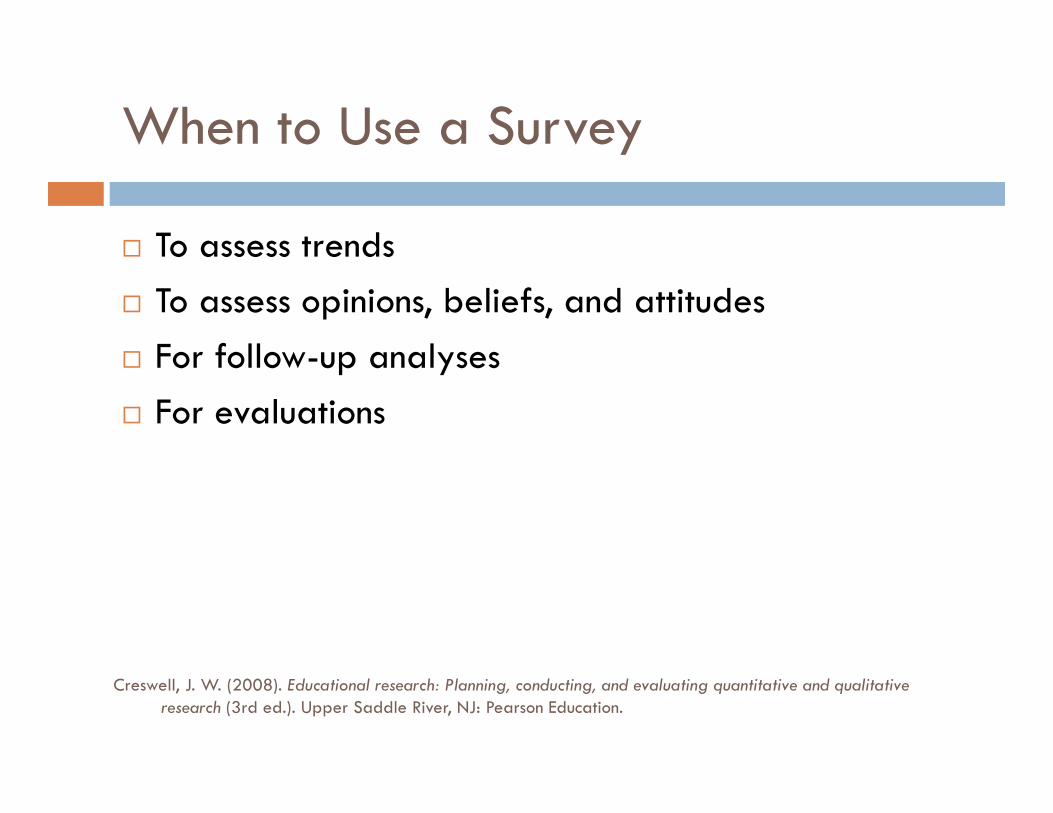
When to Use a Survey
To assess trends To assess opinions, beliefs, and attitudes For follow-up analyses For evaluations
Creswell, J. W. (2008). Educational research: Planning, conducting, and evaluating quantitative and qualitative research (3rd ed.). Upper Saddle River, NJ: Pearson Education.

Common Research Questions for Surveys
The most common research questions in survey research address participants’ perceptions, attitudes, or opinions, using descriptive, comparative, or relationship questions. Example 1: What are teacher’s attitudes towards inclusion? Example 2: What is the difference in attitudes toward
inclusion between teachers who have had training in special education and those who have not had training in special education?
Example 3: What is the relationship between teachers’ perceptions of inclusion and students’ academic achievement?

Common Research Questions for Surveys (cont.)
Research questions in survey research also assess trends in the population. How have college presidents’ beliefs about state
funding and accountability changed from 2001 to 2010?
Surveys can also be used in other types of research, such as program evaluation. Have students’ attitudes towards writing changed as a
result of a writing-across-the-curriculum program?

Determine the Survey Design
Types of Survey Designs Cross-sectional Longitudinal
Creswell, J. W. (2008). Educational research: Planning, conducting, and evaluating quantitative and qualitative research (3rd ed.). Upper Saddle River, NJ: Pearson Education.

Cross-Sectional Surveys
The researcher collects data at one point in time. Types of information gathered
Information on current attitudes, beliefs, opinions, or practices of individuals
Comparison of two or more educational groups in terms of attitudes, beliefs, opinions, or practices
Measurement of community needs for educational services as they relate to programs, courses, facilities projects, or involvement in community planning.
Evaluation of a program in order to provide useful information to decision makers
Large-scale assessment of students or staff (national or state-wide)
Creswell, J. W. (2008). Educational research: Planning, conducting, and evaluating quantitative and qualitative research (3rd ed.). Upper Saddle River, NJ: Pearson Education.

Longitudinal Surveys
Involves collecting data about trends with the same population, changes in a cohort group or subpopulation, or changes in a panel group of the same individuals over time.
Types Trend: Changes in a population over time Cohort: Changes in a subpopulation group identified
by a common characteristic over time Panel: Changes in the same people over time
Creswell, J. W. (2008). Educational research: Planning, conducting, and evaluating quantitative and qualitative research (3rd ed.). Upper Saddle River, NJ: Pearson Education.

Nonexperimental Research Designs (cont’d)
Causal-Comparative Purpose is to compare two or more groups in order to
explore possible causes or effects of a phenomenon Example: Effects of type of classroom (inclusion vs. non-
inclusion) on academic achievement Ex-post facto designs most common – use of archival
data

Nonexperimental Research Designs (cont’d)
Correlational Purpose is to measure the degree of association (or
relationship) between 2 or more variables or sets of scores.
Example: Relationship between age and satisfaction in an online course.

Characteristics of a Correlation
Scatterplots can help us describe both the direction and the strength of the correlation
The direction of a correlation can either be positive or negative
The strength of a correlation can range from weak (or none = 0) to strong (perfect = I1I)

Scatterplot of a Positive Correlation
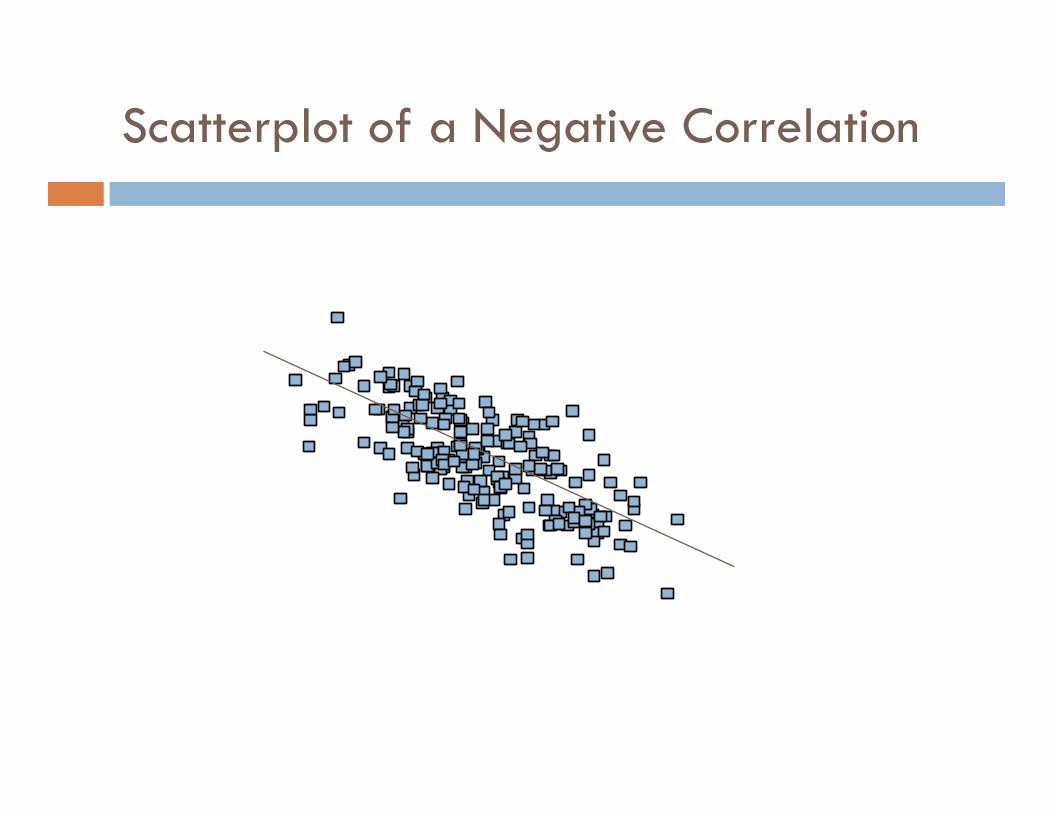
Scatterplot of a Negative Correlation
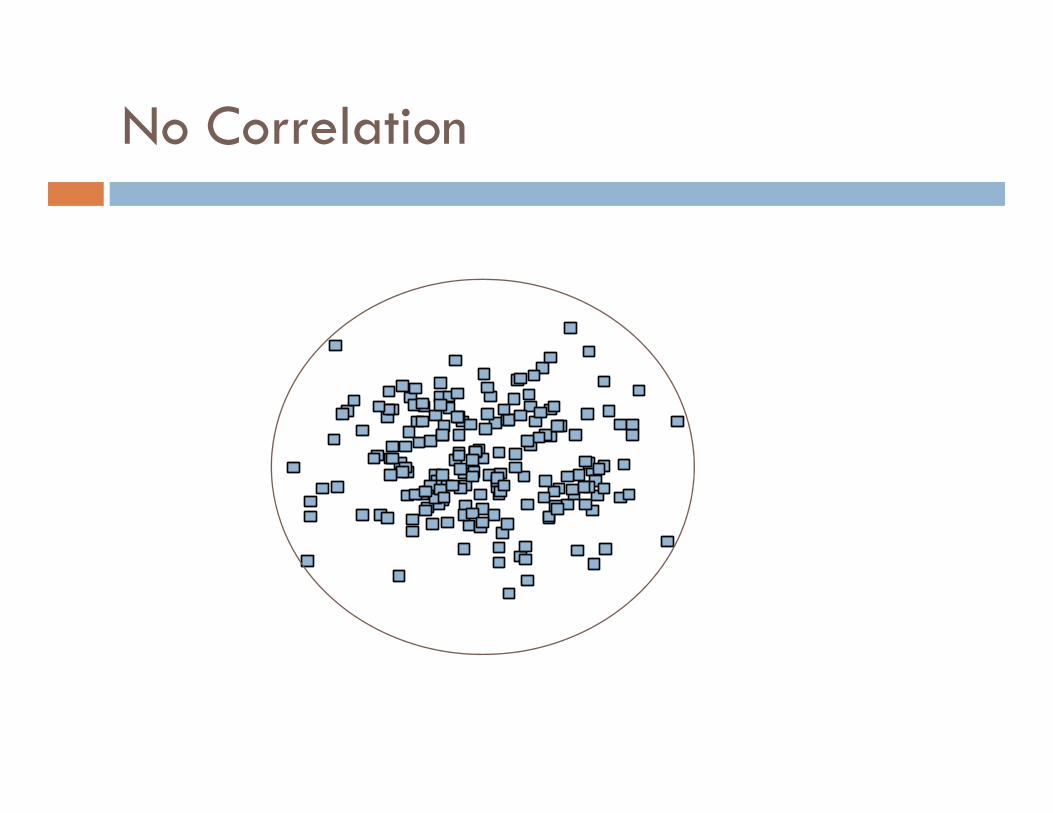
No Correlation

Weak Correlation

Strong Correlation

Perfect Correlation

Correlational Designs
Explanatory Researchers attempt to explain the relationship
between two or more variables Example: What is the relationship between student
engagement and number of posts in an online course?
Predictive Researchers attempt to predict the relationship
between two or more variables Example: What is the online course variables
significantly predict student engagement?