a proof-of-principle study of multi-site real-time
TRANSCRIPT

A proof-of-principle study of multi-sitereal-time functional imaging at 3T and7T: Implementation and validationSebastian Baecke1, Ralf Lutzkendorf1, Johannes Mallow1, Michael Luchtmann2, Claus Tempelmann3,Jorg Stadler4 & Johannes Bernarding1
1Institute for Biometry and Medical Informatics, Otto-von-Guericke-University Magdeburg, 2Department of Neurosurgery, Otto-von-Guericke-University Magdeburg, 3Department of Neurology, Otto-von-Guericke-University Magdeburg, 4Leibniz Institute forNeurobiology Magdeburg.
Real-time functional Magnetic Resonance Imaging (rtfMRI) is used mainly for neurofeedback or forbrain-computer interfaces (BCI). But multi-site rtfMRI could in fact help in the application of newinteractive paradigms such as the monitoring of mutual information flow or the controlling of objectsin shared virtual environments. For that reason, a previously developed framework that provided anintegrated control and data analysis of rtfMRI experiments was extended to enable multi-site rtfMRI.Important new components included a data exchange platform for analyzing the data of both MRscanners independently and/or jointly. Information related to brain activation can be displayedseparately or in a shared view. However, a signal calibration procedure had to be developed andintegrated in order to permit the connecting of sites that had different hardware and to account fordifferent inter-individual brain activation levels. The framework was successfully validated in aproof-of-principle study with twelve volunteers. Thus the overall concept, the calibration of grosslydiffering signals, and BCI functionality on each site proved to work as required. To model interactionsbetween brains in real-time, more complex rules utilizing mutual activation patterns could easily beimplemented to allow for new kinds of social fMRI experiments.
Real-time functional magnetic resonance imaging (rtfMRI) has recently become the subject of increasedinterest primarily due to its use for brain-computer interfaces (BCIs) and neurofeedback techniques. InMR-based neurofeedback experiments, volunteers receive information about activation of specific areas of
their brains in order to record their ability to regulate those areas based on the feedback they receive1–4. Thisinformation is provided in real-time by an online statistical analysis of change in the so-called BOLD (bloodoxygen level dependent) signal, which serves as an indirect measure of neuronal activation. Because of theunderlying physiological processes, real-time fMRI has a natural delay of several seconds, but despite thislimitation, the spatial resolution is excellent and thus enables detection of activation even in subcortical structuressuch as the hippocampus or the amygdala. In addition to being used in neurofeedback, rtfMRI was recently usedto monitor online the internal mental states that encode for decision making5 or bi-stable perceptions6. Real-timefMRI can also be used by a subject to communicate with other humans using interfaces to machines or controllingdevices such as protheses7,8. This application is called a brain-computer interface (BCI), a process that wasestablished earlier using EEG techniques9–11. One important goal of many experiments in the area of BCIs isto develop neuroprosthetics for patients with severe illnesses such as locked-in syndrome7,8.
But until now, rtfMRI experiments have been restricted to one volunteer at a time lying in a scanner.Interestingly, EEG (electroencephalography)10–12, and more recently fNIRS (functional near-infrared spectro-scopy)13–15, have been successfully employed for real-time experiments of coupled brains. Though there were asmall number of fMRI experiments that were realized by scanning two volunteers at the same time, the dataacquired in those experiments had to be analyzed offline16–21. The main goal of these few studies was the analysisof brain activation during the interaction of the volunteers, which is an important research field for social fMRI orneuro-economic studies. However, fMRI studies that investigate social processes between interacting partners arein most cases conducted under conditions where subjects are seldom in direct contact with each other. Rather,they react to or interact with stimuli presented in a fixed context by another participant or even a computer. Dataare then evaluated offline to analyze activated brain networks22–25. But designing experiments to examine the full
OPEN
SUBJECT AREAS:
SOCIAL BEHAVIOUR
NEUROINFORMATICS
BRAIN-MACHINE INTERFACE
Received8 August 2014
Accepted19 January 2015
Published12 February 2015
Correspondence andrequests for materials
should be addressed toS.B. (sebastian.
SCIENTIFIC REPORTS | 5 : 8413 | DOI: 10.1038/srep08413 1

potential of dynamic interactions (e.g., subjects adapting their ownstrategies when they receive specific signals from partners) requires adifferent approach. The main prerequisite for that is the analysis ofdata in real-time and the subsequent immediate use of those resultswithin the experiment.
So far, the only simultaneous, multi-site rtfMRI experiments tohave been reported is the single conference contribution by Goebelet al.26 (as well as some preliminary results of this study from our owngroup27,28). The main obstacles to this construct are surely the extens-ive technical effort involved in connecting two or more scanners, theguarantee that BOLD signals can be compared between severalvolunteers, the exchange of analyzed data during ongoing measure-ment, and the triggering of dynamic events according to simultan-eous complex information from different volunteers.
Thus the goal of our study was to establish a flexible environmentfor connecting scanners, even those in remote locations and withdiffering hardware features, in order to allow more researchers torealize new classes of experiments when monitoring interactingbrains in real-time. Multi-site rtfMRI could allow us to investigatenew paradigms, such as changes of strategy in mutual interactions orcontrolling objects in shared virtual environments. However, thediffering features of each scanner’s hardware and the variations ininter-individual brain activation levels required a new strategy inorder for us to be able to compare acquired signals.
To that end, we adapted a previously developed framework29 inorder to allow for multi-site rtfMRI, not just one fixed configuration.We also wanted to establish a flexible system that would allow forvarying experimental settings in which we could include more scan-ners and controlling objects independently or jointly. Results weredisplayed separately or in a shared view to each participant. Rules forallowing or disallowing mutual interaction were implemented inseparated modules to enable easy and quick adaption to changingexperimental conditions.
The new framework also had to be designed to support con-nections of remote scanners via internet (direct connections werenot considered to be a forward-looking solution) since only thisinternet connection would allow wider application (sites with sev-eral adjacent scanners are quite rare). This in turn required integ-rating a signal calibration procedure because scanners at differentsites would normally exhibit varying signal properties like a dif-ference in field strengths, coil characteristics, or other machine-dependent factors. The experimental design also had to allow fordiffering abilities in volunteers to reach a certain percentage ofbrain activation, especially when different field strengths areinvolved.
Here we report on the concept and its validation in a proof-of-principle study with twelve volunteers (six each on 3T and 7T). Awell-known motor paradigm had to be performed on both scanners.Subjects can much better control their motor actions and voluntarilyreproduce them than they can regulate their emotional brain areas.Prior to the main experiment, brain activation of each volunteer wasanalyzed in real-time, and the results were used to calibrate the signalon each site with respect to the maximum achievable individual brainactivation (calibration experiment). To validate this calibration pro-cedure, we hypothesized that the outcome of the subsequent mainexperiment, in which the motor activity level had to be varied inorder to put a virtual object at predefined locations on the screen,would be the same at both sites. To test the full functionality of theframework, three different tasks were measured in the main experi-ment. The first task - without any information exchange betweenparticipants—validated the calibration procedure, while two othertasks included information exchange between partners and a mutualdependence of each on the performance of the partner for success.The focus of this report is the validation of the concept and thecalibration procedure, that is, the experiment without mutualinformation flow and dependencies. A more extended analysis of
influences of information flow and mutual dependencies will bepresented in a forthcoming publication.
ResultsThe new extended framework was successfully implemented. Theoverall workflow of the calibration procedure and the main measure-ment ran as required by the concept. The individual cortical activa-tions from the motor task were determined in real-time whenrunning the functional localizer and the results were successfullyused for calibrating the activity of each volunteer for the subsequentmain measurement. In the main experiment, subjects were able tocontrol the position of an object by varying the activation strength oftheir sensorimotor cortex (SMC). In the section of the experimentthat involved no mutual information flow, 57% of all blocks weresuccessfully completed. In the section that did involve mutual flow ofinformation, the success rate dropped to an average of 36%.
As we had expected, the off-line analysis of the calibration experi-ment revealed that the amplitudes of the hemodynamic response ofthe contra-lateral sensorimotor cortex varied to a certain degreewithin each group (Figures 1a and b). While the mean hemodynamicresponse functions (HRF) when averaged among the volunteers ofeach group were about 60% higher for 7T than for 3T (Figure 1c), theamplitudes of three individual responses in the 7T group were in therange of the HRF amplitudes of the 3T group. This demonstrates thata direct comparison of activation amplitudes between differentvolunteers may be difficult to effect or may produce misleadingresults.
The differences for each subject for the two activation levels in themain experiment are shown in Figure 1d. These differences werefurther analyzed to ensure that the calibrated signals at differentmagnetic field strengths led to comparable results. Using a mixedmodel to allow for correlation of the data, we found a highly signifi-cant difference (p , 0.0001) between weak and strong tapping(Figure 1d). Typical changes in activation patterns related to thestrong and weak tapping task for two volunteers can be seen inFigure 2.
The percentage of successfully performed tasks per volunteer of 3Tand 7T group members has been compared using an ANOVA forrepeated measurements, with the field strength as a between-subjectfactor and the three tasks as a within-subject factor. There was nooverall effect for field strength (p 5 0.514), but a strong effect fortasks (p 5 0.001, Greenhouse-Geisser correction), without inter-action between the two factors (p 5 0.348, Greenhouse-Geisser cor-rection). Thus, there is no advantage determining success for eitherone of the groups. All statistical analyses were conducted using SAS(SAS/STATH 9.2, SAS Institute Inc.).
The well-known typical activation patterns of standard finger-tapping paradigms can be clearly detected here. Besides the overallincrease of activation in many parts of the cortical sensorimotornetwork (contralateral and ipsilateral SMC, supplementary motorarea [SMA]), there was increased activation in other areas, such asthe putamen and the thalamus, that was also clearly detectable with ahigh statistical significance (p , 0.005, FDR corrected) (see Table 1and Figure 3). The activation was more pronounced at 7T in bothcontra- and ipsilateral SMC and bilaterally in the thalamus, whileSMA and both putamen exhibited a somewhat greater activation at3T.
DiscussionIn this proof-of-principle study, the implementation of the conceptof performing multi-site, real-time fMRI on scanners with differentfield strengths was successfully realized and validated. Using a simplebut reliably controllable and reproducible motor task, we could dis-tinguish both activation levels with the implemented calibration andsignal detection framework. With the use of relative rather thanabsolute signal changes, the modulation of the motor cortex activa-
www.nature.com/scientificreports
SCIENTIFIC REPORTS | 5 : 8413 | DOI: 10.1038/srep08413 2
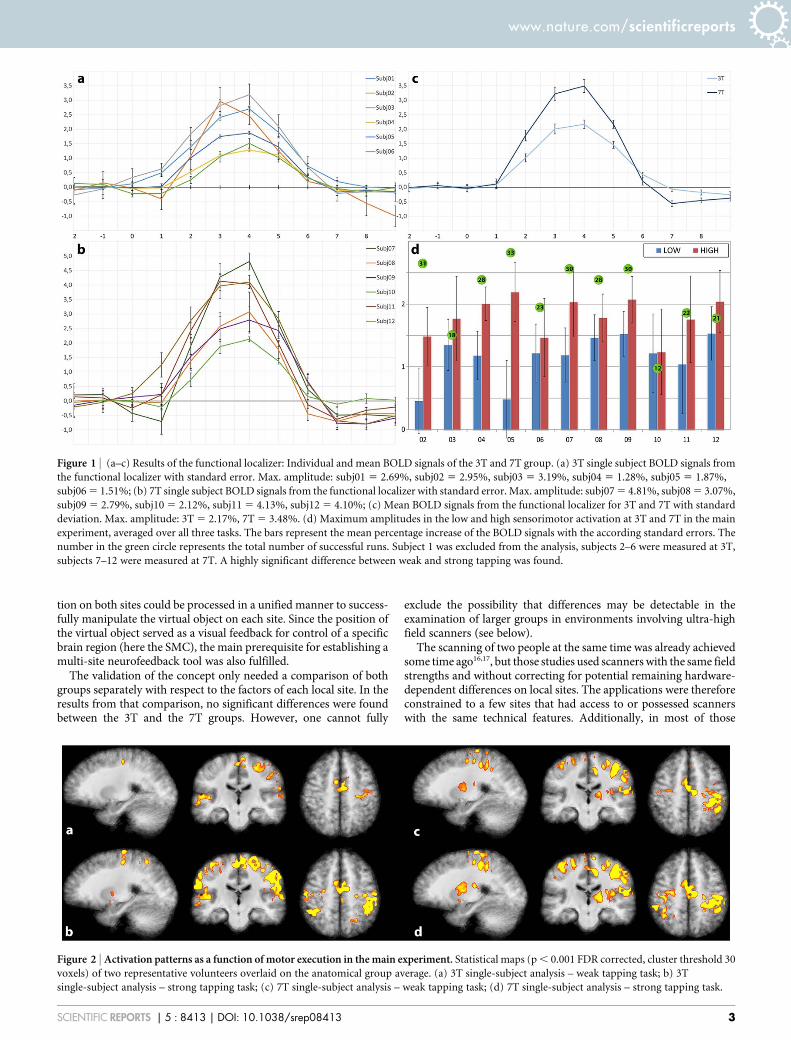
tion on both sites could be processed in a unified manner to success-fully manipulate the virtual object on each site. Since the position ofthe virtual object served as a visual feedback for control of a specificbrain region (here the SMC), the main prerequisite for establishing amulti-site neurofeedback tool was also fulfilled.
The validation of the concept only needed a comparison of bothgroups separately with respect to the factors of each local site. In theresults from that comparison, no significant differences were foundbetween the 3T and the 7T groups. However, one cannot fully
exclude the possibility that differences may be detectable in theexamination of larger groups in environments involving ultra-highfield scanners (see below).
The scanning of two people at the same time was already achievedsome time ago16,17, but those studies used scanners with the same fieldstrengths and without correcting for potential remaining hardware-dependent differences on local sites. The applications were thereforeconstrained to a few sites that had access to or possessed scannerswith the same technical features. Additionally, in most of those
Figure 1 | (a–c) Results of the functional localizer: Individual and mean BOLD signals of the 3T and 7T group. (a) 3T single subject BOLD signals from
the functional localizer with standard error. Max. amplitude: subj01 5 2.69%, subj02 5 2.95%, subj03 5 3.19%, subj04 5 1.28%, subj05 5 1.87%,
subj06 5 1.51%; (b) 7T single subject BOLD signals from the functional localizer with standard error. Max. amplitude: subj07 5 4.81%, subj08 5 3.07%,
subj09 5 2.79%, subj10 5 2.12%, subj11 5 4.13%, subj12 5 4.10%; (c) Mean BOLD signals from the functional localizer for 3T and 7T with standard
deviation. Max. amplitude: 3T 5 2.17%, 7T 5 3.48%. (d) Maximum amplitudes in the low and high sensorimotor activation at 3T and 7T in the main
experiment, averaged over all three tasks. The bars represent the mean percentage increase of the BOLD signals with the according standard errors. The
number in the green circle represents the total number of successful runs. Subject 1 was excluded from the analysis, subjects 2–6 were measured at 3T,
subjects 7–12 were measured at 7T. A highly significant difference between weak and strong tapping was found.
Figure 2 | Activation patterns as a function of motor execution in the main experiment. Statistical maps (p , 0.001 FDR corrected, cluster threshold 30
voxels) of two representative volunteers overlaid on the anatomical group average. (a) 3T single-subject analysis – weak tapping task; b) 3T
single-subject analysis – strong tapping task; (c) 7T single-subject analysis – weak tapping task; (d) 7T single-subject analysis – strong tapping task.
www.nature.com/scientificreports
SCIENTIFIC REPORTS | 5 : 8413 | DOI: 10.1038/srep08413 3

experiments, data were not analyzed in real-time and individualactivation differences were only taken into account in the post-experiment statistical analysis. Exchange of information occurrednot with respect to brain activation but with respect to the resultsof the tasks. For example, Fliessbach et al. transferred the decisionsmade by one partner to the other partner17.
Our experimental setup provides features not reported until nowthat may allow a larger community to perform new classes of experi-ments by connecting several scanners: (1) the successful realizationof multi-site real-time fMRI analysis; (2) the use of relative instead ofabsolute signals, which can take into account different scanner char-acteristics and different individual brain activation during the sametask; (3) an internet-based concept that allows one to connect scan-ners even if they are distant from each other or located in separatedfirewall-secured networks; (4) the extension of unified experimentcontrol and data analysis in real-time30 to include multi-site real-timefMRI; and (5) a shared virtual platform integrated into the frame-work that allows experiments to be conducted with real-timeexchange of information or mutual interaction.
But anyone planning to implement this kind of challenging, multi-site infrastructure needs to consider several points. Connecting two(or even more) scanners is quite demanding if the MR-scanners arelocated in medical or medical-related research environments wheredata-protection requirements are very restrictive. Another problem
may arise even with scanners that have the same field strengths,because elements of the technical environment (shims, coils, hard-ware specifications, sequence parameters, etc.) will always lead tosomewhat different MR signals, even if the same person, positionedsuccessively in different scanners, is exhibiting the same physio-logical activation in each. This discrepancy requires a calibrationprocedure ensuring the comparability of signals, which, however,seems not to have been reported so far. Our results showed that usingcalibrated relative signal changes instead of absolute signals allows adirect comparison of the 3T group and the 7T group, at the same timeaccounting for individual differences in brain activation. No signifi-cant differences in the number of successful runs were found betweenthe two groups. Thus comparing relative signal changes makes multi-site rtfMRI feasible even in a heterogeneous environment withgrossly differing BOLD signals. Despite the successful calibrationprocedure, though, additional aspects have to be taken into accountwhen comparing BOLD signals from high-field and ultra-high-fieldscanners, especially when going from 3T to 7T. Many factors have tobe considered that may alter or counteract the expected signalincrease and detectable activation patterns: the increased fieldinhomogeneity at 7T; varying coil architectures and reconstructionalgorithms; resolution and limitations due to increased specificabsorption rate (SAR); geometric distortions; and signal losses dueto increased susceptibility artefacts and decreased T2* relaxation31.
Table 1 | Results of the random effects group analysis for the single tapping condition. Talairach coordinates (X, Y, Z) of cluster center, clustersizes (c) and the mean t-value (T) of each cluster (subject 1 was excluded, for details see text)
anatomic region3T [p , 0.005, FDR corrected] 7T [p , 0.005, FDR corrected]
coordinatesc T
coordinatesc T
X Y Z X Y Z
RH SMC 38 226 50 (80) 8.47 38 227 50 (227) 9.09LH SMC - 235 216 57 (38) 7.93SMA 1 22 48 (98) 9.09 2 213 47 (88) 7.80LH Putamen 226 21 8 (115) 9.13 227 0 10 (110) 7.75RH Putamen 25 23 6 (114) 8.37 30 27 9 (93) 8.86LH Thalamus 217 213 16 (8) 9.86 213 216 6 (24) 8.29RH Thalamus 11 25 15 (5) 6.59 15 216 7 (35) 8.68
Figure 3 | Representative slices of the random effects analysis of the group data for both tapping conditions superimposed on the averaged T1-weighted images of all eleven subjects (radiologic convention). The slices display the main parts of the sensorimotor system (primary contralateral and
ipsilateral SMC, bilateral basal ganglia and supplementary motor area (SMA). Upper row: 3T (without subject 1 for details s. text), p , 0.005, FDR
corrected. Lower row: 7T, p , 0.005, FDR corr. (cerebellum was not scanned at 7T). For a detailed cluster description, see Table 1.
www.nature.com/scientificreports
SCIENTIFIC REPORTS | 5 : 8413 | DOI: 10.1038/srep08413 4

In addition to these rather technical factors, increased static andphysiologic noise contributions31 (mainly pulsatile-induced motionartefacts) and severe susceptibility-induced signal losses (especiallywhen scanning frontal, caudal or inferior temporal brain regions)have to be taken into account, specifically when trying to monitor ormodulate emotion-related brain structures such as the nucleusaccumbens or the amygdala. It has been demonstrated that physio-logical noise can be corrected retrospectively at 7T32, but real-timeimplementation will require additional adaption of the concept. Allfactors may reduce statistical significance and thus counteract tosome degree the signal enhancement gained at 7T. While the signalat 7T is still considerably higher than at 3T (Figures 1–3) for thesensorimotor cortex (where geometric distortions are negligibleusing standard EPI sequences with phased-array coils and parallelimaging), subcortical structures may exhibit greater signal losses dueto increases in susceptibility and pulsatile motion artefacts. Thisdifference can be seen in Table 1, where basal ganglia exhibit com-parable or somewhat higher T-values at 3T than at 7T, yet the num-ber of activated voxels is still greater at 7T, except for the rightthalamus and the putamen. Another point to take into considerationis the increased SAR at higher field strength. But reducing the flipangle may still allow to acquire more slices or to increase the reso-lution while remaining below the SAR limit. At 3T, this strategy wasshown to yield good results for fMRI experiments33, but the accom-panying optimization of sequence parameters has yet to be deter-mined for 7T. Similar arguments apply for the resolution, asdiscussed in Olman & Yacoub31. In our experiment, we wanted tocompare similar resolutions between 3T and 7T even though the 7Tsignal may have been degraded to some degree due to de-phasingwithin the 4 mm slice. However, increasing the resolution increasesthe time required for reconstruction (especially when using phased-array coils with 24 or more elements) and data analysis. For ourproof-of-principle study, data acquisition and processing time waswell within TR of 2 s for a 64 3 64 matrix and 31 slices (3T). Higherin-plane resolution would require fewer slices or applying fasteralgorithms as well as using high-performance computing (e.g., pro-vided by GPU cluster)34. Optimizing sequences, like using 3D insteadof 2D EPI sequences, might also prove advantageous35.
A more difficult problem when comparing spatial distribution ofactivation is the BOLD signal originating at different field strengths.At 3T, the BOLD signal results mainly from larger draining veins,thus being mostly of intravascular origin, while at increased fieldstrengths, the T2 relaxation time of blood decreases, thereby leadingto increased extravascular susceptibility effects around vessels36. Thiseffect may be important since vascular architecture of the brainusually differs from individual to individual as well as from regionto region within the same brain.
Motion artefacts are another major obstacle in real-time fMRI.However, activation is usually displayed in real-time to the experi-ment’s supervisor, who can then check the data quality during theexperiment, thus allowing for a repeat of measurement if increasednoise or artificial signals resulting from increased motion aredetected online (e.g., on the borders of the brain and cerebrospinalfluid).
In addition to these technical and physiological aspects, someperception-related and cognitive factors have to be considered.Our results show that, despite a subject’s good voluntary control ofmotor activation, a certain variability of the signals in the SMCremained (Figure 1). An explanation for this result may be the sub-ject’s loss of attention and concentration (the experiment requires avery high level of concentration to maintain a constant tappingstrength reproducible with small variances. Although repetitiveand simple tasks may increase the risk of attention loss, they mayalso serve to check to what degree a person undergoing a real-timeexperiment may be able to keep a focused attention and concentrateat a high level as well as to recruit the required motor memory and
planning aspects. In a multi-person experiment, the attention loss ofone participant may affect that participant’s partner, thus decreasingthe validity of the experiment. It may therefore be advantageous todevelop methods for determining online the degree of attentionbeing exhibited. In a multi-person experiment, mutual informationflow or the dependence of one performance on another may affectthe outcome of an experiment. In our experimental design, forexample, if one subject reached the target position (which wouldbe a success as a single participant) but the partner missed the goal,that run was deemed unsuccessful (e.g., in the cooperation con-dition). A loss solely due to the partner’s performance may in factaffect the motivation of the subject. We have observed drops from57% success in single runs to 36% success in social runs, which mayreflect that specific influence. Future experiments will have to analyzethese factors in more detail, but it seems evident that in light of them,initial experimental designs and the subsequent analysis of real-timeinterdependencies of participants may require new approaches.
Also in terms of future experiments, additional brain regions mayneed to be included into real-time analysis for modulating a maineffect. For example, the activation of the SMA or the ipsi-lateral SMA(Figure 3) could provide additional information about modulation ofmain activation in the contra-lateral SMC since the SMA plays animportant role in more complex motor actions such as control ofmovements or synchronization of both hemispheres37,38. Thus theSMA could serve as a measure of the degree of synchronicity orcomplexity of movements. Similar aspects may be important whenincluding the basal ganglia or memory- or emotion-related brainareas (e.g., the activation of the thalamus could serve as a modulatingfactor resulting from its role in somatosensory circuits, includingadjustments of motor activation after positive or negative rewards39).The insula provides information about motor control40 and self-awareness41, while the putamen, being part of nuclei lentiformes,regulates movements42 and is involved in learning processes43. Allof these processes contribute to learning to adjust motor activation inreal-time, which could be of special relevance to using real-time fMRIin neurofeedback for rehabilitation or for controlling externaldevices in handicapped people. Motivation and emotion will alwaysplay a very important role for subjects performing in real-timeexperiments or using brain-machine interfaces.
From a technical point of view, integration of the signals of severalbrain regions could be accomplished by applying real-time patternanalysis2,6,44. This approach will require a set of calibration factors(one for each region) that will be implemented in future versions ofour framework.
In summary, a multi-site rtfMRI environment was implementedand validated with a reliable motor activation paradigm for onlinecontrol of virtual objects. These settings will be used for subsequentexperiments performed with real-time, multi-site social fMRI (suchas strategy changes in real-time), thereby enabling many new andinteresting experiments related to social and economic issues. Otherapplications may include joint manipulations of external devices orcollaborate actions within a shared virtual reality environment allow-ing to operate the system as a Hyper-BCI45 or to investigate socialeffects such as synchronization effects between brains18.
MethodsSubjects. Twelve healthy male adults (25.1 6 3.1 years, 11 right-handed) participatedin this study after giving their written consent. One subject was excluded from dataanalysis due to incomplete data logging in the main experiment. To avoid cross-gender effects only male volunteers were examined46. The study was approved by thelocal Ethics Committee of the Otto-von-Guericke-University Magdeburg accordingto the principles of the Declaration of Helsinki.
Technical Infrastructure. The study was performed on two whole-body MRscanners both equipped with a whole body gradient system (Magnetom 3T Trio;Magnetom 7T; Siemens, Germany). The scanners were located in different buildingsbelonging to different institutions and different networks. On both scanners, an 8-channel phased-array head coil was used for imaging. To transfer each MR image
www.nature.com/scientificreports
SCIENTIFIC REPORTS | 5 : 8413 | DOI: 10.1038/srep08413 5

volume set already during image acquisition to an external computer the originalpulse sequence and corresponding image-reconstructing program were modified.
Implementation. The multi-site-rtfMRI environment is based on a previouslydescribed custom-made software30 implemented in MATLAB (MATLAB 7.3,MathWorks Inc.). For the present experiment, a 32-bit Microsoft Windowsarchitecture was used. However, the system should be operational on all platforms
where MATLAB is running. The software is available on request. To establish a multi-site infrastructure the existing system and the EDL-framework (ExperimentDescription Language 1.2) had to be extended by new modules. These moduleshandled all information about the levels of the BOLD signals, the scaling factors (toaccount for different scanner characteristics), analysis of both BOLD signals such asextension of the activated brain region, and location of the stimuli, the timing, andvisualization of stimuli on each site. According to the underlying EDL concept, the
Figure 4 | Schematic flow chart of the main processing modules. The data flow starts with the image acquisition at each MR scanner. In each local
MR environment a component for pre-processing and statistical analysis (S1 and S2) and a component for signal comparison and presentation (P1 and
P2) is installed. Although not used in the validation procedure the system contains a module Mutual Signal Exchange (E) where information of each
connected site can be exchanged and processed if required. The number of environments can be extended if necessary.
Figure 5 | Overview of the experimental setup of the main experiment. Each block consisted of 15 scans. At the beginning of each block, the task to be
performed was presented visually on the screen for 10 s (‘single’, ‘competition’, ‘cooperation’). In the single task only the own sphere was visible thus
excluding information exchange between both partners. The next five scans (TR 2 s) were used to determine the current baseline. The sphere had to be
moved into the upper (U) or lower (L) part of the field depicted as a light gray rectangle (here, the task required to move the sphere to the upper part). An
auditory signal (’start’ or ’stop’) delivered by earphones started the finger tapping block lasting two scans. To allow the BOLD signal to build up and decay
(which was important for a reliable data analysis) a rest period of seven scans followed the finger tapping. Then the spheres moved to the position
according to the individual BOLD signal strengths along with the visual presentation whether the task was fulfilled (and paid off) or whether the task was
not fulfilled. Thereafter, the presentation was reset and a new round was started.
www.nature.com/scientificreports
SCIENTIFIC REPORTS | 5 : 8413 | DOI: 10.1038/srep08413 6

new experiment control and data analysis parameters can be easily defined in an XMLscheme.
To compare activation states of the brains of all participating subjects the EDL-ActivationAnalysis module30 was expanded to include a transmitting(OutputModule) and a receiving (ReceiveModule) component. The address of textfiles to be exchanged was defined as a string (here to define the address of a networkdrive) but this definition can be easily adapted to include other communicationchannels or addresses including virtual addresses or internet addresses. Two moremodules (cwOutputScan, cwReceiveScan) controlled when the measurements datahave to be exchanged. In addition, the type of date to be transmitted (outputParamsresp. receiveParams) can be also set. Predefined values at this time are grey-scalevalues or statistical parameters.
The following small EDL code fragment exemplarily shows the underlying struc-ture for an XML element that specifies the data for mutual information exchange inthe according experiment:
,OUTPUTMODULE STATE5‘‘ON’’ TYPE5‘‘FILE’’WRITETIMESTAMP5‘‘ON’’ MODE5‘‘APPEND’’.
,LOCATION.[IP]\[PATH]\[FILENAME].TXT,/LOCATION.
,CWOUTPUTSCAN.10,/CWOUTPUTSCAN.
,OUTPUTPARAMS OUT_TEMPLATE_ID5‘‘OFF’’OUT_TEMPLATE_LABEL5‘‘OFF’’OUT_TEMPLATE_ACTLEVEL5‘‘ON’’ OUT_SOURCE_IMG5‘‘OFF’’OUT_MONEY_HUMAN5‘‘ON’’ OUT_MONEY_OPPONENT5‘‘OFF’’OUT_HUMAN_STEPSIZE5‘‘OFF’’.,/OUTPUTPARAMS.
,/OUTPUTMODULE .
The code fragment describes selected details how the transmission of each partner’sresults are stored on a central location. The time points when the transfer is occurringhave to be defined. Here, these time stamps relate to a time point within a stimulationblock and are inserted incrementally. The experimental details of the stimulation runare defined in additional modules (not shown here). The parameters that have to beexported back to each site have also to be defined. In our implementation, theseparameters are the current levels of the BOLD signal and the amount of previousrewards of the subject.
The stimulus presentation-module of the original framework had also to beextended in order to be used for stimulus generation for multi-site fMRI. A newmodule was developed (VisualizeActModule) where type and number of the dis-played objects (virtObjects) and the entire time sequence of the stimulation can bedefined (randStruct/showScan). This structure allows an easy modification orexchange of the presented stimulus. Thus, each participant can either see only theobject manipulated by the own brain activation, or both participants can simulta-neously see the objects of both participants. To calibrate the signals of the subjectslying in different MR-scanners scaling factors can be specified (scaleMaxValue). Thismodule also contains algorithms to compare signals of different subjects. Moresophisticated methods to analyze and compare the BOLD signals or additional rulesto control mutual interactions could be added or implemented here.
The multi-site rtfMRI framework was implemented here in a first version as twomain components (S, P) on both MR scanner environments similar to the concept ofhyperscanning16. Additionally, a network drive was defined as a central informationexchange platform (E) that could be accessed from all involved PCs. After each run,the results of the data analysis were written to a central platform and were thusaccessible to other modules (P1 and P2). This allowed to compare the BOLD signals ofone or both participants and to generate respective visualizations of the results(Figure 4). All results as well as the task condition and the timing were documented ina stimulus logging module.
Imaging Protocol. The imaging protocol on both scanners consisted of a high-resolution anatomical T1-weighted 3D data set (MPRAGE, 1 mm3 isotropic spatialresolution) and gradient-echo EPI for functional imaging with following parameters.3T: 31 axial slices (no gap), covering the whole brain, repetition time (TR) 2000 ms,echo time (TE) 27 ms, flip angle (FA) 90u, matrix size 64 3 64, 3 3 3 mm2 resolution,slice thickness 4 mm). 7T: Limitations imposed by the specific absorption rate (SAR)with the original EPI sequence required to reduce the number of slices to 20 (slice gap25%) and setting FA to 80u. Therefore, the cerebellum was not scanned at 7T. TE wasset to 21 ms due to the shorter T2* relaxation at higher field strengths, the otherparameters were identical to those at 3T.
Experimental setup. The experiment was separated into two parts. The first partserved to acquire data to define an individual region of interest (ROI) forsensorimotor activation and the individual maximum BOLD signal required for thecalibration procedure. For this functional localizer the volunteers performed asequential finger tapping task (left hand, five blocks of twelve scans each, 2 scans rest,2 scans finger tapping, 8 scans rest). The activated region was determined with a so-called growing-window or incremental approach47 after applying a 3 mm Gaussiankernel to smooth the data. The baseline was determined from run 1 to 3 while thesignal was analyzed using a correlation analysis from run 6 to 8 to include themaximum of the hemodynamic response function30. The activated brain areas wereshown to the experiment supervisor in real-time allowing an immediate qualitycheck. The maximum detected BOLD signal within each individual ROI (which wasassumed to reflect the maximum achievable activation) was set to 100%.Thismaximum signal served as the reference signal for calibrating the signals in thesubsequent experiments. After the functional localizer was finished, the selectedactivated region was stored as a reference ROI for the subsequent experiments.
In the following part (main experiment), which was performed immediately afterthe functional localizer, BCI functionality was applied simultaneously on both sitesfor each volunteer. The volunteers had to control the location of a virtual object byvarying the degree of their motor activation. Two target regions were presented, andthe volunteer was instructed to vary the motor activation between a high and a lowlevel in order to place the virtual object in an upper (‘‘U’’) or a lower (‘‘L’’) locationrespectively (Figure 5): if the actual activation was within 30% to 60% of the individualmaximum activation of the prior functional localizer the current activation wasdefined as a weak activation (‘‘L’’). To avoid a strategy where the subjects would juststop finger tapping when asked to reproduce the low motor activation, meanactivation levels below 30% were rated as insufficient, and the task was defined as notfulfilled. If more than 60% of the maximum activation was reached, current activationwas defined as a strong activation (‘‘U’’). Using these relative measures, differentsignal strengths of two scanners and individual differences could be taken intoaccount.
The main experiment consisted of three tasks to be performed in a block design (seeFig. 5). Tasks were distributed in a random order with a total of 20 runs for each task.Both target regions had to be reached a total of 30 times, i.e., ten times for each task(‘single’, ‘cooperation’, ‘competition’). The baseline was determined from the first fivescans before start of finger tapping. The real-time analysis of the BOLD signal wasperformed for 6 sec, starting immediately after finger tapping thus encompassing themain parts of the positive BOLD signal. After the rest phase, the result was displayedfor 2 sec. The current activation level was determined using a sliding-window tech-nique encompassing only the actual baseline and the BOLD signal48.
To determine which brain networks were activated in each individual when con-trolling the sensorimotor activation, each subject had to reach the current targetregion independent of the activation of the other participant (‘single’ task).Accordingly, each volunteer saw only his own sphere. A reward was assigned whenthe subject reached the required activation strength determined by the target positionof the sphere. In two more tasks, the reward depended additionally on the activationof the partner (social tasks). In the ‘‘cooperation’’ task the reward was assigned only toeach participant when both reached the same position (in the upper or lower part,similar to the single task) while in the ‘‘competition’’ task the partner who reached therequested position most accurately received the reward.
The focus of this study is validation of the calibration procedure which uses onlythe BOLD signals acquired during the ‘single’ condition. The signals serve as areference for the capability for each individual when controlling an object by adaptingthe activation of the motor cortex as additional effects due to mutual information flowor interpersonal dependencies are excluded. The social tasks will introduce additionalfeatures in brain activation patterns, which will be discussed in a forthcomingpublication.
The average time for reconstruction and transmission of data to each of the stat-istics computers (S1, S2) was 467 ms 6 39 ms. The average response time of theinternet connection was below 1 ms. During a TR of 2000 ms only the few valuesrepresenting the mean activation of the selected ROI but not the whole image data sethad to be transmitted. Average computation time for data processing was 1447 ms 6
226 ms which was also well within one TR (2000 ms).
Offline data Analysis. To check which brain regions were activated in addition to thecontralateral sensorimotor cortex used for online analysis, an offline analysis of boththe calibration and main experiment was performed using BrainVoyager QX 2.4.149.The analysis included slice scan-time correction, 3D motion correction and a spatialsmoothing with a 3 mm FWHM Gaussian kernel. Functional images were co-registered to the anatomical volume data set, and normalized into Talairach spaceusing the standard landmark method50. Activation was estimated by convolving thevectors of onset with the canonical HRF. The resulting general linear model (GLM)was corrected for serial correlation using a second-order autoregressive model AR(2).For each subject, first-level analyses were performed for the weak and strong tappingcondition. In addition, a random effects analysis (RFX) of the group data (collapsedover both tapping conditions) was applied.
To determine whether there was a significant difference between cortical activationin the weak and the strong tapping conditions, the BOLD signals of clusters within theSMC were extracted offline using the MATLAB toolbox NeuroElf 0.9c (JochenWeber, http://www.neuroelf.net, accessed 10/13/2014). For comparison with the real-time data analysis, BOLD signals of scan 8 to 10 of each block were averaged and usedfor further statistical analysis as here the BOLD signal was expected to exhibit itsmaximum amplitude (Figure 5, blue activation block). The difference between weakand strong tapping was estimated using a mixed model to allow for the correlation ofthe data. All statistical analyses were conducted using SAS (SAS/STATH 9.2, SASInstitute Inc.).
1. deCharms, R. C. Applications of real-time fMRI. Nat. Rev. Neurosci. 9, 720–729(2008).
2. LaConte, S. M. Decoding fMRI brain states in real-time. NeuroImage 56, 440–454(2011).
3. Weiskopf, N. Real-time fMRI and its application to neurofeedback. NeuroImage62, 682–692 (2012).
4. Zotev, V., Phillips, R., Yuan, H., Misaki, M. & Bodurka, J. Self-regulation of humanbrain activity using simultaneous real-time fMRI and EEG neurofeedback.NeuroImage 85, 985–995 (2014).
www.nature.com/scientificreports
SCIENTIFIC REPORTS | 5 : 8413 | DOI: 10.1038/srep08413 7

5. Hollmann, M., Baecke, S., Muller, C. & Bernarding, J. Predicting HumanDecisions in a Social Interaction-Scenario Using Real-Time fMRI. Paperpresented at 17th ISMRM, Honolulu/Hawaii. (2009).
6. Reichert, C. et al. Online tracking of the contents of conscious perception usingreal-time fMRI. Front. Neurosci. 8, 116 (2014).
7. Sorger, B., Reithler, J., Dahmen, B. & Goebel, R. A real-time fMRI-Based SpellingDevice Immediately Enabling Robust Motor-Independent Communication.Current Biology 22, 1333–1338 (2012).
8. Birbaumer, N., Gallegos-Ayala, G., Wildgruber, M., Silvoni, S. & Soekadar, S. R.Direct brain control and communication in paralysis. Brain Topogr. 27, 4–11(2014).
9. Birbaumer, N., Ramos Murguialday, A., Weber, C. & Montoya, P. [Neurofeedbackand Brain-Computer Interface: Clinical Applications] International Review ofNeurobiology 86 [Rossini, L., Izzo, D. & Summerer, L. (ed.)] 107–117 (AcademicPress 2009).
10. Astolfi, L. et al. Imaging the Social Brain by Simultaneous Hyperscanning duringSubject Interaction. IEEE Intell. Syst. 26, 38–45 (2011).
11. Babiloni, F. & Astolfi, L. Social neuroscience and hyperscanning techniques: Past,present and future. Neurosci. Biobehav. Rev. 44C, 76–93 (2014).
12. Gevins, A., Chan, C. S. & Sam-Vargas, L. Towards measuring brain function ongroups of people in the real world. PLoS ONE 7, e44676 (2012).
13. Cui, X., Bryant, D. M. & Reiss, A. L. NIRS-based hyperscanning reveals increasedinterpersonal coherence in superior frontal cortex during cooperation.NeuroImage 59, 2430–2437 (2012).
14. Duan, L. et al. Cross-Brain Neurofeedback: Scientific Concept and ExperimentalPlatform. PLoS ONE 8, e64590 (2013).
15. Scholkmann, F., Holper, L., Wolf, U. & Wolf, M. A new methodical approach inneuroscience: assessing inter-personal brain coupling using functional near-infrared imaging (fNIRI) hyperscanning. Front. Hum. Neurosci. 7 (2013).
16. Montague, P. R. et al. Hyperscanning: simultaneous fMRI during linked socialinteractions. NeuroImage 16, 1159–1164 (2002).
17. Fliessbach, K. et al. Social Comparison Affects Reward-Related Brain Activity inthe Human Ventral Striatum. Science 318, 1305–1308 (2007).
18. Spiegelhalder, K. et al. Interindividual synchronization of brain activity during liveverbal communication. Behav. Brain Res. 258, 75–79 (2014).
19. Dumas, G. Towards a two-body neuroscience. Commun. Integr. Biol. 4, 349–352(2011).
20. Konvalinka, I. & Roepstorff, A. The two-brain approach: how can mutuallyinteracting brains teach us something about social interaction? Front. Hum.Neurosci. 6, 215 (2012).
21. Schilbach, L. et al. Toward a second-person neuroscience. Behav. Brain. Sci. 36,393–414 (2013).
22. Sanfey, A. G. Social decision-making: insights from game theory andneuroscience. Science 318, 598–602 (2007).
23. Rilling, J. K., King-Casas, B. & Sanfey, A. G. The neurobiology of social decision-making. Current Opinion in Neurobiology 18, 159–165 (2008).
24. Singer, T. The past, present and future of social neuroscience: A Europeanperspective. NeuroImage 61, 437–449 (2012).
25. Anders, S., Heinzle, J., Weiskopf, N., Ethofer, T. & Haynes, J.-D. Flow of affectiveinformation between communicating brains. NeuroImage 54, 439–446 (2011).
26. Goebel, R., Sorger, B., Kaiser, J., Birbaumer, N. & Weiskopf, N. BOLD brain pong:Self-regulation of local brain activity during synchronously scanned, interactingsubjects. Presented at 34th Annual Meeting of the Society for Neuroscience, SanDiego CA. (2004).
27. Baecke, S., Lutzkendorf, R., Muller, C. & Bernarding, J. Implementierung einesFrameworks fur das Hyperscanning. Presented at GI, Braunschweig/Germany.(2012).
28. Sulzer, J. et al. Real-time fMRI neurofeedback: Progress and challenges.NeuroImage 76, 386–399 (2013).
29. Hollmann, M., Moench, T., Baecke, S., Lutzkendorf, R. & Bernarding, J. Unifiedcontrol and data analysis system for real time fMRI(rfMRI) experiments.Presented at 52st GMDS, Augsburg/Germany) (2007).
30. Hollmann, M. et al. A new concept of a unified parameter management,experiment control, and data analysis in fMRI: application to real-time fMRI at 3Tand 7T. J. Neurosci. Methods. 175, 154–162 (2008).
31. Olman, C. A. & Yacoub, E. High-field FMRI for human applications: an overviewof spatial resolution and signal specificity. Open Neuroimag. J. 5, 74–89 (2011).
32. Hutton, C. et al. The impact of physiological noise correction on fMRI at 7T.NeuroImage 57, 101–112 (2011).
33. Gonzalez-Castillo, J., Roopchansingh, V., Bandettini, P. A. & Bodurka, J.Physiological noise effects on the flip angle selection in BOLD fMRI. NeuroImage54, 2764–2778 (2011).
34. Hwu, W. et al. Accelerating MR image reconstruction on GPUs. Presented at IEEEInternational Symposium on Biomedical Imaging: From Nano to Macro. BostonMA. DOI:10.1109/ISBI.2009.5193297 (2009).
35. Posse, S. et al. High-speed real-time resting-state fMRI using multi-slab echo-volumar imaging. Front. Hum. Neurosci. 7, 479 (2013).
36. Uludag, K., Muller-Bierl, B. & Ugurbil, K. An integrative model for neuronalactivity-induced signal changes for gradient and spin echo functional imaging.NeuroImage 48, 150–165 (2009).
37. Chung, G. H., Han, Y. M., Jeong, S. H. & Jack, C. R. Functional heterogeneity of thesupplementary motor area. AJNR Am. J. Neuroradiol. 26, 1819–1823 (2005).
38. Luchtmann, M., Jachau, K., Tempelmann, C. & Bernarding, J. Alcohol inducedregion-dependent alterations of hemodynamic response: implications for thestatistical interpretation of pharmacological fMRI studies. Exp. Brain. Res. 204,1–10 (2010).
39. Wrase, J. et al. Different neural systems adjust motor behavior in response toreward and punishment. NeuroImage 36, 1253–1262 (2007).
40. Mutschler, I. et al. A Rapid Sound-Action Association Effect in Human InsularCortex. PLoS ONE 2, e259 (2007).
41. Craig, A. D. How do you feel - now? The anterior insula and human awareness.Nat. Rev. Neurosci. 10, 59–70 (2009).
42. DeLong, M. R. et al. Role of basal ganglia in limb movements. Hum. Neurobiol. 2,235–244 (1984).
43. Amiez, C., Hadj-Bouziane, F. & Petrides, M. Response selection versus feedbackanalysis in conditional visuo-motor learning. NeuroImage 59, 3723–3735 (2012).
44. Hollmann, M. et al. Predicting decisions in human social interactions using real-time fMRI and pattern classification. PLoS ONE 6 (2011).
45. Muller, C. et al. Building virtual reality fMRI paradigms: A framework forpresenting immersive virtual environments. J. Neurosci. Methods. 209, 290–298(2012).
46. Balliet, D., Li, N. P., Macfarlan, S. J. & van Vugt, M. Sex differences in cooperation:A meta-analytic review of social dilemmas. Psychological Bulletin 137, 881–909(2011).
47. Hinds, O. et al. Computing moment-to-moment BOLD activation for real-timeneurofeedback. NeuroImage 54, 361–368 (2011).
48. Gembris, D. et al. Functional magnetic resonance imaging in real time (FIRE):sliding-window correlation analysis and reference-vector optimization. Magn.Reson. Med. 43, 259–268 (2000).
49. Goebel, R., Esposito, F. & Formisano, E. Analysis of functional image analysiscontest (FIAC) data with Brainvoyager QX: From single-subject to corticallyaligned group general linear model analysis and self-organizing groupindependent component analysis. Hum. Brain Mapp. 27, 392–401 (2006).
50. Talairach, J., Tournoux, P. & Rayport, M. Co-planar stereotaxic atlas of the humanbrain. 3-dimensional proportional system: an approach to cerebral imaging(Thieme, Stuttgart, 1988).
Author contributionsS.B. prepared the manuscript including all figures/tables and was responsible for the datacollection and analysis. R.L., J.M., M.L. and J.B. were responsible for manuscriptpreparation and data analysis. C.T. and J.S. were responsible for the technical part of thedata collection. All authors reviewed the manuscript.
Additional informationCompeting financial interests: The authors declare no competing financial interests.
How to cite this article: Baecke, S. et al. A proof-of-principle study of multi-site real-timefunctional imaging at 3T and 7T: Implementation and validation. Sci. Rep. 5, 8413;DOI:10.1038/srep08413 (2015).
This work is licensed under a Creative Commons Attribution 4.0 InternationalLicense. The images or other third party material in this article are included in thearticle’s Creative Commons license, unless indicated otherwise in the credit line; ifthe material is not included under the Creative Commons license, users will needto obtain permission from the license holder in order to reproduce the material. Toview a copy of this license, visit http://creativecommons.org/licenses/by/4.0/
www.nature.com/scientificreports
SCIENTIFIC REPORTS | 5 : 8413 | DOI: 10.1038/srep08413 8