a project report on identifying car preference and buying behaviour of the car owners
DESCRIPTION
ÂTRANSCRIPT

IDENTIFYING CAR PREFERENCE AND BUYING BEHAVIOUR OF THE CARIDENTIFYING CAR PREFERENCE AND BUYING BEHAVIOUR OF THE CAR OWNERSOWNERS
Babasabpatilfreepptmba.com Page 1

IDENTIFYING CAR PREFERENCE AND BUYING BEHAVIOUR OF THE CARIDENTIFYING CAR PREFERENCE AND BUYING BEHAVIOUR OF THE CAR OWNERSOWNERS
TABLE OF CONTENTS
Serial Number Title Page Number
1. Executive Summary 7
2. Introduction To Study 11
3. Objectives Of The Study 14
4. Company Profile 16
5. Research Methodology 45
6. Analysis And Interpretation 48
7. Findings 70
8. Recommendations 74
9. Conclusion 77
10. Bibliography 78
11. Annexure 80
Babasabpatilfreepptmba.com Page 2

IDENTIFYING CAR PREFERENCE AND BUYING BEHAVIOUR OF THE CARIDENTIFYING CAR PREFERENCE AND BUYING BEHAVIOUR OF THE CAR OWNERSOWNERS
TABLE OF FIGURES
Figure Number Figure Name Page Number
1. Toyota automatic loom (Type G) 18
2. Replica of the Toyota Model AA 19
3. Corolla car 22
4. Board of directors, TKM 28
5. Milestones of Toyota 34
6. Chief Executive Officer, Shodha Toyota 36
Babasabpatilfreepptmba.com Page 3

IDENTIFYING CAR PREFERENCE AND BUYING BEHAVIOUR OF THE CARIDENTIFYING CAR PREFERENCE AND BUYING BEHAVIOUR OF THE CAR OWNERSOWNERS
Babasabpatilfreepptmba.com Page 4
EXECUTIVE SUMMARY

IDENTIFYING CAR PREFERENCE AND BUYING BEHAVIOUR OF THE CARIDENTIFYING CAR PREFERENCE AND BUYING BEHAVIOUR OF THE CAR OWNERSOWNERS
EXECUTIVE SUMMARY
Competitive pressures and increasing complexity have led automotive companies to look for an
edge wherever they can find it. Improved consumer insight into vehicle shopping and buying
behavior can provide that valuable advantage.
This presentation contains insight that can help the vehicle dealer develop and execute
more effective strategies in areas such as sales, marketing and advertising, after-sales service,
Customer Relationship Management (CRM).
PROBLEM IN BRIEF:
The automotive world today is changing; consumers are changing. And the speed of
change is continuing to accelerate with passage of time. The car dealers are finding it difficult to
respond faster and more effectively to these changes.
Hence, this study focuses on the identification of current consumer preferences & buying
behavior with respect to the cars.
KEY FINDINGS:
Trend in ownership of the cars:
Majority of the people prefer owning more than one car.
About 44% wish to change car after 4-5 years of purchase.
60% of the respondents change the car mainly for ‘style and looks’.
Babasabpatilfreepptmba.com Page 5

IDENTIFYING CAR PREFERENCE AND BUYING BEHAVIOUR OF THE CARIDENTIFYING CAR PREFERENCE AND BUYING BEHAVIOUR OF THE CAR OWNERSOWNERS
Vehicle buyers want their information fast: About 65% of the population expected the response of the dealer to be provided
‘within 24 hours’.
About 19% of the respondent opted to ‘change the dealer’ for not getting the
information from the dealer in specified time.
Consumers are going “green”:
76% of the people say that ‘Fuel efficiency’ is the most important factor while choosing
a car.
75% of them are conscious about the fuel efficient cars and about 67% of them
‘currently own fuel efficient cars’.
Consumer interest in online vehicle buying yet to develop:
94% of the respondents preferred to ‘visit the dealer personally’ to buy car. Only 4% of
the were interested to buy it over ‘internet’.
Media from which consumers collect information on cars:
For about 58% of respondents, TV is the main source from which they collected
information about cars.
Key factors in vehicle choice:
Babasabpatilfreepptmba.com Page 6
IDENTIFYING CAR PREFERENCE AND BUYING BEHAVIOUR OF THE CARIDENTIFYING CAR PREFERENCE AND BUYING BEHAVIOUR OF THE CAR OWNERSOWNERS
About 45% 0f the surveyed population preferred ‘white’ colour cars. This was because
they believed that it makes them feel superior.
50% of the surveyed customers preferred diesel engine.
Customer Loyalty: Establishing and Maintaining a Dialogue:
60% of them said that ‘Vehicle quality’ makes the more loyal towards the brand.
For 62% of the customers, the ‘high service quality’ was found to be the factor of high
motivation when it comes to buying another car from the same dealer.
Around 91% of them replied that ‘Personalized Communication’ with the dealer is
important.
About 58% of them preferred to discuss about ‘future vehicle preferences’ with dealer.
Babasabpatilfreepptmba.com Page 7

IDENTIFYING CAR PREFERENCE AND BUYING BEHAVIOUR OF THE CARIDENTIFYING CAR PREFERENCE AND BUYING BEHAVIOUR OF THE CAR OWNERSOWNERS
Babasabpatilfreepptmba.com Page 8
INTRODUCTION TO THE STUDY
IDENTIFYING CAR PREFERENCE AND BUYING BEHAVIOUR OF THE CARIDENTIFYING CAR PREFERENCE AND BUYING BEHAVIOUR OF THE CAR OWNERSOWNERS
INTRODUCTION TO STUDY
Consumer’s preference towards a product or service always will not remain invariable. It
changes with passage of time. It is very much dependent on the consumer’s prior experience with
the same or similar product.
Knowing the consumer preferences would be of great help to the marketer. They are
gradually replacing the old business strategies by a new wave of dynamic, fashion-conscious
strategies that serve to get brands recognized in an increasingly fast-paced and savvy consumer
market. The manufacturers are striving for trendy-looking cars as a way to draw buyers who
once may have been sold on power, performance, warranties or amenities.
The preferences of the consumers are changing so rapidly that the marketer are put to
make great efforts to be in pace with them. This study focuses on the identification of present
consumer preferences with respect to the cars. It also indicates new consumer attitudes towards
the vehicles they are purchasing.
The scope and depth of this study is to explore new and evolving preferences within the
retail side of the automotive industry. It involves the, web usage, changing preference of the
consumer concerning the communication with the dealer and trend in the customer loyalty. It
also explores the environmental issues including fuel efficient vehicles.
The scrutiny of all these aspects reflects today’s automotive landscape and provides the
dealers with the knowledge about the trend in the market according to which he can modify or
change the activities to respond to the market profitably.
Buying a car used to be a simple process: A consumer would check out some ads, talk to
a few friends and head into the dealer for more information. Today that process has grown more
complex, as consumers increasingly rely on new tools such as the Internet, blog sites, Web
Babasabpatilfreepptmba.com Page 9

IDENTIFYING CAR PREFERENCE AND BUYING BEHAVIOUR OF THE CARIDENTIFYING CAR PREFERENCE AND BUYING BEHAVIOUR OF THE CAR OWNERSOWNERS
forums and online social networks. This increased sophistication has resulted in changing buying
patterns as well as a shift of power in favor of the consumer. Keeping up with the pace of change
isn’t easy for many vehicle manufacturers and dealers.
Interestingly, significant commonalities are found among responses obtained by
surveying the consumers. This report highlights these results and hence provides certain useful
recommendations to the dealer and also to the manufacturer to some extent. The executive
summary provides an overview of key findings from the study, and the sections that follow offer
more in-depth data and analysis.
The automotive world today is changing; consumers are changing, establishing and
retaining loyalty among today’s knowledgeable and fickle consumers is more challenging than
ever and the speed of change is continuing to accelerate. My hope is that the study will provide
automotive companies with insights that can help them respond faster and more effectively to
these changes.
Babasabpatilfreepptmba.com Page 10

IDENTIFYING CAR PREFERENCE AND BUYING BEHAVIOUR OF THE CARIDENTIFYING CAR PREFERENCE AND BUYING BEHAVIOUR OF THE CAR OWNERSOWNERS
Babasabpatilfreepptmba.com Page 11
IDENTIFYING CAR PREFERENCE AND BUYING BEHAVIOUR OF THE CARIDENTIFYING CAR PREFERENCE AND BUYING BEHAVIOUR OF THE CAR OWNERSOWNERS
Babasabpatilfreepptmba.com Page 12
OBJECTIVES OF THE STUDY
IDENTIFYING CAR PREFERENCE AND BUYING BEHAVIOUR OF THE CARIDENTIFYING CAR PREFERENCE AND BUYING BEHAVIOUR OF THE CAR OWNERSOWNERS
Objectives
1) Identify the trend in ownership of the cars.
2) Identify the consumer interest to go green.
3) Spot the consumer tendency in searching information and required speed
of response from dealer to Consumer Query.
4) Study importance of various factors like brand, color, size, model etc., in
consumer’s choice of car.
5) Recognize the consumer’s likelihood to purchase car over the internet
online.
6) To find out the factors motivating consumer loyalty towards brand
Babasabpatilfreepptmba.com Page 13

IDENTIFYING CAR PREFERENCE AND BUYING BEHAVIOUR OF THE CARIDENTIFYING CAR PREFERENCE AND BUYING BEHAVIOUR OF THE CAR OWNERSOWNERS
Babasabpatilfreepptmba.com Page 14
PROFILE OFTOYOTA MOTOR CORPORATION, JAPAN

IDENTIFYING CAR PREFERENCE AND BUYING BEHAVIOUR OF THE CARIDENTIFYING CAR PREFERENCE AND BUYING BEHAVIOUR OF THE CAR OWNERSOWNERS
Toyota Motor Corporation is a multinational corporation headquartered in Japan, and currently
is the world's largest automaker. In terms of name recognition, Toyota is also the only car
manufacturer to appear in the top 10 of the Brand name Recognition ranking.
In 1934, while still a department of Toyota Industries, it created its first product Type-A engine
and its first passenger car (the Toyota-AA) in 1936. “Kiichiro Toyoda” founded the company in
1937 as a spin-off from his father's company Toyota industries to create automobiles. Toyota
also owns and operates Lexus and Scion brands and has a majority shareholding in ‘Daihatsu
Motors’, and minority shareholdings in Fuji Heavy Industries, Isuzu Motors, and the engine,
motorcycle and marine craft manufacturer Yamaha Motors. The company includes 522
subsidiaries.
Toyota is headquartered in Aichi, Nagoya and in Tokyo. In Addition to manufacturing
automobiles, Toyota provides financial services through its division Toyota Financial Services
and also creates robots. Toyota Industries and Finance divisions form the bulk of the Toyota
Group, one of the largest conglomerates in the world.
History
In 1933, ‘Toyoda Automatic Loom Works’ created a new division devoted to the production of
automobiles under the direction of the founder's son, Kiichiro Toyoda.
Fig.1:Toyota automatic loom (Type G)
Babasabpatilfreepptmba.com Page 15

IDENTIFYING CAR PREFERENCE AND BUYING BEHAVIOUR OF THE CARIDENTIFYING CAR PREFERENCE AND BUYING BEHAVIOUR OF THE CAR OWNERSOWNERS
Kiichiro Toyoda had traveled to Europe and the United States in 1929 to investigate automobile
production and had begun researching gasoline-powered engines in 1930. Toyoda Automatic
Loom Works was encouraged to develop automobile production by the Japanese government,
which needed domestic vehicle production partly due to the worldwide money shortage and
partly due to the war with China. In 1934, the division produced its first Type-A engine, which
was used in the first Model A1 passenger car in May 1935 and the G1 truck in August 1935.
Production of the Model AA passenger car started in 1936. Early vehicles bear a striking
resemblance to the Dodge Power Wagon and Chevrolet, with some parts actually interchanging
with their American originals.
Fig.2: Replica of the Toyota Model AA, the first production model of Toyota in 1936
Although the Toyota Group is best known today for its cars, it is still in the textile business and
still makes automatic looms, which are now computerized and electric sewing machines, which
are available worldwide.
During the Pacific War (World War II), the company was dedicated to truck production
for the Imperial Japanese Army. Because of severe shortages in Japan, military trucks were kept
as simple as possible. For example, the trucks had only one headlight on the center of the hood.
The war ended shortly before a scheduled Allied bombing run on the Toyota factories in Aichi.
After the war, commercial passenger car production started in 1947 with the model SA.
In 1950, a separate sales company, ‘Toyota Motor Sales Co.’, was established (which lasted until
July 1982). In April 1956, the ‘Toyopet dealer chain’ was established. The following year, the
Babasabpatilfreepptmba.com Page 16

IDENTIFYING CAR PREFERENCE AND BUYING BEHAVIOUR OF THE CARIDENTIFYING CAR PREFERENCE AND BUYING BEHAVIOUR OF THE CAR OWNERSOWNERS
‘Toyota Crown’ became the first Japanese car to be exported to the United State and Toyota’s
American and Brazilian divisions, Toyota Motor Sales Inc. and Toyota do Brazil S.A., were also
established.
Toyota began to expand in the 1960s with a new Research and Development facility, a
presence in Thailand was established, the 10 millionth model was produced, a Deming Prize and
partnerships with ‘Hino Motors’ and ‘Daihatsu’ were established.
The first Toyota built outside Japan was in April 1963, at Port Melbourne in Australia By
the end of the decade, Toyota had established a worldwide presence, as the company had
exported its one-millionth unit.
Babasabpatilfreepptmba.com Page 17

IDENTIFYING CAR PREFERENCE AND BUYING BEHAVIOUR OF THE CARIDENTIFYING CAR PREFERENCE AND BUYING BEHAVIOUR OF THE CAR OWNERSOWNERS
COMPANY OVERVIEW
The Toyota Motor Company was awarded its “First Japanese Quality Control Award” at the start
1970s and began participating in a wide variety of Motor sports. Due to the 1973 oil crisis,
consumers in the lucrative U.S. market began turning to small cars with better fuel economy.
American car manufacturers had considered small economy cars to be an “entry level” product,
and their small vehicles were not made to a high level of quality in order to keep the price low.
Japanese customers, however, had a long-standing tradition of demanding small fuel-
efficient cars that were manufactured to a high level of quality. Because of this, companies like
Toyota, Honda, and Nissan established a strong and growing presence in North America in the
1970s.
In 1982, the ‘Toyota Motor Company’ and ‘Toyota Motor Sales’ merged into one
Company, the Toyota Motor Corporation. Two years later, Toyota entered into a joint venture
with GM called NUMMI, the New United Motor Manufacturing Inc, operating an automobile
manufacturing plant in Fremont, California. The factory was an old General Motors plant that
had been closed for several years. Toyota then started to establish new brands at the end of the
1980s, with the launch of their luxury division Lexus in 1989.
In the 1990s Toyota began to branch out from producing mostly compact cars by adding
many larger and more luxurious vehicles to its lineup, including a full sized pickup, the T100
(and later the Toyota Tundra), several lines of SUVs, a sport version of the Camry, known as the
Camry Solar, and the Scion brand, a group of several affordable, yet sporty, automobiles targeted
Babasabpatilfreepptmba.com Page 18

IDENTIFYING CAR PREFERENCE AND BUYING BEHAVIOUR OF THE CARIDENTIFYING CAR PREFERENCE AND BUYING BEHAVIOUR OF THE CAR OWNERSOWNERS
specifically to young adults. Toyota also began production of the world’s best selling hybrid car,
the Toyota pries, in 1997 with a major presence in Europe
Due to the success of Toyota Team Europe, the corporation decided to set up TMME,
‘Toyota Motor Europe Marketing & Engineering’, to help market vehicles in the continent. Two
years later, Toyota set up a base in the United Kingdom, TMUK, as the company’s cars had
become very popular among British drivers. Bases in Indiana, Virginia and Tianjin were also set
up.
In 1999, the company decided to list itself on the New York and London Stock Exchange
with over 30 million sold, the Toyota Corolla is the best selling car in the world.
Fig.3: Corolla car.
In 2001, Toyota's Toyo Trust and Banking merged to form the UFJ, United Financials of
Japan, which was accused of corruption by the Japan's government for making bad loans to
alleged Yakuza crime syndicates with executives accused of blocking Financial Service Agency
inspections. The UFJ was listed among Fortune Magazine's largest money losing Corporations in
the world, with Toyota's chairman serving as a director. At the time, the UFJ was one of the
largest shareholders of Toyota. As a result of Japan's banking crisis, the UFJ was merged again
to become Mitsubishi UFJ Financial Group.
Babasabpatilfreepptmba.com Page 19

IDENTIFYING CAR PREFERENCE AND BUYING BEHAVIOUR OF THE CARIDENTIFYING CAR PREFERENCE AND BUYING BEHAVIOUR OF THE CAR OWNERSOWNERS
In 2002, Toyota managed to enter a Formula 1 works team and establish joint ventures
with French motoring companies Citroën and Peugeot, a year after Toyota started producing cars
in France.
On December 7, 2004, a U.S. press release was issued stating that Toyota would be
offering Sirius Satellite Radios. However, as late as Jan. 27, 2007, Sirius Satellite Radio and XM
Satellite radio kits were not available for Toyota factory radios. While the press release
enumerated nine models, only limited availability existed at the dealer level in the U.S. As of
2008, all Toyota and Scion models have either standard or available XM radio kits. Major Lexus
dealerships have been offering satellite radio kits for Lexus vehicles since 2005, in addition to
factory-equipped satellite radio models.
In 2007, Toyota released an update of its full size truck, the Toyota Tundra, produced in
two American factories, one in Texas and one in Indiana. "Motor Trend" named the Tundra
"Truck of the Year," and the 2007 Toyota Camry "Car of the Year" for 2007. It also began the
construction of two new factories, one to build the Toyota Rav4 in Woodstock, Ontario and the
other to build the Toyota Highlander in Blue Springs, Mississippi.
Toyota Philosophy:
Toyota's management philosophy has evolved from the company's origins and has been
reflected in the terms “Lean Manufacturing” and “Just In Time Production”, which it was
instrumental in developing.
The Toyota Way has four components:
1) Long-term thinking as a basis for management decisions,
2) A process for problem solving,
3) Adding value to the organization by developing its people, and
Babasabpatilfreepptmba.com Page 20

IDENTIFYING CAR PREFERENCE AND BUYING BEHAVIOUR OF THE CARIDENTIFYING CAR PREFERENCE AND BUYING BEHAVIOUR OF THE CAR OWNERSOWNERS
4) Recognizing that continuously solving root problems drives organizational learning.
The Toyota Way incorporates the Toyota Production System.
The Toyota Production System:
Toyota has long been recognized as an industry leader in manufacturing and production.
Three stories of its origin have been found, one that they studied Piggly-Wiggly's Just-In-Time
Distribution System, one that they followed the writings of W. Edwards Deming, and one that
they were given the principles from an Army training program. It is possible that all are true.
Regardless of the origin, the principles, described in Toyota's management philosophy, ‘The
Toyota Way’, are as follows:
1) Base your goals management decisions on a long-term philosophy, even at the expense of
short-term.
2) Create continuous process flow to bring problems to the surface.
3) Use “pulls” systems to avoid overproduction.
4) Level out the workload.
5) Build a culture of stopping to fix problems, to get quality right the first time
6) Standardized tasks are the foundation for continuous improvement and employee
empowerment.
7) Use visual control so no problems are hidden.
8) Use only reliable, thoroughly tested technology that serves your people and processes.
9) Grow leaders who thoroughly understand the work, live the philosophy, and teach it to other.
Babasabpatilfreepptmba.com Page 21

IDENTIFYING CAR PREFERENCE AND BUYING BEHAVIOUR OF THE CARIDENTIFYING CAR PREFERENCE AND BUYING BEHAVIOUR OF THE CAR OWNERSOWNERS
10) Develop exceptional people and teams who follow your company’s philosophy.
11) Respect your extended network of partners and suppliers by challenging them and helping
them improve.
12) Go and see you to thoroughly understand the situation (genchi genbutsu).
13) Make decisions slowly by consensus, thoroughly considering all options; implement
decisions rapidly.
14) Become a learning organization through relentless reflection and continuous improvement.
Achievement of Toyota:
Toyota has grown to a large multinational corporation from where it started and
expanded to different worldwide markets and countries by becoming the largest seller of cars in
the beginning of 2007, the most profitable automaker ($11 billion in 2006) along with increasing
sales in, among other countries, the United States.
Toyota has introduced new technologies including one of the first mass-produced hybrid
gas-electric vehicles, of which it says it has sold 1 million globally (2007-06-07), Advanced
Parking Guidance System (automatic parking), a four-speed electronically controlled automatic
with buttons for power in addition, economy shifting, and an eight-speed automatic transmission.
Toyota and Toyota-produced Lexus and Scion automobiles, consistently rank near the top in
certain quality and reliability .
In the ‘Fortune Global 500’, Toyota Motor is the sixth largest company in the world.
Since the recession of 2001, it has gained market share in the United States. Toyota's market
share struggles in Europe where its Lexus brand has three tenths of one percent market share,
compared to nearly two percent market share as the U.S. luxury segment leader.
Babasabpatilfreepptmba.com Page 22

IDENTIFYING CAR PREFERENCE AND BUYING BEHAVIOUR OF THE CARIDENTIFYING CAR PREFERENCE AND BUYING BEHAVIOUR OF THE CAR OWNERSOWNERS
In the first three months of 2007, Toyota together with its half-owned subsidiary Daihatsu
reported number one sales of 2.348 million units. Toyota's brand sales had risen 9.2% largely on
demand for Corolla and Camry sedans. The difference in performance was largely attributed to
surging demand for fuel-efficient vehicles.
In November 2006, Toyota Motor Manufacturing Texas added a facility in San Antonio Toyota
has experienced quality problems and was reprimanded by the government in Japan for its recall
practices.
Toyota currently maintains over 16% of the US market share and is listed second only to GM in
terms of volume. Toyota Century is the official state car of the Japanese imperial family, namely
for the Emperor of Japan Akihito.
Global Presence of Toyota
Toyota has factories all over the world, manufacturing or assembling vehicles for local
markets, including the Corolla. Toyota has manufacturing or assembly plants in:
Japan, Australia, India, Canada, Indonesia, Poland, South Africa, Turkey, United Kingdom,
United States, France, Brazil, Pakistan, Argentina, Czech Republic, Mexico, Malaysia, Thailand,
China, Vietnam, Venezuela, Philippines, Russia.
Babasabpatilfreepptmba.com Page 23

IDENTIFYING CAR PREFERENCE AND BUYING BEHAVIOUR OF THE CARIDENTIFYING CAR PREFERENCE AND BUYING BEHAVIOUR OF THE CAR OWNERSOWNERS
Toy
Babasabpatilfreepptmba.com Page 24
PROFILE OFTOYOTA KIRLOSKAR MOTORS, BANGALORE

IDENTIFYING CAR PREFERENCE AND BUYING BEHAVIOUR OF THE CARIDENTIFYING CAR PREFERENCE AND BUYING BEHAVIOUR OF THE CAR OWNERSOWNERS
Toyota Kirloskar Motor Pvt. LTD
Mr. H Nakagawa, MD Mr. M Kawabata, DMD Mr. S Tomonaga, DMD
Fig.4: Board of directors TKM
“Toyota Kirloskar Motors” is a joint venture between Kirloskar Group and Toyota Motor
Corporation, Toyota Kirloskar Motor Private Limited (TKM) aims to play a major role in the
development of the automotive industry and the creation of employment opportunities, not only
through its dealer network, but also through ancillary industries.
TKM's growth since inception can be attributed to one simple, yet important aspect of its
business philosophy – “Putting Customer First”. While managing growth, TKM has maintained
its commitment to provide quality products at a reasonable price and has made every effort to
meet changes in customer needs. TKM firmly believes that the success of this venture depends
on providing high quality products and services to all valued customers through the efforts of its
team members. TKM, along with its dedicated dealers and suppliers, has adopted the “Growing
Together” philosophy of its parent company TMC to create long-term business growth. In this
way, TKM aims to further contribute to progress in the Indian automotive industry, realize
greater employment opportunities for local citizens, improve the quality of life of the team
members and promote robust economic activity in India.
All Toyota employees are expected to embody these values in their daily work, including
environmental protection activities. To “respect” the environment, they go to the source to
Babasabpatilfreepptmba.com Page 25

IDENTIFYING CAR PREFERENCE AND BUYING BEHAVIOUR OF THE CARIDENTIFYING CAR PREFERENCE AND BUYING BEHAVIOUR OF THE CAR OWNERSOWNERS
identify and analyze problems (“Genchi Genbutsu”), move forward to “challenge” conventional
ideas and old habits, to improve further (“kaizen”) through “teamwork.”
The framework provided by The Toyota Way enables the company to respond to, among
other things, the environmental challenges at various stages of the life-cycle of a vehicle. These
include greenhouse gas emissions, waste reduction, increased recycling and the banning of
hazardous substance use in parts and components. These challenges will have inevitable
consequences for Toyota's organization and employees, and are aiming to balance them with
their desire for future growth.
In 1992, the Toyota Guiding Principles were established in direct response to the
international initiatives agreed to at the Rio ‘Earth Summit’. This summit focused on the
potential for a clash between trade and environmental rules, and resulted in a statement of
principles about forest management, conservation and sustainable development.
The Toyota Guiding Principles are a cornerstone of their corporate management
philosophy. These principles were updated in 1997, to ensure they continue to provide Toyota
with a clear path towards achieving sustainable development. These principles have been
explored and developed in Toyota's Global Vision 2010, adopted in April 2002, which proposes
a series of long-term policies on the theme of “Innovation into the Future”. Toyota's Global
Vision 2010 guides management in its response to long-term social changes, combining
consideration for the environment, the benefit to their customers of value-added products and the
encouragement of their employees through shared prosperity and social involvement.
Based on the Guiding Principles, which codify Toyota’s business spirit, the Toyota Earth
Charter (adopted in 1992 and revised in 1997) embodies a comprehensive approach to global
environmental issues. It outlines Toyota's basic policy and action guidelines towards effective
environmental management and improvements. The Toyota Earth Charter underlines a
commitment to environmental excellence, not only through broad principles, but in concrete
examples of what can be done through action guidelines. In connection with the Toyota Guiding
Principles and the Toyota Earth Charter, a European Environmental Policy was developed as a
Babasabpatilfreepptmba.com Page 26

IDENTIFYING CAR PREFERENCE AND BUYING BEHAVIOUR OF THE CARIDENTIFYING CAR PREFERENCE AND BUYING BEHAVIOUR OF THE CAR OWNERSOWNERS
means of linking principles, goals, targets and action plans with management structures and
systems.
TKM firmly believes that employees are the main source of strength for the organization.
The human resources management in Toyota seeks to create a corporate culture where values
such as “Continuous Improvement” and “Respect for People” are fully reflected in all actual
corporate and individual activities. The company takes maximum care to ensure stability of
employment and strives to improve working conditions. To develop human resources and
improve the technical skills of its employees, TKM's young team members are regularly sent to
Japan, Indonesia, and Taiwan for training programs. More than 425 team members have
benefited from such programs at various Toyota plants worldwide. TKM also believes in
continuously improving its products and practices. Every team member is encouraged to give
suggestions to improve the product, efficiency of processes or working conditions. They are also
appropriately rewarded for the same. Thus TKM seeks to progress by empowering its
employees.
The first Toyota automobile to be sold was the ‘Qualis’, which re-badge Toyota Kijang in the
multi purpose vehicle (MPV) segment in January 2000. The name is said to have been derived
by combining ‘Quality’ and ‘Service’. Due to the high quality, capacity and comfort, it soon
became a best seller, selling over 21,000 units and garnering 35 per cent share in the segment.
Today Toyota Kirloskar sells 4 car models in India. It stopped producing the “Toyota Qualis” to
make way for the ‘Toyota Innova’, which was launched in India in 2005. The most expensive car
from Toyota is a very powerful SUV - the Land Cruiser “Prado”.
Toyota production system was born out of the need. The two main pillars that this system
is based on are, ‘Just-In-Time’ and ‘Automation’. The Toyota production system relies on the
absolute elimination of waste as essential. Toyota is by far the largest Japanese automotive
manufacturer, producing more than 4.5 million vehicles per year equivalent to one car
manufactured every six seconds. S
Babasabpatilfreepptmba.com Page 27

IDENTIFYING CAR PREFERENCE AND BUYING BEHAVIOUR OF THE CARIDENTIFYING CAR PREFERENCE AND BUYING BEHAVIOUR OF THE CAR OWNERSOWNERS
Toyota’s plant in India is situated at Bidadi, Karnataka, which is a green belt. Toyotas
commitment towards the environment is very high. Toyota all over the world provides a wide
range of innovative reasonably prized high quality products through an exclusive dealer’s
network with the best sales and after sales service at the global Toyota standards. Timely
customer’s feedback through the service network also allows the company to respond to
emerging customer needs and introduced new products tailored to the Indian market.
VISION STATEMENT
“Contributing to Indian industry and economy, thorough technological transfer, human
resource development and vehicles that meet the global standards at the cooperative price,
contributing to well being and stability of the team members. Contributing to the overall
growth for our business associates and the automobile industry”.
MISSION STATEMENT
“Our mission is to design, manufacture, and market automobiles in India and overseas
while maintaining the high quality that meets global Toyota quality standards, and offers
superior value and excellent after sales service. We are dedicated to proving the highest
possible level of value to the customers, team members, communities, and investors in India”.
Guided by principles of ‘Growing Together’ Toyota group companies have contributed to the
automotive industry in each country they operate in, through strong partnerships based on high
level of localization and technology transfer along with manufacturing and sales activities.
Toyota group of companies provide extensive know-how related to the product
development, manufacturing and sales through the technological transfer to local co-operations.
Babasabpatilfreepptmba.com Page 28

IDENTIFYING CAR PREFERENCE AND BUYING BEHAVIOUR OF THE CARIDENTIFYING CAR PREFERENCE AND BUYING BEHAVIOUR OF THE CAR OWNERSOWNERS
In addition, those corporations transfer technology to their affiliated companies. In this manner,
manufacturing and sales level are steadily improved on a broad basis. Toyota products made in
India have become interestingly competitive because of continual, compressive improvements
made in operations. The introduction of the world famous Toyota production system and the
progressive technology has advanced industrial innovation.
Toyota’s professionals in manufacturing and sales contribute to higher competitiveness
and the growth of the Indian industries in this Toyota’s Lexus and Toyota’ branded vehicles rank
annually among the world’s highest quality cars in third party surveys of customer satisfaction.
Recognition
At TKM, we look forward to improve continuously not only our products but also our
processes and service. Our obsession with perfection has been recognized by various institutions
such as JD Power and TNS Automotive, as well as automotive publications like Overdrive, as
the reason for the success of Toyota products in India and across the globe.
Local Community Development
At TKM, every effort is made to contribute to society. A residential school at Bidadi,
reconstructed by Toyota, now houses 75 students, mainly belonging to backward communities.
In the aftermath of the tragic earthquake in Gujarat, TKM and its dealers played a major role in
distributing food, clothing and relief in remote affected area. TKM also takes a lead role in
contributing to the community, distributing books and bags in local school etc.
Toyota Techno Park India
A global first for Toyota Park India (TTPI), in Bidadi near TKM is a non-profit industrial
infrastructure company conceived around the new Toyota Kirloskar motors automobile plant.
TTPI’s objectives are to “foster ancillary industries in India to help promote local industries
Babasabpatilfreepptmba.com Page 29

IDENTIFYING CAR PREFERENCE AND BUYING BEHAVIOUR OF THE CARIDENTIFYING CAR PREFERENCE AND BUYING BEHAVIOUR OF THE CAR OWNERSOWNERS
through technological transfer and expand employment opportunities. Five joint ventures have
already been established with Toyota group of companies in TTPI involving TK Kirloskar
Automotive Ltd., Stanzen Logisticas Center Pvt. Ltd., and Transystem Logistics International
Pvt. Ltd.
Toyota’s concern towards: Environment, Technology & Employment
Toyota is committed to manufacture technically advanced and environment friendly
products. Their plant at Bidadi surrounded by a green belt, meets high environmental standards
and has also obtained ‘ISO 14001’ certificate on April 2001.
Toyota has always believed that the best way to serve society by providing automobiles
that will not only make people happy, but will also be the environmental friendly. Waste water at
TKM is collected purified so that it can be used for fishponds and rise field. To realize high
quality vehicle production at responsible prices, Toyota seeks the best balance between human
resources and advanced robot technology.
Toyota Legacy (100 million vehicles)
Toyota legacy –meeting the automotive need of more than 160 countries accumulated
domestic production of 100 Million vehicles.
By October 1999, Toyota had reached domestic production of more then 100 million
vehicles and a worldwide cumulative production of about 112 million vehicles since its
naissance. This world class records is proof of our continuing effort to satisfy customer
expectations. Research and development has made possible technological advancement in
Babasabpatilfreepptmba.com Page 30

IDENTIFYING CAR PREFERENCE AND BUYING BEHAVIOUR OF THE CARIDENTIFYING CAR PREFERENCE AND BUYING BEHAVIOUR OF THE CAR OWNERSOWNERS
quality manufacturing, safety, efficiency, and environmental preservation all of which contribute
to enhancing customer satisfaction.
Babasabpatilfreepptmba.com Page 31
Fig.5 Milestones of Toyota

IDENTIFYING CAR PREFERENCE AND BUYING BEHAVIOUR OF THE CARIDENTIFYING CAR PREFERENCE AND BUYING BEHAVIOUR OF THE CAR OWNERSOWNERS
Babasabpatilfreepptmba.com Page 32

IDENTIFYING CAR PREFERENCE AND BUYING BEHAVIOUR OF THE CARIDENTIFYING CAR PREFERENCE AND BUYING BEHAVIOUR OF THE CAR OWNERSOWNERS
Babasabpatilfreepptmba.com Page 33
PROFILE OFSHODHA TOYOTA, HUBLI

IDENTIFYING CAR PREFERENCE AND BUYING BEHAVIOUR OF THE CARIDENTIFYING CAR PREFERENCE AND BUYING BEHAVIOUR OF THE CAR OWNERSOWNERS
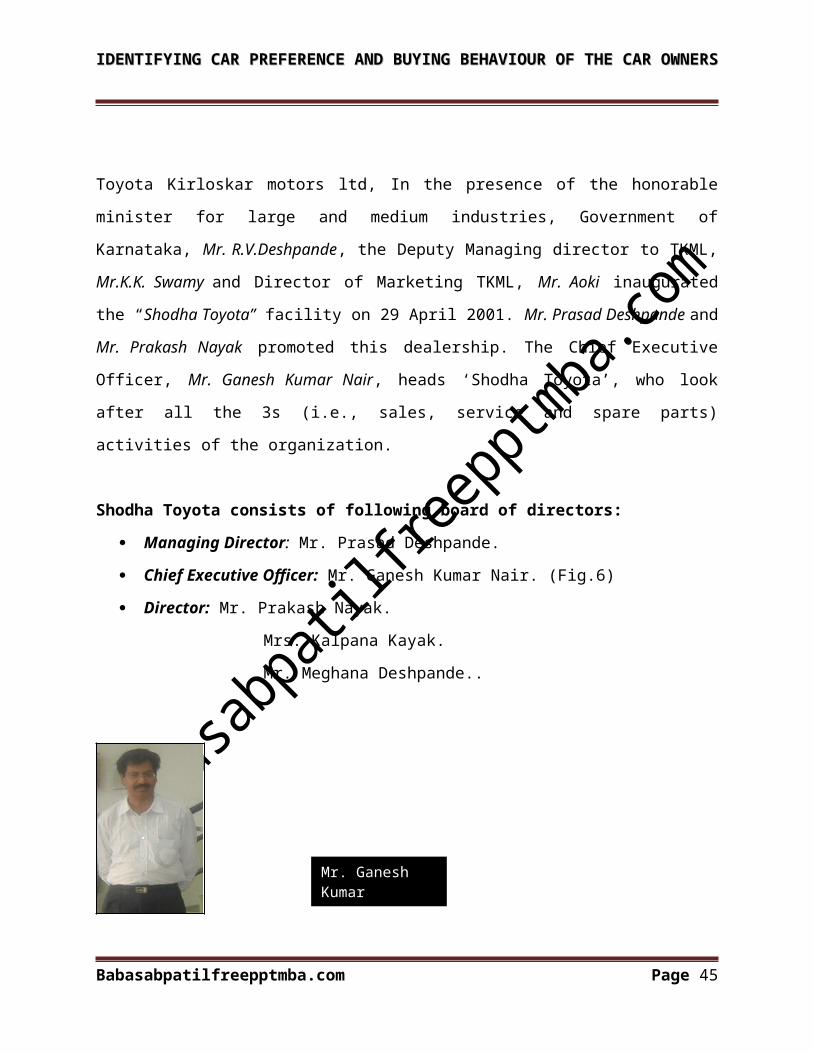
Toyota Kirloskar motors ltd, In the presence of the honorable minister for large and medium
industries, Government of Karnataka, Mr. R.V.Deshpande, the Deputy Managing director to
TKML, Mr.K.K. Swamy and Director of Marketing TKML, Mr. Aoki inaugurated the “Shodha
Toyota” facility on 29 April 2001. Mr. Prasad Deshpande and Mr. Prakash Nayak promoted this
dealership. The Chief Executive Officer, Mr. Ganesh Kumar Nair, heads ‘Shodha Toyota’, who
look after all the 3s (i.e., sales, service and spare parts) activities of the organization.
Shodha Toyota consists of following board of directors:
Managing Director: Mr. Prasad Deshpande.
Chief Executive Officer: Mr. Ganesh Kumar Nair. (Fig.6)
Director: Mr. Prakash Nayak.
Mrs. Kalpana Kayak.
Mr. Meghana Deshpande..
Fig.6
It is engaged in sale and service to Toyota vehicles, and covers 12 district of north
Karnataka viz: Hubli, Dharwad, Gulburga, Bellary, Haveri, Hospet, Bijapur, Belgaum, Bidar,
Davangere, Bagalkot & Gadag. The customer base includes industrial houses, businessmen,
government departments and others. They have implemented quality management system
accordance with 9001:2000 and they are in the process of obtaining the desired result to meet the
international standards of the Toyota in India. It is one of the first of its kind in Hubli, similar to
other dealership.
Babasabpatilfreepptmba.com Page 34
Mr. Ganesh Kumar

IDENTIFYING CAR PREFERENCE AND BUYING BEHAVIOUR OF THE CARIDENTIFYING CAR PREFERENCE AND BUYING BEHAVIOUR OF THE CAR OWNERSOWNERS
‘Shodha Toyota’ is duly equipped with state of arts tools and equipments and necessary
spare parts from the day of commencement of this operation. It is the latest to join the network of
exclusively Toyota 3s dealership, which signifies sales, service, and spare parts under one roof,
is the Toyota’s approach to the customer care service. The sales, service, and spare parts officers
and the dealership have given extensive training by the Toyota.
In Shodha Toyota, they recruit the candidates by making the advertisements, reference
etc., and they have only one selection process for candidates. Employees are satisfied with all the
facilities in the company. It is one of the leading dealer automobile in North Karnataka. The
company has good market in the north Karnataka and rural area.
MISSION STATEMENT
“Total customer satisfaction as our mission”
To achieve this we will always strive to improve processing continuously & deliver quality
service as per customers needs and thus build “Customer for Life”.
Objectives:The organization has framed a list of objectives to achieve the mission statement.
Managing director in co-ordination with General Manager has defined following quality
objectives for Shodha Toyota:
To understand and define the customer vehicle requirement clearly and executing the order
as per the sales process to achieve 100% customer satisfaction.
To procure the spare parts and Materials from approved suppliers & keep the optimum
stock levels so that customer requirements are fulfilled.
Babasabpatilfreepptmba.com Page 35

IDENTIFYING CAR PREFERENCE AND BUYING BEHAVIOUR OF THE CARIDENTIFYING CAR PREFERENCE AND BUYING BEHAVIOUR OF THE CAR OWNERSOWNERS
To understand and define customer service needs clearly and executing them as per service
processes, as to achieve 100% customer satisfaction.
To allocate work to competent personnel and improve their competences through effective
training.
To improve the processes continuously at every opportunity.
To maintain pressure free environment, hygienic facilities and clean atmosphere with an
aim to serve the people and society.
To meet the requirements all interested practiced viz., suppliers, directors, employees.
Toyota Kirloskar motors ltd., suppliers, statutory and regulatory bodies with an aim to
enhance stakeholders satisfaction.
Babasabpatilfreepptmba.com Page 36

IDENTIFYING CAR PREFERENCE AND BUYING BEHAVIOUR OF THE CARIDENTIFYING CAR PREFERENCE AND BUYING BEHAVIOUR OF THE CAR OWNERSOWNERS
DEPARTMENTS OF SHODHA TOYOTA
The Shodha Toyota consists of following three departments:
Human resource department.
Sales department.
Service department.
HUMAN RESOURCE DEPARTMENT
Recruitment
“Recruitment is the process of searching for prospective employees and stimulating and
encouraging them to apply for the job in the organization”.
Recruitment represents the first contact a company has with potential employees.
Objectives:
To determine the present and future requirements of the organization in conjunction with
the personnel and job analysis activities.
Babasabpatilfreepptmba.com Page 37

IDENTIFYING CAR PREFERENCE AND BUYING BEHAVIOUR OF THE CARIDENTIFYING CAR PREFERENCE AND BUYING BEHAVIOUR OF THE CAR OWNERSOWNERS
Increase the pool of job candidates with minimum cost.
Mutt the organizations legal and local obligations regarding the composition of its work
force.
Increase organizational and individual effectiveness in short and long term.
Start identifying and preparing potential job applicant who will be appropriate candidates.
Evaluate the effectiveness of various recruiting techniques and source fro all types of the
job applications.
Source Of Recruitment:
Source of the recruitment in Shodha Toyota is classified into two brand categories:
Internal Sources External sources
a) Promotions Press advertisements
a) Placement agencies
b) Unsolicited applications
c) Recommendations
d) Employee referrals.
Selection
Babasabpatilfreepptmba.com Page 38

IDENTIFYING CAR PREFERENCE AND BUYING BEHAVIOUR OF THE CARIDENTIFYING CAR PREFERENCE AND BUYING BEHAVIOUR OF THE CAR OWNERSOWNERS
Selection is the next step to the recruitment this is the logical step to sleeting the qualified
and competent people to fill the job in the organization.
Selection process:
In Shodha Toyota they have one solution process means they have only one step in the
selection process. That is one interview. they conduct one interview to the candidate on that
interview they select the candidates.
Functions Of HR Manager Issuing appointment letters to the new employees and collecting necessary certificates.
Induction training for the newly receipted employees
Issuing I-cards to new employees
Maintaining attendance register
Maintaining the list of newly joined and dropped out employees in the last week of every
month.
Issuing inter office notice/circular whenever necessary
Make entry the details of PF and ESI contribution for every month.
Notification of national and festival holidays
Earned leave maintenance.
Babasabpatilfreepptmba.com Page 39

IDENTIFYING CAR PREFERENCE AND BUYING BEHAVIOUR OF THE CARIDENTIFYING CAR PREFERENCE AND BUYING BEHAVIOUR OF THE CAR OWNERSOWNERS
Organizing training as per the training schedule
Preparing leave plan for service staff every 45 days
Sending I HT-soft copy Report to TKM Bangalore, before third of every month and hard
copy reports should be sent before 10th of every month.
Submitting sales status report to TKM by 30th / 31st of every month
Submitting PF and ESI returns.
SALES DEPARTMENT
Sales manager
Assistant sales manager assistant sales manager
(6.dist) (6. dist)
It is an important part of Shodha Toyota. The Toyota sales process has six modules which follow
the steps in Toyota sales process.
These modules include:
Preliminary activities
Approach and qualifying
Presentation and demonstration
Babasabpatilfreepptmba.com Page 40

IDENTIFYING CAR PREFERENCE AND BUYING BEHAVIOUR OF THE CARIDENTIFYING CAR PREFERENCE AND BUYING BEHAVIOUR OF THE CAR OWNERSOWNERS
Negotiating and closing
Delivery
Follow up.
Preliminary activities:
Collection of the customer databases of the customers and generation of the yearly sales
target activity takes place. The general manager and the sales manager this activity. Sales target
are set for particular year further it also includes the monthly sales planning which depends on
the ability of the sales officers and the potential area for the monthly sales target will be allocate
to each of the sales officers.
Approach and qualifying:
Sales Territory of Shodha Toyota is distributed within 12 districts. Each district has one
assistant sales manager who collects the information of the customers and informs the sales
manager. Here then the sales manager sends direct mail advertising about the vehicle to the
customer. Qualifying includes whatever the customer is a potential buyer. People may be
targeted according to their standard of living destination and their ability to pay.
Presentation and demonstration:
Once the customer approaches the showroom the presentation demonstration activity is
carried out. This activity includes of the vehicles and features such as safety and security, style
design interiors information regarding the engine.
Negotiating and closing:
Babasabpatilfreepptmba.com Page 41

IDENTIFYING CAR PREFERENCE AND BUYING BEHAVIOUR OF THE CARIDENTIFYING CAR PREFERENCE AND BUYING BEHAVIOUR OF THE CAR OWNERSOWNERS
The customer decides to buy the vehicles the sales manager negotiates with him and
further documentation takes place. Once the customer is satisfied the deal is closed he will be
given some other trial benefits like financial options, free on year insurance etc.
Delivery:
After the execution of the above mentioned activities, delivery of vehicles take place.
Follow up
Responsibility of the show room extends not only till the vehicle is sold, but there is an
extended courtesy which includes a phone from the sales department on 3rd day, followed by a
‘Thank You Letter’ along with a phone call by the sales manager and a photograph taken on the
date of delivery of the owner.
Responsibilities of the sales manager: To plan and set the target and sales of vehicles.
Monitoring daily targets of all sales officers.
Conducting sales meeting regularly.
Monitoring daily customer /weekly report enquires.
Ensuring effective territory coverage by the sales officers.
Achievement of the sales target.
Identifying the inventory for event/ promotional activities with TKM.
Coordinating for customer relation management.
Motivating sales officers, their performance review and periodic appraisal.
Coordinating training program to ensure show room house keeping, perfect condition of the
display vehicles and test-drive veneries.
To attend management review meeting and indicating corrective and preventive actions.
SERVICE DEPARTMENT
Babasabpatilfreepptmba.com Page 42

IDENTIFYING CAR PREFERENCE AND BUYING BEHAVIOUR OF THE CARIDENTIFYING CAR PREFERENCE AND BUYING BEHAVIOUR OF THE CAR OWNERSOWNERS
Head customer service officer, heads workshop or servicing department he is assisted by
a service manager 3 service advisors, a controller and parts in charge then assist the service
manager gives it to any of the advisors, who then prepares a job card, jots all the problems, what
the customers complaints are about. He then advises for the repair, replacement, and the further
process of repairs and general check up starts that is when the responsibility is handed over to the
chief technicians who carry on the work and after all mechanical work is completed, the vehicle
is sent to washing where ever the outer body is given the water mad the interiors are given air
blow.
In the same way, accidents cases are dealt with and the procedures of repair goes hand in
hand with the insurance agent who inspects the vehicle and then gives orders for the further
repairs. On an average 15 vehicles are serviced in a day.
Functions Of Service Manager:The service manager is the leader of the dealer service workshop. He is responsible for
the following:
Plan, lead, organized and control the service department.
Analyze and ensure customer satisfaction.
Direct staff towards the customer oriented thinking.
Coordination service and ware house operation.
Observe dealership guidelines and fulfill the manufacturer’s priority tasks.
Generate profit for the dealership, monitor cost effectiveness, analyze major service.
Babasabpatilfreepptmba.com Page 43

IDENTIFYING CAR PREFERENCE AND BUYING BEHAVIOUR OF THE CARIDENTIFYING CAR PREFERENCE AND BUYING BEHAVIOUR OF THE CAR OWNERSOWNERS
Indicators and develop market for leadership.
Manage service shop infrastructure, environmental and safety issues.
Babasabpatilfreepptmba.com Page 44
IDENTIFYING CAR PREFERENCE AND BUYING BEHAVIOUR OF THE CARIDENTIFYING CAR PREFERENCE AND BUYING BEHAVIOUR OF THE CAR OWNERSOWNERS
Babasabpatilfreepptmba.com Page 45
RESEARCH METHODOLOGY

IDENTIFYING CAR PREFERENCE AND BUYING BEHAVIOUR OF THE CARIDENTIFYING CAR PREFERENCE AND BUYING BEHAVIOUR OF THE CAR OWNERSOWNERS
Definition Of The Problem And Research Objectives:
Preference of the customers with respect to the cars is very rapidly changing along with
the time. The customers are demanding exclusivity and newer aspects when it comes to buying
or owning of cars. This has put all the car manufacturers and dealers into confusion. They are
constantly looking for new ways to serve their customers. Hence the problem here is to: Identify
the changing consumer trends and preferences, with regards to cars and hence respond to them
profitably.
Objectives:
7) Identify the trend in ownership of the cars.
8) Identify the consumer interest to go green.
9) Spot the consumer tendency in searching information and required speed of response
from dealer to Consumer Query.
10) Study importance of various factors like brand, color, size, model etc., in consumers’
choice of car.
11) Recognize the consumer’s likelihood to purchase car over the internet online.
12) To find out the factors motivating consumer loyalty towards brand
Development Of The Research PlanThis calls for the decision to be made on the subsequent aspects:
Data sources:
The sources of data that were utilized in this project were both primary and secondary
data. The primary data was the data obtained by surveying the consumers, where as the
secondary data was the information about the existing customers of the dealer. The secondary
data was used to know the precedent preference of the customer.
Research approach:
Babasabpatilfreepptmba.com Page 46

IDENTIFYING CAR PREFERENCE AND BUYING BEHAVIOUR OF THE CARIDENTIFYING CAR PREFERENCE AND BUYING BEHAVIOUR OF THE CAR OWNERSOWNERS
This indicates the approach used to collect the primary data. Here, the research approach
used is the ‘survey research & observational data collection’, as it best suited to obtain the
required information to satisfy the project’s objectives.
Research instruments: Usually, for Marketing research there are two main search instruments in collecting the
primary data: Questionnaires and Mechanical devices. Here, the research instrument used was
‘questionnaire’. Most of the questions in the questionnaire were of closed ended type with
several options for the respondent’s convenience along with a few open-ended questions
intending short answers.
Sampling Plan:
After deciding on the research approach and instruments, the sampling plan was
designed, which called for decision on the Sample unit, sample size and sample procedure.
Sample unit: This indicates the target population that will be sampled. The target population
selected for this project consisted of all those people who owned a car.
Sample size: The sample size selected was “60”.
Sample procedure: The sample procedure selected was “convenience sampling”.
Contact methods:
Here the contact methods used:
- Telephonic interviewing.
-Personal interviewing.
Area of survey:
Shodha Toyota is the only dealer for north Karnataka, which includes 12 districts out of
which the most potential places: Hubli, Dharwad, Belgaum, Bellary were concentrated more.
Certain Sample units from other districts were also included.
Babasabpatilfreepptmba.com Page 47

IDENTIFYING CAR PREFERENCE AND BUYING BEHAVIOUR OF THE CARIDENTIFYING CAR PREFERENCE AND BUYING BEHAVIOUR OF THE CAR OWNERSOWNERS
Babasabpatilfreepptmba.com Page 48
ANALYSIS AND INTERPRETATION

IDENTIFYING CAR PREFERENCE AND BUYING BEHAVIOUR OF THE CARIDENTIFYING CAR PREFERENCE AND BUYING BEHAVIOUR OF THE CAR OWNERSOWNERS
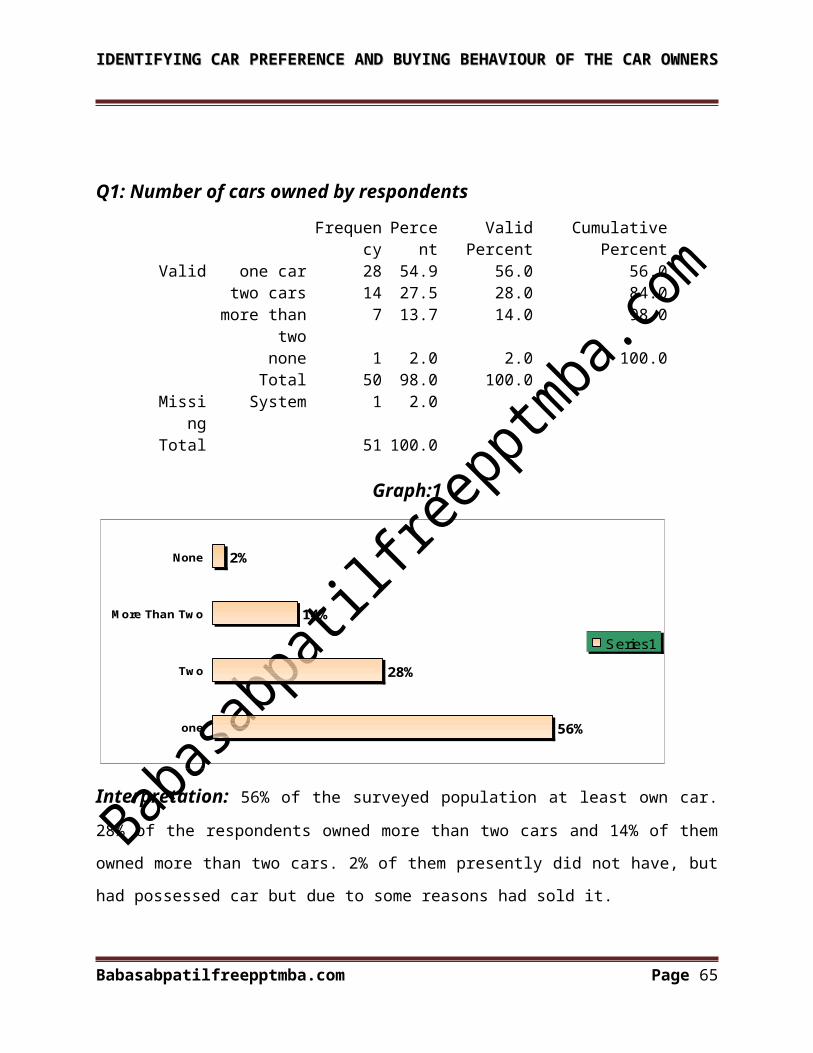
Q1: Number of cars owned by respondentsFrequency Percent Valid Percent Cumulative Percent
Valid one car 28 54.9 56.0 56.0two cars 14 27.5 28.0 84.0
more than two 7 13.7 14.0 98.0none 1 2.0 2.0 100.0Total 50 98.0 100.0
Missing System 1 2.0 Total 51 100.0
Graph:1
56%
28%
14%
2%
one
Two
More Than Two
None
Series1
Interpretation: 56% of the surveyed population at least own car. 28% of the respondents
owned more than two cars and 14% of them owned more than two cars. 2% of them presently
did not have, but had possessed car but due to some reasons had sold it.
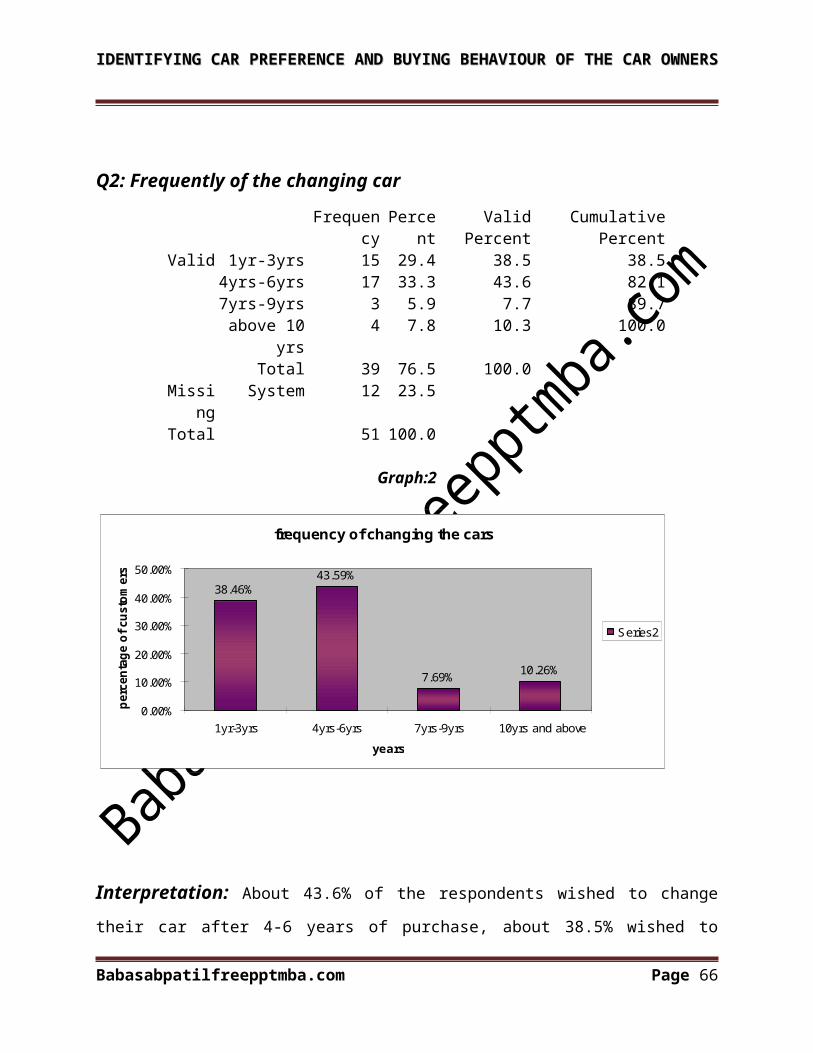
Q2: Frequently of the changing carFrequency Percent Valid Percent Cumulative Percent
Valid 1yr-3yrs 15 29.4 38.5 38.54yrs-6yrs 17 33.3 43.6 82.17yrs-9yrs 3 5.9 7.7 89.7
above 10 yrs 4 7.8 10.3 100.0Total 39 76.5 100.0
Babasabpatilfreepptmba.com Page 49

IDENTIFYING CAR PREFERENCE AND BUYING BEHAVIOUR OF THE CARIDENTIFYING CAR PREFERENCE AND BUYING BEHAVIOUR OF THE CAR OWNERSOWNERS
Missing System 12 23.5 Total 51 100.0
Graph:2
Interpretation: About 43.6% of the respondents wished to change their car after 4-6 years of
purchase, about 38.5% wished to change their car after 1-3 years of purchase. Therefore
about82% of them would change the car between 1-6 years of purchase. Maximum number of
the respondents in this group owned small cars.
7.7% of them wanted to change after 7-9 years of purchase and about 10.26% of the
respondents wished to change their car after 10 years of purchase. Hence, around 18% of them
preferred to change their car after 7 years of purchase, out of which about 14% of them were
customers who owned Toyota car.
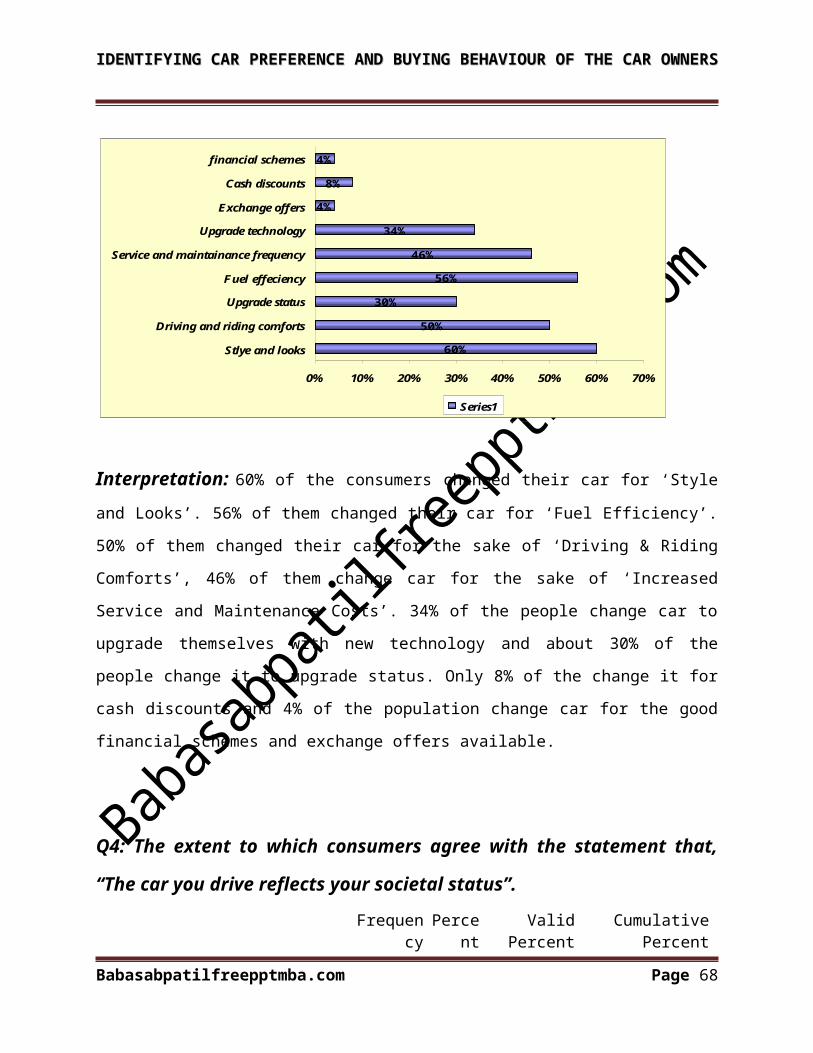
Q3: Factors influencing consumer’s decision to change car
Babasabpatilfreepptmba.com Page 50
frequency of changing the cars
38.46%43.59%
7.69% 10.26%
0.00%
10.00%
20.00%
30.00%
40.00%
50.00%
1yr-3yrs 4yrs-6yrs 7yrs-9yrs 10yrs and above
years
perc
enta
ge o
f cus
tom
ers
Series2

IDENTIFYING CAR PREFERENCE AND BUYING BEHAVIOUR OF THE CARIDENTIFYING CAR PREFERENCE AND BUYING BEHAVIOUR OF THE CAR OWNERSOWNERS
Graph:3
60%
50%
30%
56%
46%
34%
4%
8%
4%
0% 10% 20% 30% 40% 50% 60% 70%
Stlye and looks
Driving and riding comforts
Upgrade status
Fuel effeciency
Service and maintainance frequency
Upgrade technology
Exchange offers
Cash discounts
financial schemes
Series1
Interpretation: 60% of the consumers changed their car for ‘Style and Looks’. 56% of them
changed their car for ‘Fuel Efficiency’. 50% of them changed their car for the sake of ‘Driving &
Riding Comforts’, 46% of them change car for the sake of ‘Increased Service and Maintenance
Costs’. 34% of the people change car to upgrade themselves with new technology and about 30%
of the people change it to upgrade status. Only 8% of the change it for cash discounts and 4% of
the population change car for the good financial schemes and exchange offers available.
Q4: The extent to which consumers agree with the statement that, “The car you
drive reflects your societal status”.Frequency Percent Valid Percent Cumulative Percent
Valid Strongly agree 7 13.7 14.0 14.0Agree 22 43.1 44.0 58.0
Babasabpatilfreepptmba.com Page 51
IDENTIFYING CAR PREFERENCE AND BUYING BEHAVIOUR OF THE CARIDENTIFYING CAR PREFERENCE AND BUYING BEHAVIOUR OF THE CAR OWNERSOWNERS
Neither agree nor disagree 6 11.8 12.0 70.0Disagree 14 27.5 28.0 98.0
Strongly disagree 1 2.0 2.0 100.0Total 50 98.0 100.0
Missing System 1 2.0 Total 51 100.0
Graph:4
14%
44%
12%
28%
2%
Strongly agree
Agree
Neither Agree nordisagree
Disagree
Strongly disagree
Series1
Interpretation: 44% of the population ‘agrees’ with the statement where as 28% of them
‘disagree’. 14% of ‘strongly agree’ where as only 2% of them ‘strongly disagree’.
About 12% of the surveyed population say that they ‘neither agree nor disagree’ with the
statement that the car they drive reflects their societal status.
Q5: Speed at which the customer wants the response from the dealer
Frequency Percent Valid Percent Cumulative Percent Valid immideately 2 3.9 10.0 10.0
within 1 hour 5 9.8 25.0 35.0within 24 hours 6 11.8 30.0 65.0within 48 hours 4 7.8 20.0 85.0
more than 48 hours
3 5.9 15.0 100.0
Babasabpatilfreepptmba.com Page 52
IDENTIFYING CAR PREFERENCE AND BUYING BEHAVIOUR OF THE CARIDENTIFYING CAR PREFERENCE AND BUYING BEHAVIOUR OF THE CAR OWNERSOWNERS
Total 20 39.2 100.0 Missing System 31 60.8
Total 51 100.0
Graph:5(PTO)
Interpretation: 30% of the respondents want the reply form the dealer for the forwarded query
within 24 hours. 25% of them demand the response for the query within one hour, and 20% of
the people want their queries to be answered within 48 hours. 15% of the customers are ready to
wait more than 48 hours for the response of the dealer to their queries where as 10% of the
respondents demand that their quires must be responded by the dealer immediately. Therefore,
65 % of respondents need the quires to be responded within a day and about 35% of them can
wait till 48 hours.
Babasabpatilfreepptmba.com Page 53

IDENTIFYING CAR PREFERENCE AND BUYING BEHAVIOUR OF THE CARIDENTIFYING CAR PREFERENCE AND BUYING BEHAVIOUR OF THE CAR OWNERSOWNERS
Q6: The reaction of the customer if he does not get the information sought, in specified the time.
Frequency Percent Valid Percent
Cumulative Percent
Valid wait patiently 26 51.0 53.1 53.1change the brand 5 9.8 10.2 63.3change the dealer 9 17.6 18.4 81.6
change both brand and dealer
3 5.9 6.1 87.8
opt for the competitors car 5 9.8 10.2 98.0other reaction 1 2.0 2.0 100.0
Total 49 96.1 100.0 Missin
gSystem 2 3.9
Total 51 100.0
Graph:6
0.00%
10.00%
20.00%
30.00%
40.00%
50.00%
60.00%
Wai
tpa
tient
ly
Cha
nge
bran
d
Cha
nge
deal
er
Cha
nge
both
bra
ndan
d de
aler
Opt
com
petit
ors
car
Oth
erre
actio
n
Series2
Babasabpatilfreepptmba.com Page 54
IDENTIFYING CAR PREFERENCE AND BUYING BEHAVIOUR OF THE CARIDENTIFYING CAR PREFERENCE AND BUYING BEHAVIOUR OF THE CAR OWNERSOWNERS
Interpretation: About 54% of the respondents say that they are ready to ‘wait patiently’ for
the reply; about 19% say that they would be ‘changing the dealer’ if they did not get the response
from the dealer on specified time. 10.20% of the population would ‘change the brand’ and again
10.20% of the people would go for the ‘competitor’s car’. About 7% of the customers would opt
to ‘change both brand and dealer’
The above two questions i.e., Q5 and Q6 are cross tabulated below using the SPSS software to
get the following results.
CROSS TABULATION
Action of customer against the dealer for not / wrongly providing the information sought Total
The time within which the customer wants reply from dealer for the information sought
wait patiently
change the dealer
Change both brand and dealer
opt competitors car
immediately Count 0 1 0 1 2 % within The time
within which the customer wants reply from dealer for the information sought
.0% 50.0% .0% 50.0% 100.0%
within 1 hour Count 4 0 0 1 5 % within The time
within which the customer wants reply from dealer for the information sought
80.0% .0% .0% 20.0% 100.0%
within 24 hours Count 4 0 1 1 6
Babasabpatilfreepptmba.com Page 55

IDENTIFYING CAR PREFERENCE AND BUYING BEHAVIOUR OF THE CARIDENTIFYING CAR PREFERENCE AND BUYING BEHAVIOUR OF THE CAR OWNERSOWNERS
% within The time within which the customer wants reply from dealer for the information sought
66.7% .0% 16.7% 16.7% 100.0%
within 48 hours Count 3 0 0 1 4 % within The time
within which the customer wants reply from dealer for the information sought
75.0% .0% .0% 25.0% 100.0%
more than 48 hours Count 2 0 1 0 3 % within The time
within which the customer wants reply from dealer for the information sought
66.7% .0% 33.3% .0% 100.0%
Total Count 13 1 2 4 20 % within The time
within which the customer wants reply from dealer for the information sought
65.0% 5.0% 10.0% 20.0% 100.0%
Q7: Level of motivation that each of the specified factors provide to the customer
to purchase another car from same dealer.
Graph:8
Babasabpatilfreepptmba.com Page 56
10%
26%
62%
18%
14%
8%
28%
20%
42%
50%
30%
46%
50%
42%
50%
56%
48%
24%
8%
36%
36%
50%
22%
24%
0% 20% 40% 60% 80% 100%
Highly motivatesMotivatesDosent motivate
IDENTIFYING CAR PREFERENCE AND BUYING BEHAVIOUR OF THE CARIDENTIFYING CAR PREFERENCE AND BUYING BEHAVIOUR OF THE CAR OWNERSOWNERS
Interpretation: ‘Popularity of the dealership name’ highly motivates only 10% of the
consumers, where as 42% of them say it would motivate them and 48% conclude that it is not a
motivational factor to buy another car from same dealer. . ‘Dealers trustworthiness’ is the factor
of high motivation to 26% of the people, it motivate 50% of the people and doesn’t motivate
remaining 24% of them. The ‘service quality’ is the one which highly motivate 62% of the
population; 30% of them say it would motivate them and the remaining 8% say that it would not
motivate them. ‘Hospitality and friendliness of the sales staff’ highly motivates only 18% of the
consumers, the same would motivate 46% of them, and to the remaining 36% it is not a
motivating factor. ‘Knowledge of the sales staff’ would highly motivate only 14% of the
population, where as to 50% of population it just motivates and to the remaining 36% it would
not be a motivating factor. ‘Awareness of my history to the dealer’ would highly motivate only
to 8% of the population, motivates 42% of the people, and will not motivate the remaining 50%
of them. ‘Experience of previously purchased car from same dealer’, highly motivates only 28%
of the consumers, motivates 50% of the consumers and doesn’t motivate 24% of them. ‘Good
Personalized Communication’ highly motivates 20% of the respondents, motivates 56% of the
respondents and will not motivate 24% of the respondents to buy another car from same dealer.
Q8: Preference of the customers to pay extra to get extra features while buying
the car?
Frequency Percent Valid Percent Cumulative Percent Valid yes 32 62.7 64.0 64.0
no 18 35.3 36.0 100.0Total 50 98.0 100.0
Missing System 1 2.0 Total 51 100.0
Babasabpatilfreepptmba.com Page 57
IDENTIFYING CAR PREFERENCE AND BUYING BEHAVIOUR OF THE CARIDENTIFYING CAR PREFERENCE AND BUYING BEHAVIOUR OF THE CAR OWNERSOWNERS
Graph:9
Yes64%
No36%
Interpretation: 64% of the customers are ready to pay extra to get extra features in car where
as the rest 36% of the customers do not prefer to pay extra. That is they want extra features of the
car with zero cost.
Q9: Through which media do you collect the information about cars?
Graph:10
58%
38%
12%
12%
2%
40%
22%
4%
TV
Print Media
Car dealer
Internet
Finance service broker
Family and Friends
Automotive magazines
Others
Series1
Interpretation: 58% of the respondents surveyed said that TV is the first main source from
which they collect the information about the cars, 40% of them said that they ‘family and
Babasabpatilfreepptmba.com Page 58

IDENTIFYING CAR PREFERENCE AND BUYING BEHAVIOUR OF THE CARIDENTIFYING CAR PREFERENCE AND BUYING BEHAVIOUR OF THE CAR OWNERSOWNERS
friends’ is the important source from which they gather information on cars. To 38% of the
respondents ‘print media’ is found to be the source of information on cars. 22% of the consumers
refer the ‘automotive magazines’ for information on cars. 12% of them get the information from
‘internet’ and another 12% of them another 12% of them collected it from the car dealers. Other
sources accounted to only 4%.
Q10: Colour and Brand of car preferred by the consumersColour: Graph:12
White45%
Black16%
Red14%
Silver13%
Champagne5%
Grey7%
White
Black
RedSilver
ChampagneGrey
Interpretation: From the pie chart above it is clear that 45%of the consumers opted for
‘White’ colour; 16%, 14% and 13% of the consumers preferred ‘Black’, ‘Red’ and ‘Metallic
silver’ colours respectively. 7% preferred to go for ‘Grey’ colour whereas only 5% said that they
preferred ‘Champagne’ colour.
Brand:Graph:13
Babasabpatilfreepptmba.com Page 59
Maruti36%
Honda9%
Toyota20%
Skoda9%
Chevrolet0%
Tata17%
Mahendra3% Hyundai
6%HyundaiMarutiHondaToyotaSkodaChevroletTataMahendra

IDENTIFYING CAR PREFERENCE AND BUYING BEHAVIOUR OF THE CARIDENTIFYING CAR PREFERENCE AND BUYING BEHAVIOUR OF THE CAR OWNERSOWNERS
Interpretation: 36% of the population preferred ‘Maruti’ brand of car, further 20% of them
favored ‘Toyota’ brand of cars, 17% of them went for ‘Tata’. About 9 % of the consumers
preferred ‘Skoda’ another 9% of them went for ‘Honda’ brand. Only 6%, 3%, and 0% of them
were towards ‘Hyundai’, ‘Mahindra’ and ‘Chevrolet’ brands respectively
Q11: Preference of the above-mentioned colour is because:
Graph:14
Babasabpatilfreepptmba.com Page 60

IDENTIFYING CAR PREFERENCE AND BUYING BEHAVIOUR OF THE CARIDENTIFYING CAR PREFERENCE AND BUYING BEHAVIOUR OF THE CAR OWNERSOWNERS
0.00%
10.00%
20.00%
30.00%
40.00%
50.00%
60.00%
Manypeople are
using it
It makesme feelsuperior
Attractspeolple'sattention
Upcomingfashion
I like It Othersselect itfor me
otherreason
Series1
Interpretation: 53% of the customers preferred particular colour because ‘they liked it’.
Around 37% of them
Q12: The reasons why the customers shift to different Brand:
Graph:15
59.18%16.33%
18.37%30.61%
40.82%16.33%
38.78%42.88%
30.61%28.57%
32.65%24.49%
20.41%
Vehicle qualityIt fits personal needs
Experiment something newExperience luxury
Fuel effeiciencyPopularity of brand name
SafetyAfter sales service
Exterior designPrice of vehicle
FeaturesInterior design
Size of car
Series1
Interpretation: According to about 60% of the consumers ‘Vehicle quality’ is the most
important reason why they shift to different make or brand. For about 43% of consumers ‘After
Babasabpatilfreepptmba.com Page 61

IDENTIFYING CAR PREFERENCE AND BUYING BEHAVIOUR OF THE CARIDENTIFYING CAR PREFERENCE AND BUYING BEHAVIOUR OF THE CAR OWNERSOWNERS
sales service’ stood the main reason for shifting brand. Further, for about 41% of the consumers
‘Fuel efficiency’ happens to be the reason for changing the brand. For 38.78% of the people
‘Safety’ was the factor which was important. ‘Features’ in the car was the reason for 32.65% of
the consumers to shift the brand. 30.61% provided the reason of ‘Exterior design’ and again
another 30.61% of them gave the reason of ‘Experience luxury’. 28.57%, 24.49% and 20.41%
shifted the brand because, ‘Price of car’, ‘Interior design’ and ‘Size of the car’ were the reasons
respectively. For 16.33% of them the reason for changing car stood ‘Popularity of brand name’
and again another 16.33% changed it to fit to their personal needs.
Q13: Consciousness about environment friendly car/ fuel-efficient car among
the respondents?
Frequency Percent Valid Percent Cumulative Percent Valid very conscious 15 29.4 30.6 30.6
conscious 22 43.1 44.9 75.5neither conscious nor
unconscious7 13.7 14.3 89.8
unconscious 5 9.8 10.2 100.0Total 49 96.1 100.0
Missing System 2 3.9 Total 51 100.0
Graph:16
Very conscious
Conscious
Very unconscious
Unconscious
Neither conscious nor unconscious
0.00%5.00%10.00%15.00%20.00%25.00%30.00%35.00%40.00%45.00%50.00%
Series1
Babasabpatilfreepptmba.com Page 62

IDENTIFYING CAR PREFERENCE AND BUYING BEHAVIOUR OF THE CARIDENTIFYING CAR PREFERENCE AND BUYING BEHAVIOUR OF THE CAR OWNERSOWNERS
Interpretation: From the above graph it is clear that 45% of the respondents are ‘Conscious’
& 30% of them are ‘Very Conscious’. About 15% of the population is ‘Neither Conscious Nor
Unconscious’. Only 10% of the population is unconscious about the “Green Cars”. And 0% of
the population is ‘Very Unconscious’.
Q16: Consumers currently own fuel-efficient car / planning to buy / seriously
thing to buy fuel-efficient car:
Graph:17
Frequency Percent Valid Percent Cumulative Percent Valid currently own 16 31.4 66.7 66.7
planning to buy 6 11.8 25.0 91.7thinking seriously 2 3.9 8.3 100.0
Total 24 47.1 100.0 Missing System 27 52.9
Total 51 100.0
Currently owning67%
Planning topurchase
25%
Seriously thinking8%
Interpretation: Consumers currently owning the ‘fuel efficient car’ account to 67%. Those
who are planning to purchase account to 25% and those who are seriously thinking about
possessing a fuel efficient car account to only 8%.
Babasabpatilfreepptmba.com Page 63
IDENTIFYING CAR PREFERENCE AND BUYING BEHAVIOUR OF THE CARIDENTIFYING CAR PREFERENCE AND BUYING BEHAVIOUR OF THE CAR OWNERSOWNERS
Q17: Way selected by the customers while purchasing car:
Frequency
Percent Valid Percent Cumulative Percent
Valid personal visit 47 92.2 94.0 94.0over internet 2 3.9 4.0 98.0
over telephone 1 2.0 2.0 100.0Total 50 98.0 100.0
Missing System 1 2.0 Total 51 100.0
Graph:18
0%
20%
40%
60%
80%
100%
Series1 94% 4% 2% 0% 0%
Personal visit
Internet Telephone Some other person
Other way
Interpretation: 94% of the customers preferred to ‘personally visit’ the dealer to purchase car.
Only 4% of the population preferred to purchase car over ‘internet’ and 2% made it over
‘telephone’.
Q18: What would motivate you to buy cars over internet?
Babasabpatilfreepptmba.com Page 64
IDENTIFYING CAR PREFERENCE AND BUYING BEHAVIOUR OF THE CARIDENTIFYING CAR PREFERENCE AND BUYING BEHAVIOUR OF THE CAR OWNERSOWNERS
Frequency Percent Valid Percent
Cumulative Percent
Valid ability to contact concerned person
7 13.7 14.0 14.0
ability to negotiate price online 3 5.9 6.0 20.0delivery to home or the nearest
location1 2.0 2.0 22.0
ability to see photos / vedios of the cars
2 3.9 4.0 26.0
ability to compare cars online 3 5.9 6.0 32.0ability to get quotations 4 7.8 8.0 40.0
nothing motivates 29 56.9 58.0 98.08 1 2.0 2.0 100.0
Total 50 98.0 100.0 Missin
gSystem 1 2.0
Total 51 100.0
Graph:19
14%
6%
2%
4%
6%
8%
58%
2%
Ability to contact concerned person
Ability to negotiate price online
Delivery to home or nearest location
Ability to see photos and videos of cars
Ability to compare cars online
Ability to get quotation
none
All
Series1
Interpretation: 58% of the people replied that nothing would motivate them to buy car over
internet. However, ‘Ability to contact concerned person’ motivates 14% of the surveyed
population. Further, 8% of the respondents were likely to be motivated by ‘Ability to get
quotations’ and 6% were likely to be motivated by ‘Ability to compare cars online’. Another 6%
Babasabpatilfreepptmba.com Page 65
IDENTIFYING CAR PREFERENCE AND BUYING BEHAVIOUR OF THE CARIDENTIFYING CAR PREFERENCE AND BUYING BEHAVIOUR OF THE CAR OWNERSOWNERS
felt that ‘Ability to negotiate price online would motivate to some extent and around 4%
demanded ‘Ability to see photos and videos of cars’ both in use and out of use. 2% of the
respondents said that the facility of getting ‘Delivery to home or nearest location’ would
stimulate them to use net and another 2% of the respondents felt that all the facilities are
essential.
Q19: Importance of personalized communication with the dealer to the customer
Frequency
Percent
Valid Percent
Cumulative Percent
Valid very important 21 41.2 43.8 43.8important 23 45.1 47.9 91.7
neither important nor unimportant
2 3.9 4.2 95.8
unimportant 2 3.9 4.2 100.0Total 48 94.1 100.0
Missing
System 3 5.9
Total 51 100.0
Graph:20
Babasabpatilfreepptmba.com Page 66

IDENTIFYING CAR PREFERENCE AND BUYING BEHAVIOUR OF THE CARIDENTIFYING CAR PREFERENCE AND BUYING BEHAVIOUR OF THE CAR OWNERSOWNERS
Very important
Important
Neither important nor unimportant
Unimportant
Very unimportant
0.00% 10.00% 20.00% 30.00% 40.00% 50.00% 60.00%
Series1
Interpretation: About 50% and 47% of the respondents say that personalized communication
is ‘important’ and ‘very important’ respectively. About 14% of them say that it is ‘Neither
important nor unimportant’ again 14% of them say that it is unimportant. The respondents saying
that it is ‘very unimportant’ accounts to 0%.
Q20: Consumers are ready to share information with the dealer regarding:
Graph:21
Babasabpatilfreepptmba.com Page 67
IDENTIFYING CAR PREFERENCE AND BUYING BEHAVIOUR OF THE CARIDENTIFYING CAR PREFERENCE AND BUYING BEHAVIOUR OF THE CAR OWNERSOWNERS
0.00%
10.00%
20.00%
30.00%
40.00%
50.00%
60.00%
Futu
reve
hicl
epr
efer
ence
s
Con
tact
info
rmat
ion
Veh
icle
buyi
nghi
stor
y
Futu
repu
rcha
sein
tent
ion
Prio
rre
asea
rch
hist
ory
Life
styl
ein
form
atio
n
Abo
utne
eds
and
pref
eren
ces
Series1
Interpretation: About 57% of the population is ready to share the information about ‘Future
vehicle preferences’, and about 48% 0f the respondent’s want to share with the dealer about the
‘needs and preference’. Around 18% of the respondents prefer sharing information about their
‘Vehicle buying history’, and around 15% prefer sharing ‘Future purchase intention’ and again
another 15% want to share about ‘Future purchase intention’. 12% and about 18% of the prefer
sharing information on ‘Life time information’ and ‘Prior research history’ respectively.
Q21: Consumers expect the following things out of the dealer, from whom they
buy their car:
Graph:22
Babasabpatilfreepptmba.com Page 68

IDENTIFYING CAR PREFERENCE AND BUYING BEHAVIOUR OF THE CARIDENTIFYING CAR PREFERENCE AND BUYING BEHAVIOUR OF THE CAR OWNERSOWNERS
54.55%43.18%
12.50% 20.83% 29.17% 25.00%
60.42% 56.25%
45% 56%87% 79% 70.83% 75.00%
39.58% 43.75%
0.00%
20.00%
40.00%
60.00%
80.00%
100.00%
120.00%
Series2Series1
Interpretation: 54% of the consumers expect service reminders where as 45% of the
respondents do not. 48% of the respondents expect ‘Post test drive survey’ where as 56% do not.
Only 12.5% of them want ‘Email newsletters’ from the dealer where as 87% of them did not.
20% of the respondents expect ‘News letter via post mail’ where as about 79% of them do not.
About 29% of the consumers expect ‘Welcome pack after purchase’ where as about 71% do not
expect. 25% of the consumer expect ‘Invitations to special events’ where as 75% did not expect.
About 60.42% of the customers demand ‘Customer satisfaction survey after service’ where as
about 39.5 did not expect. Around 56% expected ‘Customer satisfaction survey after purchase’
where as about 43% did not expect.
Q22: The importance of the various factors to the customer while choosing car:
Babasabpatilfreepptmba.com Page 69

IDENTIFYING CAR PREFERENCE AND BUYING BEHAVIOUR OF THE CARIDENTIFYING CAR PREFERENCE AND BUYING BEHAVIOUR OF THE CAR OWNERSOWNERS
Graph:23
0%
10%
20%
30%
40%
50%
60%
70%
80%
90%
100%
Very unimportant
Unimportant
Neither important norunimportantImportant
Very important
Interpretation: ‘size’ is very important to about 54% of the consumers and is important to
about 38% of them. ‘Free accessories’ is very important to about 14% of the consumers and is
important to 48% of them. 36% say ‘cash discount’ is very important and to 34% of them it is
important. 74% of the respondents say ‘Reliability of the brand’’ is very important and 16% say
it is important. ‘Safety’ is very important to about 72% and 24% of them say it is important.
‘Price of the car’ is very important to 40% of the consumers and 50% of them say it is important.
‘Exterior design’ is very important to 46% and another 46% of them say it is important. ‘Interior
design’ is very important to 44% of the customers and to 50% of the respondents say it is
Babasabpatilfreepptmba.com Page 70
IDENTIFYING CAR PREFERENCE AND BUYING BEHAVIOUR OF THE CARIDENTIFYING CAR PREFERENCE AND BUYING BEHAVIOUR OF THE CAR OWNERSOWNERS
important. 44% of the respondents say ‘Interior design’ is very important and 50% of them say it
is important. ‘Warranty coverage’ is very important to 62% of the respondents and to about 30%
of the consumers say it is important. 30% of the consumers say ‘’Low finance rates’ is very
important factor in the vehicle choice and 28% say it is important. ‘Colour of vehicle’ is very
important to 52% of the consumers and to 32% of the consumers it is important.20% of the
respondents say ‘Road tax’ is very important and 54% say it is important. To 76% of the
consumers ‘Fuel efficiency’ is very important and 24% say it is important. 68% of the
respondents say ‘Engine quality’ is very important and 28% say it is important. 42% of them say
‘Vehicle availability’ is very important and 44% of the say it is important. 38% of them say
‘Product future and options’ is very important and 48% say it is important.
Babasabpatilfreepptmba.com Page 71

IDENTIFYING CAR PREFERENCE AND BUYING BEHAVIOUR OF THE CARIDENTIFYING CAR PREFERENCE AND BUYING BEHAVIOUR OF THE CAR OWNERSOWNERS
Babasabpatilfreepptmba.com Page 72

IDENTIFYING CAR PREFERENCE AND BUYING BEHAVIOUR OF THE CARIDENTIFYING CAR PREFERENCE AND BUYING BEHAVIOUR OF THE CAR OWNERSOWNERS
Babasabpatilfreepptmba.com Page 73
FINDINGS
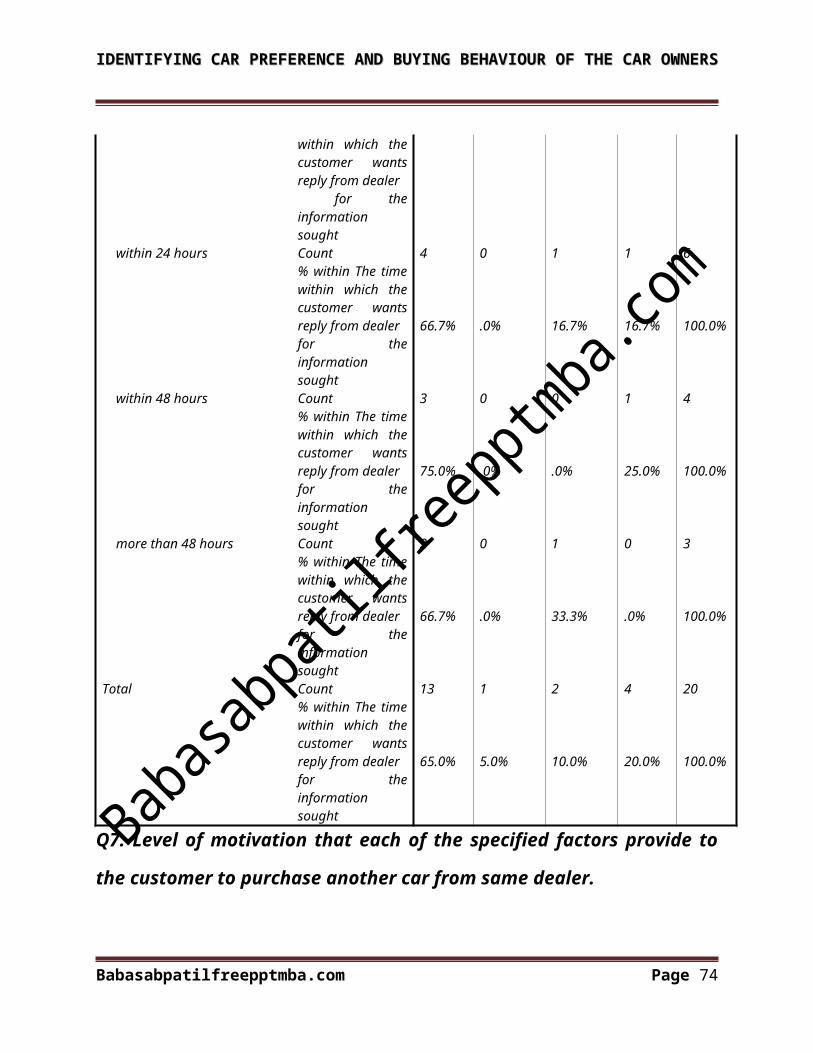
IDENTIFYING CAR PREFERENCE AND BUYING BEHAVIOUR OF THE CARIDENTIFYING CAR PREFERENCE AND BUYING BEHAVIOUR OF THE CAR OWNERSOWNERS
The following significant things were found:
Almost all of the respondents, who were surveyed, possessed at least one car and
majority of the people change car after 1 year and before 6th year of purchase. Among
them majority of the people comprised owners small car owners. Those who wished to
change car after 7 years of purchase accounted to about 18%, out of which only the
consumer who owned cars accounted to about 14%.
The factors that influence the most on the people to change their car are: Style and looks
(60%), Fuel efficiency (56%), Driving and riding comforts (50%), and to considerable
extent the service and maintenance frequency (46%) would also influence the
consumers.
In total, 58% of the people agree that the car they drive reflects their societal status.
Total 65% of the customers want their information within one day where as the rest say
they can wait more than 48hrs.
About 57% of the customers say that they are ready to wait patiently to dealers response
for the information sought. The rest percentage of the customers my change brand, or
may change dealer or change both brand and dealer or may opt the competitor’s car. A
few might respond in other way.
The cross tabulation between ‘ the time within which the customers wanted reply’ and
‘their reaction if they did not get the response in specified time’ gave interesting result
that, out of every 20 customers seeking information on specified time, the dealer would
be loosing 6 of them fro not providing information on said time to the customers.
Babasabpatilfreepptmba.com Page 74

IDENTIFYING CAR PREFERENCE AND BUYING BEHAVIOUR OF THE CARIDENTIFYING CAR PREFERENCE AND BUYING BEHAVIOUR OF THE CAR OWNERSOWNERS
‘Good personalized communication’ is one of the important aspects, which motivated
the dealer’s existing customers to buy another car from same dealer. ‘Quality service’ is
the next vital aspect, which highly motivated the consumers.
The highest preferred type of engine was found to be the ‘diesel engine’ 50%. Next came
the ‘petrol engine’, which accounted to 40%.
Majority of the people (64%) preferred paying extra money to get extra features in the
car they want to buy.
Majority of the people (52%) were reluctant to spend extra money on accessories.
Television, Family and friends and Print media were found to be the main sources from
which the consumers collected the information on cars and they accounted to 58%, 40%
and 38% respectively.
The customer who preferred ‘White colour’ accounted to 45%. 16%, 14% and 13% of
the people opted ‘Black’, ‘Red’ and ‘Silver’ respectively. According to 53% of the
consumers this preference in the colour is mainly because they ‘like it’, according to
about 37% of the consumers it is because it ‘makes them feel superior’ and according to
about 35% of them it is because they feel that these colours ‘attract peoples attention’.
About 60% people opinion is that ‘Vehicle Quality’ is the main factor, which makes
them more brand loyal. Furthermore, for around 43% of the consumers ‘After sales
service’ is the main factor that makes them more brand loyal then comes ‘Fuel
efficiency’.
Around 76% of the consumers are conscious about the fuel-efficient cars.
Babasabpatilfreepptmba.com Page 75
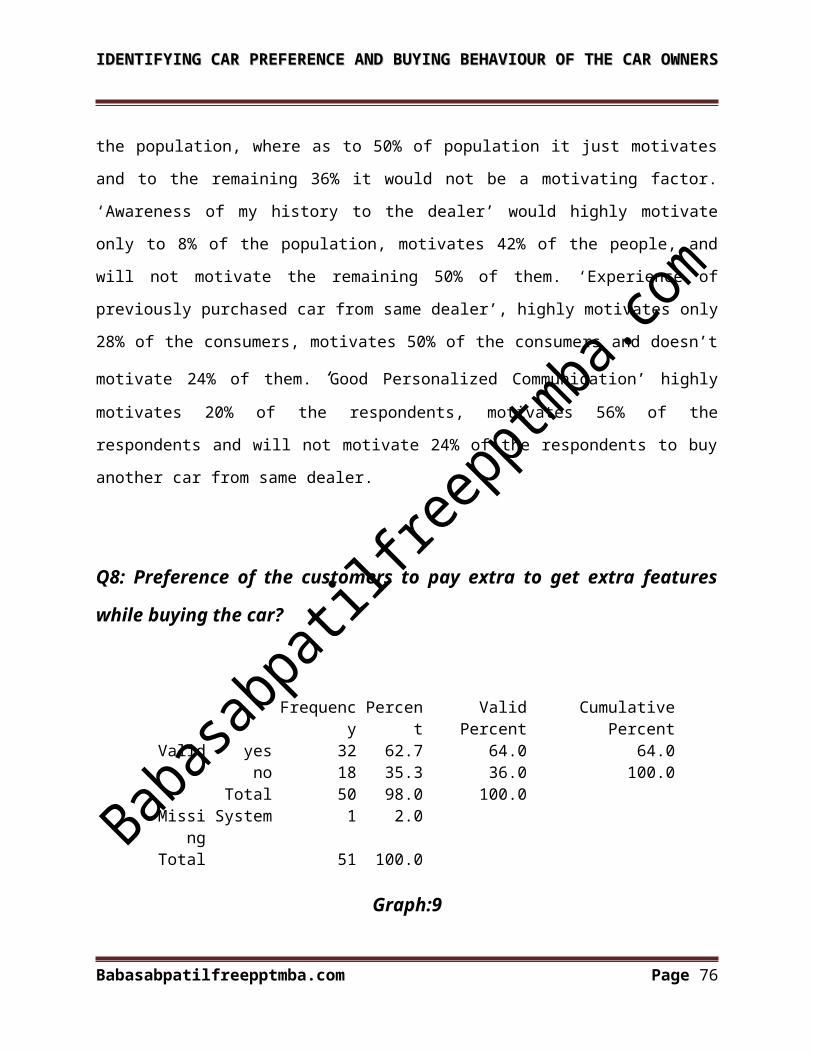
IDENTIFYING CAR PREFERENCE AND BUYING BEHAVIOUR OF THE CARIDENTIFYING CAR PREFERENCE AND BUYING BEHAVIOUR OF THE CAR OWNERSOWNERS
67% of the consumers currently own Fuel-efficient cars
Around 94% of the consumers prefer to personally visit the dealership firm to buy the
car. That is they want to touch and feel the product personally and converse with the
concerned person.
There are very less consumers using net for buying cars. 58% of the people are reluctant
to use net and say that nothing can motivate them. Among the minimums, the highest
percentage i.e., 14% of them say that ‘Ability to contact concerned person over net’
might motivate them to use net more.
About 57% of the customers prefer to share with the dealer the information about
‘Future vehicle preference’ and around 47% like to share about their ‘needs and wants’.
Majority of the consumers expect the dealer to carry out customer satisfaction survey
after sale and after service and also send them service reminders via telephone/e-mail.
Babasabpatilfreepptmba.com Page 76
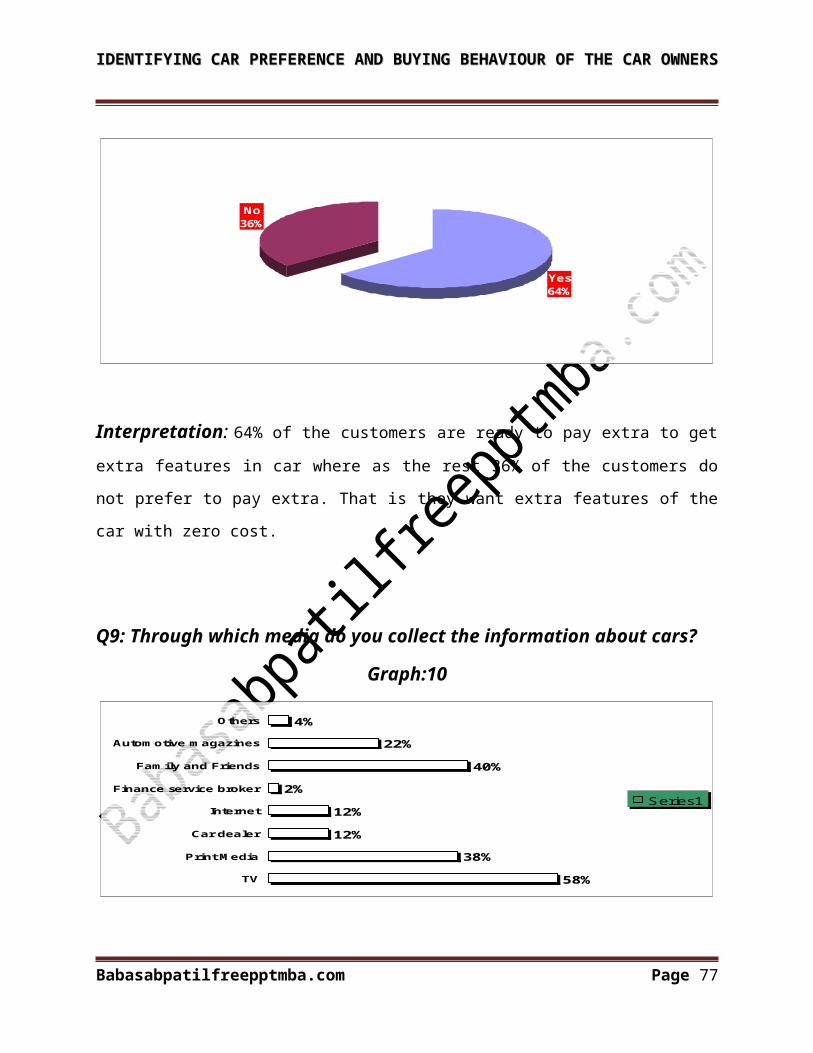
IDENTIFYING CAR PREFERENCE AND BUYING BEHAVIOUR OF THE CARIDENTIFYING CAR PREFERENCE AND BUYING BEHAVIOUR OF THE CAR OWNERSOWNERS
Babasabpatilfreepptmba.com Page 77

IDENTIFYING CAR PREFERENCE AND BUYING BEHAVIOUR OF THE CARIDENTIFYING CAR PREFERENCE AND BUYING BEHAVIOUR OF THE CAR OWNERSOWNERS
Babasabpatilfreepptmba.com Page 78
RECOMENDATIONS

IDENTIFYING CAR PREFERENCE AND BUYING BEHAVIOUR OF THE CARIDENTIFYING CAR PREFERENCE AND BUYING BEHAVIOUR OF THE CAR OWNERSOWNERS
The following are the recommendations to the company. These recommendations are obtained
based on the analysis of the findings.
EXCHANGE OFFERS:
The company must conduct exchange offers for the Toyota big car owners (existing
customers) who have completed their 6 years after purchase and to those who have
completed 4 years after purchase in case of the small cars.
PROMOTIONAL ACTIVITIES:
Promotional activities must emphasize chiefly on style and looks, driving and riding
comforts, societal status and fuel efficiency. Using TV and print media largely for
advertisements would make the company profitable.
RESPONDING QUICKLY TO CONSUMER QUERIES:
Improve ability to respond quickly to consumer queries. An effective lead management
is very important than ever. An integrated continuous approach to lead management can
significantly improve conversion rates and decrease the overall cost of selling cars.
GETTING MOST OUT OF WEB:
Get the most out of the web. With at least some consumers who consider buying their
vehicles online. Integrate C2C tools more tightly into the marketing mix.
PERSONALIZED COMMUNICATION:
Personalize communication with customers do not mass customize. This can have a
positive impact on the vehicle repurchase decisions. Hence, effective CRM program and
the use of advanced technologies would increase effectiveness and efficiency and
improve delivery of services to the consumer. This calls for careful and effective
management of customer information such as personal profiles.
Babasabpatilfreepptmba.com Page 79
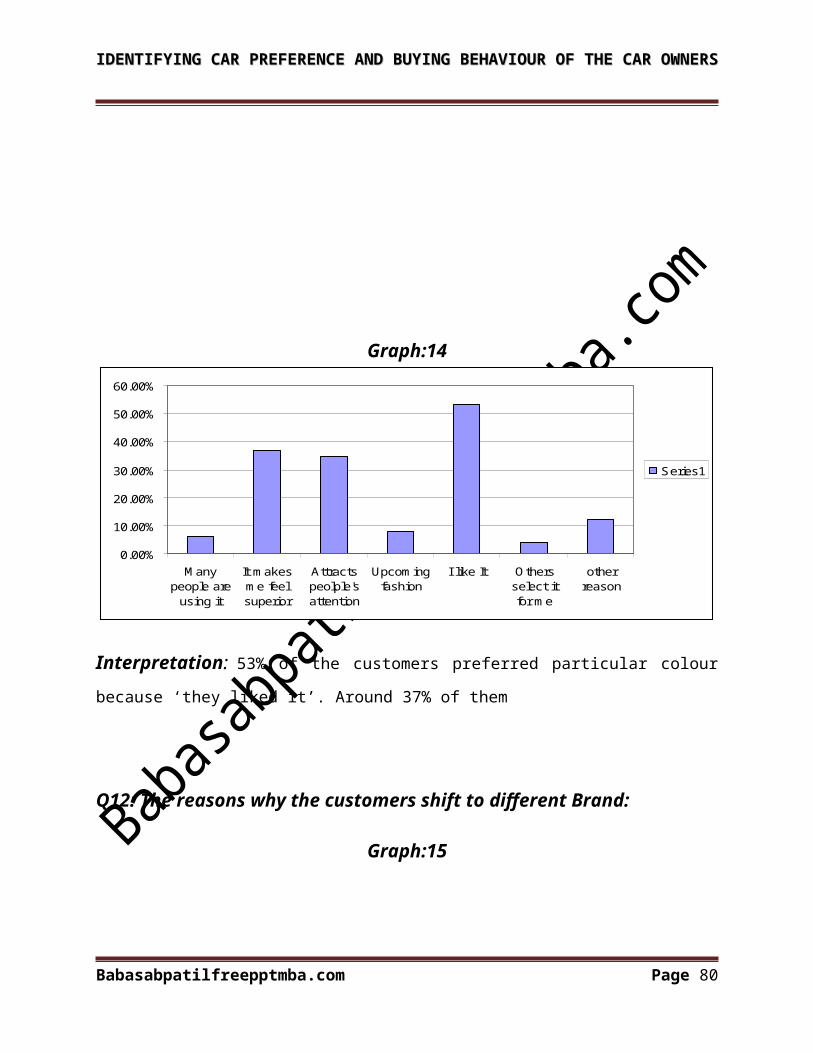
IDENTIFYING CAR PREFERENCE AND BUYING BEHAVIOUR OF THE CARIDENTIFYING CAR PREFERENCE AND BUYING BEHAVIOUR OF THE CAR OWNERSOWNERS
IMPROVING CUSTOMER LOYALITY:
Focus on improving customer loyalty. Improved hospitality and friendliness of sales
staff and service of high quality must be provided, as they are the main factor that boosts
consumer loyalty.
IMPROVE SHOWROOM ATMOSPHERE:
Since 94% of them prefer personal visits, provide very comfortable and impressive
showroom atmosphere.
STOCK DEMANDED COLOURS IN CAR:
Stock more cars only of those colours that are demanded i.e, White, Black, Red &
Metallic silver. This reduces the loss of customer resulting from shortage of demanded
color cars and helps to promote sales.
IMPROVEMENTS IN THE VEHICLE DESIRED:
Concentrate more on improving the mileage of the car as customers are becoming
conscious about fuel efficiency.
Babasabpatilfreepptmba.com Page 80
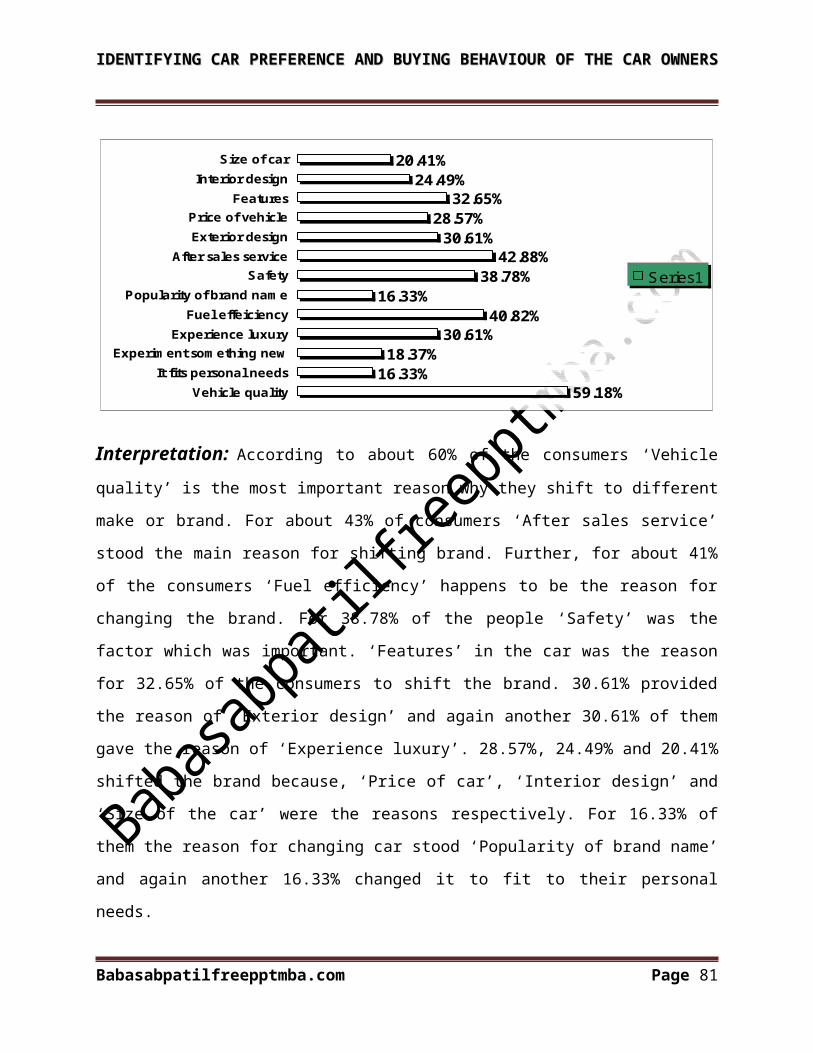
IDENTIFYING CAR PREFERENCE AND BUYING BEHAVIOUR OF THE CARIDENTIFYING CAR PREFERENCE AND BUYING BEHAVIOUR OF THE CAR OWNERSOWNERS
Babasabpatilfreepptmba.com Page 81

IDENTIFYING CAR PREFERENCE AND BUYING BEHAVIOUR OF THE CARIDENTIFYING CAR PREFERENCE AND BUYING BEHAVIOUR OF THE CAR OWNERSOWNERS
Babasabpatilfreepptmba.com Page 82
CONCLUSION
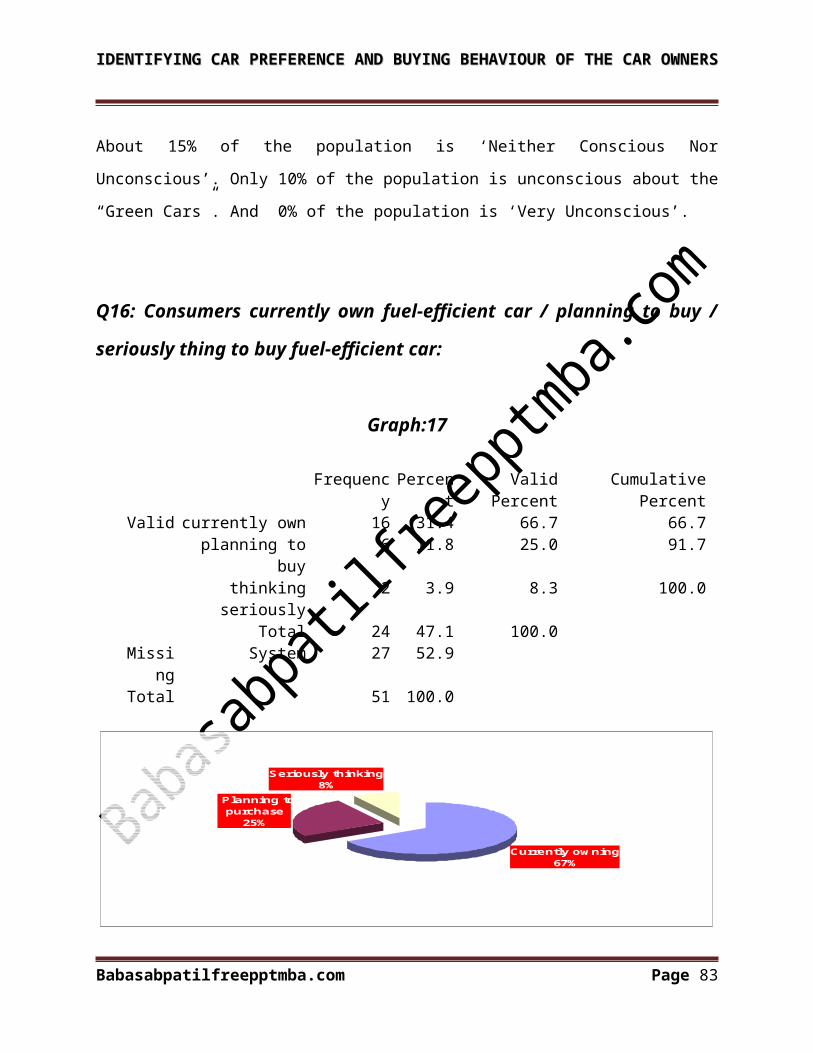
IDENTIFYING CAR PREFERENCE AND BUYING BEHAVIOUR OF THE CARIDENTIFYING CAR PREFERENCE AND BUYING BEHAVIOUR OF THE CAR OWNERSOWNERS
CONCLUSION
Consumer attitudes about the vehicle buying process have become increasingly sophisticated, as
have the tools at their disposal. This has resulted in the need for automotive companies to
fundamentally re-think over their approach to critical areas such as sales, marketing and
advertising, post-sale communication, CRM and manufacturer/dealer collaboration. In some
cases this may involve a change of mindset as well as significant financial investments, but these
opportunities hold the potential for great returns and are, in fact, necessary in today’s market.
Addressing these changes and challenges will not be possible in a single step. This will be a
process of evolution. But companies that start this process well prepared with the right consumer
information and insight will be heading in the right direction.
Babasabpatilfreepptmba.com Page 83

IDENTIFYING CAR PREFERENCE AND BUYING BEHAVIOUR OF THE CARIDENTIFYING CAR PREFERENCE AND BUYING BEHAVIOUR OF THE CAR OWNERSOWNERS
BIBILOGRAPHY
Babasabpatilfreepptmba.com Page 84

IDENTIFYING CAR PREFERENCE AND BUYING BEHAVIOUR OF THE CARIDENTIFYING CAR PREFERENCE AND BUYING BEHAVIOUR OF THE CAR OWNERSOWNERS
Marketing Management ( Philip Kotler ).
Statistical Techniques (Gaur).
Icfai journals: Consumer behaviour.
News Papers.
Google Search: “Cars Online”, “Future car trends AOL Autos”
Babasabpatilfreepptmba.com Page 85
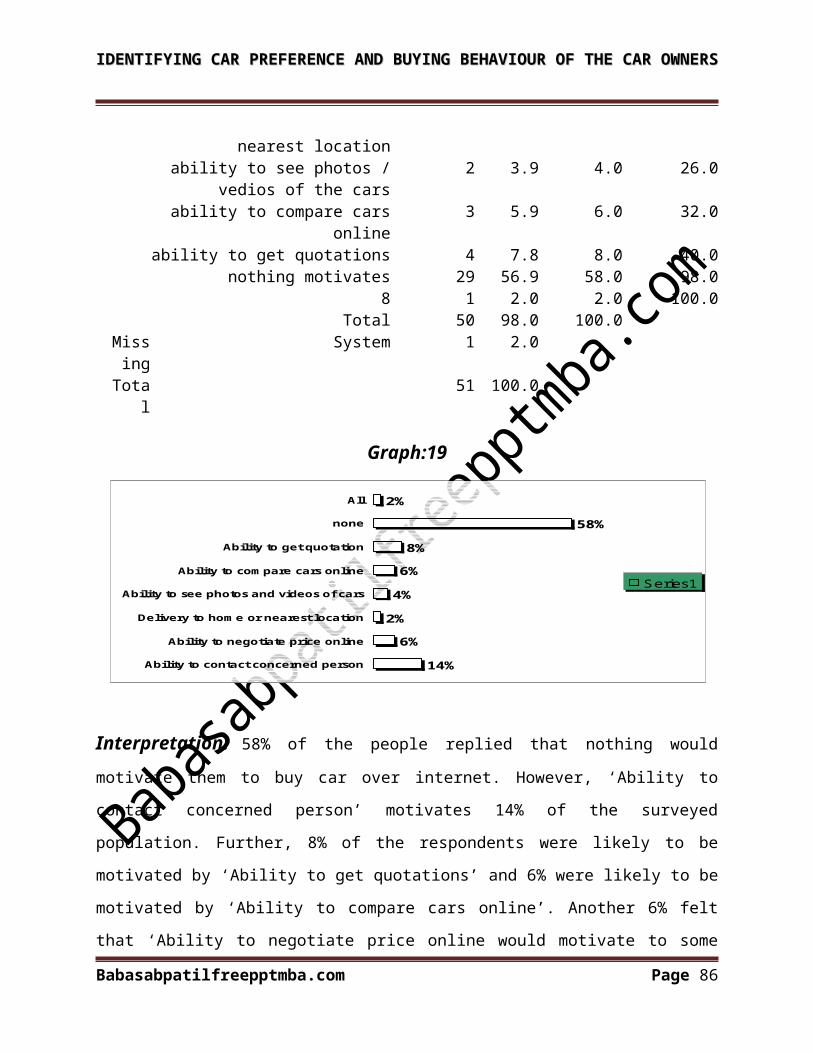
IDENTIFYING CAR PREFERENCE AND BUYING BEHAVIOUR OF THE CARIDENTIFYING CAR PREFERENCE AND BUYING BEHAVIOUR OF THE CAR OWNERSOWNERS
ANNEXURE
Babasabpatilfreepptmba.com Page 86