a previously unknown zinc finger protein dst regulates drought and salt tolerance...
TRANSCRIPT
Supplemental Data
A previously unknown zinc finger protein DST regulates drought and salt
tolerance in rice via stomatal aperture control
Xin-Yuan Huang1, 2, Dai-Yin Chao1, 2, Ji-Ping Gao1, Mei-Zhen Zhu1, Min Shi1 & Hong-Xuan Lin1, 3
1National Key Laboratory of Plant Molecular Genetics, Shanghai Institute of Plant Physiology and
Ecology, Shanghai Institutes for Biological Sciences, Chinese Academy of Sciences, 300 Fenglin
Road, Shanghai 200032, China
2These authors contributed equally to this work.
3Corresponding author.
E-MAIL: [email protected]; FAX: 86-21-54924015

ZH11 dst 52-5 26-4 41-3 73-1Vector Complemented RNAi
B
A
DST
Actin
ZH11 dst 41-3 73-1
RNAiC
0
20
40
60
80
100
ZH11 dst
Complemented RNAi
Perc
enta
ge o
f thr
ee ty
pe s
tom
ata
(%) completely
closepartially opencompletely open
52-5 73-1
Vector
D
0102030405060708090
100
Surv
ival
rate
(%)
ZH11
52-5
26-4
41-3
73-1
Vector Complemented RNAi
dst
a aa
b bcc
E
0
10
20
30
40
50
60
70
H2O
2co
nten
t (nm
olg
FW-1
)
ZH11 dst
Complemented RNAi
52-5 73-1
Vector
b
a
a
b
Huang_Suppl Fig 1
Supplemental Figure S1. The phenotypes in transgenic lines. (A) Survival rate of transgenic lines containing vector control, complementation and RNAi constructs under 100 mM NaCl for 15 days. Data are presented as mean±s.e.m. (24 or more plants for each line and 3 replications (n = 3). Columns with different letters indicate significant difference (P<0.05, least significant difference test). (B) Leaf width of transgenic lines containing vector control, complementation and RNAi constructs at the seedling stage. Scale bar, 1cm. (C) RT-PCR analysis shows that the expression of DST was downregulated in RNAi transgenic lines. (D) The percentage of three levels of stomatalopening in transgenic lines containing vector control, complementation and RNAiconstructs. For each genotype plants, total 80 stomata were randomly selected for analysis. (E) Quantitative measurement of H2O2 in the seedling leaves of transgenic lines containing vector control, complementation and RNAi constructs. Data are presented as mean±s.e.m. (n = 4, 16 plants in each repeat). Columns with different letters indicate significant difference (P<0.05, least significant difference test).

0
2
4
6
8
10
12
ZH11 dst
Pani
cle
num
ber p
er p
lant
P = 0.0050
0
5
10
15
20
25
30
ZH11 dst
Pani
cle
wei
ght p
er p
lant
(g)
P = 0.47
0
20
40
60
80
100
ZH11 dst
Seed
set
per
cent
age
of m
ain
pani
cle
P = 0.52
0.0
0.5
1.0
1.5
2.0
2.5
3.0
ZH11 dst
100-
grai
n w
eigh
t of m
ain
pani
cle
(g)
P = 0.10
0
5
10
15
20
25
ZH11 dst
Mai
n pa
nicl
e le
ngth
(cm
)
P = 0.00016
0
50
100
150
200
ZH11 dst
Gra
in n
umbe
r of m
ain
pani
cle P = 0.42
A B C
D E F
Huang_Suppl Fig 2
Supplemental Figure S2. Comparison of agronomic traits in the WT (ZH11) and dstmutant. (A) Panicle number per plant. (B) Grain number of main panicle. (C) Seed set percentage of main panicle. (D) 100-grain weight of main panicle. (E) Main panicle length. (F) Panicle weight per plant. Data are shown as mean±s.e.m. (n = 12). A Student’s t-test was used to generate the P values.

**
0
0.05
0.10
0.15
0.20
0.25
0.30
0.35
ZH11 dst ZH11 dst
Control Salt stress
Stom
atal
cond
ucta
nce
(mol
H2O
m-2
s-1 )
*
Huang_Suppl Fig 3
Supplemental Figure S3. Stomatal conductance of ZH11 and dst mutant under normal growth condition or salt stress treatment. Sixty-day-old plants grown in a greenhouse were treated without (control) or with 100 mM NaCl for 12 days (salt stress). The stomatal conductance were measured as described in Materials and methods. Data are presented as mean ± s.e.m (For ZH11, n = 9 in control and n = 11 in salt stress. For dst, n= 12 in control and salt stress.); * and ** indicate P < 0.05 and P < 0.01, respectively (Student’s t test).

35S∷
DST
-GFP
Non
-tran
sgen
ic p
lant
B
GFP Bright field Merged35
S∷D
ST-G
FPN
on-tr
ansg
enic
pla
ntA
Huang_Suppl Fig 4
Supplemental Figure S4. Subcellular localization of DST in transgenic rice plants. (A) The root of non-transgenic rice plant (upper panel) or transgenic rice plant (lower panel) that were transformed with a DST-GFP fusion construct under the control of CaMV 35S promoter. Confocal microscopic analyses showed that the fluorescence of DST-GFP was detected exclusively in the nucleus. The non-transgenic plant was used as a negative control. Scale bars represent 50 μm. (B) The magnification picture of (A). Scale bars represent 10 μm. All confocal images in (A) or (B) were taken under identical conditions.

GFP Bright field Merged
Non
-tran
sgen
ic p
lant
Pro D
ST::D
ST-G
FP
Huang_Suppl Fig 5
Supplemental Figure S5. Expression pattern of DST in the leaf of rice plant. The leaf of non-transgenic rice plant (upper panel) or transgenic rice plant (lower panel) that were transformed with a DST-GFP fusion construct under the control of DST native promoter. Confocal microscopic analyses showed that the fluorescence of DST-GFP was detected in stomatal apparatus cells. The non-transgenic plant was used as a negative control. The red arrow indicates the stomata. Scale bars represent 50 μm. All confocal images were taken under identical conditions.
00.20.40.60.81.01.21.41.6
OsLHY
Rel
ativ
e ex
pres
sion
leve
l
5:30
7:30
9:30
11:3
013
:30
15:3
0
17:3
019
:30
21:3
023
:30
1:30
3:30
5:30
0102030405060708090
OsPRR1
Rel
ativ
e ex
pres
sion
leve
lR
elat
ive
expr
essi
on le
vel
0
1
2
3
4
5
UBQDST
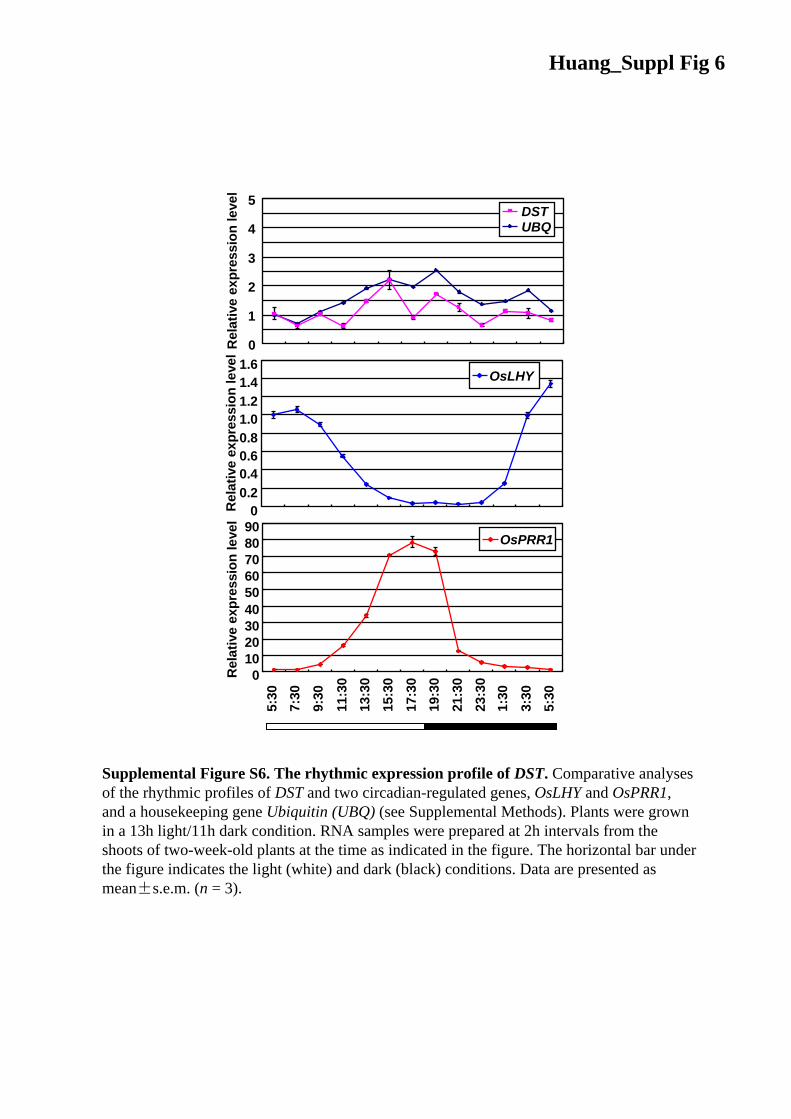
Supplemental Figure S6. The rhythmic expression profile of DST. Comparative analyses of the rhythmic profiles of DST and two circadian-regulated genes, OsLHY and OsPRR1, and a housekeeping gene Ubiquitin (UBQ) (see Supplemental Methods). Plants were grown in a 13h light/11h dark condition. RNA samples were prepared at 2h intervals from the shoots of two-week-old plants at the time as indicated in the figure. The horizontal bar under the figure indicates the light (white) and dark (black) conditions. Data are presented as mean±s.e.m. (n = 3).
Huang_Suppl Fig 6

Huang_Suppl Fig 7
Supplemental Figure S7. Quantitative analysis of the transactivational activity levels of DST, DST-M1 (N69D), DST-M2 (A162T) and DST-M (N69D and A162T). The β-galactosidase activity was measured using the substrate chlorophenol red-β-D-galactopyranoside (CPRG). The error bars represent the s.e.m. of three independent experiments. Columns with different letters indicate significant difference (P<0.05, least significant difference test).
0
5
10
15
20
pAD pGBKT7 pDST pDST-M1 pDST-M2 pDST-M
Rel
ativ
e β
-gal
acto
sida
seun
its a a a
b
cc

HisFPHis-DST
*
*
HisFP His-DST
His-DST-M
His-DST-Δ
ZF
Supplemental Figure S8. DST binds to the B3 sequence in a dosage-dependant manner and required the zinc finger domain. (A) Dosage-dependent binding of DST protein to the B3 sequence. The amount of His fusion DST protein in the lane 3 to lane 6 was 0.061, 0.121, 0.242, 1.21 µg, respectively. (B) Schematic diagrams of His fusion proteins used in EMSA. His, His tag; ZF, zinc finger domain. (C) SDS-PAGE analysis of His fusion proteins. The red arrows indicated the target proteins. (D) EMSA with mutation form of DST protein or the truncate protein with the deletion of zinc finger domain. The arrow, asterisk and triangle in (A) and (D) indicate the up-shifted bands, nonspecific binding and free probe, respectively. FP: free protein.
A
His ZF
N69DA162T
His-DST
His-DST-M
His-DST-ΔZF
B
C D
Huang_Suppl Fig 8
17013095725543
34
26
17
His-DST
His-DST-M
His-DST-Δ
ZF
His Marker
(kDa)
(LOC_Os01g28030)
(LOC_Os11g41710)
(LOC_Os10g38630.2)
(LOC_Os10g38110)
Peroxidase 24 precursor
Putative glutathione S-transferase OsGSTU2
Cytochrome P450 71D10
Cytochrome P450 94A2
Actin
WT dst
Huang_Suppl Fig 9
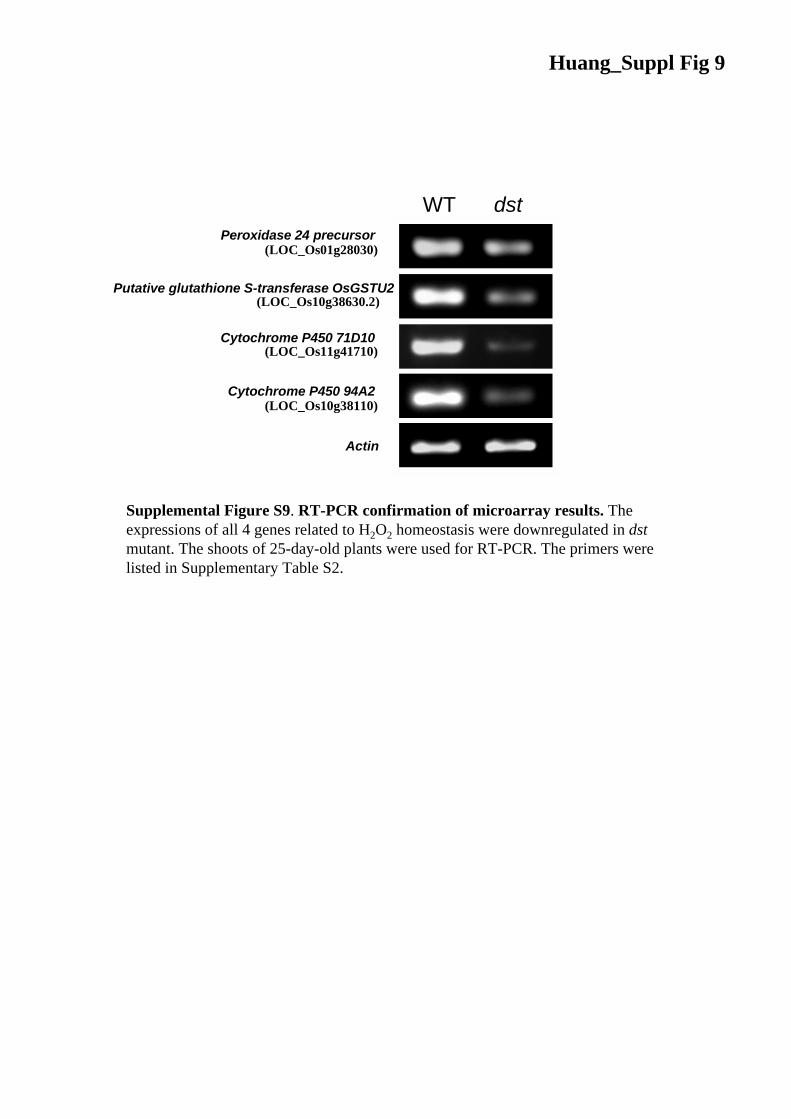
Supplemental Figure S9. RT-PCR confirmation of microarray results. The expressions of all 4 genes related to H2O2 homeostasis were downregulated in dstmutant. The shoots of 25-day-old plants were used for RT-PCR. The primers were listed in Supplementary Table S2.

Peroxidase 24 precursor (LOC_Os01g28030)
AtgacatagtTGtTAgctgTTTGtttatctggattattagctttttgttagttgttagccacccaataatttaaaaaagcacctttagagtggattactagattatagtaatctggcttatagattgtaataatttattataataagctatatgttcgttgcagcttactcataataatccagattataataatcataagctgaatcaaacaggaccttaattgattagaagagcattaattattttaaggtggtttcacatgcatgcatgtctcccgtgggctaaagacccacgtataatttcatcatatctagacatatgtactataagcattaatttatgtgtagattaatccggctaataaaaacacaaagcaaacaaaaagatacaacacattcatactaaagttacactgttctatattttgcaaacttaggccatatatatttgtgtgcaagttcaagtgattgacagataaaaaaaatagacgactaaCAAATAGCAaaactgtaatttattttaatatcatcaagacacatcagcaacaacttgtatatatggtcaattaatatgtaataatgtattagtacccggcgtacaagtatatagatacacttgcacatacatcggttggctatatatataaccgatgagtcgatataaaattataaattaactcggctagctagctagatagagctcacggccggtcactactcaccatcgagaggagagcaaaaataattgagtgatagctgttagctaagctacctagcatcatgcagggaggcgccaataataagggcttggtatgcttgatcgccgccgccgccgtggtgttggtattcgccggcagcagcggcattgcggcggcgcaggcggcccgggctgaagaaggggttctacaagaagagctgccccaaggcggaggagatcgcgcagcgggtggtgtggaaccgcgtcgccggcaacccggagctcgccgccaagttcctccgcATG
OsGSTU2 (LOC_Os10g38630.2)
AcggcgacggccggcgacaaggtagggttagggtttcgatcttttgatccgtgcggatcttgtgcttttctttctttggatttcttttcccgaaccgatctaatcactagggttgctcTGaTAccATTGtTAgacTTTGctctaggatcacctaggttagatctagtcgggtggttctatttgggattgatgtttgaactatagagattgaaaacgggagagggtttagatagaccgaccggttgaggtgttggaggatgaagaagtgccggccatcgtcgtcgttggcgctcggttgtcgtggatgcggcgccggtgaggtcgacggcgatgacggctgcgggagtgacggtcgtagatgtcccggcgatgaggtgtggcgcggcggtggcgcttcccgtcactggctgcgccccctctcgatcggattagggtttgtagggtggagttggcggcggcggtgaatctcgtactctgtgccgtgccgacctccacccctcttttatatggcgcagtgtgacgggggctcaccagccattgggctggacgcccccgatcagagcgtggtcaaggtccgttgtgccgttgggcccgacgggtgggagatctatctaacagtaaatagctagtactagtaatcatatccatCAAAcgttaTAGCAtgagcgtcatggatgatgcattgtaatgtttcgtgccttttccctcgctgcatatttataccgctactcaaggcgatctcgacaccaaacaagcacaattaatctgaataattgaagttcagagcagcagattaatactcctaattagtcctaccgaaatggccgcagaaggtgagctgaagctgctgggaacatgggcgagcccctacgtctccagagtgaagctcgccctccacctcaagggcctgagctacgagtacgtcgtcgaggaggatcacttcaacaacaagagcgagctcctcctcagctccaacccggtgcacaagaaggtccccgtgATG
Cytochrome P450 71D10 (LOC_Os11g41710)AgtgctgatcaatcatcgcatgcgctaattaaattaataattcatcttaggaatcacagcgtcaacagaaaaatcatactgaattcatgaaatgatcctgacagatcatacacgattgtacatgcataacgttatcatatattgtcatcaagaaaactcaaaaggtactattcactaatatttgagactatctattatttttcaagcagttgagatttttctcttgttcatcagacactcttttagtactagatCAATatgTAtCAacaactcacacatttatgtgtttctttaattatctcgaggtgaaggagcgaggaagggtctgtcctaaaacttaaaaaagtgtattggcataaattcttatcagtatatatgaaacacaaagttatgaactgtattagcataataatgcataaataattattcagaaaagaaaaaacaaagcaaactgaaaattacacttcgatcatttgtactaataattaattgaacttgcaaccttaatttagattgtataagtgtgcgtaggctatgacttgtgcgtgaatgcaagtagtgtacttggatactggtgtgtgtgtctgtctatctatctatctatctatatatatatatatatatatataaaaccaggcgactaataattaaggaagtagctatttttttatttgttaatagcccactaattttgtaaggtgtggcttctaatataagttgtgcgccgcaacttaggcaagacacaagcaaagaattaaggagaattaagtatttaccatgtgcgattatgtggttgcaaagtgtggtttttaaagattctggcatcaaccaaattgtggccccacaagttgatggtgcagatcgagctattgaagaatggactatataaagaaccaagctgctcaactgcaagagcaaacgaaatgcaagtgaactctcttttgcatagataCAAAatttTAGCAactttgtatcgatctggtgcaagacaacacaagccATG
Cytochrome P450 94A2 (LOC_Os10g38110)aactagtagataatctaaaagaaatctctaggcttatgagtacttgttgtaaagcttatgggtctactttcatatggttttggtcccacattaaatttactcattagttgttaggaatcgacaaaacaaaccacgtacctcatacaatccaagtttgatttgggtcctagacgttgtaattatatcgttggctaagcccaagagggcatacgccctagggcttatgtttttCAATtcaTAtGCAgggattagtcttctaggcgaggtcaatcggacaacgtatggttgataaccagagtagaagTGgTAttacgATTGcagggttcggatcatattgatcggaagccagaagccagaagccagatcgtgagtgtcaaattttcaccaaatCAATcTAatCAatacctatcgaaagtttgctcatcagtacgtcattctcgatcggccggcggaaaggaaaaaaaagtaagaccaacttgctggaagcatacaaaacgaaccaccgtacggcaccgagttatcgccgccaggtcagttggtttagtgtttgtccttccgtgctagactgctactccctccgttttataatgtaaaactttctagcattatctatatacatatagattttaatgaatttaaacatatacatatgtttagattcattaatatttaaatgaatgtggataatattagaaatttttacattgtaaaagggagaaagtagtagtcaaacactccaaacctaaattgcccaatcacaagatatctaccactgtaggctgtagcatggcatgcggttcacgattccatccacatacttctgcccattcggaacccactaggctatctatcgatctgtataaaacgagagacgcatcgacgacgtaaaatctaaaaggagcacatctcactcaggctggccggccgaaatcgatcggcagcaaaggccaaccaaactaagccaagagcgagctagctaagctggttttctgcttgtgccATG
Huang_Suppl Fig 10
Supplemental Figure S10. Distribution of DBS in the 1-kb promoters of Peroxidase 24 precursor, OsGSTU2, Cytochrome P450 71D10 and Cytochrome P450 94A2. The 1-kb promoter sequences were retrieved from TIGR database (http://rice.plantbiology.msu.edu). DBS was shown in red color. Underlined nucleotides indicated identical nucleotides in DBS. Sequences in blue color were the primers used in ChIP. Sequences boxed in green lines were used as probes for EMSA in Fig. 6A.
0
0.5
1.0
1.5
2.0
0 0.5 3 12 24Time (hour)
Rel
ativ
e ex
pres
sion
leve
l
a a
a
a a
0
20
40
60
80
100
Perc
enta
ge o
f thr
ee ty
pe s
tom
ata
(%) completely
closepartially opencompletely open
ZH11 dst
Complemented RNAi
52-5 73-1
A
B
Huang_Suppl Fig 11
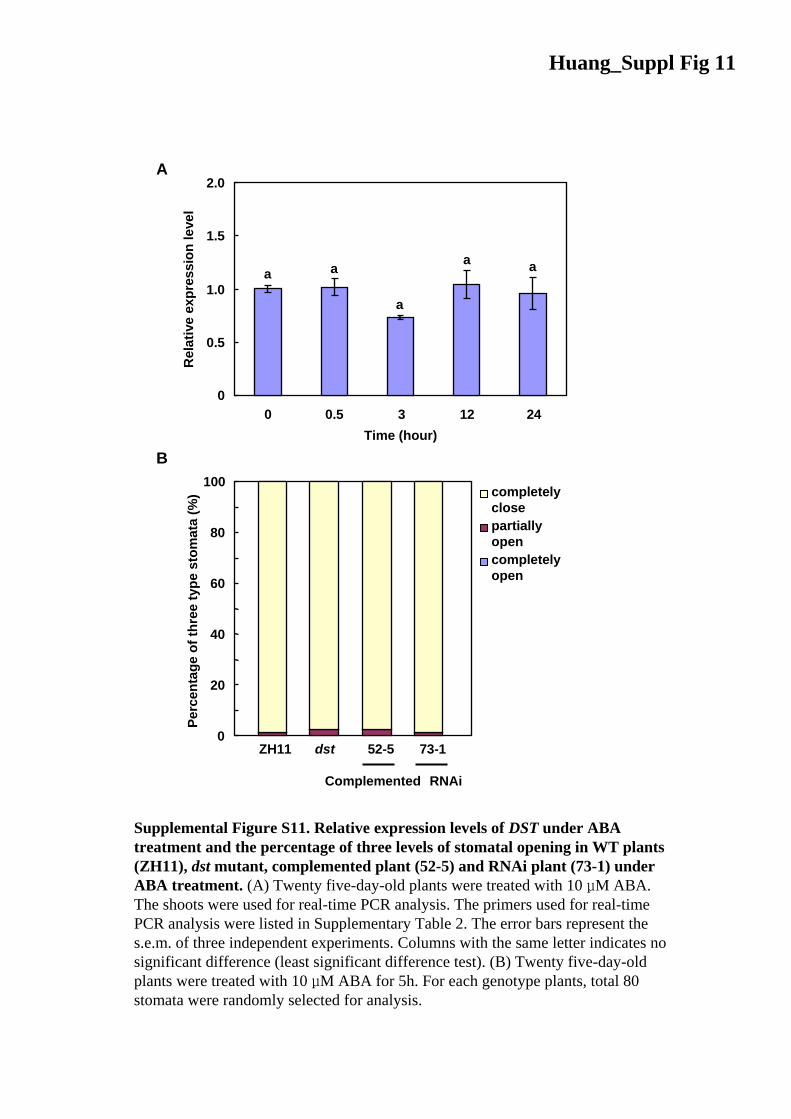
Supplemental Figure S11. Relative expression levels of DST under ABA treatment and the percentage of three levels of stomatal opening in WT plants (ZH11), dst mutant, complemented plant (52-5) and RNAi plant (73-1) under ABA treatment. (A) Twenty five-day-old plants were treated with 10 μM ABA. The shoots were used for real-time PCR analysis. The primers used for real-time PCR analysis were listed in Supplementary Table 2. The error bars represent the s.e.m. of three independent experiments. Columns with the same letter indicates no significant difference (least significant difference test). (B) Twenty five-day-oldplants were treated with 10 μM ABA for 5h. For each genotype plants, total 80 stomata were randomly selected for analysis.

Supplementary Table S1. The molecular marker primers used in map-based cloning.Primer name Type Forward primer (5'- 3') Reverse primer (5' - 3') EnzymeRM6970 SSRa TCGCTTGTGTTTTCTGGGTC TGGAGAATTTGGAGGCTGC -H2275 STSb ATCCCATCCGCATCCTCC CACCCGTCACCCGTCAAC -H2291 STS CGCTAAGGTAAGGGAGGT GCGATAGGTTTAAGAAGG -H2357 STS TGGAGGAAGTTGTTGAGGGT TTTGTTCGGGAATAATGATG -H2423 STS GCCTTTTGTTTTTGCCCA CCGTCCGTCTTATTTGAA -H2433 STS TAGAGTAGAGTGGGTTTG TGGTTGAGATGATTGTTA -H2437 STS TGTGAGAGTTCAGAGAGG AAGCAGAGCTAGGGTTTA -H2441 STS AGACCGACCGAACAGACA ACTCAAGGCCACAGAAGC -H2445 STS TAGGAGAAAAGGAATAAA ATACAGACCCACCAAGAT -H2479 STS AACATAGCATAGCAAGCAGA TTTTAACAAGAGGTAGAACC -H2492 STS CTTTGTTTCTTCCTCACT GGCCTCTAGATCAATTGT -H2519 CAPSc ATGGGCGAGGCGAGTGAT GAGGGCGTGCCGATGTAC Eco RIH2600 STS AAGTGAATGTAAGTGGGTGG GTTGAGGAATAATGGGGAGG -H2734-1 STS ATTTTTGTAGCGGGCATG TAAAGAGGAAACTGAAGC -H2833 STS AGGAGAAGCGAGCGAGAA CCCATTAAGCCTACCAAC -H3050 STS TTTCATTTTGTTATCGTC TTGTAAGCAACCTACTCC -RM3346 SSR AAGAACCAGAGCAAGATCGG CTTCCAATTCGATCGCTAGC -RM3564 SSR CATAAACCGCTCGGCATTG CTGACTCACAAGACAACAGGG -a Simple Sequence Repeat marker (Microsatellite marker).b Sequence tagged site marker.c Cleaved amplified polymorphic sequence marker.

Primer name Primer sequence (5'-3') DescriptionPrimers used in transgenic construction.Rn3-1-F GGATCCATCGGGTGGAATCCCTACTTCTA RNAi constructRn3-1-R TCTAGACTCCAGTTGAGCATGTCGATCATPr-3-F CTGCAGAAAAATAATCAGGAGAGG DST promoter for GUS analysisPr-3-R GTCGACAATAGTAGTGGCAAGAGGpA7-1-F GTCGACATGGACTCCCCGTCGCCT DST-GFP fusion protein constructpA7-1-R ACTAGTGGGAGGCTCAAGTTGAGGTCPrimers used in transactivation activity assay and preparation of His-tag fusion protein in EMSA.pAD1-F AAAGGATCCAAGCGGAATTAATTCCCGAG pAD constructpAD1-R AAAGTCGACCCTCTTTTTTTGGGTTTGGTGGpDST-F AAAGGATCCTGATGGACTCCCCGTCGCCT pDST and pET32a-DST constructpDST-R AAAGTCGACCGAGGCTCAAGTTGAGGTCGAGpDST-Z1-F AAAGGATCCTGAAGGAGCGGAGCATCGGGTG pDST∆N1-72 pDST-Z1-R AAAGTCGACCGAGGCTCAAGTTGAGGTCGAGpDST-C1-F AAAGGATCCTGCACAGCTCGAGCGTGGTTG pDST∆N1-163pDST-C1-R AAAGTCGACCGAGGCTCAAGTTGAGGTCGAGpET-C1-F AAAGGATCCAAGGAGCGGAGCATCGGGTG His-DST-ΔZF protein constructpET-C1-R AAAGAATTCGAGGCTCAAGTTGAGGTCGAGPrimers and probes used for real-time PCR.Act-rt-F TGGTCGTACCACAGGTATTGTGTT Actin primersAct-rt-R AAGGTCGAGACGAAGGATAGCATActp FAM-TGTCAGCCACACTGTCCCCATCTATGAAG-TAMRA Actin probeRTP-F ATCCAAGAAGGCAAGGTCAATC DST primersRTP-R ACACACGAGGAGGAATTGGAADST-pro FAM-CGCCATGTTCTTCTTCTCCAAGCTCCA-TAMRA DST probeRT28030-4-F AACCCATCCTACGCCAGA Peroxidase 24 precursor primersRT28030-4-R CGCCTTGAGGTTCACGAAGTALHY-F CAGATAAGGCCGACACCAAAC OsLHY primersLHY-R GGTGTGTTGGAACCACATGPRR-F CTGCTGAACCTCTGGACCCA OsPRR1 primersPRR-R GGTTCCGATAACGCCAACTCUbi-U GACGGACGCACCCTGGCTGACTAC Ubiquitin primersUbi-L TGCTGCCAATTACCATATACCACGACPrimers and template oligonucleotides used in Bacterial one-hybrid (B1H).DST-B1H-F AAAAAACCATGTACTTGGATGGACTCCCCGTCGCCT pB1H1-DST construct DST-B1H-R AAAGGATCCTTAGAGGCTCAAGTTGAGGTCGAGB1H-RS ACTGGCGCGCCTATCAGN(18)GCGGCCGCATACTACTA template library oligonucleotideU3-sq CAAATATGTATCCGCTCATGAC primer for sequencing pH3U3Primers and template oligonucleotides used in EMSA.Bio-B1H-RS-F Biotin-ACTGGCGCGCCTATCAGBio-B1H-RS-R Biotin-TAGTAGTATGCGGCCGCB1H-RS-F ACTGGCGCGCCTATCAG primers for amplifing B3 B1H-RS-R TAGTAGTATGCGGCCGCB3 ACTGGCGCGCCTATCAGATGCTAGAATTGCCCCTTGCGGCCGCATACTACTA B3 template oligonucleotideM1 ACTGGCGCGCCTATCAGCCGCTAGAATTGCCCCTTGCGGCCGCATACTACTA M1 template oligonucleotideM2 ACTGGCGCGCCTATCAGATTTTAGAATTGCCCCTTGCGGCCGCATACTACTA M2 template oligonucleotideM3 ACTGGCGCGCCTATCAGATGCCCGAATTGCCCCTTGCGGCCGCATACTACTA M3 template oligonucleotideM4 ACTGGCGCGCCTATCAGATGCTAACATTGCCCCTTGCGGCCGCATACTACTA M4 template oligonucleotideM5 ACTGGCGCGCCTATCAGATGCTAGACCTGCCCCTTGCGGCCGCATACTACTA M5 template oligonucleotideM6 ACTGGCGCGCCTATCAGATGCTAGAATCTCCCCTTGCGGCCGCATACTACTA M6 template oligonucleotideM7 ACTGGCGCGCCTATCAGATGCTAGAATTGAACCTTGCGGCCGCATACTACTA M7 template oligonucleotideM8 ACTGGCGCGCCTATCAGATGCTAGAATTGCCAATTGCGGCCGCATACTACTA M8 template oligonucleotideM9 ACTGGCGCGCCTATCAGATGCTAGAATTGCCCCCCGCGGCCGCATACTACTA M9 template oligonucleotideM10 ACTGGCGCGCCTATCAGACTCTAGAATTGCCCCTTGCGGCCGCATACTACTA M10 template oligonucleotideM11 ACTGGCGCGCCTATCAGACTCCCGAATTGCCCCTTGCGGCCGCATACTACTA M11 template oligonucleotide
biotin-labled primers for amplifingB3 and mutants
Supplementary Table S2. The primers used for plasmid construction and functional analysis.

M12 ACTGGCGCGCCTATCAG ACTCCCGACCTGCCCCTT GCGGCCGCATACTACTA M12 template oligonucleotideM13 ACTGGCGCGCCTATCAG CTGCTAGAATTGCCCCTT GCGGCCGCATACTACTA M13 template oligonucleotideM14 ACTGGCGCGCCTATCAG ATGATAGAATTGCCCCTT GCGGCCGCATACTACTA M14 template oligonucleotideM15 ACTGGCGCGCCTATCAGACTAGGGAATTGCCCCTTGCGGCCGCATACTACTA M15 template oligonucleotideM16 ACTGGCGCGCCTATCAG ATGCTAGACCCTCCCCTT GCGGCCGCATACTACTA M16 template oligonucleotideM17 ACTGGCGCGCCTATCAGACTAGGGACCCTCCCCTTGCGGCCGCATACTACTA M17 template oligonucleotideEMSA28030-1-F Biotin-AAAAAAATAGACGACTAACAAATAGCAAAACTGTAATTTATTTTAATATC probes of Peroxidase 24 precursorEMSA28030-1-R Biotin-GATATTAAAATAAATTACAGTTTTGCTATTTGTTAGTCGTCTATTTTTTTEMSA41710-1-F Biotin-ATCAGACACTCTTTTAGTACTAGATCAATATGTATCAACAACTCACACATTT probes of Cytochrome P450 71D10EMSA41710-1-R Biotin-AAATGTGTGAGTTGTTGATACATATTGATCTAGTACTAAAAGAGTGTCTGATPrimers used in ChIP.ChIP28030-1-F TTTGTGTGCAAGTTCAAGTG primers of Peroxidase 24 precursorChIP28030-1-R TTGTTGCTGATGTGTCTTGATChIP38630-1-F CCCGAACCGATCTAATCA primers of OsGSTU2ChIP38630-1-R CATCAATCCCAAATAGAACCAChIP41710-1-F TTATTTTTCAAGCAGTTGAGA primers of Cytochrome P450 71D10ChIP41710-1-R CCTTCACCTCGAGATAATChIP38110-1-F GATTTGGGTCCTAGACGTTGT primers of Cytochrome P450 94A2ChIP38110-1-R CTTCTGGCTTCCGATCAATPrimers used in RT-PCR.RT-3-F GCTACTGCTGGCGTTGGG primers of DSTRT-3-R GAGATGGTGCTGGTGCGTActin-F TCCATCTTGGCATCTCTCAG primers of ActinActin-R GTACCCGCATCAGGCATCTGRT28030-4-F AACCCATCCTACGCCAGA primers of Peroxidase 24 precursorRT28030-4-R CGCCTTGAGGTTCACGAAGTART38630-2-F CTGGGCCGCCTACATTGACGA primers of OsGSTU2RT38630-2-R TCCACCGCCGCGAGCATART41710-4-F CGCGACGAAGTGTACGAGTTC primers of Cytochrome P450 71D10RT41710-4-R TTCAGTGTCGTTGCGGTTGTRT38110-4-F CCAGCCACGCCGCGTCAAAC primers of Cytochrome P450 94A2RT38110-4-R TCTTGGCCGAACGCGATGGTGPrimers used for preparation of 6xHis-PRX fusion proteinprx-2F AAAGAATTCATGCAGGGAGGCGCCAATA 6xHis-PRX constructprx-1R AAAAAGCTTGGGAGTTGACGGCGTTGCAC

Probe Set Ida Gene IDb Descriptionc Fold (log2)d q-value (%)e
Os.40418.1.S1_at CF337988 leucine-rich repeat receptor proteinkinase EXS precursor
-6.86 0
OsAffx.27815.1.S1_s_at LOC_Os06g24990 xylanase inhibitor protein 1 precursor -6.42 0Os.39201.1.A1_at CF282032 expressed protein -5.44 0OsAffx.2947.1.S1_at AB126253 YS1-like metal-nicotianamine -5.37 0Os.54323.1.S1_atf AK103330 expressed protein -4.75 0Os.50200.1.S1_at AK120065 cycloartenol synthase -4.51 0Os.47668.1.S1_atg CR285805 putative susceptibility homeodomain
transcription factor-4.47 0
Os.47668.1.S1_x_atg CR285805 putative susceptibility homeodomaintranscription factor
-4.35 0
Os.6820.1.S1_s_atf AK103330 expressed protein -4.17 0Os.22884.1.A1_at LOC_Os01g28030 peroxidase 24 precursor -3.94 0Os.22427.1.S1_at AK063090.1 cortical cell-delineating protein -3.51 0Os.54422.1.S1_at LOC_Os03g38790 expressed protein -3.47 0OsAffx.27752.1.S1_s_at LOC_Os06g21410 pollen-specific arabinogalacta protein
BAN102-3.43 0.69
Os.7732.1.S1_at NM_197489 glutathione S-transferase GSTU6 -3.38 0Os.53336.1.S1_x_ath LOC_Os10g39510 expressed protein -3.22 0
OsAffx.31233.1.S1_ati LOC_Os05g48710 expressed protein -3.09 0Os.27306.1.S1_at AK066476 expressed protein -2.96 0.69OsAffx.31233.2.S1_s_ati LOC_Os05g48710 expressed protein -2.94 0
Os.53336.1.S1_ath LOC_Os10g39510 expressed protein -2.91 0.69Os.5774.1.S1_at NM_197112 expressed protein -2.88 0Os.35688.1.S1_at LOC_Os11g44870 cytokinin-regulated kinase-like -2.81 0Os.5216.1.S1_at AK109701.1 expressed protein -2.81 0Os.25556.1.S1_at XM_482032 Lignostilbene-alpha, beta-dioxygenase
and related enzymes-2.77 0
Os.9765.1.S1_a_at AY346336 RPE1 protein -2.66 0Os.22712.1.S1_at AK105329 putative glycine-rich RNA-binding -2.54 0Os.7121.1.S1_at NM_197576 expressed protein -2.50 0OsAffx.2794.1.S1_at XM_465818 hypothetical protein -2.41 0OsAffx.1887.1.S1_x_at AK066440 expressed protein -2.33 0Os.10498.1.S1_at AK065202.1 unknown protein -2.31 0.69Os.20261.1.S1_at AK067543 cytochrome P450 71D10 -2.30 0Os.37577.1.S1_s_atj LOC_Os08g25050 PIF-like orf1 -2.21 0
Os.37577.1.S1_atj LOC_Os08g25050 PIF-like orf1 -2.20 0Os.12222.1.S1_a_at AK062244 flavonol synthase/flavanone 3- -2.14 0.92Os.6845.1.S1_at NM_197248 nonspecific lipid-transfer protein -2.10 0Os.10360.1.S1_at AK099925.1 cytochrome P450 94A2 -2.07 0Os.6645.1.S1_s_at LOC_Os07g24830 thionin-like peptide -2.04 0.92Os.11197.2.S1_x_at LOC_Os09g30438 expressed protein -1.97 0Os.51488.1.S1_at AK062934 hypothetical protein -1.96 0.92
Supplementary Table S3. Microarray analysis of dst mutant plants. Genes which were downregulated orupregulated 3 folds in dst mutant compared with WT were listed.

Os.27794.1.S1_at LOC_Os04g27190 terpene synthase 7 -1.80 0Os.9454.1.S1_at AK121834 expressed protein -1.76 0Os.27864.1.S1_at LOC_Os04g59200 peroxidase 12 precursor -1.63 0OsAffx.17142.1.S1_x_atj LOC_Os08g25050 PIF-like orf1 -1.60 0.92Os.47445.1.S1_at LOC_Os02g26210 flowering promoting factor-like 1 1.61 0Os.46591.1.S1_x_at AK060338.1 epoxide hydrolase 1.63 0.54Os.6626.1.S1_x_at AU164017 expressed protein 2.06 0Os.47388.1.S1_s_atk AK104237 extracellular ribonuclease LE precursor 2.13 0Os.25251.1.A1_at AK103313 expressed protein 2.15 0.54Os.22886.1.A1_at AU029551 Triosephosphate isomerase, cytosolic 2.15 0Os.20902.1.A1_at CF337464 Autophagy-related protein 8 precursor 2.17 0.54Os.28427.1.S2_a_at AK119556 expressed protein 2.21 0Os.12922.1.S1_atk AK104237 extracellular ribonuclease LE precursor 2.26 0Os.15060.1.S1_at BI809805 expressed protein 2.27 0Os.7566.1.S1_at LOC_Os04g53950 Glycosyl hydrolases family 16 protein 2.29 0Os.38086.1.S1_at AK099977.1 expressed protein 2.78 0.82Os.28405.1.S1_x_atl AK059258 ATP binding protein 2.94 0Os.9343.1.S1_a_at AK099423 expressed protein 3.05 0Os.17491.1.S1_at BI812940 alpha-galactosidase precursor 3.05 0Os.10721.1.S1_at AK061392 expressed protein 3.44 0.54Os.18443.1.S1_at AK073119 expressed protein 3.45 0Os.22058.1.S1_at L40338 acidic endochitinase Q precursor 3.70 0.54Os.28405.1.S1_atl AK059258 ATP binding protein 4.01 0Os.23944.1.A1_at CA760907 NAm 4.37 0Os.1175.1.S1_at AB036787 casein kinase II subunit alpha-1 4.52 0Os.23623.1.A1_at LOC_Os01g38650 expressed protein 4.54 0Os.7244.1.S1_at AK063762 acyl-CoA dehydrogenase 4.73 0Os.22372.1.S1_at AK063825 putative susceptibility homeodomain
transcription factor4.99 0
Os.47438.1.A1_at CR288637 glutathione S-transferase GSTU6 5.79 0OsAffx.28164.1.S1_at LOC_Os06g48030 peroxidase 16 precursor 8.87 0.82
e The q-value (%) was generated by SAM.
m There is no annotation in the TIGR database.
a Describes names of probe set on Affymetrix chip.b TIGR locus number or Genbank accession number.c Gene annotation in the TIGR database.d Fold change of the dst mutant compared with the wild-type. Value are showed as log2 of fold change valuecalculated by the software Significance Analysis of Microarrays (SAM)
f-l The probe sets with the same superscript letter are corresponding to the same gene. Sixty eight probe sets arecorresponding to 60 genes in this table.

1
Supplemental Methods
Map-based cloning of DST
The dst mutant also has a wide leaf phenotype. As the wide leaf is a typical and
visible phenotype, it became the standard dst phenotype for map-based cloning. The
DST locus was roughly mapped to the long arm of chromosome 3 using the gene pool
method. The dst mutant was crossed with IR29, a narrow leaf indica variety, to
generate an F2 population. Three hundred ten plants with wide leaves were selected
for rough mapping. For fine mapping, an F2 population of 3,725 plants was generated.
The molecular marker primers are listed in Supplemental Table S1.
Physiological analysis
The maximum leaf width was measured with a portable area meter (LI-3000A,
LI-COR Inc., Lincoln, NE, USA). The Na+ and K+ contents of roots or shoots were
determined by the atomic absorption spectrophotometer (AA Series, Thermo
Elemental) (Lin et al. 2004; Ren et al. 2005). Water loss was measured by placing
detached leaves on a laboratory bench in ambient laboratory conditions and recording
their fresh weight at various time points. Water loss was expressed as the percentage
of initial fresh weight. The measurement of relative water content (RWC) was
performed as described previously(Ascenzi and Gantt 1999) with slight modifications.
Briefly, five or six fully expanded leaves were detached and the fresh weight was
measured immediately. The leaves were immerged into double distilled H2O
overnight for rehydration. The turgid weight was obtained by quickly blotting the
leaves dry and reweighing. The leaves were then dried at 90°C for at least 3 h before
measuring the dry weight. For measurement of osmolality, the leaf sap was extracted
2
using a leaf press (LP-27, Wescor Inc. USA). Osmolality was then measured with a
vapor pressure osmometer (Vapro 5520, Wescor Inc. USA).
Measurement of endogenous ABA by gas chromatography-mass spectrometry
The leaves of 20-day-old plants were weighed (about 0.5 g) and frozen immediately
in liquid nitrogen. Frozen samples were stored at -80°C until extraction. Plant samples
were extracted at -20°C with an extraction solution containing 5 ml of 80% methanol,
10 mg PVP, some SiO2 and 100 ng of [(±)-7,7,7-d3]-ABA. The extract was filtrated to
remove the residue and the aqueous phase was concentrated with a rotary evaporator.
The aqueous phase was dissolved in 5 ml of ddH2O, and then lyophilized three times
at -20°C. The lipophilic solution was centrifuged and the aqueous phase was brought
to approximately pH2.8 with 2 N HCl and partitioned three times into EtOAc. EtOAc
extracts were then combined and evaporated. The dried residue was dissolved in 0.1
M HAc and run through a C18 column (Sep-Pak, Cartridges). Two drops of NH4OH
was added to the solution before evaporation. The dried residue was dissolved in 2
drops methanol and methylated by adding diazomethane for gas
chromatography-mass spectrometry (GC-MS) analysis ((TRACETM GC 2000 (CE
INSTRUMENT); VOYAGER MASS (Finnigan, Thermo-Quest)). For quantification,
ions of m/e 162 and 190 for Me-ABA and 165 and 193 for Me-[d3]-ABA were
selected. The amount of endogenous ABA content was calculated by the endogenous
peak divided by the internal standard peak area multiplied by amount of internal
standard divided by fresh weight.
Vector construction and plant transformation
To create a complementation construct, a BAC clone (clone name, OSJNBb0024J17)
3
plasmid was digested with ApaLI, polished with T4 DNA polymerase and digested
with SalI. A 4,632-bp DNA fragment (containing the full-length DST genomic
sequence, the 2,026-bp sequence before ATG and the 1,700-bp sequence after TAG)
was isolated and inserted into the SalI-EcoRI site of pCAMBIA1301, in which the
EcoRI site was blunted. To generate the DST-RNAi construct, a 535-bp gene-specific
fragment of DST coding sequence was PCR amplified and inserted into p1300RNAi
(modified from pCAMBIA1300). All resulting constructs were confirmed by
sequencing, then transformed into the rice genome by Agrobacterium tumefaciens
(strain HA105)-mediated transformation as described previously (Hiei et al. 1994).
The primer sequences are listed in Supplemental Table S2.
RNA isolation and quantitative real-time PCR
Total RNA was isolated using TRIzol reagent (Invitrogen) from shoots of 20-day-old
seedlings growing under normal or stress conditions. RNA was treated with RQ1
RNase-free DNase I (Promega) to remove potential genomic DNA contamination
before it was used as a template for first-strand cDNA synthesis. Quantitative
real-time PCR was performed using Taqman probe technology in a Rotor-Gene 3000
thermocycler (Corbett Research) with Realtime PCR Master Mix (Toyobo) in Fig. 4k
and Supplemental Fig. S11A. The cycling conditions were 1 min at 95°C and then 40
cycles of amplification (95°C for 20 s, 60°C for 20 s and 72°C for 40 s). In Fig. 6e,
Quantitative real-time PCR was performed in a Rotor-Gene 3000 thermocycler
(Corbett Research) with Realtime PCR Master Mix SYBR Green (Toyobo). The
cycling conditions were 5 min at 95°C and then 40 cycles of amplification (95°C for
15 s, 60°C for 20 s and 72°C for 40 s). For normalization, the ACTIN gene was used
as an endogenous control. The ΔΔCt method was used for real-time PCR analysis.

4
ΔCt values were calculated by first normalizing Ct values to the endogenous control,
and subsequently calculating ΔΔCt values using the ΔCt value of 0 hour as a reference.
Relative expression level was calculated using the 2-ΔΔCt formula. Each real-time PCR
analysis was repeated three times. The sequences of the primer and probe for ACTIN,
DST and peroxidase 24 precursor are listed in Supplemental Table S2.
Rhythmic expression profile of DST.
Plants were grown in a 13h light/11 h dark condition, and the light began at 5:30 AM.
RNA samples were prepared as mentioned above at 2h intervals from the shoots of
two-week-old plants. Quantitative real-time PCR was performed in a Bio-Rad CFX96
Real-Time PCR detection System (Bio-rad) with Realtime PCR Master Mix SYBR
Green plus (Toyobo). The cycling conditions were 1 min at 95°C and then 40 cycles
of amplification (95°C for 15 s, 60°C for 15 s and 72°C for 45 s). Two
circadian-regulated genes, OsLHY (Izawa et al. 2002) and OsPRR1 (Murakami et al.
2007), and a housekeeping gene Ubiquitin (UBQ) (Jain et al. 2006) were as positive
and negative control, respectively. The sequences of the primers for OsLHY, OsPRR1
and Ubiquitin (UBQ) are listed in Supplemental Table S2.
Isolation of mesophyll cell protoplasts (MCP) and guard cell protoplasts (GCP)
from rice leaves
The method used for isolation of MCP and GCP was modified from the procedures
described previously (Kruse et al. 1989; Fairleygrenot and Assmann 1992; Pandey et
al. 2002). After removing the midveins, more than 25 fully expanded leaves of
30-day-old rice plants were cut into ~0.5 cm sections and blended with 200 mL
ddH2O for 80 s using a blender (Waring blender model LB20ES). The blended
5
material was filtered through a 200 μm nylon mesh, rinsed once with ddH2O and then
transferred into a flask with 25 mL of an enzyme mixture containing 0.7% cellulysin
cellulase, Trichoderma viride (Sigma), 0.1% (w/v) polyvingl pyrrolidone 40 000
(PVP-40), 0.25% bovine serum albumin (BSA Fraction V, Sigma), 0.01% cordycepin
(Sigma), 0.0033% actinomycin D (Sigma) in 55% (v/v) basic medium (5 mM
2-(N-Morpholino) ethanesulfonic acid (Sigma), pH 5.5, 0.5 mM CaCl2, 0.5 mM
MgCl2, 10 μM KH2PO4, 0.5 mM ascorbic acid (Sigma), and 0.55 M sorbitol), 45%
(v/v) deionized water. The flask was placed in a shaking water bath at 24°C with the
shaking speed set to 160 rpm. After 3h digestion, 75 mL basic medium was added,
and the mixture was shaken for an additional 5 min. The mixture was filtered through
a 30 μm nylon mesh, and washed twice with 50 mL basic medium. The MCP was
collected by centrifugating the filtrate at 12000rpm for 5 min. The epidermal
fragments were transferred to another flask with 25 mL of basic medium containing
2% Cellulase RS (Yakult, Japan), 0.04% Pectolyase Y23 (Yakult, Japan), 0.25% BSA,
0.01% cordycepin (Sigma), 0.0033% actinomycin D (Sigma), pH 5.5, and incubated
at 24°C in a shaking water bath (100 rpm). After incubation for 7h, the mixture was
filtered through a 30 μm nylon mesh, and washed twice with 50 mL basic medium.
The GCP was collected by centrifugating the filtrate at 12000rpm for 5 min, and
suspended with 10 mL basic medium. Purification of GCP with Histopaque No.1077
(Sigma) was performed as described previously (Pandey et al. 2002). Two different
transcription inhibitors, actinomycin D and cordycepin, were used to prevent changes
of gene expression during protoplast isolation (Leonhardt et al. 2004).
Quantitative real-time PCR analysis of peroxidase 24 precursor in MCP and GCP
Total RNA of MCP and GCP was isolated using TRIzol reagent (Invitrogen)

6
according to the manufacturer’s instructions. The first-strand cDNA was synthesized
using a QuantiTect Rev. Transcription Kit (QIAGEN). Quantitative real-time PCR
was performed in a Rotor-Gene 3000 thermocycler (Corbett Research) with Realtime
PCR Master Mix SYBR Green (Toyobo). The cycling conditions were 5 min at 95°C
and then 40 cycles of amplification (95°C for 15 s, 60°C for 20 s and 72°C for 40 s).
The sequences of the primer for peroxidase 24 precursor are listed in Supplemental
Table S2. For comparison of the expression of peroxidase 24 precursor in MCP and
GCP of ZH11 in Fig. 6e, the expression level in GCP was calculated using the ΔCt
value of MCP as a reference. In Fig. 6f, the expression level in GCP, MCP and leaf in
dst mutant was calculated using the ΔCt value of ZH11 as a reference, respectively.
DST subcellular localization and promoter-GUS expression pattern
To investigate the subcellular location of DST, the full-length coding sequence of DST
was fused in-frame to GFP and transcribed from a 35S promoter. The plasmids were
introduced into onion epidermal cells using particle bombardment (PDS-1000/He
Particle Delivery System, Bio-Rad). Bombarded tissues were examined using a
confocal laser-scanning microscope (Carl Zeiss LAM510). For subcellular
localization of DST in transgenic rice, the plasmids above were digested with HindIII
and EcoRI. The fragments containing a 35S promoter and full-length DST fused
in-frame with GFP were inserted into the HindIII-EcoRI site of pCAMIA1301 to form
a 35S::DST-GFP construct, and used for transforming rice.
For analysis of DST tissue expression pattern, the 2,709-bp promoter sequence
of DST was PCR amplified and subcloned into vector p1300-GN to create a fusion of
the promoter and β-glucuronidase (GUS) reporter gene (ProDST::GUS) (Ren et al.
2005). Transgenic plants were generated as described above. GUS histochemical
7
staining was performed as described previously (Jefferson et al. 1987). To generate
the ProDST::DST-GFP construct, the promoter fragment of DST was released from the
ProDST::GUS plasmid with PstI and SalI, and then inserted into the PstI-SalI site of
pCAMBIA1301. The DST-GFP fusion sequence was obtained by digesting
35S::DST-GFP construct with SalI and EcoRI , and inserted into the SalI-EcoRI site
of pCAMBIA1301 mentioned above which containing DST promoter sequence. The
primer sequences are listed in Supplemental Table S2.
Transactivation activity assay
The transactivation activity assay was performed using the Matchmaker GAL4
Two-Hybrid System 3 (Clontech) with some modifications. To construct the positive
control vector pAD, the NLS and GAL4 activation domain sequence of pGADT7 was
amplified by PCR and cloned into pGBKT7 to fuse to the GAL4 binding domain. To
create pDST, pDST∆N1-72 and pDST∆N1-163, the full-length coding sequence and the
N-terminus deletion of DST were PCR amplified. The PCR products were digested
with BamHI and SalI and cloned into pGBKT7 to fuse to the GAL4 binding domain.
The point mutation constructs were generated by substituting the WT sequence with
mutant sequence using the following enzymes: Eam1105I and MluI for pDST-M1;
MluI and KpnI for pDST-M2; Eam1105I and KpnI for pDST-M. The C-terminal
deletion constructs were created by digesting pDST with MluI and SalI for
pDST∆C146-301, and Van91I and SalI for pDST∆C176-301, and then self-ligating. The
pDST73-175 construct was made by digesting pDST∆N1-72 with PstI and self-ligating.
All plasmids were transformed into yeast strain AH109. The overnight yeast colonies
were diluted to an OD600 of 0.5, serially diluted and dropped on either -Trp SD media
or -Trp/-His/-Ade SD media. The primer sequences are listed in Supplemental Table

8
S2. The β-galactosidase activity was measured using the substrate chlorophenol
red-β-D-galactopyranoside (CPRG; Roche Biochemicals) according to the Yeast
Protocols Handbook (Clontech).
Genechip analysis
The whole seedlings of three-week-old plants were harvested. Three biological
replicates were performed for WT and dst mutant, respectively. Total RNA was
extracted from rice seedlings and used for cDNA and labeled cRNA synthesis
according to the Affymetrix GeneChip expression analysis technical manual. The
fragmented cRNA, together with control targets recommended by Affymetrix, were
hybridized to Rice Genome Array (Affymetrix, Santa Clara, CA) that contains
~48,564 japonica and 1,260 indica sequences representing 46,000 unigenes. The
chips were incubated (16–17 hours at 45°C and 60 rpm) in a rotating oven, washed by
the Affymetrix Fluidics Station using the recommended signal amplification step and
scanned by the Affymetrix Scanner.
The probe signal from triple biological replicates of each experiment was
normalized using MicroArray Suite 5.0 software (Affymetrix). The probe sets with
signal value lower than 500 in triple biological replicates of WT and dst mutant were
filtered out. To identify differentially expressed genes, we analyzed the data using the
software Significance Analysis of Microarrays (SAM) (Tusher et al. 2001) in a
two-class unpaired analysis with 100 permutations. A delta value was chosen to obtain
the statistically differentially regulated genes with a false-discovery rate (FDR) of
approximately 1%. A gene with q-value (%) less than 1 and fold change greater than 3
(up-regulated) or less than 0.33 (down-regulated) was considered a differentially
expressed gene.
9
Chromatin Immunoprecipitation (ChIP)
ChIP assay was performed using a method modified from the previous report
(Johnson et al. 2002). Leaves of 25-day-old plants were cut into pieces and incubated
in 1% formaldehyde for 30 min under vacuum. The cross-linking was stopped by
adding glycine to a final concentration of 0.125 M. Tissues were rinsed with water and
ground into a fine powder with liquid nitrogen. To extract chromatin, the powder was
resuspended in SDS lysis buffer (1% SDS, 10 mM EDTA, 50 mM Tris, pH 8.1, 1 mM
phenylmethylsulfonyl fluoride (PMSF), 1 µg ml-1 aprotinin and 1 µg ml-1 pepstatin A).
The chromatin DNA was sonicated to reduce DNA length and diluted 1:10 in
chromatin immunoprecipitation dilution buffer (0.01% SDS, 1.1% Triton X-100, 1.2
mM EDTA, 16.7 mM Tris-HCl, pH 8.1, 167 mM NaCl). The chromatin solution was
precleared with Protein A agarose beads blocked with salmon sperm DNA (Upstate
Biotechnology). Immunoprecipitations were performed with anti-DST antiboby. The
DST–bound chromatin was purified by incubation with Protein A agarose beads
blocked with salmon sperm DNA and washing with low-salt wash buffer (0.1% SDS,
1% Triton X-100, 2 mM EDTA, 20 mM Tris-HCl, pH 8.1, 150 mM NaCl), high-salt
wash buffer (0.1% SDS, 1% Triton X-100, 2 mM EDTA, 20 mM Tris-HCl, pH 8.1,
500 mM NaCl), LiCl wash buffer (0.25 M LiCl, 1% IGEPAL-CA630, 1%
deoxycholic acid (sodium salt), 1 mM EDTA, 10 mM Tris, pH 8.1), and TE buffer.
The DST–bound chromatin was eluted from Protein A agarose beads with elution
buffer (1% SDS, 0.1 M NaHCO3). After reversing the cross-linking by the addition of
NaCl to a final concentration of 200 mM and incubation at 65°C for 4h, the DNA was
purified by treating with 40 mg mL-1 proteinase K for 1 h, following by
phenol/chloroform extraction and precipitation with DNAmate (TaKaRa). The
10
primers used for PCR were listed in Supplemental Table S2.
Supplemental References
Ascenzi, R. and Gantt, J.S. 1999. Molecular genetic analysis of the drought-inducible
linker histone variant in Arabidopsis thaliana. Plant Mol. Biol. 41: 159-169.
Fairleygrenot, K.A. and Assmann, S.M. 1992. Whole-Cell K+ Current across the
Plasma-Membrane of Guard-Cells from a Grass - Zea-Mays. Planta 186:
282-293.
Hiei, Y., Ohta, S., Komari, T., and Kumashiro, T. 1994. Efficient transformation of
rice (Oryza sativa L.) mediated by Agrobacterium and sequence analysis of the
boundaries of the T-DNA. Plant J. 6: 271-282.
Izawa, T., Oikawa, T., Sugiyama, N., Tanisaka, T., Yano, M., and Shimamoto, K. 2002.
Phytochrome mediates the external light signal to repress FT orthologs in
photoperiodic flowering of rice. Genes Dev 16: 2006-2020.
Jain, M., Nijhawan, A., Tyagi, A.K., and Khurana, J.P. 2006. Validation of
housekeeping genes as internal control for studying gene expression in rice by
quantitative real-time PCR. Biochem Biophys Res Commun 345: 646-651.
Jefferson, R.A., Kavanagh, T.A., and Bevan, M.W. 1987. GUS fusions:
beta-glucuronidase as a sensitive and versatile gene fusion marker in higher
plants. EMBO J. 6: 3901-3907.
Johnson, L., Cao, X., and Jacobsen, S. 2002. Interplay between two epigenetic marks.
DNA methylation and histone H3 lysine 9 methylation. Curr. Biol. 12:

11
1360-1367.
Kruse, T., Tallman, G., and Zeiger, E. 1989. Isolation of Guard Cell Protoplasts from
Mechanically Prepared Epidermis of Vicia faba Leaves. Plant Physiol. 90:
1382-1386.
Leonhardt, N., Kwak, J.M., Robert, N., Waner, D., Leonhardt, G., and Schroeder, J.I.
2004. Microarray expression analyses of Arabidopsis guard cells and isolation
of a recessive abscisic acid hypersensitive protein phosphatase 2C mutant.
Plant Cell 16: 596-615.
Lin, H.X., Zhu, M.Z., Yano, M., Gao, J.P., Liang, Z.W., Su, W.A., Hu, X.H., Ren,
Z.H., and Chao, D.Y. 2004. QTLs for Na+ and K+ uptake of the shoots and
roots controlling rice salt tolerance. Theor. Appl. Genet. 108: 253-260.
Murakami, M., Tago, Y., Yamashino, T., and Mizuno, T. 2007. Comparative
overviews of clock-associated genes of Arabidopsis thaliana and Oryza sativa.
Plant Cell Physiol 48: 110-121.
Pandey, S., Wang, X.Q., Coursol, S.A., and Assmann, S.M. 2002. Preparation and
applications of Arabidopsis thaliana guard cell protoplasts. New Phytol. 153:
517-526.
Ren, Z.H., Gao, J.P., Li, L.G., Cai, X.L., Huang, W., Chao, D.Y., Zhu, M.Z., Wang,
Z.Y., Luan, S., and Lin, H.X. 2005. A rice quantitative trait locus for salt
tolerance encodes a sodium transporter. Nat. Genet. 37: 1141-1146.
Tusher, V.G., Tibshirani, R., and Chu, G. 2001. Significance analysis of microarrays
applied to the ionizing radiation response. Proc. Natl. Acad. Sci. 98: 5116-5121.