supplementary information inventory - genes &...
TRANSCRIPT

1
Supplementary Information Inventory:
Figure S1, related to Figure 1.
Both fumurate and succinate are competitive inhibitors of -KG-dependent histone
demethylases in vitro with succinate being more potent than fumarate
Figure S2, related to Figure 2.
Treatment with cell permeable fumarate and succinate increases intracellular
accumulation of fumarate and succinate, respectively
Figure S3, related to Figure 2.
Knocking down endogenous FH or SDH increases intracellular levels of fumarate and
succinateand-KG can rescue the effect of FH or SDH knock-down on altering
histone methylations, HIF1, and endostatin levels in a dose-dependent manner
Figure S4, related to Figure 3.
Knocking down FH or SDH reduces the TET-catalyzed 5hmC production in cultured
cells
Figure S5, related to Figure 4.
Knocking down Fh or Sdha leads to accumulation of intracellular fumarate and
succinate in mouse livers
Figure S6, related to Figure 4.
Knocking down Fh or Sdha increases histone methylations and HIF1, and reduces
endostatin and 5hmC levels in mouse livers

2
Figure S7, related to Figure 4.
Knocking down Fh or Sdha may inhibit the enzymatic activity of TETs not by
down-regulating the transcription of TET genes in mouse livers
Figure S8, related to Figure 3 and 5.
Methylene blue staining
Figure S9, related to Figure 6.
Ectopic expression of wild-type FH or SDH, but not the tumor-derived mutants,
decreases intracellular levels of fumarate and/or succinate
Supplemental Figure Legends
Supplemental Table S1
siRNAs targeting human FH and SDHA/B, and mouse Fh and Sdha
Supplemental Table S2
Primer sequences for quantitative RT- PCR
Supplemental Experimental Procedures
Reference
3
Xiao et al. Supplemental Figure S1
Me3
Me2Me1
Me3Me3Me3Me2 Me2
Me2Me2 Me2
Me1Me1
HsKDM4A
Me1
Me3 Me3 Me3
Me1 Me1Me1 Me1
-KG (M) 0 0 0.3 0.6 0.9 1.2 1.8 3
0 0 0.4 0.8 1.2 1.6 2.4 6
0 15 15 15 15 15 15 15 Succinate (mM)
Me3Me3 Me3
Me3 Me3 Me3Me2 Me2 Me2
Me2Me2Me1
Me2Me1 Me1
Me1 Me1 Me1
Me3
Me2Me1
Me3
Me2
Me1
0 15 15 15 15 15 15 15 -KG (M) Fumarate (mM)
Me3
Me2Me2
0 0 0.3 0.6 0.9 1.2 1.8 3
0
20
40
60
80
Me3
rem
ain
ing
(%
) 100
0 15 15 15 15 15 15 15
Me3
rem
ain
ing
(%
)
0
20
40
60
80
100
0 15 15 15 15 15 15 15
0 0 0.4 0.8 1.2 1.6 2.4 6
HsKDM4A
H3K36me3 H3K36me3
-KG (M)
Fumarate (mM)
-KG (M)
Succinate (mM)
Me1
rem
ain
ing
(%
)
0
B
0
20
40
60
80
100-KG (M)
-KG (M)
H3K9me1
CeKDM7A
-KG(M)Fumarate (mM)
-KG(M)Succinate(mM)
50 50 50 50 100 100 100 100
0 1 3 10
Me0
1 3 10
50 50 50 50 100 100 100 100
0 1 3 10 0 1 3 10
Me0
Me1
Me1 Me1
Me0
Me1
Me1 Me1
Me0
Me0
Me0
Me1 Me0 Me0
Me0
Me1
Me0
Me1
Me1
Me0
Me0
Me1 Me1 Me1 Me1 Me1
Me0
Me0
Me0 Me0Me1
Fumarate (mM)
Succinate (mM)
0 1 3 10
1 3 100 0 0
0 0 0 0
A

4
450000
350000
250000
150000
50000 26.40 26.60 26.80 27.00 27.20 26.40 26.60 26.80 27.00 27.20 26.40 26.60 26.80 27.00 27.20
450000
350000
250000
150000
50000
450000
350000
250000
150000
50000
Xiao et al. Supplemental Figure S2
A
B
-KG Succinate Fumarate Asparate1
10
100
1000
10000Con
Methyl-succinateMethyl-fumarate
n.s.
n.s. n.s.
n.s.
n.s.
n.s.**
**
Rel
ativ
e A
bu
nd
ance
(x1
04)
Succinate/-KG Fumarate/-KG0.1
1
10
100Con
Methyl-succinateMethyl-fumarate** n.s.
n.s. **
Met
abo
lite/
-KG
rat
ioA
bu
nd
an
ce
Elution Time (min)
succinate
fumarate
succinate
fumarate succinate
fumarate
Methy-fumarate Methy-succinate Con

5
Xiao et al. Supplemental Figure S3
A
B
Con siFH
Octyl-KG - - + +
H3K79me2
H3K4me1
H3K4me3
H3
Actin
Endostatin
HIF1
FH
H3K9me2
Con siSDHA
Octyl-KG - - + +
Con siSDHB
Octyl-KG - - + +
H3K79me2
H3K4me1
H3K4me3
H3
Actin
Endostatin
HIF1
SDHA
H3K9me2
H3K79me2
H3K4me1
H3K4me3
H3
Actin
Endostatin
HIF1
SDHB
H3K9me2
Actin
SDHA
Actin
FH
Actin
SDHB
Con siFH
#1 #2 #3
Con siSDHA
#1 #2 #3
Con siSDHB
#1 #2 #3 A
bu
nd
an
ce
Con siSDHA #1 siSDHA #2 siSDHA #3
siSDHB #1 siSDHB #2 siSDHB #3
Elution Time (min)
Ab
un
da
nce
Standard Con siFH #1 siFH #2
6
Xiao et al. Supplemental Figure S4
A
B
C
Con shFH
FH
Actin
Con shSDHA
SDHA
Actin
Con shSDHB
SDHB
Actin
Fla
g-T
ET
5h
mC
DA
PI
pMKO
TET1-CD TET1-CM
shFH #2 shFH #3pMKO pMKO
TET2-CD TET2-CM
shFH #2 shFH #3pMKO
pMKO
TET1-CD TET1-CM
shSDHA #2 shSDHA #3 pMKO pMKO
TET2-CD TET2-CM
shSDHA #2 shSDHA #3 pMKO
Fla
g-T
ET
5h
mC
DA
PI
7
Xiao et al. Supplemental Figure S5
A
B
-KG Succinate Fumurate Asparate1
10
100
1000
10000Scramble siFh
**
*
siSdha
**
p=0.07
n.s.n.s.
n.s.n.s.
Rel
ativ
e A
bu
nd
ance
(x1
05)
MS fractionation identification
Elution Time (min)
Ab
un
dan
ce
8
Xiao et al. Supplemental Figure S6
A
B C
HIF1
Endostatin
Sdha
H3K9me2
H3K79me
2
H3K4me1
H3K4me3
Mouse liver Scramble siSdha #2 Scramble siSdha #3
H3
Mouse liver Scramble siFh #2 Scramble siFh #3
HIF1
Endostatin
Fh
H3K9me2
H3K79me
2
H3K4me1
H3K4me3 H3
H3K27me2 H3K27me2
5hmC IHC assay in mouse liver
Scramble siFh #2 Scramble siFh #3
Scramble siSdha #2 Scramble siSdha #3
Genomic DNA (ng) Methylene Blue staining
500 250 100 50
Scramble
siFh #3
Scramble
siFh #2
5hmC dot-blot assay in mouse liver
Scramble
siSdha #3
Scramble
siSdha #2
Genomic DNA (ng) Methylene Blue staining
500 250 100 50
Actin Actin
9
Xiao et al. Supplemental Figure S7
B
A
0
20
40
60
80
100
0
20
40
60
80
100
siFh Scramble siSdhaScramble
Rel
ativ
e F
h m
RN
A le
vel
Rel
ativ
e S
dh
a m
RN
A le
vel
0
0.5
1
1.5
2
2.5 Scramble
siFh
siSdha
Tet1 Tet2 Tet3
Rel
ativ
e T
et m
RN
A le
vel

10
Xiao et al. Supplemental Figure S8
A
B
Genomic DNA (ng) 500 100 50
shFH+TET2-CD
pMKO+TET2-CD
pMKO+TET2-CM
shFH+TET1-CD
pMKO
pMKO+TET1-CD
pMKO+TET1-CM
pMKO
Methylene blue staining
Genomic DNA (ng) 500 250 100 50
shSDHA+TET2-CD
pMKO+TET2-CD
pMKO+TET2-CM
shSDHA+TET1-CD
pMKO
pMKO+TET1-CD
pMKO+TET1-CM
pMKO
Methylene blue staining
Genomic DNA (ng) 500 250 100 50
shSDHB+TET2-CD
pMKO+TET2-CD
shSDHB+TET1-CD
pMKO+TET1-CD
pMKO+TET1-CM
pMKO
Methylene blue staining
Genomic DNA (ng) 500 250 100 50
pMKO
shFH
shFH+WT
shFH+R190H
TE
T1
Genomic DNA (ng) 500 250 100 50
pMKO
shFH
shFH+WT
shFH+R190H
TE
T2
Methylene blue staining Methylene blue staining
Genomic DNA (ng) 500 250 100 50
pMKO
shSDHA
shSDHA+WT
shSDHA+R190H
TE
T1
Genomic DNA (ng) 500 250 100 50
pMKO
shSDHA
shSDHA+WT
shSDHA+R190H
TE
T2
Methylene blue staining Methylene blue staining
Genomic DNA (ng) 500 250 100 50
pMKO
shSDHB
shSDHB+WT
shSDHB+R190H
TE
T1
Genomic DNA (ng) 500 250 100 50
pMKO
shSDHB
shSDHB+WT
shSDHB+R190H
TE
T2
Methylene blue staining Methylene blue staining
pMKO+TET2-CM
pMKO
250

11
Xiao et al. Supplemental Figure S9
A
B
C
-KG Succinate Fumarate Asparate1
10
100
1000
pMKO shFH shFH+FHWT shFH+FHR190H
shFH+FHH137R
**
n.s.
*
n.s.
n.s.
**R
elat
ive
Ab
un
dan
ce (
x105
)
-KG Succinate Fumarate Asparate1
10
100
1000
pMKO shSDHA shSDHA+SDHAWT shSDHA+SDHAG555E
shSDHA+SDHAR554W
*n.s.
**n.s.*
n.s.
Rel
ativ
e A
bu
nd
ance
(x1
05)
-KG Succinate Fumarate Asparate1
10
100
1000
pMKO shSDHB shSDHB+SDHBWT shSDHB+SDHBR46Q
shSDHB+SDHBA43P
*
n.s.
*n.s.*
n.s. *
Rel
ativ
e A
bu
nd
ance
(x1
05)

12
Supplemental Figure Legends
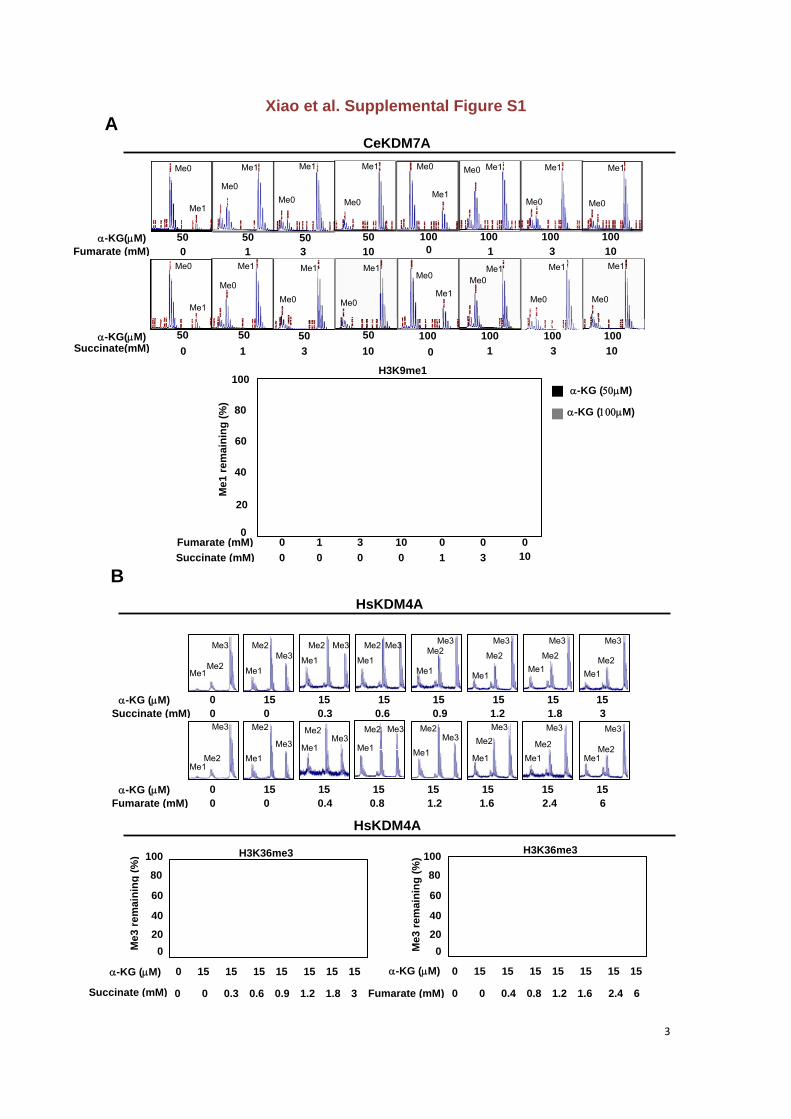
Figure S1. Both fumurate and succinate are competitive inhibitors of -KG-dependent
histone demethylases in vitro with succinate being more potent than fumarate
(A) Both fumurate and succinate compete with-KG, directly inhibiting the activity of
-KG-dependent CeKDM7A in vitro, as determined by mass spectrometry (MS).
(B) The half maximal inhibitory concentration (IC50) of fumarate and succinate on
HsKDM4A was determined by MS.
Figure S2. Treatment with cell permeable fumarate or succinate increases
intracellular levels of fumarate and succinate, respectively
(A) Treatment HEK 293T cells with cell permeable methyl-fumarate (2.5mM) or
methyl-succinate (5mM) increases intracellular levels of fumarate and succinate,
respectively, as determined by gas chromatography-mass spectrometry (GC-MS).
(B) Relative levels of fumurate and succinate and the ratios of succinate/-KG and
fumarate/-KG in HEK 293T cells treated with cell permeable fumarate or succinate.
Asparate was used as an internal control. Error bars represent ±SD for triplicate experiments.
**p<0.01 vs. Control (Con); n.s.= not significant.
Figure S3. Knocking down endogenous FH or SDH increases intracellular levels of
fumarate and succinateand-KG can rescue the effect of FH or SDH knock-down on
altering histone methylations, HIF1, and endostatin levels in a dose-dependent
manner
(A) Knocking down FH or SDHA/B in HeLa cells increases intracellular levels of fumarate
and succinate, respectively, as determined by GC-MS. Three different siRNAs were used for

13
each gene. The knock-down efficiency was verified by western-blot.
(B) HEK293T cells with knock-down of FH or SDHA/B were treated with increasing
concentrations of octyl--KG (2.5mM and 5mM). The alterations in histone methylations,
endostatin, and HIF1 levels were determined by western-blot.
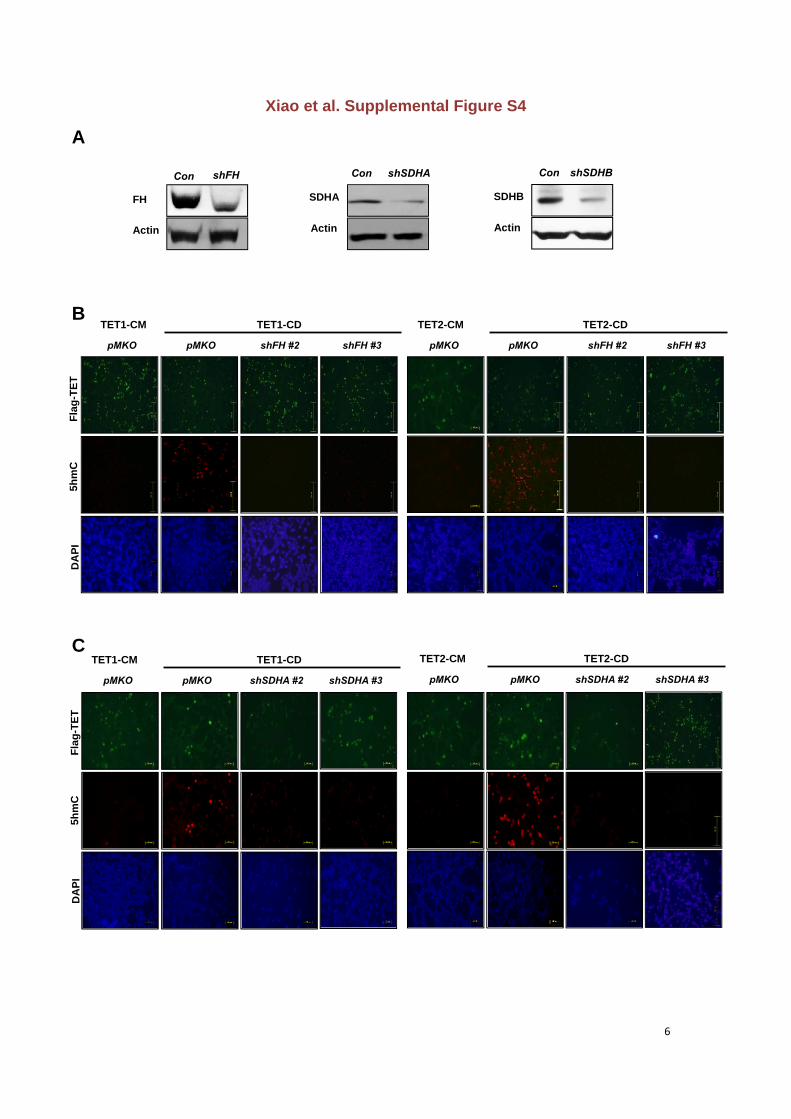
Figure S4. Knocking down FH or SDH reduces the TET-catalyzed 5hmC production in
cultured cells
(A) HEK293T cells with stable knock-down of FH or SDHA/B were transiently transfected
with plasmids expressing indicated proteins. The knock-down efficiency was verified by
western-blot.
(B-C) Cells were fixed and stained with specific antibodies against Flag, 5hmC, and DAPI.
Immunofluorescence staining data are shown. Scale bars represent 251m.
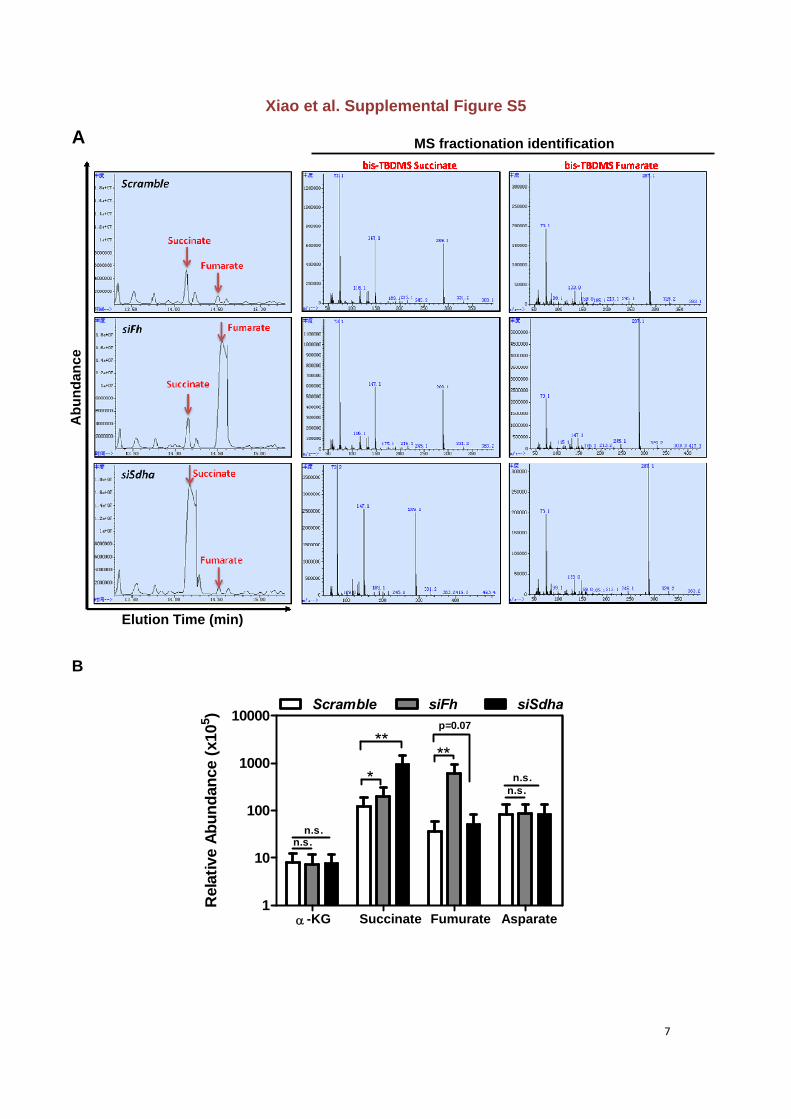
Figure S5. Knocking down Fh or Sdha leads to accumulation of intracellular fumarate
and succinate in mouse livers
(A) MS fractionation identification of derivatized fumurate and succinate in mouse livers after
transient knock-down of Fh or Sdha. Mass fragment spectra from the peaks at 14.141 and
14.510 min were identified as the derivatives of succinate and fumarate, respectively (left
panel). The bis-TBDMS succinate-specific 289-m/z fragment and the bis-TBDMS fumarate
287-m/z fragment are shown (middle and right panels).
(B) Relative levels of fumurate and succinate in mouse livers after transient knock-down of
Fh or Sdha were determined by GC-MS. Asparate was used as an internal control. Error
bars represent ±SD for triplicate experiments. *p<0.05 and **p<0.01 vs. Scramble; n.s.= not
significant.
14
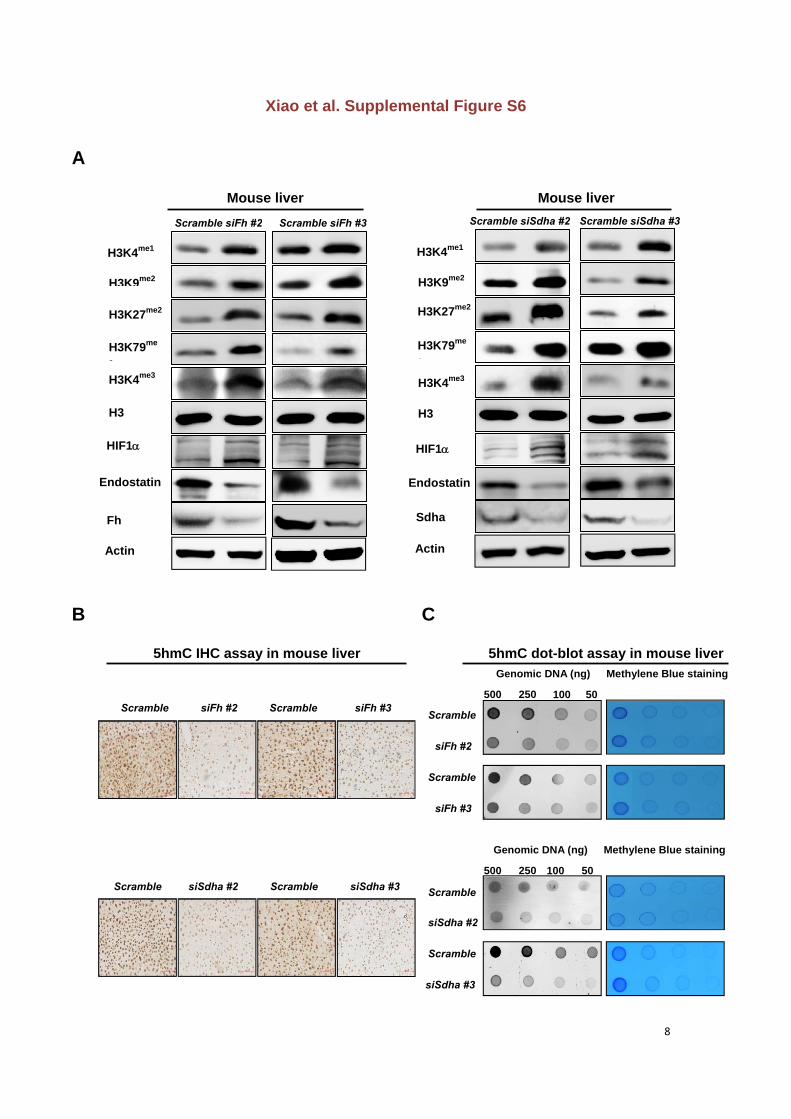
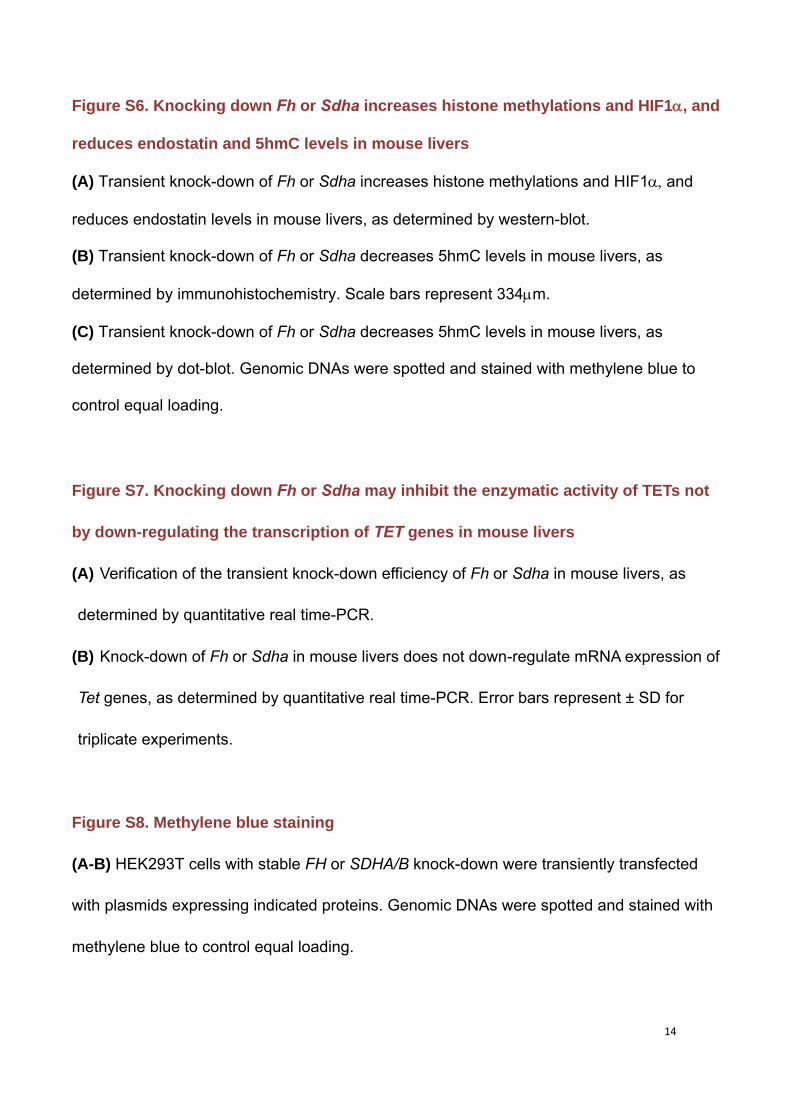
Figure S6. Knocking down Fh or Sdha increases histone methylations and HIF1, and
reduces endostatin and 5hmC levels in mouse livers
(A) Transient knock-down of Fh or Sdha increases histone methylations and HIF1and
reduces endostatin levels in mouse livers, as determined by western-blot.
(B) Transient knock-down of Fh or Sdha decreases 5hmC levels in mouse livers, as
determined by immunohistochemistry. Scale bars represent 334m.
(C) Transient knock-down of Fh or Sdha decreases 5hmC levels in mouse livers, as
determined by dot-blot. Genomic DNAs were spotted and stained with methylene blue to
control equal loading.
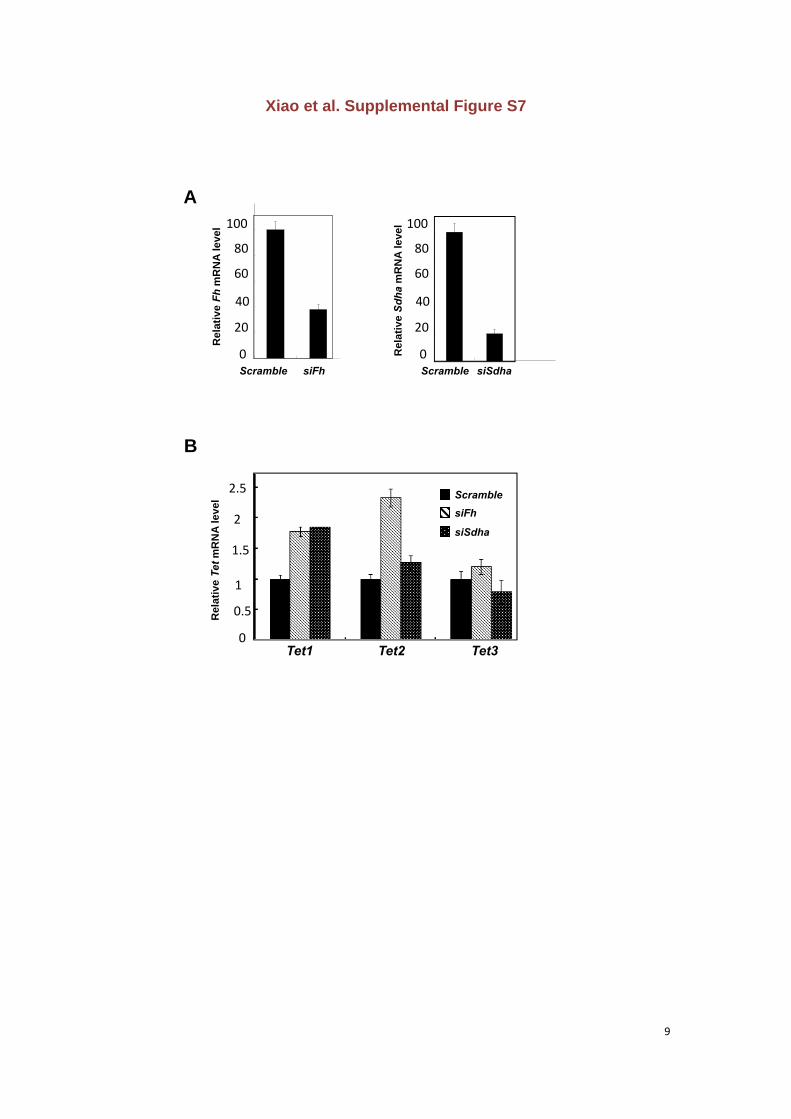
Figure S7. Knocking down Fh or Sdha may inhibit the enzymatic activity of TETs not
by down-regulating the transcription of TET genes in mouse livers
(A) Verification of the transient knock-down efficiency of Fh or Sdha in mouse livers, as
determined by quantitative real time-PCR.
(B) Knock-down of Fh or Sdha in mouse livers does not down-regulate mRNA expression of
Tet genes, as determined by quantitative real time-PCR. Error bars represent ± SD for
triplicate experiments.
Figure S8. Methylene blue staining
(A-B) HEK293T cells with stable FH or SDHA/B knock-down were transiently transfected
with plasmids expressing indicated proteins. Genomic DNAs were spotted and stained with
methylene blue to control equal loading.
15
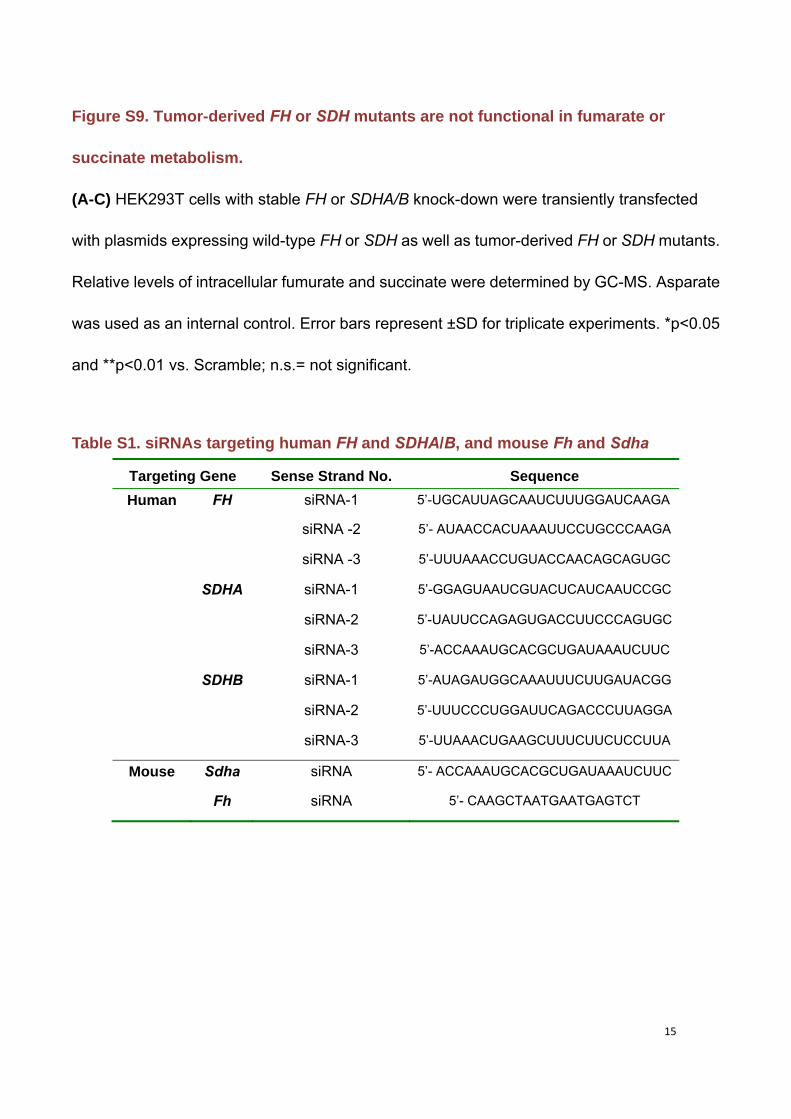
Figure S9. Tumor-derived FH or SDH mutants are not functional in fumarate or
succinate metabolism.
(A-C) HEK293T cells with stable FH or SDHA/B knock-down were transiently transfected
with plasmids expressing wild-type FH or SDH as well as tumor-derived FH or SDH mutants.
Relative levels of intracellular fumurate and succinate were determined by GC-MS. Asparate
was used as an internal control. Error bars represent ±SD for triplicate experiments. *p<0.05
and **p<0.01 vs. Scramble; n.s.= not significant.
Table S1. siRNAs targeting human FH and SDHA/B, and mouse Fh and Sdha
Targeting Gene Sense Strand No. Sequence
Human FH siRNA-1 5’-UGCAUUAGCAAUCUUUGGAUCAAGA
siRNA -2 5’- AUAACCACUAAAUUCCUGCCCAAGA
siRNA -3 5’-UUUAAACCUGUACCAACAGCAGUGC
SDHA siRNA-1 5’-GGAGUAAUCGUACUCAUCAAUCCGC
siRNA-2 5’-UAUUCCAGAGUGACCUUCCCAGUGC
siRNA-3 5’-ACCAAAUGCACGCUGAUAAAUCUUC
SDHB siRNA-1 5’-AUAGAUGGCAAAUUUCUUGAUACGG
siRNA-2 5’-UUUCCCUGGAUUCAGACCCUUAGGA
siRNA-3 5’-UUAAACUGAAGCUUUCUUCUCCUUA
Mouse Sdha siRNA 5’- ACCAAAUGCACGCUGAUAAAUCUUC
Fh siRNA 5’- CAAGCTAATGAATGAGTCT

16
TableS2. Primer sequences for quantitative real time-PCR
Gene Strand Sequence
GAPDH Forward 5’- CATGGCCTTCCGTGTTCCTA
Reverse 5’- GCCTGCTTCACCACCTTCTT
β−ACTIN Forward 5’- TCCCTGGAGAAGAGCTACG
Reverse 5’- GTAGTTTCGTGGATGCCACA
Human HOXA2 Forward 5’-ACAGCGAAGGGAAATGTAAAAGC
Reverse 5’-GGGCCCCAGAGACGCTAA
HOXA4 Forward 5’-TCCCCATCTGGACCATAATAGG
Reverse 5’- GCAACCAGCACAGACTCTTAACC
HOXA5 Forward 5’-TCTCGTTGCCCTAATTCATCTTTT
Reverse 5’-CATTCAGGACAAAGAGATGAACAGAA
Mouse Sdha Forward 5’- ATTTCTACTCAATACCCAGTGGTGG
Reverse 5’- CAACAGTATGTGATCGGGTAGGAAA
Fh Forward 5’- CACGCAGGATGCTGTCCCTCTTACT
Reverse 5’- TTCATGGCTCCACTAAGCTCAACCA
Hoxa10 Forward 5’- ATGAGTCAAGGCAGTTCCAAAGGCG
Reverse 5’- TTAAAGTTGGCTGTGAGCTCCCGGA
Hoxa11 Forward 5’- GAGTACGCCATTGAGCCCGCC
Reverse 5’- AGACGCTGAAGAAGAACTCTCGCT
Hoxa13 Forward 5’- CGCCGACAAGTACATGGACACCGC
Reverse 5’- ACCCCCGAGCCCCGGAACTA
17
Supplemental Experimental Procedures
Antibodies
Antibodies to FH, SDHA, SDHB (Abcam, Cambridge, MA), Flag (Sigma-Aldrich,
Shanghai, China), HIF-1 (Novus Biologicals, Littleton, CO), endostatin (Novus Biologicals,
Littleton, CO), histone H3 (Genescript, Piscataway, NJ), H3K4me1, H3K4me3, H3K9me2,
H3K27me2, H3K79me2 (Abcam, Cambridge, MA), H3K36me2 (Active motif, USA), and
actin (GenScript Corp., Piscataway, NJ) were purchased commercially.
Plasmids, cell culture and transient transfection
Wild-type and catalytic mutant TET1/2 and full-length of human FH, SDHA, SDHB were
cloned into Flag- or GFP-tagged destination vectors (pcDNA3.1) according to different
experimental purposes. Point mutations for FH, SDHA and SDHB were generated by
site-directed mutagenesis by using QuickChange Site-Directed Mutagenesis kit
(Stratagene).
All experiments were carried out in HEK293T cells unless specified otherwise. Cells
were maintained in Dulbecco’s Modified Eagle’s Medium (DMEM) (Invitrogen, Shanghai,
China) supplemented with 10% newborn bovine serum (Biochrom, Germany). Plasmid
transfection was carried out by the calcium phosphate method for HEK293T. In addition,
HeLa and U87-MG glioblastoma cells were transfected by using lipofectamin 2000
(Invitrogen).
The cell permeable octyl--KG ester, methyl-succinate ester and methyl-fumarate ester
were synthesized, and used to treat cells for 4-6 hours with a final concentration of 5mM,

18
5mM, and 2.5mM, respectively.
GC-MS analysis
Upon harvest, cells were fixed by immediate addition of 1ml 80% (v/v) pre-cold (-80 ºC)
methanol into culture plates. Lyophilized samples were oximated with 20mg/ml
methoxyamine hydrochloride in pyridine at 30 C for 60 min. The samples were then
derivatized at 70 °C for 30 min in 80µl pyridine (Sigma-Aldrich) and 20µl
N-methyl-N-(tert-butyldimethylsilyl) trifluoroacetamide (MTBSTFA , Sigma-Aldrich). After
filtration, 3µl of derivatized sample was injected for the GC-MS assay using an Agilent
6890-5973 GC-MS system with a HP-5MS column (30m0.25mm0.25μm). GC oven
temperature was programmed from 60 C to 180 C at 5 C/min and from 180C to 260C at
10C/min. The flow rate of carrier gas was set at 1 ml/min. The mass spectrometer was
operated in the electron impact (EI) mode at 70 eV. Relative concentrations of succinate and
fumuarate were calculated by normalizing succinate (26.48 min) and fumurate (27.06 min)
peak areas to L-threonine (29.58 min), L-serine (29.96 min) and L-phenylalanine (30.74 min)
peak areas. The standard fumarate and succinate were purchased commercially (Sigma,
Shanghai, China).
In addition, mouse livers were rapidly harvested, stored in liquid nitrogen, and then
transferred to -80ºC freezer. Each of frozen tissue samples (100mg) was grinded with liquid
nitrogen into powder, and then homogenized in 1ml 80% (v/v) pre-cold (-80 ºC) methanol.
The homogenate was transferred to a 1.5ml eppdorf tube, held on ice for 30min, and
centrifuged at 12000rpm for 10min at 4 ºC. The supernatant (100 µl) was transferred to a

19
screw-cap glass bottle (CNW 9mm) and dried with vacuum at room temperature (Eppendorf
concentrator 5301). Lyophilized samples were oximated with 20mg/ml methoxyamine
hydrochloride (Sigma-Aldrich) in pyridine at 37ºC for 16-24 hours. The samples were then
derivatized following the same process as above mentioned. Without filtration, 1µl of the
derivatized sample was injected for chromatographic separation on an Agilent 7890-5975
GC-MS system. Injection was performed in the splitless mode at 250°C with a hold time of 3
min followed by continuous venting at 1 ml/min. The Agilent HP-5MS was set at an initial
temperature of 100°C for 3 min and then was increased to 140°C at a rate of 10°C /min, then
further increased to 260°C at a rate of 8°C /min. A heating rate of 10°C/min was then
employed until 310°C was reached. This temperature was then held for 5 min. The mass
spectrometer (70 eV, EI mode) was set up to record the spectrum between 50 and 600 m/z
units.
Retroviral infection and generation of stable cell lines
To generate FH or SDHA/B knocking-down retroviruses, HEK293T cells were plated
40-60% confluent in 90mm-diameter cell culture dishes and then transfected with retroviral
vectors (pMKO) by the calcium phosphate method. At 6 hours post-transfection, the medium
was replaced with fresh DMEM containing 10% newborn bovine serum, and cells were
grown for an additional 18 hours. The conditioned medium containing recombinant
retroviruses was collected, or applied immediately to cells, which had been plated 24 hour
before infection at a density of 10% confluent in 90 mm-diameter cell culture dishes, and
incubated for 24 hours. After double infections, the cells were placed in fresh growth medium
20
and cultured as usual. The selection with 5μg/ml of puromycin was initiated 24 hour after
infection. The newly generated stable cell line was verified by western-blot or quantitative
real-time PCR.
Animals
Male BALB/c mice (6-8 weeks of age, weighing 20-25 g) were purchased from Fudan
Animal Center. Animals were given unrestricted access to a standard diet and tap water.
Animal experiments were performed at Fudan Animal Center in accordance with the animal
ware fare guidelines.
Immunoprecipitation and western-blot
Cells were lysed by 0.5% NP-40 buffer (50mM Tris-HCl, pH 7.5; 150mM NaCl; 0.5%
NP-40) containing protease inhibitor cocktail (Roche, Shanghai, China). Proteins were
affinity purified by incubating cell extract supernatants with Flag beads (Sigma) for 3 hours,
and then were washed with ice-cold PBS (pH 7.4) for three times. Proteins were either
eluted for activity assay by Flag peptide or denatured by SDS loading buffer containing DTT
before western-blot analysis.
In order to detect protein levels of methylated histone H3, HIF-1, and endostatin,
cultured cells were washed with PBS once and then lysed directly in 0.5ml SDS loading
buffer, followed by heat at 99oC for 10 min before western-blot analysis. In addition, mouse
liver was grinded in 0.5% NP-40 buffer, and lysed on ice for 30 min, following heat in SDS
loading buffer at 99oC for 10 min before western-blot analysis. Standard western-blot

21
protocols were adapted.
Quantitative real-time PCR
Total RNA was extracted from mouse livers using Trizol reagent (Invitrogen).
Quantitative real time-PCR was performed following the manufacturer’s instruction using an
Applied Biosystems 7500 Sequence Detection System with SYBR green labeling (Takara).
The primer sequences were listed in Supplemental Table 2. β−actin and Gapdh were used
as endogenous controls.
Immunohistochemical analysis
Mouse livers were fixed in 4% neutral buffered formalin (Shenggong, Shanghai, China),
mounted in paraffin, and then were cut into 5μm thin sections. 5hmC levels were detected by
using a labeled streptavidin-biotin (LSAB) method with commercial kits (Dako Corporation,
Santa Barbara, CA). Briefly, sections were normally deparaffinized and incubated with 3%
H2O2 in PBS for 30 min to eliminate the endogenous peroxidase activity. After microwave
repair for 10 min, the sections were treated with 2N HCl for 15 min at room temperature, and
then wash three times with PBS, followed by incubation with a primary anti-5hmC antibody
(Active Motif; Cat. 39769, dilution at 1:1000) at 37℃ for 1 hour or 4℃ overnight. PBS
(without the primary antibody) was used as a negative control. A horseradish peroxidase
(HRP)-conjugated secondary antibody (Dako Corporation, Santa Barbara, CA) was then
applied and incubated at 37℃ for 1 hour. Sections were developed with a DAB kit and
stopped with water according to the manufacturer’s instructions. Images were captured
22
using a charge-coupled device (CCD) camera and analyzed using Motic Images Advanced
software (version 3.2, Motic China Group CO. Ltd).
Immunofluorescence assay
Cells were fixed with 4% paraformaldehyde (Shenggong) for 1 hour at room
temperature before washing with cold PBS containing 0.4% Triton X-100 for 15 min. For
5hmC staining, permeabilized cells were denatured with 2N HCl for 15 min, neutralized with
100 mM Tris-HCl (pH 8.5) for 10 min, and then washed with PBS for three times. Afterward,
the cells were incubated with blocking buffer (3% bovine serum albumin in PBS containing
0.1% TritonX-100) for 1 hour, followed by incubation for 2 hours at room temperature with
primary antibodies against 5hmC (Active Motif; dilution at 1:5000) or Flag (Sigma-Aldrich,
dilution at 1:1000). Alex Fluor 488 (Red) or 594 (Green)-conjugated secondary antibodies
(Invitrogen) were then applied and incubated at room temperature for 1 hour. Cell nuclei
were stained with DAPI (Invitrogen). Images were captured using Olympus fluorescence
microscope IX18.
Dot-blot assay
The dot-blot assay was performed as described previously (Xu et al, Cancer Cell, 2010)
with some modifications. Briefly, DNA was spotted on a nitrocellulose membrane (Whatman)
which was placed under an ultraviolet lamp for 20 min to crosslink the DNA. Subsequently,
the membrane was blocked with 5% milk in TBS-Tween20 for 1 hour and incubated with the
primary anti-5hmC antibody at 4°C overnight. After incubation with a HRP-conjugated

23
secondary antibody (GeneScript) for 1 hour at room temperature, the membrane was
washed with TBS-Tween 20 for three times and then scanned by a Typhoon scanner (GE
Healthcare). The 5hmC intensity was quantified by Image-Quanta software (GE Healthcare).
Reference
Xu W, Yang H, Liu Y, Yang Y, Wang P, Kim SH, Ito S, Yang C, Wang P, Xiao MT, et al. 2011.
Oncometabolite 2-hydroxyglutarate is a competitive inhibitor of α-ketoglutarate-dependent
dioxygenases. Cancer Cell. 19(1):17-30.