a predictive model of cognitive performance under
TRANSCRIPT

Wright State University Wright State University
CORE Scholar CORE Scholar
Browse all Theses and Dissertations Theses and Dissertations
2009
A Predictive Model of Cognitive Performance Under Acceleration A Predictive Model of Cognitive Performance Under Acceleration
Stress Stress
Richard Andrew McKinley Wright State University
Follow this and additional works at: https://corescholar.libraries.wright.edu/etd_all
Part of the Engineering Commons
Repository Citation Repository Citation McKinley, Richard Andrew, "A Predictive Model of Cognitive Performance Under Acceleration Stress" (2009). Browse all Theses and Dissertations. 289. https://corescholar.libraries.wright.edu/etd_all/289
This Dissertation is brought to you for free and open access by the Theses and Dissertations at CORE Scholar. It has been accepted for inclusion in Browse all Theses and Dissertations by an authorized administrator of CORE Scholar. For more information, please contact [email protected].

A PREDICTIVE MODEL OF COGNITIVE PERFORMANCE UNDER
ACCELERATION STRESS
A dissertation submitted in partial fulfillment of the
requirements for the degree of
Doctor of Philosophy
By
RICHARD ANDREW MCKINLEY
B.S., Wright State University, 2002
__________________________________________
2009
Wright State University

WRIGHT STATE UNIVERSITY
SCHOOL OF GRADUATE STUDIES
June 4, 2009
I HEREBY RECOMMEND THAT THE DISSERTATION PREPARED UNDER MY
SUPERVISION BY Richard A. McKinley ENTITLED A Predictive Model of Cognitive
Performance Under Acceleration Stress BE ACCEPTED IN PARTIAL FULFILLMENT
OF THE REQUIREMENTS FOR THE DEGREE OF Doctor of Philosophy.
Jennie J. Gallimore, Ph.D.
Dissertation Director
Ramana V. Granhdi, Ph.D.
Director, Ph.D. in Engineering Program
Joseph F. Thomas, Jr., Ph.D
Dean, School of Graduate Studies
Committee on
Final Examination
Jennie J. Gallimore, Ph.D.
Chandler Phillips, Ph.D., M.D.
Yan Liu, Ph.D.
Waleed Smari, Ph.D.
Dragana Claflin, Ph.D.

iii
ABSTRACT
McKinley, Richard Andrew. Engineering Ph.D. Program, College of Engineering and
Computer Science, Wright State University, 2009
A Predictive Model of Cognitive Performance under Acceleration Stress
Extreme acceleration maneuvers encountered in modern agile fighter aircraft can
wreak havoc on human physiology thereby significantly influencing cognitive task
performance. Increased acceleration causes a shift in local arterial blood pressure and
profusion causing declines in regional cerebral oxygen saturation. As oxygen content
continues to decline, activity of high order cortical tissue reduces to ensure sufficient
metabolic resources are available for critical life-sustaining autonomic functions.
Consequently, cognitive abilities reliant on these affected areas suffer significant
performance degradations.
This goal of this effort was to develop and validate a model capable of predicting
human cognitive performance under acceleration stress. An Air Force program entitled,
“Human Information Processing in Dynamic Environments (HIPDE)” evaluated
cognitive performance across twelve tasks under various levels of acceleration stress.
Data sets from this program were leveraged for model development and validation.
Development began with creation of a proportional control cardiovascular model that
produced predictions of several hemodynamic parameters including eye-level blood
pressure. The relationship between eye-level blood pressure and regional cerebral
oxygen saturation (rSO2) was defined and validated with objective data from two
different HIPDE experiments. An algorithm was derived to relate changes in rSO2 within
specific brain structures to performance on cognitive tasks that require engagement of

iv
different brain areas. Data from two acceleration profiles (3 and 7 Gz) in the Motion
Inference experiment were used in algorithm development while the data from the
remaining two profiles (5 and 7 Gz SACM) verified model predictions. Data from the
“precision timing” experiment were then used to validate the model predicting cognitive
performance on the precision timing task as a function of Gz profile. Agreement between
the measured and predicted values were defined as a correlation coefficient close to 1,
linear best-fit slope on a plot of measured vs. predicted values close to 1, and low mean
percent error. Results showed good overall agreement between the measured and
predicted values for the rSO2 (Correlation Coefficient: 0.7483-0.8687; Linear Best-Fit
Slope: 0.5760-0.9484; Mean Percent Error: 0.75-3.33) and cognitive performance models
(Motion Inference Task - Correlation Coefficient: 0.7103-0.9451; Linear Best-Fit Slope:
0.7416-0.9144; Mean Percent Error: 6.35-38.21; Precision Timing Task - Correlation
Coefficient: 0.6856 - 0.9726; Linear Best-Fit Slope: 0.5795 - 1.027; Mean Percent Error:
6.30 - 17.28). The evidence suggests that the model is an accurate predictor of cognitive
performance under high acceleration stress across tasks, the first such model to be
developed. Applications of the model include Air Force mission planning, pilot training,
improved adversary simulation, analysis of astronaut launch and reentry profiles, and
safety analysis of extreme amusement rides.

v
TABLE OF CONTENTS
1.0 INTRODUCTION ....................................................................................................... 1
1.1 Human Cognition and Cortical Metabolism ............................................................. 4
1.2 Methodology Effects of Acceleration on Human Cognition .................................... 6
2.0 STATEMENT OF PROBLEM ................................................................................... 10
3.0 OBJECTIVE ............................................................................................................... 11
4.0 BACKGROUND ........................................................................................................ 12
4.1 Human Information Processing in the Dynamic Environment Program ................ 12
4.2 NTI, Inc. Cognitive Model...................................................................................... 15
4.3 The G-Tool to Optimize Performance (G-TOP) ..................................................... 19
4.4 Test 1: Perception of Relative Motion .................................................................... 23
4.5 Test 2: Precision Timing ......................................................................................... 26
4.6 Test 3: Motion Inference ......................................................................................... 29
4.7 Test 4: Pitch-Roll Capture ...................................................................................... 32
4.8 Test 5: Peripheral Information Processing .............................................................. 35
4.9 Test 6: Rapid Decision Making .............................................................................. 37
4.10 Test 7: Basic Flying Skills .................................................................................... 40
4.11 Test 8: Gunsight Tracking .................................................................................... 41
4.12 Test 9: Situational Awareness ............................................................................... 43
4.13 Test 10: Unusual Attitude Recovery ..................................................................... 49
4.14 Test 11: Short Term Memory ............................................................................... 52
4.15 Test 12: Visual Monitoring ................................................................................... 54
5.0 RESEARCH APPROACH ......................................................................................... 58

vi
5.1 Methodology ........................................................................................................... 58
5.2 Model Assumptions ................................................................................................ 62
5.3 Cardiovascular Model ............................................................................................. 63
5.4 Human Information Processing Model ................................................................... 74
5.5 Model Verification and Analysis ............................................................................ 81
5.6 Software and User Interface.................................................................................... 82
5.7 Methods and Results of HIPDE Experiments ......................................................... 84
5.7.1 Equipment ....................................................................................................... 84
5.7.2 Acceleration Profiles ...................................................................................... 87
5.7.3 Stimuli ............................................................................................................ 88
5.7.4 Training Procedures ........................................................................................ 88
5.7.5 Procedures ...................................................................................................... 89
5.7.6 Data Analysis .................................................................................................. 90
5.7.7 Results ............................................................................................................ 91
6.0 RESULTS ................................................................................................................... 93
6.1 Regional Cerebral Oxygen Saturation .................................................................... 96
6.2 Motion Inference Performance ............................................................................. 102
6.3 Precision Timing Performance ............................................................................. 107
7.0 DISCUSSION ........................................................................................................... 114
7.1 Cardiovascular Model ........................................................................................... 119
7.2 Regional Cerebral Oxygen Saturation (rSO2) Model ........................................... 122
7.3 Cognitive Performance Model (CP): Motion Inference ....................................... 123
7.4 Cognitive Performance Model (CP): Precision Timing........................................ 125

vii
7.5 Limitations ............................................................................................................ 127
7.6 Summary ............................................................................................................... 128
8.0 CONTRIBUTIONS AND APPLICATIONS OF RESEARCH ............................... 133
9.0 FUTURE RESEARCH ............................................................................................. 139
10.0 CONCLUSIONS..................................................................................................... 142
11.0 REFERENCES ....................................................................................................... 143
12.0 APPENDIX A: MODEL SOURCE CODE ............................................................ 151

viii
LIST OF FIGURES
Figure 1. Model Development Flow Chart ....................................................................... 12
Figure 2. Stoll Curve (Stoll, 1956).................................................................................... 17
Figure 3. Ge compared to Gz profile for a single plateau (O'Donnell, Moise, Schmidt, &
Smith, 2003) ...................................................................................................................... 19
Figure 4. G-TOP Example CVM Output (O'Donnell, Moise, Schmidt, & Smith, 2003) . 20
Figure 5. Visual Cortical Areas (Dubuc, 2002). ............................................................... 24
Figure 6. Components of Situation Awareness (Heinle & Ercoline, 2003). ..................... 44
Figure 7. Funtional Brain Areas in Recalling the Past and Predicting the Future (Schacter,
Addis, and Buckner, 2007). .............................................................................................. 48
Figure 8. General Schematic flow for a human operator control system (Phillips, 2000) 59
Figure 9. Conceptual Model Flow Diagram ..................................................................... 61
Figure 10. Cardiovascular Model Block Diagram ........................................................... 65
Figure 11. Human Information Processing Model Block Diagram ................................. 75
Figure 12: Sketch of Motion Inference Task (Butcher, 2007) ......................................... 79
Figure 13: Sketch of the Precision Timing Task (Butcher, 2007) .................................... 80
Figure 14. Main Window of the Graphical User Interface (GUI) .................................... 82
Figure 15. Main Window with Option Menu Displayed .................................................. 83
Figure 16. Exterior photograph of the Dynamic Environment Simulator, Wright-Patterson
AFB, OH (McKinley, et al., 2008) ................................................................................... 85
Figure 17. Illustration of ACES II Ejection Seat with Hotas Thrustmaster Flight Stick and
Throttle with Dome Visual Display (McKinley, et al., 2008) .......................................... 86
Figure 18. Daily Gz exposure schedule (McKinley, et al., 2008) ..................................... 88

ix
Figure 19. Measured and Predicted rSO2 during 3 Gz Plateau ......................................... 97
Figure 20. Measured and Predicted rSO2 during 5 Gz Plateau ......................................... 97
Figure 21. Measured and Predicted rSO2 during 7 Gz Plateau ......................................... 98
Figure 22. Measured and Predicted rSO2 during 7 Gz SACM ......................................... 98
Figure 23. Measured vs. Predicted rSO2 Values (3 Gz Plateau) ..................................... 100
Figure 24. Measured vs. Predicted rSO2 Values (5 Gz Plateau) ..................................... 100
Figure 25. Measured vs. Predicted rSO2 Values (7 Gz Plateau) ..................................... 101
Figure 26. Measured vs. Predicted rSO2 Values (7 Gz SACM) ...................................... 101
Figure 27. Motion Inference Predicted vs. Measured Performance (3G Plateau) ......... 102
Figure 28. Motion Inference Predicted vs. Measured Performance (5G Plateau) .......... 103
Figure 29. Motion Inference Predicted vs. Measured Performance (7G Plateau) .......... 103
Figure 30. Motion Inference Predicted vs. Measured Performance (7G SACM) .......... 104
Figure 31. Measured vs. Predicted Motion Inference Angle Error Values (3 Gz Plateau)
......................................................................................................................................... 105
Figure 32. Measured vs. Predicted Motion Inference Angle Error Values (5 Gz Plateau
with Final Data Point Included) ...................................................................................... 105
Figure 33. Measured vs. Predicted Motion Inference Angle Error Values (5 Gz Plateau
without Final Data Point Included) ................................................................................. 106
Figure 34. Measured vs. Predicted Motion Inference Angle Error Values (7 Gz Plateau)
......................................................................................................................................... 106
Figure 35. Measured vs. Predicted Motion Inference Angle Error Values (7 Gz SACM)
......................................................................................................................................... 107
Figure 36. Precision Timing Predicted vs. Measured Performance (3G Plateau) .......... 108

x
Figure 37. Precision Timing Predicted vs. Measured Performance (5G Plateau) .......... 109
Figure 38. Precision Timing Predicted vs. Measured Performance (7G Plateau) .......... 109
Figure 39. Precision Timing Predicted vs. Measured Performance (7G SACM) ........... 110
Figure 40. Measured vs. Predicted Precision Timing Angle Error Values (3 Gz Plateau)
......................................................................................................................................... 111
Figure 41. Measured vs. Predicted Precision Timing Angle Error Values (5 Gz Plateau
with Final Data Point Included) ...................................................................................... 112
Figure 42. Measured vs. Predicted Precision Timing Angle Error Values (5 Gz Plateau
without Final Data Point Included) ................................................................................. 112
Figure 43. Measured vs. Predicted Precision Timing Angle Error Values (7 Gz Plateau)
......................................................................................................................................... 113
Figure 44. Measured vs. Predicted Precision Timing Angle Error Values (7 Gz SACM)
......................................................................................................................................... 113
Figure 45. Mean Eye Level Arterial Blood Pressure (Rositano, 1980). ........................ 120
Figure 46. Predicted Cardiovascular Parameters; PES - Systolic Arterial Blood Pressure
at Eye Level (Grygoryan, 1999) ..................................................................................... 121
Figure 47. Predicted Eye-Level Arterial Blood Pressure (7G) ....................................... 122
Figure 48. Model Agreement Analysis Summary .......................................................... 131

xi
LIST OF TABLES
Table 1. T-Matirx: SME values for each cognitive ability across the provided cognitive
tasks (O'Donnell, Moise, Schmidt, & Smith, 2003) ......................................................... 14
Table 2. Normalized Data from Literature across Cognitive Abilities (O'Donnell, Moise,
Schmidt, & Smith, 2003) .................................................................................................. 18
Table 3. rSO2 Model Agreement Metrics ......................................................................... 99
Table 4. Motion Inference Model Agreement Metrics ................................................... 104
Table 5. Precision Timing Model Agreement Metrics ................................................... 110
Table 6. HIPDE Tasks Rank Ordered by Complexity .................................................... 117

1
1.0 INTRODUCTION
Although technology capabilities continue to increase, human beings remain bounded
by the physical limitations of the body and mind. Although clever designs coupled with
cutting edge technology can expand the human performance envelope, it should come as
no surprise that the human operator (HO) is often regarded as the single most limiting,
yet complex factor in overall system design. Moreover, many find it convenient to
develop the mechanical system separately from the HO and then rectify the interface
between the two as the system is being prepared for production. One of the central issues
contributing to this ill-advised strategy is the inability of the designer to easily change the
inherent characteristics of the human entity. Should a material used in the “skin” of an
aircraft react inappropriately to extreme temperature changes, the material can be
replaced with an alternative material with properties that allow it to remain inert and
invariable with respect to temperature. However, the human element cannot be replaced
with a stronger, faster or lighter component. The HO performance characteristics can
only be augmented to a limited extent with modern technology, training, and procedures.
However, even with the assistance of such technology aids, the HO often reaches the
performance ceiling faster than that of the rest of the system. Therefore, in order to fully
realize the performance capability of any system controlled or influenced by an HO, it is
paramount to examine effects of environmental stressors on not only the mechanical
system, but also the human entity.
Extreme environments plague many systems and can wreak havoc on human
physiology thereby significantly influencing resulting task performance. Due to the
nature of warfare and the necessity to engage the enemy anytime and anywhere, military

2
members are often exposed to the most arduous and taxing environmental stressors
including, temperature, vibration, acoustic noise, vestibular confusion, and high
acceleration. Because the extreme physiological challenges faced by pilots of highly
maneuverable aircraft can quickly lead to situations that endanger their lives and the lives
of others, it is arguably one of the most unforgiving and dangerous environments.
Although pilots are exposed to several stressors, high acceleration often produces the
most profound and prolific effects on the human body. As a result, it is important to
understand these effects and the corresponding limitations to HO performance.
Human performance in the inertial environment has been a topic of study since
acceleration-induced symptoms were first realized nearly 90 years ago (circa 1919).
Although these efforts have lead to a robust understanding of its negative effects on
human physiology and physical limitations, relatively little research has been devoted to
unearthing the corresponding impacts to cognitive function. One contributing factor to
this lack of empirical data is the difficulty in measuring cognitive performance during
high acceleration exposures. First, volunteer subjects must meet stringent medical
qualifications to even be considered for participation in an acceleration study. Provided
this hurdle is overcome, subjects must then pass the human centrifuge training regime
that often requires weeks. During this time, they often experience motion sickness
caused by motion artifact during the onset and offset of the specified acceleration level.
They are also subject to pain, physical exhaustion, risk of loss of consciousness, and
other negative symptoms such as ruptured capillaries (known as “G measles”). Such
conditions severely limit the pool of volunteers ready to make such sacrifices for the
advancement of science. Furthermore, once a suitable set of volunteers is recruited,

3
screened, and adequately trained, data must be collected while the subject is experiencing
sustained acceleration. Given endurance limitations of the human body coupled with a
suitable level of safety for the participant, the time available to collect data in any given
acceleration profile is typically a maximum of 10-15 seconds. Experimental designs
normally require subjects to return on many test days to acquire enough data for adequate
statistical power. As a result of these circumstances, acceleration research studies are
often costly and cumbersome. Therefore, acceleration phenomena causing the most
fatalities and/or loss of aircraft have historically and justifiably been given higher
priority.
Perhaps the most well known of these extreme consequences are incidents known as
acceleration-induced loss of consciousness (G-LOC). The “G” in the acronym “G-LOC”
stems from the fact that is can be alternatively be referred to as G-induced loss of
consciousness. The letter “G” is commonly used to denote the acceleration due to gravity
(9.8 m/s2). Likewise, accelerations generated in the aviation environment are often
expressed as multiples of this acceleration constant (e.g. 2G = 19.6 m/s2). High
acceleration (high G) forces the blood away from the upper extremities and causes a
dramatic loss of eye-level blood pressure. If sustained long enough, the pilot losses
consciousness resulting in a G-LOC event. As would be expected, the human operator
suffers cognitive deficits just prior and for several minutes following the G-LOC event
(Tripp et al., 2002 & Tripp et al., 2003). Perhaps more important than the G-LOC event
itself are the subtle effects on cognition leading up to G-LOC. Research detailing the
effects of “almost loss of consciousness” (A-LOC) has lead to the discovery of a variety
of consequences such as euphoria, apathy, weakness, localized uncontrollable motor

4
activity or paralysis, loss of short term memory, dream-like states, confusion and loss of
situational awareness, abnormal sensory manifestations, sudden inappropriate flow of
emotion, and inability to respond to alarms or radio calls even though the participant
appreciates them at the time and desires to respond (Morrissett & McGowan, 2000;
McKinley et al., 2008). Hence, it is reasonable to hypothesize that cognitive
impairments do not materialize suddenly and all at once. As the blood is drawn away
from critical brain structures, it is likely that specific cognitive functions are ceased in a
graded fashion to devote the limited metabolic resources to those critical to survival.
1.1 Human Cognition and Cortical Metabolism
Human cognition in the traditional sense encompasses such mental processes as
thought, perception, problem solving, and memory. The complex flight environment
coupled with a multitude of modern cockpit displays and auditory cueing often
challenges each of these processes while simultaneously taxing the senses and generating
periods of high mental workload. This is all accomplished without the inclusion of
environmental stressors. The addition of inertial forces generated during tight turns,
steep climbs, and evasive maneuvers further exacerbates cognitive disarray in the most
critical segments of flight which inevitably increases the risk of mission failure. Decades
of research in acceleration physiology have provided significant evidence of the
underlying cause of cognitive impairments during high-G maneuvers.
Because acceleration is a vector quantity, it is defined both by a magnitude and
direction. The acceleration 3-dimensional coordinate plane places the z-axis along the
human’s midline (in the standing or upright seated position) with positive values directed

5
from head to foot. As acceleration along the z-axis (Gz) increases in value, the apparent
weight of the human increases as well. In the same way, the apparent weight of internal
fluids including blood increases. Consequently, it becomes more difficult for the heart to
pump oxygenated blood to peripheral tissues located in the upper extremities and it
begins to pool in the lower regions of the body such as the legs. According to the Naval
Aerospace Medical Institute (1991), each additional +1Gz applied translates into a 22
mmHg decrease in eye-level blood pressure negating the inclusion of any Gz
countermeasures such as an anti-G suit. Once the apparent weight of the blood exceeds
the ability of the cardiovascular system to generate compensating pressure, the flow of
blood in the intracranial arteries significantly decreases, thereby causing the blood to pool
in the lower extremities and reducing oxygenated blood flow to the cerebral tissues
(Ernsting, Nicholson, and Rainford, 1999). Hence, at rest the average human subject will
have zero eye-level blood pressure at 4.5 Gz. As the oxygenated blood from the heart
continues to pool in the lower extremities of the body, blood return to the heart is
depleted and the brain becomes starved of oxygen.
The amount of available oxygenated blood in the cerebral tissue likely drives and/or
limits cognitive ability. In fact, previous work has suggested that decreases in eye-level
blood pressure and cerebral oxygen saturation (rSO2) lead to decreased motor function
and cognitive ability (Ernsting, Nicholson, and Rainford, 1999; Newman, White, and
Callister, 1998; Tripp, Chelette, and Savul, 1998). It is likely that these deficits are
caused primarily by a global lack of metabolic resources available to the cortical tissues
during high-G maneuvers. These resulting deficits can seriously impede many aspects of
the pilot’s cognition resulting in reduced capability and higher risks of mission safety.

6
The brain is particularly sensitive to ischemic insults due to its high energy
consumption (Rossen, Kabat, & Anderson, 1943) and the fact that neurons cannot
metabolize fats or carbohydrates to meet this energy need. Neurons utilize glucose for
metabolism, which is partly delivered directly by capillaries, but principally regulated by
astrocytes (Carlson, 2007). The astrocytes convert the glucose to lactate, which is then
released into the cytoplasm to be used by the neuron (Carlson, 2007). Although some
energy can be stored locally in the form of glycogen, it is quickly exhausted in the
absence of oxygen, due to the fact that anaerobic metabolism produces a small fraction of
the energy produced during aerobic metabolism. As a result, neurons depend on constant
adequate blood supply to deliver both oxygen and nutrients for metabolic processes. In
fact, 15-25% of the body’s oxygen and energy stores are devoted to neuronal functions
ranging from propagation of action potentials, to cellular repairs and maintenance (Lee, et
al., 2000; Carlson, 2007). When arterial blood delivery is compromised, cerebral tissue
must rapidly reduce neural activity as a protective measure. This ensures that processes
vital to cellular life such as maintenance of the Na-K pump are preserved (Krnjevic,
1999). It is the extent of the neural cessation coupled with the precise identification of
the behavioral effects that must be further elucidated.
1.2 Methodology Effects of Acceleration on Human Cognition
Acceleration research has been conducted for well over fifty years, and in that time
much has been learned regarding the effect of the high-G environment on the human
body and the resulting changes in physiology. These efforts have aided in the
understanding of the principal phenomena that affect vision, endurance, consciousness,
and performance, while leading to the development of superior G protective measures

7
such as advanced G-suits and anti-G straining maneuvers. Still, because of the
difficulties and expense encountered when conducting acceleration research (depicted in
the “background” section), few studies have focused on expounding the effects of
acceleration stress on cognitive performance. Principally and justifiably, studies detailing
the effects of acceleration on cognition have investigated only the aspects of cognition
requisite for the successful accomplishment of a flight oriented tasks. Nevertheless,
results of these studies are useful for comparison and provide evidence that not all
cognitive abilities are affected equally by acceleration stress. A review of the available
literature detailing effects of acceleration on cognitive abilities is provided below.
SD accounted for approximately 39% of fatal mishaps within the US Air Force
between 1991 and 2000 (Ercoline, et al., 2000). As a result, several studies have been
devoted to examining the effects of acceleration on orientation perception and SD
recovery. However, because SD typically occurs at low G levels, there is little available
evidence of cognitive effects on perception of orientation above 3.5 Gz. One such study
evaluated the subject’s perception of vertical at various Gz levels and head positions
(Albery, 1990). It was found that errors in subjective vertical did increase with
increasing Gz, although the maximum acceleration magnitude was +3 Gz. Nethus, et al.
(1993) discovered increased reaction times and decrements in accuracy for a mental
rotation/orientation task during Gz acceleration. It is also interesting to note that the
performance was correlated with arterial oxygen saturation values (SaO2). Hence, these
results tend to suggest that ability to not only perceive one’s own spatial orientation but
also the orientation of other objects under positive acceleration may be compromised.

8
Because many Air Force combat missions involve finding, tracking, and/or
successfully destroying targets, there have been several studies completed to determine if
cognitive skills necessary for these tasks are negatively affected by high acceleration.
Repperger, Frazier, Popper, and Goodyear (1989) conducted a study to investigate the
perception of both fast and slow motion at G-levels between 1 and 5 Gz using a time
estimation task. The results seem to indicate a general slowing of the perceived time for
the target to reach its destination. Furthermore, although the ability to find and track
targets is important to any aircraft hostile environment, only one study has attempted to
truly investigate how acceleration might affect this ability (Rogers, et al., 1973). This
study required subjects to fire on a target once it was in the crosshairs following a Gz
profile ranging between 1 and 8 Gz. Results indicated that performance decreases
significantly from baseline performance (as much as 77% at 8 Gz). Additional studies
have evaluated visual acuity during acceleration using various G profiles and metrics
(Frankenhauser, 1958; McCloskey, et al., 1992; Repperger Frazier, Popper, & Goodyear,
1989; Warrick & Lund, 1946; White, 1960; White, 1962). Again, many of these studies
utilized relatively low Gz (5 Gz or less) and took place prior to advancements in Gz
protection. Consequently, the results may or may not be applicable to today’s Air Force
pilots.
Virtually no emphasis has been placed on providing predictive tools or models that
could yield pilot task performance decrements based on the decreased cognitive ability at
higher accelerations. Largely this is caused by a lack of data to both build and
subsequently validate the model computations. The proposed effort is designed to

9
remedy this problem by first supplying a body of flight-relevant cognitive performance
data for model development, and then validate the model with data from separate studies.

10
2.0 STATEMENT OF PROBLEM
A declining military research budget coupled with the high costs of human-in-the-
loop (HITL) testing has generated significant interest in high-fidelity simulations capable
of replacing testing with human participants. In fact, the Department of Defense (DoD)
modeling and simulation master plan explicitly states that more accurate representations
of pilot behavior are needed for simulation based acquisition (SBA). Although emerging
validation efforts provide evidence current pilot models are approaching acceptable levels
to replace HITL testing, validation is typically accomplished using ground-based (1G)
simulated flight environments. The problem, therefore, is these models do not account
for significant changes in human behavior resulting from the high physical stress.
Existing evidence (McKinley, et al., 2008) suggests that human cognition is
significantly compromised during moderate to high acceleration stress typical of military
combat sorties that produce previously unknown limitations on a pilot’s cognitive
facilities. It is likely that these deficits manifest to varying degrees based on the location
and metabolic need of the areas of the brain activated during execution of the specific
cognitive task. Because existing cognitive models are increasingly used in place of HITL
testing for SBA, these cognitive deficits need to be included to reduce acquisition risk
and improve overall fidelity of the pilot behavior model.

11
3.0 OBJECTIVE
The primary purpose of this study is to develop and validate the foundation of a
computational model capable of accurately predicting the effects of acceleration on
human cognitive performance. To ensure a sound scientific basis, established biomedical
engineering principles were utilized to construct a description of the forces exerted on the
human subject and the resulting internal hemodynamic changes. This fed a human
information processing model rooted in detailed theories of cognition, human brain
structure/function, and the theoretical influences of hemodynamic changes on specific
brain areas. Although there were twelve cognitive tasks available for model development
and analysis, this effort focused on only two: Precision Timing and Motion Inference.
These tasks were selected in this initial effort due to their inherent functional similarities
and highly divergent tests of cognitive function (and therefore active brain area). The
output of the model is the resulting percentage change from baseline (1 Gz) task
performance, which is dependent on the principal brain areas involved in task execution
coupled with the regional cerebral oxygen concentration within that structure. The final
objective of this effort was to validate model predictions with available data from the
HIPDE experiments.

12
4.0 BACKGROUND
This effort incorporates data and cognitive performance tasks from previous research.
For improved clarification of the work previously performed and that which was
completed for this dissertation, a flow chart is provided prior to each major section of this
document. The block to be discussed in the subsequent section is highlighted in yellow.
This flow chart can be found below.
Development of HIPDE Cognitive
Task Battery
Development of NTI, Inc G-TOP Cognitive Performance Model
HIPDE Experiments conducted by AFRL
Development of Cardiovascular
Model
Development of rSO2
Model
Development of Cognitive
Performance Model
Model Validation
Previous Work
Current Work
Figure 1. Model Development Flow Chart
4.1 Human Information Processing in the Dynamic Environment Program
As a first step toward the realization of a human cognitive performance model capable of
making accurate predictions during simulated Gz acceleration, a program entitled the
“Human Information Processing in the Dynamic Environment” (HIPDE) was initiated by

13
the Air Force Research Laboratory (AFRL). The program began with the development of
a custom cognitive performance task battery to probe specific cognitive functions needed
in the flight environment. A company by the name of NTI, Inc. (Dayton, OH), was
contracted to complete this initial goal under a Small Business Innovative Research
(SBIR) award. Through reviewing relevant literature, interviewing subject matter experts
(SMEs), and providing questionnaires to pilots, NTI, Inc. was able to identify eleven
critical cognitive skills that are necessary for the accomplishment of aircraft missions
(O'Donnell, Moise, Schmidt, & Smith, 2003). These included instrument reading, simple
decision making, visual acuity, complex decision making accuracy, complex decision
making reaction time, complex decision making efficiency, tracking, slow motion
inference, fast motion inference, spatial orientation, and perceptual speed.
To investigate the effects of Gz on the aforementioned list of cognitive abilities, NTI,
Inc. also developed software containing twelve performance tasks (O'Donnell, Moise,
Schmidt, & Smith, 2003). Many of the tasks focus on probing the performance of a
particular cognitive skill; however, they actually test several other cognitive abilities to a
lesser extent. For example, the test designed to measure the pilot’s perception of speed
may also consequently probe their visual acuity to a small degree. Therefore, subject
matter experts (SME’s) were consulted to determine the extent to which each skill is
tested in each of the twelve performance tasks. The SME’s rated the level at which each
of the cognitive skills is used for each of the twelve tasks with a value between 0 and 9 (9
corresponds to a cognitive skill that is highly used in the task, 0 represents a skill that is
not used at all). A matrix (T-Matrix) was created from these values that can be used to
weight the performance data recorded from acceleration studies across the eleven critical

14
cognitive skills (O'Donnell, Moise, Schmidt, & Smith, 2003). The resulting table can be
found in table 1.
Instrument Reading
Simple Decision Making
Visual Acuity
Complex Decision Making Accuracy
Complex Decision Making RT
Complex Decision Making Efficiency
Tracking Slow Motion Inference
Fast Motion Inference
Spatial Orientation
Perceptual Speed
Perception of Relative Motion
0 1 0 0 0 0 4 3 4 7 6
Precision Timing
0 4 0 0 0 0 8 6 5 0 9
Motion Inference
0 6 0 0 0 0 4 9 9 0 7
Pitch/Roll Capture
0 3 0 0 0 0 8 2 2 3 2
Peripheral Processing
5 6 9 0 0 0 0 0 0 0 7
Decision Making
0 2 4 9 9 9 0 1 3 0 1
Basic Flying Skills
7 3 0 0 0 0 2 0 0 4 0
Gunsight Tracking
0 1 4 0 0 0 9 5 7 0 4
Situation Awareness
6 1 5 5 2 2 3 2 2 8 0
Unusual Attitude Recovery
9 3 0 6 3 8 0 0 0 9 2
Short Term Memory w/ Distraction
0 4 0 3 1 3 0 0 0 3 0
Visual Monitoring
4 1 6 0 0 0 6 0 0 0 3
Table 1. T-Matirx: SME values for each cognitive ability across the provided cognitive tasks (O'Donnell, Moise,
Schmidt, & Smith, 2003)

15
4.2 NTI, Inc. Cognitive Model
Development of HIPDE Cognitive
Task Battery
Development of NTI, Inc G-TOP Cognitive Performance Model
HIPDE Experiments conducted by AFRL
Development of Cardiovascular
Model
Development of rSO2
Model
Development of Cognitive
Performance Model
Model Validation
Previous Work
Current Work
In addition to identifying the critical cognitive skills, producing the T-matrix, and
constructing the custom task battery to evaluate cognition under +Gz, NTI, Inc also
attempted to develop a cognitive performance model capable of accurately predicting the
effects of acceleration stress on all eleven identified cognitive skills (O'Donnell, Moise,
Schmidt, & Smith, 2003). As a first step, NTI psychologists transferred data found in the
existing literature to a set of look-up tables formatted in a Microsoft Excel spreadsheet.
Of course, each study used different metrics and tasks, so data values first needed to be
normalized (see equation 1).
100
0.1
0.1100Value G Normalized z
valueG
valueGvaluenG
z
zz (Equation 1)

16
Because many of the studies in the literature used to build the look-up tables did not
evaluate performance up to the maximum Gz level of +9 Gz, the tables were largely
incomplete above +5 Gz. A complete listing of this data can be found in Table 2. As a
result, it was necessary to make some assumptions to fill in the gaps. NTI, Inc. utilized a
linear extrapolation to generate the missing data points. The resulting extrapolations
were separated according to cognitive ability (O'Donnell, Moise, Schmidt, & Smith,
2003). Each included normalized cognitive performance values for Gz between 1.0 and
9.0 with a 0.1 Gz interval.
Next, a validated model was needed that could accurately predict the physiologic
effects of positive Gz acceleration. NTI, Inc. contracted with Dr. Dana Rogers to utilize
his “G-effective” model developed to explain the reaction of human physiology to
increased G-load (Rogers, 2003). Essentially, the model uses the Gz values and Gz
history to make a prediction concerning the internal cardiovascular physiology in the
human. This is done by calculating the resulting strain on the human, or “effective G”
through the use of a standard second-order transfer function (see equation 2). The first
step was to generate the dynamic stress function, F(s), in the frequency domain.
21
1)(
csbs
assF
(Equation 2)
The variables a, b and c from equation 2 are standard coefficients for a second-order
transfer function. The values for these coefficients were determined by fitting the
function to the Stoll curve (Stoll, 1956) using a least mean squares approach known as
linear quadratic Gaussian (LQG) control. When F(s) is converted back to the time

17
domain, it can be denoted as the time series dynamic stress function for the human
operator or pilot. To model the “effective” Gz, Rogers developed the algorithm denoted
by equation 3. It uses the time series effective stress function, F(t) convoluted with the
actual Gz time series to generate the G-effective (Ge) data.
Figure 2. Stoll Curve (Stoll, 1956)

18
Table 2. Normalized Data from Literature across Cognitive Abilities (O'Donnell, Moise, Schmidt, & Smith,
2003)
Reference Dependent Measure 1Gz 2Gz 3Gz 4Gz 5Gz 6Gz 7Gz 8Gz 9Gz
Dial Reading (Instrument Reading)
Warrick &
Lund, 1946
Errors 100.00 64.27
Choice Reaction Time (Simple Decision Making)
McCloskey et
al., 1992
Reaction Time (msec) 100.00 87.50
Frankenhauser, 1958
Reaction Time (sec) 100.00 91.99
Visual Acuity
White. 1960 Absolute Threshold
(Peripheral)
100.00 95.82 86.87 82.99
Absolute Threshold (Focal)
100.00 98.50 96.10 92.04
Chambers &
Hitchcock,1963
Contrast Sensitivity 100.00 84.04 77.66 34.04
White, 1962 Contrast Sensitivity 100 100 80 74
Frankenhauser, 1958
Percent Error of visual acuity
100 83.66
Decision Making (Complex Decision Making)
Cochran, 1953 Average Percent
Accuracy
100.00 97.50 96.50 95.00 100.00 90.00
Average Reaction
Time
100.00 94.00 87.50 73.50 75.00 76.50
Average Throughput 100 58.89 45.43 26.98 32.76 31.34
Tracking
Rogers et al., 1973
% Accuracy 100 97 90 85 80 65 50 23
Motion Inference
Repperger et al.,
1990
Motion Inference,
Slow Velocity
100 89.29 26.79
Motion Inference, Fast
Velocity
100 114.29 80.95
Spatial Orientation
Albery, 1990 +30 Degree
manipulation
100.00 55.00 35.00
Nethus et al.,
1993
Manikin Error rate, 14
FIO2 (%)
100.00 60.00
Perceptual Speed
Comrey et al.,
1951
T-score equiv. for raw
number correct
100.00 98.61 90.55
Frankenhauser,
1958
Reaction Time (sec) 100.00 80.10
tFtGtG ze (Equation 3)

19
Essentially, the “effective” G is the Gz equivalent the human experiences based on
internal physiologic reaction. It is the culmination of many aspects of cardiovascular
changes and adaptations equated to a single value. For example, the actual Gz level may
only be 6, whereas G-effective value may be closer to 7 (see figure 3).
Figure 3. Ge compared to Gz profile for a single plateau (O'Donnell, Moise, Schmidt, & Smith, 2003)
This is due to the fact that the cardiovascular system cannot react quickly to compensate
for large changes in acceleration. To generate adequate counter pressure, the vessels
must constrict and the heart must beat harder and more rapidly. This reaction exceeds the
time required for a high-performance aircraft to generate hefty changes in acceleration.
4.3 The G-Tool to Optimize Performance (G-TOP)
The final cognitive performance model delivered by NTI, Inc. was denoted as the “G-
Tool to Optimize Performance” (G-TOP) model (O'Donnell, Moise, Schmidt, & Smith,
2003). G-TOP combined the G-effective algorithm with the cognitive ability look-up
tables to create a method of providing predictions for individual cognitive skills. The Ge
values predicted by the algorithm become the new Gz values that are fed to the look-up
tables. Once the software collects the cognitive performance value for the given G value

20
across all 11 abilities, these values are sent to the graphical interface for presentation to
the user. It is important to note that the look-up table values were normalized as a
percentage of the baseline performance. Hence, baseline is considered to be 100% and a
10% decline in performance would be displayed as 90%.
The graphical interface was designed to provide a comprehensive representation of
cognitive performance during Gz loading while allowing the user to easily decipher
potential problem areas. The design used by NTI, Inc. was to present the tabular data in a
series of web-like diagrams (termed cognitive vulnerability maps or CVMs), where each
web is a single point in time (O'Donnell, Moise, Schmidt, & Smith, 2003). An example
can be found in figure 4 below. To view changes over time, the user advances through
each chart in sequence. Although this method allows the user to easily view the
performance of the 11 cognitive abilities, it is difficult to see trends over time, and
advancing through each chart can be cumbersome.
0.00
20.00
40.00
60.00
80.00
100.00
120.00
Instrument Reading
Simple Decision Making
Visual Acuity
Complex Decision Making Accuracy
Complex Decision Making Reaction Time
Complex Decision Making EfficiencyTracking
Fast Motion Inference
Slow Motion Inference
Spatial Orientation
Perceptual Speed
Figure 4. G-TOP Example CVM Output (O'Donnell, Moise, Schmidt, & Smith, 2003)

21
Despite the fact that the G-TOP model is based on data and results from previous
acceleration studies, the methodologies utilized in each experiment were not uniform and
often the tasks did not directly probe a specific task. As a result, much of the data used in
the generation of the “look-up” tables was used because it was the only data in existence.
Furthermore, much of the data had to be extrapolated to the higher Gz levels due to the
fact that much of the existing literature focused on acceleration below 5 Gz. Likewise,
the G-effective model produces a simplistic prediction (first-order transfer function) of
the physiologic effects of Gz on the human body. This single value is then used to predict
performance values for 11 different cognitive abilities without consideration of the
critical brain structures necessary maintain these skills. It is likely that cognitive
performance will be impacted by the oxygen/blood delivery to each functional area and
the metabolic need of those tissues. Because the inertial forces due to the increased
acceleration produce a graded pressure throughout the body, it is reasonable to expect
that local blood pressure will be lower in dorsal areas of the brain than ventral.
Consequently, anatomic position of the functional brain structures involved in these 11
cognitive abilities become crucial in the analysis of potential performance losses. As a
result of these shortcomings in the G-TOP model, a different approach is needed. The
goal of this research is to develop a new cognitive performance model based on both
acceleration and a detailed analysis of the relevant cortical areas for each ability
described by NTI, Inc.
Although NTI, Inc. identified 11 cognitive abilities necessary in the execution of
flight relevant tasks, it is difficult to probe these abilities directly. Therefore, they
developed a cognitive task battery consisting of 12 tests that examine each of the

22
cognitive abilities to a different extent (O'Donnell, Moise, Schmidt, & Smith, 2003). For
example, the “motion inference task” requires the subject to track a moving object
(tracking ability), infer the motion of the object at various speeds (slow and fast motion
inference), and decide whether a letterset contains a vowel (simple decision making).
Given that the performance results from each test are fed directly into the T-matrix to
determine the relative values the 11 cognitive abilities, it is important to discuss
functional areas of the brain involved in each task and their corresponding anatomic
position. In this way, a more complete understanding of the effects of positive Gz
acceleration can be found.
Development of HIPDE Cognitive
Task Battery
Development of NTI, Inc G-TOP Cognitive Performance Model
HIPDE Experiments conducted by AFRL
Development of Cardiovascular
Model
Development of rSO2
Model
Development of Cognitive
Performance Model
Model Validation
Previous Work
Current Work

23
4.4 Test 1: Perception of Relative Motion
The first of the 12 cognitive tests developed by NTI, Inc.’s efforts was the
“perception of relative motion.” The primary purpose of this task was to test human
ability to perceive and process the motion of one object relative to another object such as
his/her aircraft. In doing so, it tests perception of spatial orientation, perceptual speed,
fast motion inference, slow motion inference, tracking, and simple decision-making.
Pilots often fly in standard formations requiring precise control of their aircraft and
accurate perceptions of distance and speed between their wingmen. Although such
formations are generally not maintained during high-Gz acceleration, cognitive recovery
is not immediate (Tripp et al., 2002, Tripp et al., 2003). Therefore, it stands to reason
that performance decrements may be present following recent high-G maneuvers that are
consistent with both training and combat. Likewise, proper perception of motion relative
to another object is crucial for obstacle avoidance such as ground obstructions during low
level flight, or surface-to-air weapons. To appropriately determine the evasive maneuver
to apply, the pilot must correctly and quickly determine the objects position and/or
motion with respect to the motion of his/her aircraft. It is reasonable to expect such
maneuvers to require high-G turns, climbs, and/or dives possibly affecting the ability to
perform the task at a proficient level. Finally, operations in Iraq and Afghanistan have
required rather lengthy missions often involving air-to-air refueling. Again, the pilot
must accurately perceive the location and motion of another object in 3-dimensional
space to perform the maneuver safely and effectively. As in formation flying, refueling
does not occur at high-G although recently performed high-acceleration maneuvers may

24
have lingering effects on cognition. Because such tasks are critical to many Air Force
missions, it is important to consider the cortical areas of the brain involved in its
execution thereby elucidating the potential problem areas during acceleration.
As evidenced by the T-matrix, the ability to infer motion of objects is a critical
component of the perception of relative motion. Motion perception is a rather complex
process that has not been completely decomposed and described by psychologists and
neuroscientists (McKinley et al., 2008). However, it is generally accepted that motion
perception begins in the occipital lobe within the primary visual cortex also known as V1.
This area houses specialized neurons that respond to directional shifts aptly named
directional selective (DS) cells (Bair and Movshon, 2004). Because these cells have
relatively small receptive fields, they are only capable of responding to stimuli within a
local area (Bair and Movshon, 2004, McKinley et al., 2008). To reconstruct the entire
field of view, the discrete visual and directional information is sent from V1 to an area
known as the medial temporal visual area (MT or V5) (Maunsell & Van Essen, 1983). A
diagram of these areas can be found in figure 5. The perception of motion requires that
this cohesive depiction of the visual scene be interpolated over time.
Figure 5. Visual Cortical Areas (Dubuc, 2002).

25
Similar to high speed film used in impact testing, accurate motion perception of high-
speed objects requires a high sample rate of information. To ensure timely delivery of
this large volume of visual data, V5 neurons are densely packed and are heavily coated in
myelin, a substance that enhances the speed of action potentials down the axon (Carlson,
2007). Previous research has shown that this functional area appears to be critical for the
perception of optic flow, which is directly tied to motion perception (Peuskens, et al.,
2001). Using a non-invasive means of modulating brain activity known as transcranial
magnetic stimulation (TMS), researchers can overwhelm targeted cortical areas thereby
causing a temporary “virtual lesion.” Peuskens, et al., 2001 found that when inducing
such a lesion in the V5 area, otherwise healthy subjects were unable to distinguish
moving objects from those that were stationary. Given that reduced oxygen supply to V5
would cause a slowing of the neural firing rate, it may be expected that motion perception
of other objects may be seriously compromised and produce similar findings (Walsh, et
al., 1998).
Another component involved the perception of relative motion is the ability of the
subject to correctly ascertain his/her spatial orientation and position. Visual information
is further processed by the visual association cortex, which is divided into two sections
(dorsal stream and ventral stream) that perform different functions (Baizer, Ungerleider,
and Desimone, 1991). Research by Goodale and colleagues (Goodale and Milner, 1992;
Goodale et al. 1994; and Goodale and Westwood, 2004) provided substantial evidence
that the primary role of the dorsal stream is to guide actions and movements in 3-D space.
This revelation lead Carlson (2007) to conclude that it must be involved in the spatial

26
perception noting, “…how else could it direct movements toward [the location of these
objects]?” Because the control interface to the human operator in most aircraft is a flight
stick, limb movement and control becomes especially important. Performance of control
movements including grasping and reaching appear to be executed by various
connections between the posterior parietal lobe of the visual cortex and the frontal lobe
(Carlson, 2007). Should these areas be compromised by reduced oxygenated blood
supply, the human’s ability to navigate the aircraft to avoid obstacles even if they are
detected may still be inhibited.
4.5 Test 2: Precision Timing
The precise perception of timing information utilizes several components of cognition
from attention to motor coordination. Perhaps most critical is the temporal processing
that assists in the determination of speed and precise motor responses to incoming visual
stimuli. Perception of time and speed can be translated operationally to tasks such as
take-off, landing, the prediction of any moving object’s position at a future point in time,
and perhaps the most readily apparent of all: the general perception of time (McKinley et
al., 2008).
To counter the effects of acceleration and increase arterial blood flow to the upper
extremities, pilots are provided training on the anti-G straining maneuver (AGSM),
where accurate perception of time is extremely crucial. The maneuver consists of a deep
breath in which the pilot maintains for a 3-second duration. During this time, they
perform an isometric compression of the chest cavity, which effectively attempt to expel
the air in their lungs (McKinley et al., 2008). By closing the glottis during this muscle
constriction, pilots are able to increase pressure within the chest thereby assisting the

27
heart in pumping oxygenated blood to cortical areas of the brain. Once the three-second
time period has elapsed, the pilot rapidly expels the air held in the lungs and takes a deep,
fresh breath as quickly as possible. Breaths held longer than the 3-sec duration begin to
diminish available oxygen in the body, further restricting the amount of oxygen delivery
to cortical tissues. Short breathes (<3 sec) result in hyperventilation that generates high
oxygen concentrations in the blood. Because an elevated oxygen level is a vasodilator,
the blood vessels relax and cause the arterial blood pressure to fall even further. This
lower pressure exacerbates blood pooling in the legs and accelerates the time to loss of
consciousness. Hence, the AGSM is highly sensitive to time and the pilot must be
precise when executing the maneuver for it to be effective.
Combat missions often require the pilot to track and destroy moving enemy targets.
The effectiveness of the human operator in completing such an objective is highly
dependent on their ability to track the moving object and predict when its path with
intersect their weapons reticule or “gunsight crosshairs.” Misperceptions in the speed of
the object or prediction of its position in the future result in a missed kill opportunity,
which often eliminates any element of surprise while simultaneously increasing the risk
of successful enemy counterattacks. A review of available literature on acceleration
effects of precision timing produces few results. A study by Frankenhauser (1958) used a
stimulus identification task during accelerations up to 3 Gz and recorded reaction times as
the dependent variable. Although this experiment was not directly designed to evaluate
subject timing performance, he discovered that reaction times tended to increase with the
increasing acceleration level. This provided evidence that processing times had
elongated and reactions had slowed. However, it should be noted that 3 Gz is relatively

28
low acceleration in modern high-performance aircraft and the experiment did not include
testing above this level.
The general consensus is that timing information is processed in both the cerebellum
and the prefrontal cortex (Mangels et al., 1998; Nichelli, et al., 1996). To further define
the roles of each brain area, Mangles and colleagues (1998) compared patients with
lesions in neocerebellar regions to those with prefrontal cortex lesions on timing
performance. The results showed that the patients with neocerebellar lesions performed
significantly worse for trials with short duration (millisecond and second), whereas
patients with prefrontal cortex lesions exhibited poor performance with long duration
trials (Mangels et al., 1998). Fraisse (1984) and Mangels et al. (1998) concluded that this
fundamental difference in apparent function is a direct result of the need for the aid of
memory in the perception of time over long durations. The cerebellum is often referred
to as the internal clock of the human body and is largely responsible for circadian
rhythms and time interval perception. However, long duration time perception (more
than a few seconds) is more than the cerebellum can handle alone and must engage the
working memory functions in the prefrontal cortex to maintain awareness of the stimuli
and track its progression. This theory is further supported with a study by Nichelli, et al.
(1996) suggesting the cerebellum was responsible only for shorter duration time interval
processing. As a result, functional areas engaged in the execution of a task requiring
precision timing will vary based on the overall duration required.

29
4.6 Test 3: Motion Inference
The term “motion inference” refers to the ability to perceive and process both the
motion of an object and the estimate trend information so as to predict its position at a
future point in time even when direct line-of-sight cannot be maintained continuously.
The cognitive task designed by NTI, Inc. required the subject to assess a moving target
traveling as constant velocity. Soon after its appearance, the target would disappear and a
secondary distracter task was displayed. During this time, the subjects were required to
remember the velocity of the moving target and predict when it would intersect a target
point on the display. Hence, they had to estimate the amount of time necessary for the
object to reach the target point and then depress the stimulus response button once this
time duration had elapsed.
As previously stated, the functional brain areas involved in time estimation alter with
the required duration of the task. Specifically, time estimations of 5 seconds or more
produce activity in the prefrontal cortex as working memory processes are engaged.
Rubia & Smith (2004 as cited by McKinley, et al., 2008) mention the prefrontal cortices
of the brain in both hemispheres may “have the function of a hypothetical accumulator
within an internal clock model” for tasks lasting more than a few seconds. The results of
their research have built upon the findings of Mangels et al. (1998) and Nichelli, et al.
(1996) by specifying the dorsolateral and the inferior prefrontal cortex as crucial
functional areas in time-perception lasting more than 5 seconds. Research by Zakay
(1990) suggests that normal, healthy subjects will tend to overestimate short time
intervals (few seconds or less) and underestimate much longer times (hours) without the
influence of environmental stressors.

30
Other factors such as the cognitive workload level of the subject appear to influence
timing performance. This should come as no surprise to those whom have ever
experienced the phenomenon of “time flies when you are having fun” or an extremely
“slow” day due to low levels of activity or required effort. In fact, Tsao, Wittlieb, Miller
& Wang (1983) discovered that higher levels cognitive workload and mental processing
were correlated with an underestimation of the passage of time. Specifically, they
pointed out that the level of engagement of the subject and the relative demand on
cognitive processes influenced the overall estimation of the time interval. Conversely,
time interval estimations increased from 38 seconds (high workload) to 49 seconds when
no task was given (Tsao, Wittlieb, Miller & Wang, 1983). Hence, the amounts of
attention that can be allocated to interpreting the progression of time appears have a
significant influence on time perception accuracy (McKinley et al., 2008). As attention is
shifted to the execution cognitively demanding tasks, less attention is available to the
perception and processing of time interval estimation. Without active conscious thought
concerning of the passage of the time, the individual tends to perceive a much shorter
time period (Zakay & Fallach, 1984).
The addition of varying acceleration simply adds another factor that can serve to
influence time estimation. Initial evidence of this influence was found by Repperger et
al. (1989). Participants were required to estimate the amount of time required for a
moving light to travel between two predetermined points during +Gz accelerations. The
authors determined that subjects perceived time faster than actual at Gz levels higher than
+5 Gz indicating that they underestimated the time interval necessary for the light to
reach the second point. Hence, during high acceleration, there is a shift from

31
overestimation of the time interval (found in static 1Gz environment, (Zakay, (1990)) to
an underestimation. In the microgravity environment, Ratino et al. (1988) noticed that
astronauts’ reported a compression of perceived time during and after a space flight
mission that is now known as “The Time Compression Syndrome” (Ratino, et al., 1988
as cited by McKinley, et al., 2008).
In addition to time compression, available evidence suggests that hypoxia causes a
general slowing of stimulus processing (Fowler & Prlic, 1995). McKinley et al. (2008)
quoted the Canfield, Comrey, and Wilson (1949) conclusions “that the reaction time to
both light and sound stimuli becomes significantly longer under conditions of increased
radial acceleration.” Furthermore, Porlier et al. (1987) found increased in P300 latency
in the EEG signal correlated with increased levels of hypoxia (Sa02 of 75, 70, and 65).
This elevated P300 latency was attributed to a general slowing of stimulus evaluation
processes (McKinley et al., 2008). Furthermore, the results illustrated that participating
subjects demonstrated increased reaction times to an oddball paradigm task. This
evidence was later reinforced by a study conducted by Albery and Chelette (1998). They
also reported increased choice reaction times among subjects with inferior G protection.
These studies provide evidence that the ability to process information is degraded
during acute hypoxia. In addition, it should be expected that the inference of motion
(time interval for an object to traverse a set path) may be compressed (underestimated) as
a result of the stress of the inertial environment. In theory, this would result from time
compression syndrome, the increased engagement of the task as a result of the added
physical stressor, and decreased functioning of the prefrontal cortex.

32
4.7 Test 4: Pitch-Roll Capture
The success of a mission and the probability of survival in a hostile flight combat
environment are significantly influenced by timely the detection of a potential threat
followed by an immediate and deliberate action to counter that threat. Because available
evidence suggests that at least some cognitive abilities do not immediately recover
following an acceleration-induced ischemic insult (Tripp, et al., 2002), it is possible or
even likely that high-Gz maneuvers may greatly increase the pilot’s reaction time to a
new stimulus (e.g. new target). Similarly, elongations of reaction times could have other
disastrous effects. For example, in an extreme emergency, a pilot may be required to
initiate an ejection procedure to ensure his/her survival. Such a procedure typically
demands immediate, decisive action by the pilot. Any delays resulting from recent
acceleration stress may limit the pilot’s “window-of-opportunity” to eject thereby
increasing the risk of injury or death.
Simply reacting quickly in the above examples will not be sufficient to ensure the
survival of the pilot. Next, he/she must rapidly execute a series of procedures that are
often predefined. For example, to engage a new enemy, the pilot must execute one of
many known maneuvers (e.g. split-S) or in the case of an emergency, must perform a
series of procedures in order (e.g. place the head against the head rest, then pull ejection
handle). To gain access to both reaction times and procedural memory, the “Pitch-Roll
Capture” task was developed. This task required subjects to visually acquire a target
aircraft and then perform set procedures to bring the target within their crosshairs. Once
the target was noticed, the subjects were to first roll their aircraft until it fell between two
vertical lines in the center of their field of view. Next, they were to pitch the aircraft until

33
the target was centered in the reticule. Once satisfied that the target was centered, they
were to depress the trigger and fire upon the target.
The reaction time will be dependent on the foveal visual information processing
required to identify the target, and the subsequent processing in the frontal lobe and
motor cortex to respond. In fact, a study by Musso, et al. (2006) found that increased
cortical activation activity in the occipital and frontal lobes correlated with better reaction
times in a selective attention oddball paradigm task. It is widely accepted that visual
images in the foveal field and object identification are further processed in the ventral
stream of the visual association cortex. Raw visual data acquired by the primary visual
cortex areas (V1 and V2) is sent to the ventral stream areas including V3, V4, V8, the
lateral occipital complex, fusiform face area, etc. for further processing (Wang, et al,
1999; Carlson, 2007). Eventually, the ventral stream terminates in the ventral section of
the temporal lobe, which is further segmented into the posterior area (TE) and the
anterior area (TEO) (Carlson, 2007). The further processing alluded to previously is
designed to interpret and merge important information concerning objects and their
identity, such as color, form, shape, location recognition, and face recognition (Wang, et
al., 1999). Hence, as the subject’s attention is drawn to the sudden appearance of a new
target, his/her eyes quickly shift (saccade) to focus on this immediate threat. Instantly,
the ventral stream goes to work to interpret the size, shape, colors, etc. to quickly
determine the identity of the object. As a result, maintaining adequate oxygenation of
this area will be paramount to a quick and accurate processing. Fortunately, as the name
implies, the ventral stream is a ventral area of the brain indicating it is closer to the heart.
This positioning indicates it may be “G tolerant.”

34
Once recognized, the pilot must accurately execute the necessary procedures to respond
to the threat. Because pilots are trained quite extensively, many procedures for combat
and other emergencies become automatic requiring little conscious effort. Such training
is often referred to by psychologists as classic conditioning, where greater levels of
training result in much more fluid and automated responses (Carlson, 2007). The
automation of the responses and procedural memories are evidenced by a shift in neural
activation from high-level, trans-cortical circuits to the basil ganglia (Carlson, 2007).
The basal ganglia encompass a wide range of nuclei that includes the caudate, putamen,
nucleus accumbens, globus pallidus, substantia nigra, and subthalamic nucleus. The
caudate lies caudal to the frontal lobe and ventral to the corpus callosum. Next, the
putamen lies just caudal to the rostral end of the caudate and is largely involved in
coordinating motor responses and behaviors that are automatic (e.g. driving, swinging a
golf club, etc,). The globus pallidus positioned just inside (medial) to this structure and
the nucleus accumbens resides slightly ventral to the globus pallidus. Lastly, the
substantia nigra is the most ventral (lowest) of the basal ganglia nuclei and is located just
below (ventral to) the thalamus.
Because many of the basal ganglia structures are located in ventral areas, it is
anticipated that they will be relatively G-tolerant. Furthermore, they are located within
the midbrain and are largely decoupled from high-order conscious cognitive processes.
As a result, the basal ganglia are generally associated with low-level or primitive
functions indicating they have a lower metabolic need. It is theorized by Krnjevic (1999)
that this lower metabolism makes such areas of the brain generally more resistant to
shutting down due to lack of adequate oxygenated blood. Therefore, it follows that the

35
basal ganglia areas will remain highly G tolerant. Accordingly, there should be no
reduction in performance for the pitch-roll capture task.
4.8 Test 5: Peripheral Information Processing
Pilots are inundated with large amounts of visual information and must quickly shift
their attention amongst various instruments, radar displays, and the stimuli present
outside the aircraft. Similar to a warning siren, the peripheral visual field often serves to
direct the pilot’s attention (hence foveal vision) to areas of interest. The primary method
of directing attention is through the perception of sharp contrast, edges, and motion.
Hence, it is important to consider the potential detriments to peripheral information
processing in the high acceleration environment, especially when considering the
negative consequences on vision due to lack of blood profusion in the eyes. Without
peripheral cues, the pilot will likely miss critical information thereby decreasing mission
effectiveness and increasing the likelihood of injury or death.
It is not uncommon for the general populace to believe that vision is accomplished by
the eyes. Although the process does begin with the eyes, they are actually just sensor
transducers by which reflected light energy in the form of photons is detected. Vision
takes place in the brain where this light energy information can be processed into
constructed representations of the environment. Nevertheless, vision can not transpire
without the eyes and it important to understand how they function to appreciate the issues
created by high acceleration.
Light enters the eye through the lens where it is focused and projected on the retina.
The retinal surface contains two types of photoreceptors known as rods and cones that
vary in concentration and location. Specifically, cones are located in the center of the

36
retina and are primarily responsible for sensing visual information from the central
receptive field (McKinley, et al. 2008). Cones are critical for sensing information in the
daylight (including colors), and are known to provide high levels of acuity (Carlson,
2007). In stark contrast, rods are located in peripheral sections of the retina and can sense
very low levels of light. They have no means of processing color information and are
capable of providing relatively low visual acuity (Carlson, 2007). However, rods excel at
sensing motion and are particularly sensitive to lines, and edges. It is these features that
provide the “attention getting” qualities of peripheral vision that work so well at directing
the foveal attention.
As positive centripetal acceleration forces blood to pool in the lower extremities, the
blood pressure at the level of the eye begins to rapidly decline. At +1 Gz, the average
human eye-level blood pressure is approximately 98 mmHg. Without Gz
countermeasures such as the anti-G straining maneuver (AGSM) or a standard G-suit,
eye-level blood pressure will decrease 22 mmHg for every additional +1 Gz of
acceleration (Naval Aerospace Medical Institute, 1991). As blood perfusion to the eye
fails, the photoreceptors within the eye begin to shut down due to the fact that oxygen
(carried by red blood cells) is needed to transmit the visual data to the bipolar cells. Due
to the fact that the intraocular fluid exerts a positive pressure on the interior surfaces of
the eye, the supplied blood pressure must be even higher to overcome this pressure
gradient. The arterial supplies to the foveal photoreceptors (mainly the cones) are larger
than those supplied to the periphery. As a result, the peripheral vision generally is the
first to shut down, which is apparent to the human subject in the form of “tunnel vision.”
Here, the visual field collapses into a narrow circle in the center (fovea) of the subject’s

37
point-of-gaze. This phenomenon is also readily apparent in color vision due to the fact
that cone distributions sensitive to blue, red, and green wavelengths vary based on the
distance from the center of the retina (Carlson, 2007). In particular, blue photoreceptors
are located furthest on the periphery, which leads to difficulties viewing shades of blue at
Gz. However, the color red appears to be rather “G tolerant” due to the relative high
densities of red sensitive cones located in the fovea.
The visual information detected by the eyes is first sent to the primary visual cortex
(V1) for initial processing and then on to the visual association cortex (V2-V5,
extrastriate cortex) for high level processing. As mentioned previously, the visual
association cortex divides into the dorsal stream and the ventral stream (Baizer,
Ungerleider, and Desimone, 1991). It is well accepted that the dorsal steam is
responsible for processing motion and position information, which makes it ideal for data
received from the peripheral visual field (Carlson, 2007). Adequately named, this stream
extends from the occipital lobe toward the posterior parietal cortex (dorsal direction). As
a result, it lies further from the heart and is therefore more sensitive to shifts in arterial
blood pressure caused by increased centripetal acceleration. Because the dorsal stream
constantly provides high-level interpretation of peripheral visual information, it likely has
a high metabolic rate. Coupled with its dorsal position, it is hypothesized that this area
will be negatively affected by +Gz.
4.9 Test 6: Rapid Decision Making
Along with the plethora of visual information, the flight environment is also plagued
by the incessant need for the human operator to make decisions. Decisions ranging from
the appropriate throttle position for a given maneuver to choosing the optimal target to

38
engage must be made in a timely fashion. Unfortunately, it is the decisions that ensure
the survival of the aircraft and aircrew that require the greatest precision and the shortest
timeframes for response (McKinley, et al. 2008). The decision making process can be
segregated into several partitions including perception of the sensory input, high-order
processing of the input and comparison to information stored in memory, choice among
two or more alternatives, and a resulting response (often motor). In the case of a radar
warning display, the pilot first interprets the symbology depicting potential targets and
then compares this data with rules or knowledge stored in memory to determine the
optimal target to engage based on level of threat. Once the selection is made, the
resulting motor output is in the form of moving the flight controls to maneuver the
aircraft to engage and/or fire upon the target.
Because the decision making process is rather complex, it involves varied and
anatomically distributed areas of the brain. Sensory information is relayed through the
thalamus to designated areas of the cortex. Obviously, the stimulated areas are highly
task and sensory modality dependent. In the previous example, visual sensory
information is initially relayed to the striate cortex (V1), which in turn sends the
information to other areas (e.g. ventral and dorsal streams) for further processing
(McKinley, et al, 2008). The recognition of the type of symbol on the display and
identification of targets is completed by the lateral occipital complex (L0), which is
located within the ventral stream. Other activities such as the control of eye movements
(V7, lateral intraparietal area) and visual attention (V7, lateral intraparietal area) are
handled in the dorsal stream (McKinley, et al., 2008).

39
The selection of one of the possible alternatives often involves planning and the recall
of memories (experience). This indicates that both the prefrontal cortex and
hippocampus will be active. In fact, a study by McHugh et al. (2008) found that both the
ventral and dorsal hippocampus is important in cost-benefit decision making. Of
particular interest is the fact that hippocampal pyramidal cells (particularly those housed
in area CA1) are extremely sensitive to oxygen deprivation (Krnjevic, 1999) and are
among the first to arrest function during ischemic insults (Sugar & Gerard, 1938).
Because hippocampal cells are highly active, they have a high metabolic need. Coupled
with the fact the hippocampus does not regularly experience high levels of neurogenesis,
the rapid reduction of activity in the absence of adequate oxygen is believed to be a
protective mechanism aimed at the preservation of energy for vital functions such as the
maintenance of the sodium-potassium (Krnjevic, 1999).
The decision making process is also known to involve both the ventromedial
prefrontal cortex (Smith et al, 2002) and the amygdala (Bechara, 2006) in certain
situations. In particular, some decisions (especially those involving life or death) can be
significantly affected by the emotional weight associated with a particular alternative
(Bechara, 2006). Hence, some decisions may be evaluated simply on an emotional level
rather than an objective weighting of the alternatives (Bechara, 2006). On the other hand,
the ventrolateral prefrontal cortex is critical for resolving internal conflicts and making
careful, calculated choices. Research completed by Smith et al. (2002) found that lesions
to this area negatively affected these processes.
The output of the decision process is often in the form of a motor response. Motor
output is also a rather complex process involving planning of the movement to be

40
accomplished (prefrontal cortex), coordination of the movement in 3-D space (cerebellar
cortex), manipulation of the appropriate segments of the body (motor cortex), and
sensory feedback/proprioception (somatosensory cortex). Most cortical areas have high
metabolic rates due to the high-level functions they perform. The dorsal positions of the
motor and somatosensory cortex place them at an even greater disadvantage when faced
with high-G acceleration. Likewise, available evidence suggests that the cerebellar cells
(Purkinje Fibers) are also extremely sensitive to oxygen deprivation (Krnjevic, 1999).
Because the active areas involved in a given decision are extremely varied and
disparate, the process is difficult to delineate. As a result, it is unclear whether positive
acceleration will have a benign or cataclysmic effect on the decision making process
(McKinley, et al., 2008). Although it is possible that cognitive deficits may manifest
during Gz loading due to the potential failure of highly oxygen-sensitive areas such as the
hippocampus and cerebellum, and high-level processing areas such as the ventromedial
prefrontal cortex, visual association cortices, motor cortex, etc., other areas such as L0
and the amygdala may be protected due to the relatively low anatomical position or
smaller metabolic need (McKinley, et al., 2008).
4.10 Test 7: Basic Flying Skills
Of the many tasks that must be completed, perhaps the most fundamental is that of
flying the aircraft. It is a complex cognitive skill that requires the pilot to continuously
monitor the state of the aircraft, make decisions, plan maneuvers, and then execute them
with precise inputs to the flight controls. Essentially, it encompasses many of the skills
probed in other tests described in this document and uses the same areas of the brain

41
discussed in those sections. Although “Basic Flying Skills” was not designed to be a
stand-alone test, it provides the foundation for many of the other tests such as
“Situational Awareness,” “Unusual Attitude,” and “Visual Monitoring” that will be
described in the following sections. It has been argued that complex cognitive processes
are difficult to capture by combinations of simpler processes (O'Donnell, Moise,
Schmidt, & Smith, 2003). However, by delineating the complex nature of the flying skill
by focusing on specific elements, it is possible to find specific those that become
problematic under high acceleration stress. Nevertheless, the complex skill remains
inherent to the task and is thus indirectly tested. The following sections describe the
segregated elements of flying the aircraft.
4.11 Test 8: Gunsight Tracking
Although pursuit tracking is often referred to as a psychomotor task rather than a true
cognitive ability, it cannot be performed without the benefit of several high-order brain
functions. In fact, due to the performance characteristics of modern aircraft, gunsight
pursuit tracking can be one of the more challenging tasks for a pilot and is often only
achieved through a series of substantial high-Gz maneuvers. As a result, it is important to
identify and understand the areas of the brain responsible for carrying out this critical
function. Decrements to this skill create substantial risk to the mission and the survival
of the aircrew.
The task of tracking an enemy involves the ability to successfully maneuver the
aircraft such that the enemy is transfixed in the gunsight crosshairs. Hence, motor
circuits of the brain will be the primary means of accomplishing this feat. Central to the
42
execution of muscle movement is the primary motor cortex located on the precentral
gyrus. This area is segregated into sections denoting the area of the body that it controls.
Similar to the somatosensory cortex, segments responsible for areas requiring fine control
(e.g. hands, fingers, lips) are disproportionately larger than those that do not (e.g.
buttocks abdomen, shoulder). The segments that control the arms, hands, and fingers
(essential for flight control inputs) are located toward the dorsal end of the cortex,
adjacent to the section controlling the abdomen.
Other areas of the brain aid in the planning, learning, and control of movements.
Specifically, both the supplemental motor area (SMA) and the premotor cortex are
critical in the in the planning of movements. Both are located just rostral to the primary
motor cortex, but the SMA is found on the lateral surface whereas the premotor cortex is
located on the medial surface (Carlson, 2007). Their ability to execute planning is nested
in their connections with the frontal cortex. Additionally, they receive information from
visual association areas of the parietal and temporal cortex (Carlson, 2007). The dorsal
stream provides spatial information, which is critical for controlling both arms and hands.
Furthermore, the SMA is highly engaged in the execution of a series of learned
movements (Hikosaka et al., 1996; Gerloff et al., 1997). This is particularly relevant to
execution of specific maneuvers (e.g. split-S) that require a learned sequence of several
motor actions to the flight controls. On the other hand, the premotor cortex is engaged in
learning/executing movements that involve sensory inputs (Carlson, 2007). Hence, it is
necessary for actions such as the manipulation of an object (e.g. flight stick) which
requires input from the dorsal stream to indicate the spatial relationship between its
position and the position of the hand.

43
Several nuclei of the basal ganglia also appear to influence movement of the body.
The caudate nucleus, putamen, and globus pallidus all receive information from the
primary motor cortex and have outputs to the SMA, premotor cortex, and primary motor
cortex (Carlson, 2007). Because the basal ganglia also receive inputs from all other
regions of the cerebral cortex (including the somatosensory cortex), they can supervise
the planned movements information from the primary motor cortex and influence them
directly.
Lastly, the cerebellum is greatly involved in the coordination of movements and
motor memory. The lateral zone of the cerebellum receives information regarding
planned movements from the primary motor cortex along with current state information
(e.g. position of limbs) from the somatosensory cortex. Using this information, it quickly
determines which muscles will be needed and how much they must contract or relax. To
influence ongoing movements, the cerebellum relies on the ventrolateral nucleus, which
is a division of the thalamus responsible for receiving information from the cerebellum
and sending it to the primary motor cortex. Although the cerebellum is located in a
ventral area of the brain, a study conducted by Krnjevic (1999) suggests that the
cerebellar cells (Purkinje Fibers) are extremely sensitive to oxygen deprivation and are
among the first to decrease their firing rates. Combined with the fact that the primary
motor cortex is highly active and located in a dorsal area, it is likely that the ability to
track a target under sustained Gz acceleration will be compromised.
4.12 Test 9: Situational Awareness
Regardless of the combat arena, maintaining awareness of the situation including the
surrounding environment, current operator state, enemy location, friendly force

44
location/status, etc. is critical to the success of the mission. Perhaps the most well
accepted definition of situation awareness (SA) was coined by Endsley (1988) as “the
perception of the elements in the environment within a volume of time and space, the
comprehension of their meaning, and projection of their status in the near future.” In
fact, Endsley further divided situation awareness into three levels. These include:
1. Perception – perceiving environment through sensory channels (e.g. visual,
auditory, tactile, and olfactory) through distribution of attention.
2. Comprehension – “relating perceived information to operational goals” (Kaber,
Onal, & Endsley, 2000)
3. Projection – ability to predict the future state of the environment (Kaber, Onal, &
Endsley, 2000).
Heinle and Ercoline (2003) provided additional detail concerning SA components of
particular relevance to the flight environment including spatial orientation, tactical arena,
weather, navigation, and ownship status (see figure 6).
Tactical Arena
Weather Spatial Orientation
Ownship Info
Navigation
Figure 6. Components of Situation Awareness (Heinle & Ercoline, 2003).

45
A loss of situational awareness can be catastrophic to the mission and can endanger
the lives of the aircrew. For example, a loss of situation awareness can lead to a
corresponding loss of spatial orientation. In the time period from 1990 to 1999, spatial
disorientation (SD) was responsible for $554 million in lost aircraft and 44 lost operators
(Heinle & Ercoline, 2003).
Situation awareness is highly influenced by the level of cognitive workload. Under
low levels, the operator often becomes bored and complacent resulting in lower levels of
attention. Because comprehension and retention of information can only be
accomplished for that which is being attended, low attention levels lead to a reduction in
the amount of sensory information processed from the environment (Halpern, 2003).
Low information throughput will inevitably decrease the level of situation awareness
creating risks for lapses in judgment and critical errors. Likewise, high levels of mental
workload have been shown to degrade situational awareness through a phenomenon
known as attention tunneling (Cummings, 2004). Defined by Wickens (2005) as “the
allocation of attention to a particular channel of information, diagnostic hypothesis or
task goal, for a duration that is longer than optimal, given the expected cost of neglecting
events on other channels, failing to consider other hypotheses, or failing to perform other
tasks,” attention tunneling appears to be exacerbated by environmental stressors such as
fatigue, particularly in long-duration flights where cognitive stimuli found in lower
concentrations and sustained monotony leads to lower levels of attention. Similarly, high
levels of automation generate lower levels of cognitive stimulation and therefore lower
levels of attention. This complacency gives rise to low situation awareness thereby
increasing the risk of a mishap or mission failure.

46
Because situation awareness is a rather broad term that involves many sensory
stimuli, the brain areas responsible for its perception are likewise broad and complex. As
illustrated by Endsley (1988), the first level of situation awareness is perception of the
environmental stimuli. Principally, pilots utilize visual, auditory, vestibular, and
proprioceptive/tactile channels to dynamically assess the surrounding environment. As
the visual channel was covered extensively in previous sections, it will not be discussed
in detail here. However, it should be noted that both the ventral and dorsal streams will
inevitably be utilized in maintenance of situation awareness.
Analogous to the visual processing centers, the auditory cortex can be segregated in
dorsal and ventral streams. Interestingly enough, the dorsal streams from both the visual
and auditory cortex converge and overlap in the parietal lobe indicating they work
cooperatively (Carlson, 2007). A study conducted by Rauschester and Tian (2000) using
primate neural recordings suggested that the ventral stream discriminated different types
of monkey calls whereas the dorsal stream was responsible for determining the spatial
location of the sound. A review of human functional imaging studies by Arnott et al.
(2004) also noted the significant activation of the ventral stream during sound
identification and dorsal stream activity in auditory spatial location tasks (Carlson (2007).
Hence, the ventral stream processes the form and characterization of the sound while the
dorsal stream provides the location.
Recognition of sounds and objects can only transpire once they have been encoded.
Just as the visual and auditory cortices coexist in the parietal lobe, they also share
connections in the frontal lobe which are believed to be necessary for encoding memories
of specific stimuli (Bodner, Kroger, and Fuster, 1996). Likewise, tactile cues processed

47
by the somatosensory cortex also send projections to the prefrontal cortex. When the
prefrontal cortex was disrupted, it was observed that primates exhibited significantly
worse performance on a haptic delayed match-to-sample task thereby illustrating its
theorized role in perceptual memory encoding (Shindy, Posley, and Fuster, 1994).
Evidence from functional imaging also indicates the posterior middle temporal gyrus is
crucial in recognizing objects and awareness of the surrounding environment (Lewis, et
al., 2004).
In the second stage of SA, the human operator must comprehend the processed
stimuli by relating the new information to specific goals. Relating data involves, in part,
the connections between the different sensory modality processing centers previously
described. To fully comprehend relationships of objects to each other and the
environment, it is necessary to engage complex memories that include all types of
available sensory information available only through these complex sensory interactions
(Carlson, 2007). Understanding the environment in the context of goals requires relating
the new information to stored declarative memories. Because the hippocampal formation
is critical in the consolidation of declarative memories, it effectively links information in
ways that create relationships with similar categories (Carlson, 2007).
The third stage of SA requires the operator to make projections of the future state of
the environment. Emerging evidence suggests that the same processes required for
recollection of past events are also necessary for creating new expectations of the future
(Schacter, Addis, and Buckner, 2007). Essentially, stored memories are used to construct
and simulate possible future states. Initial insights were provided through observations of
amnesic patients with bilateral hippocampal damage. When asked to imagine new

48
experiences without describing a specific memory, the resulting narrative lacked spatial
coherence, detail, and richness (Hassabis, et al., 2007). This theory was further
substantiated with functional neural imaging studies. Specifically, Szpunar, Watson, and
McDermott (2007) asked participants to recall past experiences, predict possible futures,
or imagine events with familiar individuals while undergoing a functional magnetic
resonance imaging (fMRI) session. The results showed significant activity in the
prefrontal cortex, hippocampus, parahippocampal gyrus, and posterior midline region at
or near the precuneus during recollection and prediction, but not while imaging events
with familiar people. These findings were confirmed by an additional fMRI study
conducted by Addis, Wong, and Schacter (2007). Again, substantial overlap in areas
active during recollection and prediction were observed, namely the prefrontal cortex,
medial temporal lobe regions including the hippocampus and parahippocampal gyrus,
and a posterior midline region near the precuneus. These areas have been summarized in
figure 7 by Schacter, Addis, and Buckner (2007).
Figure 7. Funtional Brain Areas in Recalling the Past and Predicting the Future (Schacter, Addis, and Buckner,
2007).

49
Given the broad definition of situation awareness and the complex relationships of the
brain areas involved in its perception, it is difficult to predict the extent of the hypoxia
consequences that may manifest during acceleration. For example, the medial and lateral
temporal cortices, auditory cortex, and lateral parietal cortex all are aligned near or below
the horizontal plane, which may provide protection from losses in blood pressure due to
the decreased distance to the heart. However, the hippocampus is extremely sensitive to
ischemic events and is significantly involved in SA perception indicating negative effects
may emerge.
4.13 Test 10: Unusual Attitude Recovery
Whether as a result of an unrecognized climb/turn resulting from a loss of situation
awareness, or a visual/vestibular illusion due in part to low visibility conditions, pilots
may encounter what is referred to as an “unusual attitude (UA).” Obviously, an
unanticipated or unusual aircraft attitude is dangerous often leading to controlled flight
into terrain (CFIT) if not recognized and corrected in a timely manner. Typically, UA
events are caused by unrecognized spatial disorientation, which is defined by the DoD as
“the failure to correctly sense the position, motion, or attitude of one’s aircraft with
respect to the earth or other object.” Because the human vestibular system has evolved to
function in a static, unidirectional gravitational environment, it often provides erroneous
or inconsistent cues to the human operator caused by the fluctuations in the direction and
magnitude of the acceleration vector. Although class A mishaps among fast fighter jets
listing SD as a major contributing factor have declined in recent years, it should be noted

50
that SD related incidents cost the DoD an average of over $300 million per year in
accident investigations alone (Wickens, et al., 2007).
SD illusions can be purely visual, purely vestibular or a combination of both. Perhaps
one of the most dangerous illusions is the aptly named “Graveyard Spiral.” In this
scenario, the pilot enters a sustained turn in a degraded visual environment for several
seconds or more. Because the vestibular system acts as an accelerometer, the fluid in the
semicircular canals (responsible for perceiving the initial rotation) eventually return to
the state of equilibrium thereby negating the sensation of continuous rotation. As the
pilot exits the turn, the semicircular canals shift in the opposite direction and cause a
strong sensation of turning in the opposite direction. The pilot is then tempted to negate
this sensation by returning to the original turn (if he/she fails to perform an instrument
crosscheck). Often, the pilot will notice a loss of altitude caused by the continuous turn.
Because they feel as if the aircraft is flying straight and level, the nature tendency is to
pull the nose of the aircraft up. Consequently, the aircraft spirals into increasingly tighter
turns thereby exacerbating the situation. If left unchecked, the aircraft will eventually
impact the ground. However, an instrument crosscheck would reveal the current unusual
attitude of the aircraft from which the pilot would have to recover as quickly as possible.
Because Gz acceleration can be found in such scenarios, it is important to consider
underlying neural areas critical to the execution of this task such that the causes of
potential performance decrements can be adequately understood.
To recover from an unusual attitude, the pilot must first recognize and assess his/her
current location/orientation and the spatial relationships of objects in the surrounding
environment. The perception of orientation and spatial location requires input from

51
several sensory systems including the vestibular, somatosensory, and visual systems
(among others). These sensory systems send projections to the parietal lobe where the
information is primarily integrated and coordinated to assess spatial location, orientation,
and distances to objects in the immediate vicinity (McKinley, et al., 2008). However,
results from Kessler, et al. (2004) suggest that the perception of spatial orientation is
actually more complex. In fact, it involves continuous transactions between the parietal
lobe, frontal lobe and occipital lobe with primary structures including the inferior parietal
lobules, the middle occipital gyri, and the superior parietal lobules (Kessler et al., 2004).
Human vision plays a profound role in perceiving orientation and spatial location.
Even in the presence of intense, incorrect, disorienting vestibular stimuli, the pilot can
typically negate the sensations with adequate exterior visual cues. Of specific relevance
are the medial temporal and medial superior temporal areas of the visual dorsal stream.
Both are highly active in the perception of motion and optic flow (Carlson, 2007).
Likewise, the perception of depth appears to be handled by the dorsal stream, with
particular emphasis on the caudal intraparietal sulcus (CIP) (Tsao, et al., 2005). Evidence
also suggests that the inferior parietal lobe is critical in spatial encoding and memory.
Specifically, functional imaging study conducted by Kessler, et al. (2004) found
decreased activation of this area in patients suffering from Turner syndrome (TS), a
condition known to produce difficulties in perceiving spatial relationships.
Acute ischemic insults to these areas would further reduce the likelihood of recovery
from unusual attitudes. Without adequate oxygen, areas with high metabolic rates, such
as cortical areas within the occipital and parietal lobes will begin to reduce firing rates as
a neural protective measure. Consequently, it is important to assess the extent to which

52
these processes are compromised such that appropriate countermeasures can be designed
and employed.
4.14 Test 11: Short Term Memory
Although some flight tasks, such as depressing a button or adjusting a control, require
only an accurate perception of sensory information, many others demand temporary
retention of the incoming data (up to several seconds). Specifically, the pilot may receive
navigation or other flight instructions from air traffic control or a flight lead (e.g. descend
to 8,000 ft), which cannot be completed instantaneously. Hence, he/she must accurately
perceive the auditory information and then retain it for a short amount of time until the
instructed maneuver can be executed. Additionally, when performing an instrument
crosscheck, the pilot quickly glances at many different displays to assess the aircraft
state. Because it is often not possible or even logical to continuously monitor one piece
of information, the pilot is forced to remember each aircraft parameter until the next scan
is completed. Commonly referred to as perceptual short term memory (STM), brief
storage of new information is both limited and highly transient (McKinley, et al., 2008).
The limitations of STM were first posited by George Miller (1956). In particular, Miller
discovered that on average, the maximum bits of information that can be stored in STM
are 7 ± 2.
Central to short term memory processes are the underlying biochemical interactions
within the neural synapases. Memories often involve complex neural networks that are
distributed throughout the brain. Hebb (1949) postulated that new memories are formed
by augmenting and modifying activity across these neural networks by a mechanism

53
known as brain plasticity (Bliss and Lømo, 1973). Simply stated, plasticity refers to the
fact that neural synaptic strength can be augmented through biochemical and or structural
changes (Carlson, 2007; Messaoudi, et al., 2007). Because the environment is ever
changing, plasticity evolved as a way to allow the human at to adapt quickly to an ever-
changing environment. In fact, synaptic strength within neural networks continues to
change throughout the life of the individual. Even long-term memories that were once
thought to be “hardwired” are influenced by new experiences and can be revised at any
time (Bruel-Jungerman, Davis, & Laroche, 2007). Although brain plasticity often refers
to lasting synaptic modifications such as those found in long-term potentiation (LTP) and
long-term depression (LTD), sensory neural activity can persist for 2-30 seconds after the
stimulus is removed without causing a more permanent neural change (Carlson, 2007).
This sustained activity essentially constitutes the new short term memory.
The brief sustainment of sensory neural activity is typically manifested in the sensory
association cortices. However, it is also believed that the frontal lobe encodes memories
of specific stimuli (Bodner, Kroger, and Fuster, 1996). In fact, significant activity of the
frontal cortex was recorded in monkeys forming an STM task (Funashi, Bruce, and
Goldman-Rakic, 1989). Evidence of human prefrontal cortex activity in a delayed
match-to-sample task was later discovered by Courtney, et al. (1998). Conscious thought
about the information to be remembered such as the way an object appears, it
relationships with other objects, etc., appear to induce activity in both the dorsolateral
prefrontal cortex and the inferior prefrontal cortex (Carlson, 2007). Although
hippocampal activation is often associated with memory encoding and retrieval, it does
not aid in the retention of short term memories (McKinley, et al., 2008). Supporting

54
evidence was discovered by Milner and colleagues through the use of patients with
damage to the hippocampus (diagnosed with anterograde amnesia). Their studies showed
that although the patients could not form new long-term memories, small amounts of
information were retained for short durations up to 30 seconds (Milner, Corkin, and
Teuber, 1968; Milner, 1970).
The short term memory task developed by NTI, Inc. utilizes an auditory retention task
where a list of flight procedures is read to the subject who must subsequently recall and
execute them correctly following a short delay. Consequently, it is theorized that in
addition to regions of the prefrontal cortex and auditory association cortex, other cortical
regions such as Wernicke’s area will be necessary to correctly process the verbal
instructions. Likewise, the primary auditory cortex located in the superior temporal lobe
will be actively engaged (McKinley, et al., 2008). Because short term memory does not
require the activation of the oxygen-sensitive hippocampus and both the primary auditory
cortex and auditory association cortices lie near the horizontal plane, it is theorized that
the short term memory will be relatively unaffected at relatively low and moderate Gz.
However, cortical areas in the frontal lobe may not be as well protected due to a greater
distance from the heart. Therefore, high Gz may significantly reduce the ability to retain
even limited bits of information for short periods of time.
4.15 Test 12: Visual Monitoring
The act of performing instrument cross-checks and monitoring specific
gages/symbology lays the foundation for the pilot’s actions and understanding of the
surrounding environment. Advances in senor technologies and communications have
lead to a substantial increase in the number of displays presented to the operator/pilot

55
thereby challenging these individuals to not only read, but comprehend, and act upon the
information appropriately. Degradations to this ability would most certainly lead to an
increase in opportunities for the human operator to make incorrect judgments, errors, and
misperceptions of the environment. In short, the pilot would need to rely on natural
sensory inputs (e.g. vestibular, somatosensory, aural, etc.), which are often misleading in
flight.
To understand the effects of acceleration on the ability of the pilots to accurately read
his/her instruments (dials), it is first necessary to investigate how such a task is performed
in the static environment. Although the first aircraft incorporated only a few simplistic
round dial instruments, modern aircraft have incorporated large LCD panels, known as
multifunction displays (MFDs), capable of providing much more information. Likewise,
the number of traditional “round dials” has also increased with the number of sensors
placed on the aircraft and remains a staple of many modern aircraft as they provide a
“back-up” system in cases of malfunctions or emergencies. Additionally, redundant
information is provided on heads-up displays (HUDs) or helmet-mounted displays
(HMDs), to allow the pilot to maintain awareness of the aircraft state while looking out
the windscreen and/or targeting enemies. With this incredible amount of visual stimuli
all competing for the pilot’s undivided attention, several studies have been aimed at
discovering the methods and strategies aircrew employ to process the data and the
corresponding mental workload ascribed to this procedure (Casali & Wierwille, 1984;
Hayashi, 2003; Phillips, et al., 2007; Wilson, 2002). One question is whether pilots
process information in parallel or serially.

56
Wicken’s (1984) developed the multiple resource theory which proposes that
different tasks are ascribed different resource allocations thereby permitting multiple
tasks to be conducted in parallel. Hence, one could view an instrument while
simultaneously processing an audio warning. In fact, well accepted architectures used to
develop specific models of cognition such as Adaptive Control of Thought, Rational
(ACT-R), and Executive-Process Interaction Control (EPIC) utilize this theory by
allowing multiple procedures such as the processing of sensory data, to occur
simultaneously. Still, it seems that information within the same modality (e.g. vision)
uses the same “resource” pool and can therefore not be processed in parallel. This is
reinforced with evidence provided by Hayashi (2003) who hypothesized that instrument
reading requires visual fixation, however brief, and must therefore occur serially.
Consequently, during crosscheck the pilot advances through each display one-at-a-time
and must pause on each to gain an accurate reading of the information or data values
presented (McKinley, et al., 2008).
Typically, visual displays (especially “round dials”) are designed such that each has a
normative value or range located in the same or similar area to allow for quicker and
more intuitive crosschecks. Hence, the pilot can rapidly look across the displays and
simply look for the reading(s) that is dissimilar from the others and take corrective
action(s). This is particularly true of gages depicting aircraft system diagnostic
information such as oil pressure, temperature, hydraulic pressure, etc. Parameters related
to aircraft state such as airspeed, altitude, pitch angle, etc. will alter with pilot controls
and will therefore have changing expected values to which they are compared. Hence,
although serial in nature, the instrument design permits the pilot to complete the

57
instrument crosscheck quickly as he/she only needs to look for inconsistencies rather than
looking at a display, recalling its normative value, comparing it to the current value, and
then moving to the next instrument.
Although human vision will be affected by the ability of the eye to sense the stimulus,
much of human sight occurs in visual cortical areas of the brain. The eyes merely act as a
transducer that sends the raw data to the brain for further processing. Deciphering
information within the instruments requires perception of the content or the “what” of the
objects within the screen. As previously stated, this will function is handled by the
ventral stream of the visual cortex that extends from the striate cortex to the inferior
temporal cortex. Within this stream, individual areas are known to be highly engaged in
specific functions. The V3 area is primarily associated with the processing of the visual
scene, V4 performs the analysis of form, V8 is responsible for color perception, and L0
provides object recognition (Carlson, 2007). The fact that the primary cortical areas
involved in visual monitoring lie in relatively ventral areas suggests that they may be
somewhat protected from Gz acceleration due to the closer proximity to the heart.

58
5.0 RESEARCH APPROACH
5.1 Methodology
Development of HIPDE Cognitive
Task Battery
Development of NTI, Inc G-TOP Cognitive Performance Model
HIPDE Experiments conducted by AFRL
Development of Cardiovascular
Model
Development of rSO2
Model
Development of Cognitive
Performance Model
Model Validation
Previous Work
Current Work
Human behavior is often complex, dynamic, non-linear, and subject to a multitude of
variables, both internal and external, that invariably lead to large variance across subjects
and produces an overall system that is difficult to model with a high level of precision.
However, when properly bounded to specific situations or domains, human operator
performance can be accurately and reliably described through mathematical relationships
and engineering principles within acceptable limits. According to Phillips (2000), “the
central tenet human factors engineering is that the human operator, environmental, and
technological subsystems can be defined and modeled mathematically using methods
found in classical control theory.” Furthermore, Phillips (2000) defined a general

59
schematic for human operator control systems that serves as the foundation for the model
developed for this effort (see Figure 8).
Physical/Natural Environment (PNE)
Human/Operational Environment (HOE)
Central Nervous Processor (CNP)
Neuromuscular Actuator (NMA)
Technological Plant
Human-System Interface (HSI)
Human Operator Output
Human Operator
Input
Technological Plant Output
FGI
FFI
Environmental Subsystem
Human Operator Subsystem
Technological Subsystem
Figure 8. General Schematic flow for a human operator control system (Phillips, 2000)
The purpose of this effort was to development a modeling framework that could be
used to predict human cognitive performance during positive acceleration stress over a
variety of tasks (especially those applicable to the flight environment). Although the
HIPDE program studied a comprehensive list of twelve cognitive tasks, only two were
selected for this modeling exercise. The primary reason was that the overall objective
was to initialize a sound modeling framework that could then by expanded to include
nearly any cognitive task desired, provided a detailed understanding of the active brain
areas involved in execution of the given task has already been achieved.
Each of the twelve HIPDE tasks were examined in detail. Both the precision timing
task and the motion inference task utilized a similar visual elements, structure, and had

60
very similar instructions to the subjects. A detailed description of each can be found in
McKinley, et al., (2008) and a brief summary is provided in section 5.3. Essentially, each
task probed the ability to perceive the progression of time under Gz stress, but differed in
how that timing information was processed by the brain. Because the precision timing
task trials were of short duration (<5 sec) and the target remained visible to the subject,
timing information could be accomplished by the body’s internal clock, the cerebellum
(Nichelli, et al., 1996). The motion inference task obscured the target from view and
maintained longer durations, which forced subjects to use working memory to store the
initial target velocity and make estimations about when it would intersect the harsh mark
on the semicircular arc. As a result, the cerebellum would be incapable of performing the
timing perception and would require assistance from the dorsolateral prefrontal cortex
(DLPFC) (Nichelli, et al., 1996). Because these two tasks were functionally similar, but
different in the brain area they stimulated, they provided ideal candidates for which to
develop the modeling structure and subsequently validate the accuracy of the model
predictions across different tasks.
The model includes both cardiovascular and neurophysiological elements that
combine to make predictions about cortical function during acceleration stress and the
corresponding impact on specific cognitive tasks. The conceptual flow diagram is
presented in figure 9 below. The first step in the development of the model was to design
the basic underlying structure for the hemodynamic portion of the model. A full
description is provided in the following section.

61
Cardiac Output (Heart
Rate/Stroke Volume)
Eye Level Arterial Systolic Blood
Pressure (mmHg)
Peripheral Vascular
Resistance
Task-Dependent Functional Brain Areas Metabolic
Rate
Mathematical Cardiovascular Model
Area Dependent
Cerebral Oxygen
Saturation Model
Gz Acceleration
Input
Collected Task Performance
Data
Neuro-physiological Model Sections
Task Performance
Prediction
Validation
Build Model Coefficients
Figure 9. Conceptual Model Flow Diagram

62
5.2 Model Assumptions
The following is a list of assumptions made during development of the human
cognitive performance model under acceleration stress.
1. Because the model assumes an average fixed heart-to-eye level distance of 30
cm and was tested with data averaged across subjects and days, model
predictions should be applied only to pilot populations, not individuals.
2. Pilots are highly experienced with regard to high-G maneuvers. Their high-G
training has produced a higher G-tolerance when compared to untrained
operators.
3. Pilots are highly trained on each task performed in the flight environment.
4. Pilots are equipped with the standard anti-G suit supplied by the U.S. Air
Force.
5. Pilots have received training on and regularly utilize the anti-G straining
maneuver (AGSM).
6. Pilots are in good health, have a normally functioning cardiovascular system,
and are not taking medications that might alter cognitive performance.
7. Other forms of physical stress such as heat, vibration, and fatigue (resulting
from sleep deprivation) are not included in the model but may be present in
the environment.
8. Pilots are alert and focused on the task.

63
5.3 Cardiovascular Model
Development of HIPDE Cognitive
Task Battery
Development of NTI, Inc G-TOP Cognitive Performance Model
HIPDE Experiments conducted by AFRL
Development of Cardiovascular
Model
Development of rSO2
Model
Development of Cognitive
Performance Model
Model Validation
Previous Work
Current Work
Because neural cells rely almost exclusively on aerobic metabolism of glucose for
energy production, the brain demands a large amount of fresh, oxygenated blood to
function properly. In fact, the brain utilizes nearly 50% of oxygen supplied by the
arterial blood stream. The inability of neurons and their supporting glial cells to
metabolize fats and carbohydrates for energy renders them incapable of storing a local
supply of reserve energy stores. Consequently, when the brain is starved of oxygen,
cerebral function will begin to slow and eventually arrest function. As a result, the
primary variable in the model is the ability of the heart to deliver oxygen-rich red blood
cells to the dorsal regions of the brain and maintain adequate cerebral perfusion, which is
principally dictated by systolic blood pressure. To overcome the increasing apparent
weight of the blood resulting from rising Gz acceleration, the heart must generate

64
adequate compensating pressure. Blood pressure can be quantified using the below
equations:
RQPA (Equation 4)
SVHRQ (Equation 5)
where PA is arterial systolic blood pressure, Q is cardiac output, R is total vascular
resistance, HR is heart rate, and SV is stroke volume. Thus, blood pressure is controlled
by three primary variables (SV, R and HR). In keeping with the theory that human
operator control systems can be modeled with proper application of conventional control
theory, a negative feedback, proportional control system was selected to model the eye-
level arterial blood pressure under high acceleration stress. A block diagram of the final
model is presented in the figure 10.

65
+
+
+ _
G1
s
P
G2
G3
'RP
KP
(Controller) (Plant)
'eP
'P
fP
'P
'
HR
G4
G5
'
SV
'
R
zG
G6'zG
iP
't
Figure 10. Cardiovascular Model Block Diagram
First, the central nerve processor (CNP) acts to control blood pressure through
autonomic regulation of heart rate, stroke volume, and peripheral resistance. The
feedback mechanism includes baroreceptor and mechanoreceptor reflexes in the carotid
sinus that sense pressure fluctuations. As errors between current and required eye-level
blood pressure are sensed and fed back to the CNP, corrective hemodynamic actions
begin to initialize in the form of increased heart rate and increased peripheral vascular
resistance (through increasing vasoconstriction) (Salzmann & Leverett, 1956). However,
the elevated inertial pressure due high acceleration causes a shift in blood volumes in the

66
direction of the acceleration vector (Grygoryan, 1999). The reduced blood return to the
heart correspondingly results in a decline of the end diastolic volume. Because stroke
volume is simply the difference between the end diastolic volume and the end systolic
volume, stroke volume will suffer decreases as well (Jennings, et. al., 1990). Each of the
three variables is modeled with a proportional control algorithm that is dependent on the
pressure error feedback signal from the baroreceptor and mechanoreceptor reflexes.
The acceleration stress on the human operator was defined in the physical/natural
environment block. The arterial system can be approximated as a vertical hydrostatic
column of blood, which permits the use of Pascal’s Law (Eqn. 6), where “P” is the blood
pressure, “ρ” is the blood density, “g” is the acceleration due to gravity, and “h” is the
height of the arterial column.
ghP (Equation 6)
This equation provides the approximate drop in pressure from the heart to various
locations in the brain (depending on the value of “h”) based on the current value of the Gz
acceleration. For this effort, the distance from the heart to eye level was approximated to
be 30 cm. This then served as the reference point for distance locations to major cortical
and subcortical regions in the brain. An online brain atlas published by Johnson and
Becker (1999) was used to determine the heights from the eye to each brain area used in
the performance model. Pascal’s Law was then used to determine the pressure gradient
created by the acceleration profile. To calculate the change in pressure gradient between
the heart and eye at any point in time, it was necessary to first define the initial pressure

67
drop from heart to eye level. The difference in blood pressure between heart and eye
level at time “t” and the initial pressure difference between heart and eye level was set as
the pressure gradient. Hence, this calculated gradient is the additional required systolic
pressure required at the heart to overcome the increased apparent pressure generated by
the increase in Gz acceleration, annotated as PR. This is contained in element G6 of the
model diagram and defined by equations 7-10, where PHi is the initial systolic blood
pressure at the heart. The relevant portion of figure 9 is provided to the left set of
equations for reference and ease of use for the reader.
eyezi hGgP )1( (Equation 7)
eyehtgtP )()( (Equation 8)
iPtPtP )()( (Equation 9)
)()( tPPtP HiR (Equation 10)
Although the above equations provide a method for calculating the approximate
required blood pressure, current technology and U.S. Air Force pilot training methods
provide countermeasures that assist the heart in generating compensating pressure. The
first aid is the standard G-suit that is a set of trousers equipped with air bladders in the
calves, thighs, and lower abdomen. As the aircraft generates positive Gz acceleration, a
valve opens and allows pressurized air to enter the suit’s bladders. The pressure of the
suit can reach up to 13 pounds per square inch (psi) (~672 mmHg). This increased
external pressure then squeezes blood pooling in the legs back up toward the heart.
Accordingly, venous blood return to the heart is improved (decreases attenuated) which

68
translates to higher stroke volumes and increased systolic blood pressure when compared
to subjects without G-suit inflation, but only for a short duration (~6-12 seconds) (Tripp,
et al, 1994). The compensatory pressure produced by the G-suit is incapable of forcing
all the blood pooling in the lower extremities back to the heart. Thus, if the G-suit
bladder pressure is maintained for prolonged time periods, the continuous constriction of
the legs and abdomen actually serve to trap the blood that is forced into the lower regions
of the legs. Hence, the venous return will again decrease creating a lower stroke volume
and subsequently a lower systolic blood pressure.
The second method of reducing the physiological costs of high acceleration profiles is
a technique known as the anti-G straining maneuver or the Valsalva maneuver (Jennings,
et al., 1990). The basic procedure is to quickly inhale and then hold a forced exhalation
against a closed glottis for a period of approximately 3 seconds. Next, the pilot releases
the forced exhalation as quickly as possible and repeats. Performing Valsalva maneuvers
at a rate that is greater than every 3 seconds will cause hyperventilation. The increased
concentration of oxygen in the arteries causes the vessels to dilate, which further
exacerbates the loss of eye level blood pressure. Likewise, performing the maneuver at a
frequency that is less than every 3 seconds will cause an overall reduction of oxygen in
the blood. Of course, this accelerates the onset of cerebral ischemia and increases the
risk of a loss of consciousness event. Performed properly, the Valsalva maneuver
increases intrathoracic pressure leading to increased systolic blood pressure (Jennings, et
al., 1990).
In addition to the Valsalva maneuver, the anti-G straining maneuver is accompanied
by isometric contraction of the major muscle groups in the legs, arms, and abdomen.

69
This contraction helps force blood pooling in the lower extremities back to the heart,
similar to the standard G-suit. Although effective in short durations, this constant
contraction is physically demanding and eventually succumbs to muscle fatigue and loses
its potency.
Phillips (2000) asserts that human/operational environment (HOE) subsystem
elements will alter the magnitude and/or timing of certain control elements or parameters,
which translate into the magnitude of gain elements or time delay durations in the system
transfer function. Similar to the isometric control system with fatigue described by
Phillips (2000), the influence of the G-suit and anti-G straining maneuver was
implemented using an equation describing the “effective Gz” on the human body that
asymptotically declines over time. For example, if the standard G-suit provides +1 Gz of
protection, and the Gz at time “t” is +5 Gz, the “effective G” on the human operator is
only +4 Gz. Taken together with the anti-G straining maneuver, the current G
countermeasures provide approximately +4 Gz of additional protection. Given that both
the effectiveness of the straining maneuver and the G-suit degrade substantially over
time, the “effective G” equation was designed to decrease in magnitude as time
progressed. This effect was modeled with element G5 and defined by equation 11.
2
'sin168.032.0'
tGz (Equation 11)
Substituting Gz’ into equations 7 yields the following:

70
eyez htGtP
)(')( (Equation 12)
This augmented pressure gradient value is then fed into equation 9 and 10 to yield the
required pressure now denoted as 'RP
.
Analogous to the isometric control model developed by Phillips (2000), element G4
represents a model component that generates a normalized time (t’) in relation to the total
time to fatigue (TF) for the human operator and the time to failure of the G-suit (TF). The
equation for this element was developed by Phillips (2000) and can be found in equation
13. For this modeling effort, TF was set to 55 seconds.
m
jF
jT
tt
1
' (Equation 13)
Element G1 provides the proportional control equation that is driven by the signal
error between the required heart-level systolic pressure to maintain the 1 Gz eye level
blood pressure and the current systolic heart-level blood pressure (Pe). Governing heart
rate control function is displayed in equation 14 where HRi denotes the initial heart rate.
Here, the value was set to 70 beats/min.
ie HRPHR 5 (Equation 14)

71
The second major contributing factor to blood pressure was the stroke volume (SV)
defined in element G2. As previously stated, this parameter is highly influenced by the
blood return to the heart and hence indirectly dependent on the effectiveness of the G-suit
and anti-G straining maneuver. These are contained within the “effective G” equation
(element G6) that feeds the error signal (Pe). Therefore, the error signal again drives the
SV element defined by equation 15, where SVi is the initial value for the stroke volume
set at a value of 82.6 ml.
ei PSVSV 4 (Equation 15)
The final controller block is element G3 that generates the peripheral vascular
resistance (R) for the system model. As the eye-level blood pressure decreases due to the
increased apparent weight of the blood caused by positive Gz acceleration, the
cardiovascular system responds by initiating vasoconstriction of the blood vessels. The
reduction in blood vessel diameter causes a subsequent increase in blood pressure to
counteract the increasing inertial forces. Equation 16 defines the relationship between
the pressure error signal (Pe) and the peripheral resistance where Ri denotes the initial
value at +1 Gz (2.0 Pa*min/ml).
ei PRR 2.0 (Equation 16)
Control blocks G1, G2, and G3 provide direct input into element Kp (plant) which
defines the systolic blood pressure at the heart level. This is simply the product of the

72
three variables HR, SV, and R (equation 17). For the feedback loop, the pressure is
normalized by dividing the value at time “t” by the maximum blood pressure value
(equation 18).
RSVHRP (Equation 17)
max
'P
PP (Equation 18)
The pressure at the eye level is then calculated using equation 19.
tPPPeye
' (Equation 19)
Beginning with the feedback loop from P’ to the summation block, the remaining
mathematical relationships were defined using equations defined by Phillips (2000).
First, the difference between the normalized systolic blood pressure from the system
output and the normalized required blood pressure to maintain adequate eye-level blood
pressure was defined by equation 20,
'' PPP R (Equation 20)
where PR’ was quantified by equation 21:

73
max
'R
RR
P
PP (Equation 21)
The feedback pressure (Pf) is then written as:
n
i
i
f
f dtPT
P1
1 (Equation 22)
n
i
iff dtPP1
(Equation 23)
Where αP is the reciprocal time constant of the pressure feedback via baroreceptor and
mechanoreceptor output (see equation 24).
f
PT
1 (Equation 24)
Finally, the normalized total error signal (Pe’) was then calculated using equation 25.
fRe PPP '' (Equation 25)

74
5.4 Human Information Processing Model
Development of HIPDE Cognitive
Task Battery
Development of NTI, Inc G-TOP Cognitive Performance Model
HIPDE Experiments conducted by AFRL
Development of Cardiovascular
Model
Development of rSO2
Model
Development of Cognitive
Performance Model
Model Validation
Previous Work
Current Work
With the cardiovascular parameters defined, it is possible to derive the relative
regional oxygen saturation in the major brain areas of interest. As described in section
3.1, relative heights between the eye-level reference and the brain structure were
calculated using Harvard University’s online Brain Atlas (Johnson and Becker, 1999).
Pascal’s Law (Eqn. 6) was then used to define the relative drop or rise in blood pressure
due to gravity over the given change in height. Because oxygen is ferried throughout the
body by red blood cells within the blood stream, the relative oxygen saturation of the
cortical and subcortical tissue will by tied directly to the amount of blood flow to the
upper extremities. The ability of red blood cells to reach critical areas of the brain is
dependent on the heart’s ability to generate sufficient blood pressure to overcome the
inertial force generated by increasing Gz acceleration. As such, new model elements

75
were added to describe this relationship mathematically. The final model diagram is
presented in figure 11.
+
+
+ _
G1
s
P
G2
G3
'RP
KP
(Controller) (Plant)
'eP
'P
fP
'P
'
HR
G4
G5
'
SV
'
R
zG
G6'zG
iP
KO
G7
jD
jP
KC
G8
jM
M
CP
Figure 11. Human Information Processing Model Block Diagram
The first additional block is element G7, which requires the relative distance
measurement (Dj) from the eye point to brain structure j. G7 uses this distance to then
calculate the pressure difference between the eye level and the brain structure of interest
using the following equation, where the letter j references the brain structure.
jj htgtP )()( (Equation 26)
Therefore, the pressure at the jth
brain structure was defined as equation 27.

76
)(tPPP jeyej (Equation 27)
With the blood pressure defined in each relative brain area, it was possible to describe its
relationship with relative oxygen saturation (element KO). By investigating cerebral
oxygen saturation data (rSO2) from subject 1 in the “peripheral information processing”
experiment described by McKinley, et al. (2008), the relative oxygen saturation equation
was derived. A corresponding data set from the “rapid decision making” experiment also
described by McKinley et al. (2008) was used to validate the equation (shown below).
539.8700115.0)(2 jPjrSO (Equation 28)

77
Development of HIPDE Cognitive
Task Battery
Development of NTI, Inc G-TOP Cognitive Performance Model
HIPDE Experiments conducted by AFRL
Development of Cardiovascular
Model
Development of rSO2
Model
Development of Cognitive
Performance Model
Model Validation
Previous Work
Current Work
To accurately predict the relative change in neural activity in any given brain area, it
was important to also consider the basal metabolic rate. Metabolism varies locally across
the brain and depends upon complexity and level of activity at rest. Regional metabolic
rates of glucose were obtained from Volcow et al., (2001) and Bassant, Jazat-
Poindessous, and Lamour, (1996). Because the brain uses aerobic metabolic processes
almost exclusively to generate necessary energy, equation 29 was used to calculate the
relative change in neural metabolism based on oxygen content (element G8). Here, Mji
refers to the initial basal metabolic rate of glucose of brain area j.
100
1001 2 jrSO
MM jij (Equation 29)
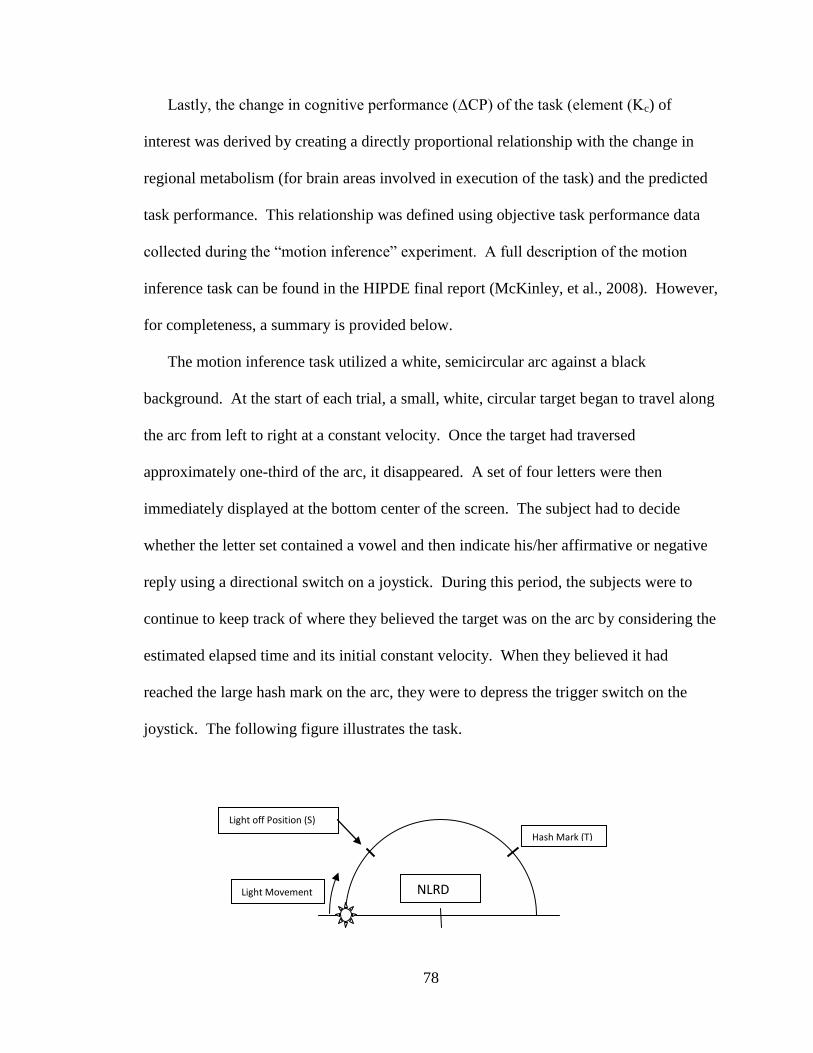
78
Lastly, the change in cognitive performance (ΔCP) of the task (element (Kc) of
interest was derived by creating a directly proportional relationship with the change in
regional metabolism (for brain areas involved in execution of the task) and the predicted
task performance. This relationship was defined using objective task performance data
collected during the “motion inference” experiment. A full description of the motion
inference task can be found in the HIPDE final report (McKinley, et al., 2008). However,
for completeness, a summary is provided below.
The motion inference task utilized a white, semicircular arc against a black
background. At the start of each trial, a small, white, circular target began to travel along
the arc from left to right at a constant velocity. Once the target had traversed
approximately one-third of the arc, it disappeared. A set of four letters were then
immediately displayed at the bottom center of the screen. The subject had to decide
whether the letter set contained a vowel and then indicate his/her affirmative or negative
reply using a directional switch on a joystick. During this period, the subjects were to
continue to keep track of where they believed the target was on the arc by considering the
estimated elapsed time and its initial constant velocity. When they believed it had
reached the large hash mark on the arc, they were to depress the trigger switch on the
joystick. The following figure illustrates the task.
Light off Position (S)
Light Movement
Hash Mark (T)
NLRD

79
Figure 12: Sketch of Motion Inference Task (Butcher, 2007)
The purpose of the analysis performed on the motion inference task data in the
HIPDE report was to determine whether the subjects were significantly early or late in
their estimation of time. Therefore, each data point describing the amount of error
between the location of the target hash mark and the location the subject actually stopped
the circular target were given a positive or negative sign: positive indicated an early
estimation, while late indicated a late response. However, the purpose of this effort is to
describe the human performance changes during +Gz acceleration. Hence, the magnitude
of the error (whether early or late) was desired for the analyses. Therefore, the absolute
value of each error data point was calculated and then compared to the average error
value calculated from the baseline (1 Gz) data. The percent change from baseline was
then calculated for each data point and averaged across subjects and days.
The averaged data from the 7G and 3G 15-sec plateau profiles were then used to
build the proportional equation used in element KC. Equation 30 provided the change in
metabolic rate for brain region j based on the change in regional oxygen saturation and
region specific metabolic rate. The resulting cognitive performance (CP) can then be
calculated using equation 31.
100
100 2 jrSOMM jij (Equation 30)
11.101483.18 jj MCP (Equation 31)

80
Equation 31 was then verified using data from the 5G plateau and 7G SACM profiles.
Validation of the model was completed using data from a completely different HIPDE
experiment entitled “precision timing.” A brief description of the task for the precision
timing experiment is provided below.
As in the motion inference design, the precision timig task included a white
semicircular arc set against a white background. At the start of each trial, a small, white
circular target began to travel along the arc from left to right at a constant velocity (the
velocity varied between trials). The subject was instructed to stop the target when it
reached the large hash mark by depressing the trigger button on the joystick. An
illustration of the task is provided in figure 13.
Light Movement
Hash Mark (T)
Figure 13: Sketch of the Precision Timing Task (Butcher, 2007)
As in the motion inference experiment, the positional error metric was assigned a
positive sign (late response) or negative sign (early response). To determine the percent
change from baseline performance irrespective of direction, the absolute value was
computed for each data point. The data were then averaged across subjects and days for
comparison with the model predictions.

81
5.5 Model Verification and Analysis
Model predictions were verified and validated using data sets from the Human
Information Processing in Dynamic Environment (HIPDE) program sponsored by the
United States Air Force. This series of 12 experiments provided both rSO2 and objective
task performance data, but did not offer cardiovascular parameters such as heart rate or
blood pressure to verify the accuracy of the cardiovascular model. However, the cardiac
values were compared to those from other studies (Grygoryan, 1999; Jennings, et al.,
1990; Tripp, et al., 1994) to verify the range of values was reasonable and accurate for
the Gz levels applied.
The model was developed using part of the data set from the “motion inference”
HIPDE experiment and then compared to data from the “precision timing” experiment.
Model accuracy was quantified using the “agreement” approach described by Griffin,
(2001). This methodology is founded on the principle that high correlation (values
approaching 1) between two data sets is insufficient to prove a model’s accuracy when
validating with measured data. The author states that two data sets can have perfect
correlation when the values of one set are exactly half the values of the other set. As a
result, additional metrics are necessary to ensure predicted values are representative of
measured values. First, Griffin (2001) described the necessity of plotting all the values
with the measured values on the ordinate axis and the predicted values on the abscissa.
In this way, one can plot the linear best-fit trend and record the slope. A slope close to
one indicates high agreement between the two data sets. Lastly, Griffin states that the
mean percent error between measured and predicted values should be relatively low. All

82
three metrics (correlation coefficient, linear best-fit slope, and mean percent error) were
used to quantify agreement.
5.6 Software and User Interface
The programming development environment chosen to program the model was
Microsoft Visual Basic.Net. The language syntax is straightforward but similar to Visual
C, and permits development of windows-based graphical user interfaces with simple
drag-and-drop operations. The figure below provides a screenshot of the computational
model’s main program window immediately visible upon execution of the software.
Figure 14. Main Window of the Graphical User Interface (GUI)
The program provides a pull-down menu labeled “File” in the top left corner of the
window. Included within this menu are four possible selections. Figure 15 provides a
screenshot of the menu options.

83
Figure 15. Main Window with Option Menu Displayed
The “Open Gz File” option allows the user to browse through the computer directory and
select a text file (.txt extension) that contains the time series of the Gz acceleration
profile. The proper format of the Gz input data is a total of two columns. The first
includes time data in units of seconds while the second provides the corresponding
acceleration data in units of multiples of acceleration due to gravity (G). The “Save
Model Output As” selection provides the ability to save the model prediction data to a
file name and location of the user’s choosing. The “Run Model” option is self-
explanatory and uses the selected Gz input data to calculate all model outputs. The
resulting data immediately prints to the output file. Finally, the “Exit” option simply
closes the program. The source code of the program can be found in Appendix A.

84
5.7 Methods and Results of HIPDE Experiments
Development of HIPDE Cognitive
Task Battery
Development of NTI, Inc G-TOP Cognitive Performance Model
HIPDE Experiments conducted by AFRL
Development of Cardiovascular
Model
Development of rSO2
Model
Development of Cognitive
Performance Model
Model Validation
Previous Work
Current Work
A complete description of the 12 performance tasks and data collection methods from
the HIPDE program are provided in the technical report published by McKinley and
colleagues (2008). However, for completeness, a brief overview of of the method is
provided in the following sections. It is the data from two of these previous experiments
that is used to develop and validate the cognitive performance model.
5.7.1 Equipment
Acceleration stress was generated using the man-rated human centrifuge located at
Wright-Patterson Air Force Base, OH. Often referred to as the Dynamic Environment
Simulator (DES) because of its multi-axis control and immersive visual display, the
device was fitted with a 19-ft radius arm radius and weighed approximately 180 tons.

85
Although capable of reaching and sustaining accelerations of up to 20 G in either x, y, or
z independent axes, it rarely accelerated past 9 G due to the limitations of existing aircraft
and human physiology. The gearing and drive motor horsepower limited the DES to a
maximum G onset and offset rate of approximately 1 G/sec. A photograph of the exterior
can be found in figure 16 below.
Figure 16. Exterior photograph of the Dynamic Environment Simulator, Wright-Patterson AFB, OH
(McKinley, et al., 2008)
Within the cab or gondola was a modern F-22-like ACES II ejection seat with a
seatback reclined to 15o from vertical complete with a 6-ft diameter hemispherical dome
visual display. Images were projected onto the dome using a projection system
developed by Elumens ® equipped with a “fish-eye” lens providing 180o by
approximately 120o field of view. Subjects were secured in the seat with a standard flight
harness connected to adjustable lap and shoulder restraints. A Thrustmaster HOTAS
Cougar control stick and throttle stick (Guillemot, Montreal, Canada) were used to secure

86
subject responses to each of the performance tasks. An illustration of the interior
displays, seat, and restraint system can be found in figure 17.
Figure 17. Illustration of ACES II Ejection Seat with Hotas Thrustmaster Flight Stick and Throttle with Dome
Visual Display (McKinley, et al., 2008)
The test director, medical monitor, and principal investigator could communicate with
the subject via an aircraft IC-10 two-way communication system. Although originally
designed as a “push-to-talk” system, the subject’s microphone switch was altered to be
“on” permanently to provide hands-free communication with the research staff. In
addition, an emergency stop switch was given to the research participants that enabled
them to stop the centrifuge at any time during testing. All subjects wore a standard Air
Force issue Nomex® flight suit, flight boots, and a standard G-suit during testing and
training.
Subject monitoring was accomplished with the aid of two closed-circuit infrared
television cameras mounted inside the centrifuge cab. The first was positioned to provide
a view of the subject’s face and head while the second was used to offer a wide-angle
view of the participant from head-to-foot from behind their right shoulder. All research

87
staff including the medical monitor, test director, principal investigator, pit operator, and
machine operator were provided with these views to monitor the subject. Using a four-
screen video mixer, both views of the participant, the performance task screen, and a
panel that generated the time, date, Gz acceleration time history for a given run were
recorded on ½ inch VHS videotape.
5.7.2 Acceleration Profiles
Although closed-loop control (controlled via subject control inputs) of the
acceleration generated by the centrifuge affords greater sense of realism, it also produces
such a high degree of variability that meaningful statistical analyses are nearly
impossible. As a result, each Gz exposure was run in “open-loop” format whereby a
computer ran a series of four pre-programmed Gz acceleration profiles. To overcome the
immense inertia of the centrifuge and reduce the Coriolis Effect on the research
participants, all Gz exposures began from a steady-state acceleration of 1.5 Gz. To reduce
safety risks to the subject, the profiles were always run in the same order of increasing
difficulty starting with three 15-second single-peak profiles to 3, 5, and 7 Gz,
respectively. The fourth and final profile was a simulated aerial combat maneuver
(SACM) that consisted of two 5-sec peaks at 7 Gz, 3 peaks at 5 Gz, and 5 peaks at 3 Gz.
Subjects were afforded a minimum of a one-minute rest period between each exposure.
The complete daily acceleration run schedule can be found in Figure 18.

88
HIPDE Gz Profiles
0
1
2
3
4
5
6
7
8
0 100 200 300 400
Time (s)
Ac
cele
rati
on
Gz
Figure 18. Daily Gz exposure schedule (McKinley, et al., 2008)
5.7.3 Stimuli
A total of 11 cognitive tests were administered in separate experiments over the
course of the HIPDE program. These included perception of relative motion, precision
timing, motion inference, pitch-roll capture, peripheral vision, rapid decision making,
gunsight tracking, situation awareness, unusual attitude recovery, short term memory, and
visual monitoring. As previously stated, the basic flying skills task was not utilized
because the task was inherent to several others tasks in that they required piloting ability.
These included situation awareness, unusual attitude recovery, gunsight tracking, short
term memory, and visual monitoring. The remaining tasks were abstract in nature and
did not involve a flight simulation. A complete description of each task can be found in
the technical report by McKinley and colleagues (2008).
5.7.4 Training Procedures
To ensure that training effects would not confound the performance results during
acceleration exposures, all subjects were extensively trained both statically and

89
dynamically. First, to familiarize each subject with the task instructions and procedures,
each participant was required to complete several training sessions in a static (motionless)
flight simulator complete with a visual screen and seat similar to that found in the DES
cab. Task performance was recorded each session and then compared between training
days. Subjects were considered trained once their objective performance metrics reached
a plateau evidenced by a deviation of less that 10% between training days.
Because the centrifuge introduced dynamic accelerations that could produce motor
function artifacts that ultimately affect performance, each subject was also required to
perform dynamic training in the centrifuge prior to the experimental runs. Here, the
subject performed the cognitive task during acceleration profiles that were identical to
those used in experimental sessions. Each Gz exposure was completed only once per day.
Again, subjects were considered trained once their performance varied less than 10%
between training days.
5.7.5 Procedures
Upon completion of training, participants were scheduled for 3 separate data
collection sessions that were separated by a minimum of 24 hours. After arriving at the
DES facilities, they put on both a flight suit and standard anti-G suit. The medical
technician then instrumented each subject with 3 electrocardiogram (ECG) leads and
recorded their vitals including resting heart rate and blood pressure. Next, the flight
surgeon reviewed the subject’s medical history, vitals, recent activity and rest cycle, and
performed a brief medical examination. Provided the flight surgeon did not discover any
conditions precluding participation, the participant then continued to the DES centrifuge
where floor controllers provided the subject with an appropriately sized parachute

90
harness. One of the floor controllers then secured the subject in the DES gondola’s
ACES II aircraft seat using the 3-point aircraft restraint system. Next, the ECG leads
were connected to the amplifier and the signal was verified on the medical monitor’s
display console. Afterwards, the principal investigator began baseline data collection for
the performance task in the given experiment. Once complete, the subject was exposed
to each of the 4 Gz profiles in the order of 3 Gz, 5 Gz, 7 Gz 15 s plateaus followed by the 7
Gz SACM. A minimum of 1 minute of rest was given between each Gz exposure to allow
the participant to recover. If needed, the rest period was extended to the point at which
the subject and medical monitor agreed he/she was ready for the next profile. Once all 4
Gz exposures were completed, the floor controllers entered the gondola and helped the
participant egress the centrifuge. The flight surgeon then performed a brief medical
examination of the subject before released him/her to return to normal duties.
5.7.6 Data Analysis
Although data analysis techniques differed between tasks, in general performance
metrics were converted into a percent change from the mean baseline value to normalize
the data across subjects. Repeated measures analyses of variance (ANOVA) were
performed with the mean percent change from baseline for each subject as the dependent
variable. Post hoc tests included the Bonferroni pairwise comparison test or simple two-
tailed t-tests using the subject means (no pooling) to determine whether the measured
change from baseline was significantly different from 0.

91
5.7.7 Results
A complete detailed description of the experimental results from each study can be
found in the HIPDE tech report (McKinley, et al., 2008). In summary, significant
decrements in objective performance were discovered for the tracking, relative motion,
motion inference, peripheral information processing, and short term memory tasks.
Although not significant at the 95% confidence level, performance metrics on the unusual
attitude recovery task approached significance. It also appeared that the central tendency
of the data was to increase with increasing Gz stress. Therefore, to provide a conservative
estimate of performance, this central tendency should be included in the final model.
The performance data was then weighted according to the scale provided in NTI’s T-
matrix. Agreement between the measured weighted values and look-up table values
defined by NTI, Inc. from existing data in the literature was then calculated according to
the procedures described in Griffin (2001). Because there were many missing data in the
look-up tables, NTI, Inc. was forced to utilize linear extrapolations to fill the gaps. Using
performance data from the low end of the acceleration continuum to predict performance
at the other end of the spectra and assuming a linear trend can be problematic (McKinley,
et al., 2008). Specifically, human dynamics are almost always nonlinear and prediction
accuracy decreases rapidly as the value becomes farther removed from the last measured
point. This was verified by the fact that look-up table values derived from studies that
explored performance at +5 Gz or higher had much greater agreement with the measured
data from the HIPDE experiments. Additionally, many of the tasks used in the literature
did not match well with explicit cognitive skills. Not surprisingly, many of the cognitive

92
abilities showed poor agreement with the measured data. The best agreement was found
for the perceptual speed, tracking, and fast motion inference abilities.

93
6.0 RESULTS
The development and validation of biodynamic modeling equations and relationships
can be accomplished using several different methodologies. The original method
proposed for this effort (referred to in this paper as “Technique 1”) was the process used
and described by McKinley, et al., (2005a), McKinley, et al., (2005b), and McKinley et
al., (2005c). Each of these three studies used a portion (25-50%) of the measured
performance data averaged across subjects and days to derive the underlying
mathematical equations and logical statements (e.g. “fuzzy logic”). The remaining data
was then used to validate the model predictions. Although this method is strengthened by
the fact that both the data to build the model and the data used in validation were
collected under exactly the same conditions and therefore inherently contain fewer
sources of error and confounds, the fact remains that because the data come from the

94
same experiment, it is a much less robust method for testing the quality and validity of
the model predictions. Essentially, the model is making predictions based on data on
which it was derived.
Because the each of the data sets within the set of HIPDE experiments contain
multiple acceleration conditions, an alternative to the previously described technique is to
use the data collected during a subset of acceleration profiles and then use the data from
the remaining profiles in the validation (referred to as “Technique 2”). Although all the
data still come from the same experiment, this method holds the advantage that none of
the data used in validation were also used in the derivation of the model algorithms.
Hence, it is possible to “bound” the model’s equations using the upper and lower
acceleration extremes to build the model, and then verify that the model predictions are
accurate for the profiles that lie in between.
A third method (“Technique 3”) is one that is traditionally used in model validation
and provides a highly robust test of model validity. This method employs objective data
from one experiment and then validates the model predictions by comparing them to data
collected during a completely different experiment under similar or identical settings.
Because the data used in model development and model validation are completely
dissociated, the investigator can be confident that the results are repeatable and the model
is valid within these tested limits.
Because of the relative shortcomings of the originally proposed model validation
technique as described by McKinley, et al., (2005a), McKinley, et al., (2005b), and
McKinley et al., (2005c), an alternative methodology was required to ensure the model
provided a scientifically sound foundation for possible future functional expansions to

95
predictions of additional human cognitive performance tasks. As a result, both the
second and third techniques described above were used in the analysis of various portions
of this model. First, because the regional cerebral oxygen saturation (rSO2) data were
collected during two completely separate HIPDE experiments, validation of the rSO2
predictions could be completed using “Technique 3.” Both experiments used the exact
same acceleration conditions, but used different subjects. Hence, the model was
developed using data from one experiment and subsequently validated with rSO2 data
from the other. Results of this validation are provided in section 6.1.
This effort focused on the model development, prediction, and model of two specific
tasks studied in the HIPDE program to develop a validated and tested methodology of
predicting human cognitive performance using predictions of human physiology.
Specifically, the two tasks were “motion inference” and “precision timing.” The theory
was that human cognitive performance would be directly proportional to the metabolism
(as derived by regional oxygen saturation) in the brain areas active during execution of
the task. However, the constants of this linear relationship (slope and y-intercept) were
not known. As a result, validation of the task performance predictions was accomplished
using a two-step hybrid of techniques 2 and 3.
First, the mathematical relationship between regional brain metabolism and cognitive
performance was derived using technique 2. Here, the objective task performance data
collected during the 3G and 7G plateau acceleration profiles were used to “bound” the
equation and derive the linear relationship (see equation 31 in section 5.3). The model
was then verified using data collected during both the 5G plateau and 7G SACM profiles
within the same experiment. Results of this comparison are found in section 6.2.

96
Second, a complete and rigorous validation of this same model was performed using
data from the precision timing experiment. Maintaining the same equations and
constants, model predictions were compared to objective task performance data from all
four acceleration profiles in the precision timing study. The difference here was that the
cerebellum was the primary active brain area, whereas the dorsolateral prefrontal cortex
(DLPFC) was primarily active in the motion inference study. Given the cerebellum is
located ventrally from the DLPFC (higher blood pressure and rSO2) and has a lower
metabolic rate, model predictions of the resulting task performance were substantially
higher than those for the motion inference task. The results of this analysis are provided
in section 6.3.
6.1 Regional Cerebral Oxygen Saturation
Model predictions were compared to objective data gathered in the 12 experiments
completed in support of the HIPDE program. Only two of these experiments utilized the
INVOS 4100 cerebral oximeter to collect regional cerebral oxygen saturation (rSO2) data
(McKinley, et al., 2008). As a result, the rSO2 prediction algorithm defined in the
previous section was developed using data from one subject in the “peripheral
information processing” experiment and then validated using the data set from a separate
HIPDE study that tested “rapid decision making.” Plots of the rSO2 predictions from the
model (output of element KO) and the measured data averaged across subjects for each Gz
profile can be found in figures 19-22.

97
0
1
2
3
4
5
6
7
8
80
85
90
95
100
105
0 5 10 15 20 25 30
Acc
ele
rati
on
(Gz)
rSO
2 %
Ch
ange
fro
m B
ase
lin
e
Time (sec)
Measured rSO2
Predicted rSO2
Gz
Figure 19. Measured and Predicted rSO2 during 3 Gz Plateau
0
1
2
3
4
5
6
7
8
80
85
90
95
100
105
0 5 10 15 20 25 30 35
Acc
ele
rati
on
(G
z)
rSO
2 %
Ch
ange
fro
m B
ase
line
Time (sec)
Measured rSO2 (Ave)
Predicted rSO2
Gz
Figure 20. Measured and Predicted rSO2 during 5 Gz Plateau

98
0
1
2
3
4
5
6
7
8
80
85
90
95
100
105
0 10 20 30 40 50
Acc
ele
rati
on
(G
z)
rSO
2 %
Ch
ange
fro
m B
ase
line
Time (sec)
Measured rSO2 (Ave)
Predicted rSO2
Gz
Figure 21. Measured and Predicted rSO2 during 7 Gz Plateau
-10
-8
-6
-4
-2
0
2
4
6
8
10
80
85
90
95
100
105
0 20 40 60 80 100 120
Acc
ele
rati
on
(Gz)
rSO
2 %
Ch
ange
fro
m B
ase
lin
e
Time (sec)
Measured rSO2 (Ave)
Predicted rSO2
Gz
Figure 22. Measured and Predicted rSO2 during 7 Gz SACM

99
Agreement between the model predictions and the measured data was performed
using metrics described by Griffin (2001). The correlation coefficients, linear best-fit
slope (on a plot of measured versus predicted values), and mean percent error between
measured and predicted rSO2 values are provided in table 3. Correlation coefficients for
all data sets were determined using equation 32, where X and Y are the predicted and
measured data sets.
22,
yyxx
yyxxYXCorr (Equation 28)
Table 3. rSO2 Model Agreement Metrics
Gz Profile Corr. Coeff. Linear Best Fit Slope Mean % Error
3G 0.8687 0.5760 0.75
5G 0.8803 0.7099 1.42
7G 0.7483 0.8191 3.33
7G SACM 0.8637 0.9484 2.73
Figures 23-26 provide the plotted measured versus predicted rSO2 values. All rSO2
data (measured and predicted) are percentage change from baseline (1 Gz) measurements.
Measured data were averaged across subjects and days for each Gz profile. Included in
each plot are the linear best-fit trend line accompanied by the linear equation.

100
y = 0.5761x + 42.006
80
85
90
95
100
105
80 85 90 95 100 105
Pre
dic
ted
rSO
2 %
Ch
ange
fr
om
Bas
lein
e
Measured rSO2 % Change from Baseline
Figure 23. Measured vs. Predicted rSO2 Values (3 Gz Plateau)
y = 0.7099x + 28.931
80
85
90
95
100
105
80 85 90 95 100 105
Pre
dic
ted
rSO
2 %
Ch
ange
fr
om
Bas
lein
e
Measured rSO2 % Change from Baseline
Figure 24. Measured vs. Predicted rSO2 Values (5 Gz Plateau)

101
y = 0.8191x + 19.969
80
85
90
95
100
105
80 85 90 95 100 105
Pre
dic
ted
rSO
2 %
Ch
ange
fr
om
Bas
lein
e
Measured rSO2 % Change from Baseline
Figure 25. Measured vs. Predicted rSO2 Values (7 Gz Plateau)
y = 0.9484x + 6.8893
80
85
90
95
100
105
80 85 90 95 100 105
Pre
dic
ted
rSO
2 %
Ch
ange
fr
om
Bas
lein
e
Measured rSO2 % Change from Baseline
Figure 26. Measured vs. Predicted rSO2 Values (7 Gz SACM)

102
6.2 Motion Inference Performance
Objective task performance data collected during the “motion inference” task
averaged across subjects and days were compared to model predictions of human motion
inference performance. Position distance between the target hash mark and the actual
location the target was stopped by the subject was measured with angle of the
semicircular arc. All data indicate a percentage change from baseline (1 Gz) performance
where “100” was defined as baseline. Figures 27-30 display the predicted and measured
values for each profile (3G, 5G, 7G plateaus and the 7G SACM). Data from the 3G and
7G profiles were used to build the model. The 5G and 7G SACM data were then
employed in model verification.
0
1
2
3
4
5
6
7
8
0
20
40
60
80
100
120
140
160
0 10 20 30 40A
cce
lera
tio
n (
Gz)
An
gle
Err
or
Pe
rce
nta
ge C
han
ge f
rom
B
ase
line
Time (sec)
Measured Performance Predicted Performance
Acceleration (Gz)
Figure 27. Motion Inference Predicted vs. Measured Performance (3G Plateau)

103
0
1
2
3
4
5
6
7
8
0
20
40
60
80
100
120
140
160
0 10 20 30 40 50
Acc
ele
rati
on
(G
z)
An
gle
Err
or
Pe
rce
nta
ge C
han
ge f
rom
B
ase
line
Time (sec)
Measured Performance Predicted Performance
Acceleration (Gz)
Figure 28. Motion Inference Predicted vs. Measured Performance (5G Plateau)
0
1
2
3
4
5
6
7
8
0
20
40
60
80
100
120
140
160
0 10 20 30 40 50 60A
cce
lera
tio
n (
Gz)
An
gle
Err
or
Pe
rce
nta
ge C
han
ge f
rom
B
ase
line
Time (sec)
Measured Performance Predicted Performance
Acceleration (Gz)
Figure 29. Motion Inference Predicted vs. Measured Performance (7G Plateau)

104
0
1
2
3
4
5
6
7
8
0
20
40
60
80
100
120
140
160
0 50 100 150 200
Acc
ele
rati
on
(G
z)
An
gel E
rro
r P
erc
en
tage
Ch
ange
fro
m
Bas
elin
e
Time (sec)
Measured Performance Predicted Performance
Acceleration (Gz)
Figure 30. Motion Inference Predicted vs. Measured Performance (7G SACM)
The plot of the 5G profile data contains an extremely high change from baseline
performance at the end of the run. It is thought that this is an artifact caused by the
subjects prematurely arresting performance of the task believing that data collection was
over once they felt the induced acceleration had returned to baseline levels. This
phenomena was previously noted by McKinley, et al., (2008) and McKinley, et al.,
(2005b). As a result, agreement calculations were completed for the 5G profile with and
without this data point. The results of all four analyses between the measured and
predicted values can be found in table 4.
Table 4. Motion Inference Model Agreement Metrics
Gz Profile Corr. Coeff. Linear Best Fit Slope Mean % Error
3G 0.7103 0.5494 6.35
5G (with final point) 0.6019 0.4324 26.92 5G (w/o final point) 0.9451 0.8206 12.88
7G 0.8827 0.9144 17.11
7G SACM 0.8253 0.7416 38.21

105
Figures 31-35 provide the plotted measured versus predicted motion inference angle
error values. As before, all data are calculated percentage change from baseline (1 Gz)
performance. Measured data were averaged across subjects and days. Included in each
plot are the linear best-fit trend line accompanied by the linear equation.
y = 0.5494x + 41.846
0
20
40
60
80
100
120
0 20 40 60 80 100 120 140
Pre
dic
ted
An
gle
Err
or
Pe
rce
nta
ge
Ch
ange
fro
m B
ase
line
Measured Angle Error Percentage Change from Baseline
Figure 31. Measured vs. Predicted Motion Inference Angle Error Values (3 Gz Plateau)
y = 0.4324x + 45.994
0
20
40
60
80
100
120
0 20 40 60 80 100 120 140
Pre
dic
ted
An
gle
Err
or
Pe
rce
nta
ge
Ch
ange
fro
m B
ase
line
Measured Angle Error Percentage Change from Baseline
Figure 32. Measured vs. Predicted Motion Inference Angle Error Values (5 Gz Plateau with Final Data Point
Included)

106
y = 0.8206x + 6.1821
0
20
40
60
80
100
120
0 20 40 60 80 100 120 140
Pre
dic
ted
An
gle
Err
or
Pe
rce
nta
ge
Ch
ange
fro
m B
ase
line
Measured Angle Error Percentage Change from Baseline
Figure 33. Measured vs. Predicted Motion Inference Angle Error Values (5 Gz Plateau without Final Data Point
Included)
y = 0.9144x + 5.505
0
20
40
60
80
100
120
0 20 40 60 80 100 120 140
Pre
dic
ted
An
gle
Err
or
Pe
rce
nta
ge
Ch
ange
fro
m B
ase
line
Measured Angle Error Percentage Change from Baseline
Figure 34. Measured vs. Predicted Motion Inference Angle Error Values (7 Gz Plateau)

107
y = 0.7416x + 10.934
0
20
40
60
80
100
120
0 20 40 60 80 100 120 140 160
Pre
dic
ted
An
gle
Err
or
Pe
rce
nta
ge
Ch
ange
fro
m B
ase
line
Measured Angle Error Percentage Change from Baseline
Figure 35. Measured vs. Predicted Motion Inference Angle Error Values (7 Gz SACM)
6.3 Precision Timing Performance
Data from the precision timing task collected during the HIPDE program were used
to validate the model predictions. Because the inherent visual structures and functions in
both tasks were nearly identical, many of the associtated active brain areas were identical
(e.g. primary visual cortex (V1), medial temporal (MT/V5), etc.). However, because the
each precision timing task trial occurred over short time durations and the target
remained visible throughout the trial, the task could be accomplished using the body’s
internal clock within the cerebellum. The motion inference task required short-term
memory to track the target circle as it was not visible during the majority of the trial. In
addition, the motion inference task required more than 5 seconds to perform each trial,
which further indicated short-term memory would be required. As a result, the
cerebellum could not perform precise perception of elapsed time. Instead, the brain
would require the assistance of the dorsolateral prefrontal cortex, which is highly active

108
during short-term retention of visual information (Nichelli, et al., 1996). As a result, the
primary brain structure that differed between the two tasks was the cerebellum and
prefrontal cortex. The two structures have different metabolic rates and locations in the
brain, which altered the predicted rSO2 in each structure and the resulting task
performance predictions. However, the equations and contants in the model remained
unaltered.
Data were averaged across subjects and days for each acceleration profile and
compared to model predictions of precision timing performance. Position distance
between the target hash mark and the actual location the target was stopped by the subject
was measured with angle of the semicircular arc. All data indicate a percentage change
from baseline (1 Gz) performance where “100” was defined as baseline. Figures 36-39
display the predicted and measured percentage change from baseline performance values
for each profile (3G, 5G, 7G plateaus and the 7G SACM).
0
1
2
3
4
5
6
7
8
0
20
40
60
80
100
120
140
0 5 10 15 20 25 30 35
Acc
ele
rati
on
(G
z)
An
gle
Err
or
Pe
rce
nta
ge C
han
ge f
rom
B
ase
line
Time (sec)
Measured Performance Predicted Performance Acceleration (Gz)
Figure 36. Precision Timing Predicted vs. Measured Performance (3G Plateau)

109
0
1
2
3
4
5
6
7
8
0
20
40
60
80
100
120
140
0 10 20 30 40 50
Acc
ele
rati
on
(G
z)
An
gle
Err
or
Pe
rce
nta
ge C
han
ge f
rom
B
ase
line
Time (sec)
Measured Performance Predicted Performance Acceleration (Gz)
Figure 37. Precision Timing Predicted vs. Measured Performance (5G Plateau)
0
1
2
3
4
5
6
7
8
0
20
40
60
80
100
120
140
0 10 20 30 40 50
Acc
ele
rati
on
(G
z)
An
gle
Err
or
Pe
rce
nta
ge C
han
ge f
rom
B
ase
line
Time (sec)
Measured Performance Predicted Performance Acceleration (Gz)
Figure 38. Precision Timing Predicted vs. Measured Performance (7G Plateau)

110
0
1
2
3
4
5
6
7
8
0
20
40
60
80
100
120
140
0 50 100 150 200
Acc
ele
rati
on
(G
z)
An
gle
Err
or
Pe
rce
nta
ge C
han
ge f
rom
B
ase
line
Time (sec)
Measured Performance Predicted Performance Acceleration (Gz)
Figure 39. Precision Timing Predicted vs. Measured Performance (7G SACM)
As in the motion inference data set, the plot of the 5G profile data contains an
unusually high decrease from baseline performance at the final data point of the run. It
is hypothesized that some of the subjects began to stop performing the task when the Gz
was unloaded because they felt the run was over. This was previously noted in the the
HIPDE final report (McKinley, et al., 2008). Consequently, the agreement calculations
were again completed for the 5G profile with and without this final data point. The results
of all four analyses between the measured and predicted values can be found in table 5.
Table 5. Precision Timing Model Agreement Metrics
Gz Profile Corr. Coeff. Linear Best Fit Slope Mean % Error
3G 0.5321 0.2225 4.99
5G (with final point) 0.5172 0.5186 8.69 5G (w/o final point) 0.7676 0.5795 6.30
7G 0.9726 1.027 12.07
7G SACM 0.6856 0.8513 17.28

111
Figures 40-44 provide the plotted measured versus predicted precision timing angle
error values. All values are percentage change from baseline (1 Gz) performance where
“100” indicates baseline. Measured values were averaged across days and subjects for
each Gz profile. Included in each plot are the linear best-fit trend line accompanied by
the linear equation.
y = 0.2225x + 77.911
0
20
40
60
80
100
120
140
0 20 40 60 80 100 120 140
Pre
dic
ted
An
gle
Err
or
Pe
rce
nta
ge
Ch
ange
fro
m B
ase
line
Measured Angle Error Percentage Change from Baseline
Figure 40. Measured vs. Predicted Precision Timing Angle Error Values (3 Gz Plateau)

112
y = 0.5186x + 48.438
0
20
40
60
80
100
120
140
0 20 40 60 80 100 120 140
Pre
dic
ted
An
gle
Err
or
Pe
rce
nta
ge
Ch
ange
fro
m B
ase
line
Measured Angle Error Percentage Change from Baseline
Figure 41. Measured vs. Predicted Precision Timing Angle Error Values (5 Gz Plateau with Final Data Point
Included)
y = 0.5795x + 39.83
0
20
40
60
80
100
120
140
0 20 40 60 80 100 120 140
Pre
dic
ted
An
gle
Err
or
Pe
rce
nta
ge
Ch
ange
fro
m B
ase
line
Measured Angle Error Percentage Change from Baseline
Figure 42. Measured vs. Predicted Precision Timing Angle Error Values (5 Gz Plateau without Final Data Point
Included)

113
y = 1.0266x + 7.2614
0
20
40
60
80
100
120
140
0 20 40 60 80 100 120 140
Pre
dic
ted
An
gle
Err
or
Pe
rce
nta
ge
Ch
ange
fro
m B
ase
line
Measured Angle Error Percentage Change from Baseline
Figure 43. Measured vs. Predicted Precision Timing Angle Error Values (7 Gz Plateau)
y = 0.8513x + 3.8563
0
20
40
60
80
100
120
140
0 20 40 60 80 100 120 140
Pre
dic
ted
An
gle
Err
or
Pe
rce
nta
ge
Ch
ange
fro
m B
ase
line
Measured Angle Error Percentage Change from Baseline
Figure 44. Measured vs. Predicted Precision Timing Angle Error Values (7 Gz SACM)

114
7.0 DISCUSSION
Although nearly ninety years have passed since the deleterious effects of acceleration
on human physiology and performance first became an area of interest to the aviation
community, few studies have attempted to quantify the relationship between positive
sustained Gz acceleration and human cognition. Due to high expenses, safety risks, and
facility availability, traditional acceleration research focused heavily on human
physiology, life support equipment, and issues related to aviation mishaps rather than the
subtle effects on the human operator’s cognitive ability to perform flight tasks.
Nevertheless, the results from these investigations first supplied quantitative support for
the hypothesis that human cognition declines in a graded fashion. In fact, studies devoted
to the understanding of acceleration-induced loss of consciousness (G-LOC) yielded a
detailed understanding of the events leading up to the loss of consciousness event (Tripp,
et al., 2002; Tripp, et al., 2003). Aptly termed “almost loss of consciousness (A-LOC),”
investigators noted increased occurrence of specific symptoms leading up to the loss of
consciousness event (Morrissett & McGowan, 2000; Whinnery, Burton, Bolls, & Eddy,
1987; Whinnery & Whinnery, 1990). Some, such as loss of short-term memory,
confusion, loss of situational awareness, and abnormal sensory manifestations are
indicative of degraded cognitive performance.
Perhaps the best initial evidence that not all aspects of cognition degrade uniformly
under positive acceleration stress was discovered in a study focused on recovery from G-
LOC (Tripp, et al., 2003). Investigators provided subjects with two tasks to perform
simultaneously: a 2-dimentsional tracking task and a math task. The results clearly
showed that subjects arrested function on the math task before the tracking task as they

115
neared the point of unconsciousness. Although the reason for this difference is debatable,
one possible explanation is that higher order brain functions (i.e. those that require
conscious thought/concentration and therefore require the highly active neocortical brain
regions) will be degraded to a larger extent than those that can be completed with relative
autonomy. In the experiment described by Tripp, et al. (2003), subjects received intense
training on the tracking task over several days. It is highly likely that such sustained
training resulted in much more fluid and automated responses, known as classical
conditioning (Carlson, 2007). The automation of the responses and procedural memories
correlate with a shift in neural activation from high-level, trans-cortical circuits to the
more primitive structures basil ganglia (Carlson, 2007). However, although subjects also
received similar training on the math task, the mental arithmetic likely still required some
conscious thought, hence activation of the neocortex, at the time of the study. Given that
the basal ganglia and other more primitive brain structures are located ventral to the
higher order cortical areas and generally have lower metabolic rates, it stands to reason
that the math task would arrest function first in the absence of freshly oxygenated blood.
Such findings coupled with evidence that regional cerebral oxygen saturation declines
as a function of acceleration and can be correlated with declines in performance
(Ernsting, Nicholson, and Rainford, 1999; Newman, White, and Callister, 1998; Tripp,
Chelette, and Savul, 1998) led to the establishment of the central thesis of this effort:
cognitive impairment is directly related to changes in neuronal metabolism as a
consequence of degraded cortical oxygen supply caused by the inertial forces of the
dynamic flight environment. In addition, it was hypothesized that brain areas are
affected locally based on graded hypoxia (i.e. more blood profusion in ventral areas than

116
dorsal) and their overall metabolic need (e.g., cortex has higher basal metabolism than
more primitive structures such as the pons).
In this regard, the Air Force sponsored Human Information Processing in Dynamic
Environments (HIPDE) program was immensely valuable for verifying the validity of
this theory given that the results illustrated a non-uniform distribution of cognitive
performance under various levels of acceleration stress. Often tasks with a higher level
of complexity (e.g. recovery from unusual attitudes, short-term memory, inference of
motion) suffered much more than those that were simplistic (e.g. pitch-roll capture,
precision timing, peripheral information processing). In other words, those that required
engagement of cortical areas to complete the task declined at a more pronounced rate
than those that likely became automatic following training. Each of the HIPDE tasks
were rank ordered by level of complexity by Dr. Dragana Claflin, a psychologist and
neuroscientist, during a consultation in 2009 (Claflin, 2009). It should be noted that this
was an informal evaluation based purely on an initial subjective analysis without the aid
of brain-imaging data. To properly rank-order the tasks, objective data from functional
magnetic resonance imaging (fMRI) during performance of each task is necessary. The
subjective rank ordering can be found in table 6 below. The tasks highlighted in blue are
those that showed significant declines in performance with increasing acceleration stress
(McKinley, et al., 2008). Also included are the statistically significant percentage
changes in baseline performance for the 3, 5, and 7G plateau profiles. The 7G SACM
profile was not included in the table because the performance changes continuously with
the varying Gz level. Tasks names followed by an asterisk (*) indicate the performance
tasks used in the modeling effort described in this dissertation.

117
Table 6. HIPDE Tasks Rank Ordered by Complexity
3G 5G 7G
Gunsight Tracking 25% 40% 100%
Motion Inference* 20% 40% 60%
Unusual Attitude Recovery -7% 11% 17%
Rapid Decision Making 0% 0% 0%
Situation Awareness -21% -19% -28%
Short-Term Memory -13% 0% 14%
Visual Monitoring 0% 0% 0%
Perception of Relative Motion 0% 0% 0%
Precision Timing* 0% 20% 40%
Pitch/Roll Capture 0% 0% 0%
Peripheral Vision 0% 11% 14%
Basic Flying Skills 0% 0% 0%
High
Complexity
Medium
Complexity
Low
Complexity
Change in Task Performance
from BaselineTask NameLevel of
Complexity
The table illustrates that a larger proportion of the tasks in the higher complexity
region expressed significant declines in performance. Furthermore, the simplistic tasks
that demonstrated a significant decline in performance had a reduced magnitude of
performance decrement compared to complex tasks. For example, in the relative motion
task, the only significant decline in performance occurred during the 7G SACM
acceleration profile. Although statistically significant, the reduction in response time to
the visual stimuli in the “peripheral information processing” experiment was only 0.096
sec. It is doubtful that such a small change in performance would be operationally
relevant.
Selection of the motion inference and precision timing task for this modeling effort
provided both a complex and simplistic task for comparison to ensure the validity of the
basic underlying theory. Although inherently similar in structure, they probe two
separate cognitive functions and are vastly different in complexity and level of difficulty.
This difference is explained by analyzing the brain areas active in execution of each task.

118
As described in the background and methods sections, the precision timing task requires a
short amount of time to complete each trial. Consequently, the cerebellum (the body’s
internal clock) is able to process the perception of the time and enable the human
operator to respond at the appropriate moment. Given that the motion inference task
removes the target from view, provides a distracter task, and requires more than 5
seconds to complete, it is evident that the human operator will require engagement of
working memory processes to correctly retain the initial velocity of the target and
subsequently infer the movement of the target across the arc. Traditionally, working
memory engagement correlates with activation of the dorsolateral prefrontal cortex
(DLPFC) (Mangels et al., 1998; Nichelli, et al., 1996). This is an important distinction
because the cerebellum lies a full 4.6 cm below the level of the DLPFC. Because the
drop in arterial blood pressure is a function of height above the level of the heart, the
cerebellum retains higher local arterial blood pressure (hence oxygenated blood
profusion) when compared to the DLPFC. Additionally, the cerebellum’s basal
metabolic rate is approximately 30% lower than that of the DLPFC indicating that its
metabolic need is less.
Considering the objective performance results of the motion inference task and the
precision timing task, it is clear that the change in performance during execution of the
motion inference task is greater than that of the precision timing task in each of the four
Gz profiles. In fact, the motion inference task’s percent change from baseline during the
second 7G peak within the 7G SACM reached nearly 100%. Hence, the data support the
expectation that the precision timing performance degrades to a lesser extent when
compared to motion inference.

119
With the knowledge concerning cognitive decrements elucidated from the HIPDE
program, the objective of this effort was to develop and validate a computational model
capable of predicting the cognitive performance fluctuations across different tasks using
acceleration data as the only model input. Thus, the focus of the analysis was evaluation
of the accuracy and precision of the predicted cognitive task performance when compared
to collected measured data. Agreement between the measured and predicted values were
computed using established metrics for biodynamic computational models (Griffin, 2001)
including correlation coefficient, linear best-fit slope (between measured and predicted
values), and mean percent error. Although perfect agreement can be defined as a
correlation coefficient of 1, a linear best-fit slope of 1, and a mean percent error of 0,
defined limits ascribed to the level of acceptability of the model that are uniformly
applied do not exist. Nevertheless, one would expect these values to be as close as
possible to the ideal values in order to provide a reasonable prediction of the desired
metrics. However, based on substantial data available in the literature, Keppel and
Wickens (2004) defined human research performance models with correlation
coefficients in the range of 0.5-0.6 as very good, and those with coefficients around 0.8
as excellent.
7.1 Cardiovascular Model
Data collected over the course of the HIPDE experiments unfortunately did not
include cardiovascular parameters such as stroke volume, heart rate, arterial blood
pressure, and peripheral vascular resistance. Consequently, there were no objective data
with which to assess the performance of the cardiovascular portion of the model. When

120
possible, objective data from previous experiments were examined to ensure the model
predictions fell within an appropriate range of values for a given profile. This issue was
complicated by the fact that much of the published data were collected in experiments
that purposefully did not provide acceleration protection (e.g. an anti-G suit) to the
subjects, or used acceleration onsets that differed vastly from those used in the HIPDE
experiments. Figures 45 and 46 provide example plots from previous research. The
signal labeled PES in figure 46 represents the eye-level systolic arterial blood pressure.
Figure 47 presents an example plot of predicted eye-level arterial blood pressure from the
cardiovascular model developed within this effort. The purely subjective assessment is
that the predicted values are within reasonable ranges for the acceleration levels and
durations used in the HIPDE effort. Magnitudes resembled quantitative data of previous
efforts.
Figure 45. Mean Eye Level Arterial Blood Pressure (Rositano, 1980).

121
Mean Arterial Pressure (MAP)
Cardiac Output (CO)
Stroke Volume (SV)
Heart Rate(HR)
Mean Carotid Arterial Pressure (MCAP)
Eye-Level Systolic Pressure (PES)
Mean Central Venous Pressure (CVP)
Figure 46. Predicted Cardiovascular Parameters; PES - Systolic Arterial Blood Pressure at Eye Level
(Grygoryan, 1999)

122
0
1
2
3
4
5
6
7
8
0
20
40
60
80
100
120
140
0 10 20 30 40 50 60 70 80
Acc
ele
rati
on
(G
z)
Blo
od
Pre
ssu
re (
mm
Hg)
Time (sec)
Eye Level Blood Pressure Gz
Figure 47. Predicted Eye-Level Arterial Blood Pressure (7G)
7.2 Regional Cerebral Oxygen Saturation (rSO2) Model
The predicted eye-level arterial blood pressure data directly fed the algorithm that
calculated expected regional cerebral oxygen saturation (rSO2). This equation was
developed using only one subject’s rSO2 data from the “peripheral information
processing” experiment performed within in the HIPDE program as McKinley et al,
(2005a) had previously shown this data to be highly repeatable between subjects. The
predicted rSO2 values were then objectively validated using data collected during the
“rapid decision making” HIPDE experiment. Referring to table 1, agreement between the
measured and predicted rSO2 values was extremely high across acceleration profiles
given that all maintained error averages below 5% (0.75-3.33), high correlation (0.7483-
0.8687), and high overall linear best-fit slopes (0.5760-0.9484). Because the 3G profile
produced much smaller reductions in rSO2, the measured values were more sensitive to

123
signal noise caused both by error in the cerebral oximeter and small variations in average
subject rSO2. As expected, the rSO2 agreement calculations during the 3G profile are
lower. However, a close inspection of the plot (Figure 23) provides evidence that the
predictions closely match the magnitude of the rSO2 decline and are temporally precise.
It is noteworthy that following the decline of acceleration in each of the four Gz
profiles, the predicted rSO2 values recovered to baseline values prematurely. Likewise,
predicted rSO2 recovery following the first 7G peak within the SACM profile was much
greater than the measured values. Given that rSO2 is directly proportional to eye-level
blood pressure, this may indicate that the cardiovascular model is predicting eye-level
blood pressure recoveries that fall outside the normal average. Nevertheless, the impact
of this phenomenon on overall model accuracy was minimal and closeness of fit between
the predicted and measured rSO2 data remained high.
7.3 Cognitive Performance Model (CP): Motion Inference
Minor perturbations (noise) in the measured task performance data can influence
agreement results to a greater extent when the change from baseline is itself minor (low
signal-to-noise ratio). Hence, as in the rSO2 model, the predicted motion inference
performance during the 3G acceleration trial resulted in the lowest agreement with the
measured data of the four acceleration profiles (Correlation: 0.7103, Linear Best-fit
Slope: 0.5494, Mean Percent Error: 6.35). In particular, the linear best fit slope of the
measured and predicted values during the 3G plateau was especially low, indicating that
the measured and predicted values did not perfectly match in magnitude over the time
course of the profile. Regardless of this fact, the predicted magnitude of motion

124
inference performance decline was accurate as illustrated in Figure 27. This coupled with
the low mean percent error between the measured and predicted values and high
correlation indicates the model produced an accurate prediction of human motion
inference performance during the 3G plateau profile.
The final data point in the 5G profile greatly influenced the agreement results and
yielded poor correlation (0.6019), elevated error (26.92%), and a lower linear best-fit
slope (0.4324) that all indicate poor overall agreement. Assuming the validity of
removing this point (as described in the methods section), predictions for motion
inference performance during the 5G (Correlation: 0.9451, Best-Fit Slope: 0.8206, Mean
Percent Error: 12.88%) surprisingly achieved the highest overall agreement between the
measured and predicted values of the four acceleration profiles.
Because motion inference performance data collected during the 7G plateau profile
were used to develop the coefficients in the linear equation relating regional cerebral
oxygen saturation to predicted change in performance, it was intuitively pleasing that
performance predictions during this profile produced excellent overall agreement
(Correlation: 0.8827, Best-Fit Slope: 0.9144, Mean Percent Error: 17.11%). In addition,
motion inference performance declines were quite pronounced relative to signal noise
during this acceleration plateau creating a high signal-to-noise ratio and minimizing the
effect of noise on agreement. Minor signal perturbations are deliberately not captured in
the model; therefore, perfect agreement with the measured data will never be achieved.
Still, overall agreement across all four profiles yielded high agreement with the collected
motion inference performance data evidenced by correlation coefficients close to one

125
(0.7103-0.9451), relatively low mean percent error (6.35%-38.21%), and overall high
linear best fit slopes (0.7416-0.9144) (with the exception of the 3G profile).
7.4 Cognitive Performance Model (CP): Precision Timing
To ensure the accuracy of the model predictions across tasks, data from the precision
timing experiment were used in final model validation. Because these data did not serve
in the development of any of the model algorithms, they provided a pure and unbiased
assessment of the model’s ability to predict human cognitive performance under various
levels of acceleration stress. Prior to evaluating the model, measured precision timing
data revealed that performance on the task did not significantly change from baseline
(1G) levels under the 3G profile. Consequently, the measured signal was comprised
exclusively of noise. As noise was deliberately not modeled, predictions of precision
timing performance during the 3G profile were constant. Any attempt to correlate a
constant value signal with another that oscillates around the constant value will inevitably
lead to poor agreement results. Consulting table 5, it is clear that the model agreement
results for the 3G profile confirmed this expectation (Correlation: 0.5321, Best-Fit Slope:
0.2225, Mean Percent Error: 4.99%). In this case, even though the agreement
calculations as defined by Griffin (2001) do not indicate high agreement between the
measured and predicted precision timing performance, it does not signify that the model
predictions are inaccurate. The model accurately predicted that performance remained at
baseline levels throughout the profile and even calculated the moderate improvement in
performance over baseline levels after the acceleration stress had ceased (evidenced by

126
the low mean percent error). Combined, these parameters provide evidence the model
accurately predicts precision timing performance during single peak, 3G acceleration.
As in the motion inference analysis, the final data point of the 5G plateau was
removed based on evidence from McKinley, et al., (2008) that suggested subjects
prematurely stopped performing the task once the Gz stress approached baseline levels.
This same phenomenon was found in other HIPDE experiments including the “gunsight
tracking” task. Again, this final data point produced a large effect on the agreement
analysis. Correlation, mean error, and linear best-fit slope all suffer greatly with the data
point included in the analysis (Correlation: 0.5172, Best-Fit Slope: 0.5186, Mean Percent
Error: 8.69%), and masked the overall agreement of the model to the measured data.
With the data point removed, the predicted precision timing performance during the 5G
plateau yielded an extremely close fit with the average measured data (Correlation:
0.7676, Best-Fit Slope: 0.5795, Mean Percent Error: 6.30%).
Measured and predicted precision timing performance during both the 7G plateau
(Correlation: 0.9726, Best-Fit Slope: 1.027, Mean Percent Error: 12.07%) and 7G SACM
(Correlation: 0.6856, Best-Fit Slope: 0.8513, Mean Percent Error: 17.28%) demonstrated
exceptional agreement. Nevertheless, predictive accuracy did not remain constant
throughout the 7G SACM profile. Evaluation of Figure 39 indicated the prediction was
most accurate during the first half of the profile. The large dip in precision timing
performance predicted by the model during the second 7G peak did not appear in the
collected data. The reason for this inaccuracy is not immediately known, but could
indicate that regional cerebral oxygen saturation is maintained much longer than
anticipated in subcortical brain areas than in their higher cortical counterparts. Hence,

127
the relationship between arterial blood pressure and rSO2 may become nonlinear with
respect to height above the heart over extended periods of acceleration stress. The error
may also be a result of a higher overall Gz tolerance in the subject group that participated
in the precision timing experiment when compared to those in the motion inference study.
Another possibility is the effect of learning and experience on performance. The recent
experience gained by the first 7G exposure within the SACM provides the subject with an
expectation of the level of exertion and concentration necessary for the second 7G peak
within the same profile. It is possible that this experience gained during the first 7G peak
allows the subjects to reduce exertion and concentration on the AGSM to allow increased
attention on the performance task during the second 7G peak resulting in improved
performance.
7.5 Limitations
Although the model was validated, it should be noted that it is only valid for the
conditions on which it was developed and tested. Hence, it may not be suitable for
accelerations higher than 7 Gz or those below 1 Gz. Likewise, these model predictions
are only precise for subjects with a standard anti-G suit that also performed the standard
L1 straining maneuver. Alternative G protection measures will alter the physiology and
lead to performance that may not resemble the predictions of this model. Likewise, the
model does not account for additional stressors such as vibration, heat, sleep deprivation,
or various diseases or cognitive disabilities. Finally, the model does not include
accommodations for positive pressure breathing or variability in Gz tolerance due to
physical endurance, stamina, build, and height. The predictions represent a population

128
average and assume a heart-to-eye distance of 30 cm. Resulting predictions in cognitive
performance are for the average performance of the group rather than specific
performance of the individual. Future research could expand the model’s utility to
include variations in Gz protection.
Additionally, data on which the model was based and validated used a 1 G/sec onset
rate. Although it is expected that the model will provide accurate physiological and
cognitive task performance predictions under other acceleration onset rates, it should be
noted that the current model is not validated under such situations. Similarly, other
external factors that can alter human operator performance such as level of engagement,
attention, amount of training, and operator strategy are not explicitly modeled in this
effort.
The model was tested with data from two cognitive performance tasks, both of which
were singular tasks. As a result, model predictions cannot be generalized to complex
tasks that involve performance of several sub-tasks simultaneously. In addition, the
model predictions focus on stimulus-response tasks and may not be applicable to self-
paced tasks. Nevertheless, the model represents an initial effort to describe and predict
cognitive performance under positive acceleration stress. The unique modeling
architecture provides a sound foundation on which such factors and variables can be
added in the future to expand its predictive capability.
7.6 Summary
1. Previous research focused on understanding G-LOC elucidated more subtle
effects of acceleration on cognitive performance tasks.

129
2. The literature suggested declines in cognitive performance correlated with
declines in cerebral oxygen saturation. As a result, the declines in cognitive
performance are likely caused by failure of neural metabolism resulting from
acceleration-induced hypoxia.
3. A G-LOC experiment performed by Tripp et al. (2003), provided initial
evidence that not all types of cognitive performance are affected to the same
extent.
4. The HIPDE program was crucial in elucidating the extent of cognitive
performance declines in specific abilities relevant to the flight environment.
Portions of these data were used to develop the cognitive performance model
described in this dissertation.
5. Although cardiovascular data was not collected during the HIPDE
experiments, the model outputs (e.g. heart rate, systolic eye level blood
pressure, stroke volume, etc.) were compared to values in the existing
literature. The model outputs closely matched the collected data from similar
acceleration profiles detailed in previous experiments.
6. Model predictions of regional cerebral oxygen saturation (rSO2) were
validated with data from the rapid decision making experiment performed
during the HIPDE program. The agreement analysis provided evidence that
the model is an excellent predictor of rSO2 regardless of the task performed
(Correlation Coefficient: 0.7483-0.8687; Linear Best-Fit Slope: 0.5760-
0.9484; Mean Percent Error: 0.75-3.33).

130
7. Comparisons between model predictions of cognitive performance and
measured performance data from the motion inference task revealed good
overall agreement (Correlation Coefficient: 0.7103-0.9451; Linear Best-Fit
Slope: 0.7416-0.9144; Mean Percent Error: 6.35-38.21).
8. Measured data from each HIPDE experiment contained random signal noise
caused by averaging across subjects and days. Due to the fact that the 3G
acceleration profile causes relatively minor changes in eye-level blood
pressure, the observed changes in cognitive performance were also small.
Consequently, the signal-to-noise ratio of the cognitive performance
measurement was very low, creating lower agreement between the measured
and predicted values. Nevertheless, the model accurately predicted the
magnitude and duration of the cognitive performance decline in both the
motion inference and precision timing tasks.
9. Agreement analyses of measured and predicted precision timing task
performance also revealed very good overall agreement, excluding the 3G
profile due to the negligible change from baseline (Correlation Coefficient:
0.6856 - 0.9726; Linear Best-Fit Slope: 0.5795 - 1.027; Mean Percent Error:
6.30 - 17.28). Given that the data from the precision timing task was not used
in model development, it provides substantial evidence that the model is a
valid predictor of cognitive performance over the acceleration range of 1.5-7.0
Gz.
10. The model inherently contains several limitations. Of particular significance
is the fact that the tasks used to test the model were singular, stimulus-

131
response tasks. Accuracy of the model for more complex, self-paced tasks
remains unknown. In addition, the model predictions are population averages
and cannot be applied to specific individuals. Lastly, the model assumes the
pilots are utilizing a standard anti-G suit and are performing the anti-G
straining maneuver.
Taken together, the results of the agreement analyses suggest the model is highly
accurate and consistently predicts the magnitude of cognitive task performance
decrements at a variety of acceleration levels. Keppel and Wickens (2004) collated
results of human research performance models available in the existing literature and
considered their relative performance. They concluded that those with correlation
coefficients in the range of 0.5-0.6 are considered very good, and coefficients around 0.8
as excellent. The following figure provides an analysis of each model section developed
for this dissertation based on the criteria established by Keppel and Wickens (2004).
Regional Cerebral Oxygen
Saturation (rSO2) Model
Correlation Coefficient: 0.7483-0.8687Linear Best-Fit Slope: 0.5760-0.9484
Mean Percent Error: 0.75-3.33
Excellent Agreement
Cognitive Performance
Model (Motion
Inference)
Correlation Coefficient: 0.7103-0.9451Linear Best-Fit Slope: 0.7416-0.9144
Mean Percent Error: 6.35-38.21
Excellent Agreement
Cognitive Performance
Model (Precision
Timing)
Correlation Coefficient: 0.6856 - 0.9726Linear Best-Fit Slope: 0.5795 - 1.027
Mean Percent Error: 6.30 - 17.28
Very Good -Excellent
Agreement
Figure 48. Model Agreement Analysis Summary
Additionally the model correctly forecast performance on a completely separate
cognitive task, the data of which was not in any way included in the development of any
of the model algorithms. This provides substantiated evidence that indeed cognition

132
under positive Gz stress is a direct result of local neural metabolic processes degrading to
the point that they are no longer able to support the mental demands of flight. With a
validated modeling platform, it is possible to expand the envelope of the predictive
capability by adding new brain areas active in other relevant cognitive abilities. The
primary challenge for the future will be gaining a thorough understanding of complex
tasks that engage several cortical areas simultaneously. Knowledge of the interactions of
the brain networks involved would ensure all the necessary structures are included in the
model to predict performance in the cognitive area of interest.

133
8.0 CONTRIBUTIONS AND APPLICATIONS OF RESEARCH
The primary contributions of this research to the field of human physiology and
performance under sustained acceleration stress include:
1. Development of a cardiovascular physiology model capable of realistically
responding to positive acceleration stress
2. Definition and validation of relationship between regional cerebral arterial
blood pressure and regional cerebral oxygen saturation
3. Production of verified cognitive task performance model architecture driven
by the new physiological model components
4. Validation of cognitive performance model architecture across cognitive tasks
5. Significant scientific evidence to support the theory that cognitive
performance declines recorded during acceleration stress result primarily from
the reduction of cerebral metabolic processes that cause reduced neural firing
rates
6. Modeling tool with numerous potential applications to Air Force, NASA, and
civilian operations
7. Methodology to investigate human cognitive performance under acceleration
stress without the need for expensive human centrifuge facilities
Suspicions that cognitive declines noted during positive Gz acceleration were directly
related to purely metabolic phenomena began to appear nearly 30 years ago (Rositano,
1980; Tripp, Chelette, Savul, and Widman, 1998; Tripp et al., 2002). In other words, the
cardiovascular system is not able to generate adequate pressure to overcome the increased
apparent weight of the blood and cerebral oxygen perfusion begins to fail. As a result,

134
the brain begins to shut off non-essential functions both as a neural protection measure,
and to ensure maintenance of life-sustaining autonomic functions (e.g. heart rate).
Although Grygorian (1999), Rogers (2003), and McKinley, et al., (2005b) were able to
generate computational models of various aspects of the physiology, each had significant
shortcomings that limited the utility of the model. For example, although Rogers’
validated his model for short-duration single Gz peaks, it was too simplistic to provide
predictions for long duration, multi-peak profiles (e.g. SACM). Grygorian was never
able to validate the model predictions of his software and the algorithms made many
assumptions that may be inaccurate. Finally, McKinley’s original rSO2 model was
simply an equation fitted to recorded data with no theoretical basis in the dynamics of
human physiology.
Those that have attempted predictions of human cognitive performance under positive
Gz stress have done so with only limited success. Specifically, NTI, Inc. used a first-
order transfer function to approximate the eye-level cardiovascular physiology and then
used this predicted value to obtain performance data located within a set of look-up tables
derived from published literature. This simplistic modeling approach to a rather complex
situation ultimately failed to provide adequate performance predictions for a few key
reasons. First, the physiological model was only valid for short-duration, single peak
profiles and did not account for degradation of G-suit effectiveness over time, physical
fatigue, or cumulative effects of Gz acceleration stress. Hence, the prediction for the first
7Gz peak was identical to the second, third, fourth, etc. Furthermore, the model simply
provided a single value to estimate physiological status rather than reporting specific
physiological values. Therefore, it did not provide the user with any understanding of

135
why the human’s performance degraded more in one task than in another. Such
estimations were purely a product of the data in the look-up tables. The data itself was
known at the time to have significant limitations due to the fact published data in the area
was sparse. Hence, many cognitive ability tables simply extrapolated data from low-level
Gz profiles to fill in the higher Gz levels. The only way to correct this issue would be to
modify the data to include real data from the HIPDE experiments. Consequently, the
model would simply be making predictions of data on which it was created.
The significant contribution of this research was the establishment and validation of a
human cognitive performance under acceleration stress model rooted in accurate
predictions of relevant physiological measures, human anatomy, and neural processes.
The advantage of producing a model based on sound scientific theory is immediately
evident in the closeness of fit between the predicted outcomes and measured human
performance. Perhaps the greatest contribution to the field is the fact that the model
demonstrated robust predictions across cognitive tasks, a feat never before successfully
accomplished. The results also substantiate the long suspected theory that cognitive
declines result directly from failure of specific neural sites due to reductions in metabolic.
As a tool, the model holds particular promise for a variety of commercial and military
applications. Because the human operator encounters sustained acceleration most
frequently in fast fighter aircraft, the model holds tremendous potential for Air Force
operations. Expanding the model to encompass additional brain areas, their locations,
and metabolic rates, would enable investigators to provide models of additional cognitive
tasks. Using predictions of the primary flight tasks (e.g. those tasks included within the
HIPDE program) would enable mission planners and training squadrons to simulate
136
specific flight profiles and gain an understanding of the human cognitive limitations at
any point during the acceleration. Other cognitive process models developed within
robust cognitive architectures such as ACT-R could incorporate the model produced by
this effort to augment specific processes (e.g. decision making) and provide a realistic
representation of the human operator’s behavior based on acceleration stress.
Alternatively, it possible that Gz profiles could be inexpensively designed to degrade
specific abilities through implementation of the model in simulation. Using the developed
acceleration profile(s), an instructor pilot could then provide real-world demonstrations
of this cognitive deficit in the aircraft in an effort to help student pilots recognize their
own limitations in the combat regime.
Lastly, the model has applications in Air Force ground-based aircraft training
simulations. Applied to computer-controlled adversaries, the model could provide
realistic consequences of high acceleration, such as decreased tracking accuracy,
increased memory lapses, and poor timing judgment. Similarly, the flight simulation
software could incorporate time lags, tracking perturbations, etc. to simulate reductions in
cognition for the student flying. Such an improvement would provide realistic
expectations of flight performance in real-world situations.
Other government organizations, such as NASA, routinely subject human operators to
sustained high acceleration. However, the orientation of the longitudinal or head-to-foot
axis (z-axis) is often perpendicular to the primary acceleration vector meaning that the
vector points from chest to back (Gx) rather than from head to foot (Gz). Although this
model provides physiological predictions under acceleration stress in the z-axis only, it is
possible to alter the model by modifying the constant describing the distance of the tissue

137
above heart level. In the supine position, the distance from heart to the cerebral tissue of
interest is simply the difference in the x coordinates since the opposing forces due to Gz
acceleration are approximately zero. In such a configuration, blood flow would be lowest
in the rostral areas of the cortical tissue rather than dorsal. This model could then provide
NASA mission planners with predictions of astronaut cognitive deficits during shuttle
launches and reentry profiles. By evaluating the model output and identifying areas
where cognitive performance degrades below acceptable levels, NASA engineers could
then design and employ appropriate countermeasures at the appropriate time.
Although they produce significantly smaller accelerations (typically <3G),
amusement rides continue to push the envelope of safety in effort to provide enthusiasts
with an increased adrenaline rush. As amusement ride accelerations and speeds have
risen, reported injuries caused by these attractions have also escalated. In 2001, injuries
caused by fixed-site amusement rides had increased over twenty-four percent since 1994,
a time period where park attendance only rose by twelve percent (Levenson, 2002).
Consequently, this significant increase has caused a surge in scrutiny over the methods
employed by amusement parks to regulate ride safety.
Fixed site rides often record tri-axial accelerations from the seat pan and compare to a
table of acceleration magnitude and duration values to determine level of safety.
Although cognitive task performance of the park patron is not of critical importance
while they are on the ride, the cardiovascular and rSO2 components of the model
produced in this effort could provide important safety analysis information. Because
reductions in rSO2 correlate with acceleration-induced loss of consciousness (McKinley,
et al., 2005a), the predicted rSO2 data for the acceleration profile of the ride could be

138
used to determine the relative risk of a loss of consciousness event during the ride. By
modifying the height above the heart level, the ride designers could analyze the
acceleration profile for customers of different heights.

139
9.0 FUTURE RESEARCH
Primarily, future research should focus on expansion of the model to provide
estimations of performance on additional cognitive tasks relevant to the high acceleration
environment. Of principal interest is the verification of hypothesized active brain areas
engaged during task execution. Functional magnetic resonance imaging (fMRI) and/or
magnetoencephalographic (MEG) imaging provide tools with which to assure the correct
brain areas are included in the model. In fact, experimental protocols are currently being
developed to investigate the engaged brain areas during performance of many of the
remaining tasks from the HIPDE program such as unusual attitude recovery, and gunsight
pursuit tracking. This data will ensure proper integration of the active brain areas for
each task into the model to produce accurate cognitive task performance predictions. As
the model is expanded to additional HIPDE tasks, objective data from the HIPDE studies
can be used in the validation efforts.
It is also desirable to quantify the relative contribution of each modeling variable (i.e.
regional rSO2, regional basal metabolic rate) to the cognitive performance prediction.
Systematically removing model variables and then testing the model predictions can
quantify the relative contribution of each variable to the overall cognitive performance
value. Such clarification would aid in the understanding of which parameters provide the
largest effect on cognitive performance predictions.
With the exponential rise in use of unmanned aerial vehicles (UAV’s), the investment
and support of sustained acceleration stress research has greatly diminished. In February
of 2007, the Air Force Research Laboratory decommissioned one of two human
centrifuge research facilities at Wright-Patterson Air Force Base, OH. Similarly,

140
ownership of the remaining research centrifuge facility at Brooks City-Base transitioned
to the Air Force school of aerospace medicine and will close as part of the Base
Realignment and Closure (BRAC) law no later than 2011. The BRAC has also stipulated
that the human centrifuge used exclusively for pilot training will close in that same year.
In spite of this, the Air Force will continue to fly manned fighter aircraft such as the F-22
and F-35 joint strike fighter that possess even greater maneuverability than do their
legacy aircraft predecessors. Without readily accessible research facilities, future
research efforts to refine, improve, and expand the cognitive modeling framework
developed in this dissertation effort may require alternative means of testing and
evaluation.
A device known as the Reduced Oxygen Breathing Device (ROBD 2) produced by
Environics ® (Tolland, CT) is capable of generating hypoxic conditions using a mixture
of nitrogen and ambient breathing air. Using precise thermal mass flow controllers, the
device can control the mixture of breathing air and nitrogen to simulate the reduced
oxygen content found at user-defined altitudes. Because the level of hypoxia (quantified
by rSO2) at various levels of acceleration are known, altitude profiles can be designed to
produce a similar hypoxic level. Subsequently, human subjects could perform specific
cognitive tasks during the preset altitude profile to assess the approximate decline in
performance caused by hypoxia. The effect should be similar for both high altitude and
acceleration although a key difference is that the ROBD 2 cannot induce changes in eye-
level blood pressure. Hence, the graded hypoxia effect found in sustained Gz acceleration
cannot be replicated with the ROBD 2. Nevertheless, it provides a tool with which to

141
perform further investigations of the effects of reduced oxygen supply to the brain on
specific cognitive abilities.
Alternatively, many foreign governments and private institutions own and operate
state-of-the-art man-rated centrifuge facilities including Germany, Sweden, the United
Kingdom, and the Netherlands. Validation of new model components (e.g. new cognitive
tasks) for which no acceleration performance data currently exist could be conducted at
these locations via International Cooperative Research and Development Agreements
(ICR&D) or direct cite contracts. However, additional financial support is required as the
Air Force Research Laboratory no longer invests core research dollars in acceleration
research.

142
10.0 CONCLUSIONS
Acceleration stress reduces eye-level blood pressure and diminishes regional cerebral
oxygen content. As a result of the reduced oxygen supply, dorsally positioned brain areas
with high metabolic need begin to shut down in an effort to maintain basic life-preserving
functions. Cognitive abilities that rely on engagement of brain areas suffering from
degraded function will similarly suffer. The focus of this effort was the development of a
computational model capable of predicting these physiological effects and forecasting the
resulting degradation in specific cognitive abilities based on the severity of the cerebral
metabolic impairment in brain areas necessary for successful execution of said cognitive
abilities. Agreement analyses between the predicted and measured values provided
evidence that support the conclusion that the model can accurately predict cognitive
performance across different tasks the Gz range of 1.5-7.0. The validation effort
presented in this document adds confidence that both the physiological and cognitive
performance predictions are robust across different population samples. Future research
is required to expand the utility of the model and define brain areas required for
execution of additional cognitive abilities.

143
11.0 REFERENCES
Addis, D. R., Wong, A. T. & Schacter, D. L. (2007). Remembering the past and
imagining the future: common and distinct neural substrates during event construction
and elaboration. Neuropsychologia, 45:1363–1377.
Albery, W. B. (1990). Spatial disorientation research on the Dynamic Environmental
Simulator (DES). AAMRL-SR-90-513.
Albery, W. B., Chelette, T. L. (1998). Effect of G suit type on cognitive performance.
Aviat Space Environ Med. May; 69(5): 474-9.
Arnott, S.T., Binns, M.A., Grady, C.L., and Alain, C. (2004). Assessing the auditory
dual-pathway model in humans. Neuroimage, 24:401-8.
Bair, W., and Movshon, J.A. (2004). Adaptive Temporal Integration of Motion in
Direction-Selective Neurons in Macaque Visual Cortex. Journal of Neuroscience,
24(33):7305–7323.
Baizer, J.S., Ungerleider, L.G., and Desimone, R. (1991). Organization of visual inputs to
the inferior temporal and posterior parietal cortex in macaques. Journal of Neuroscience,
11:168-190.
Bassant, M.H., Jazat-Poindessous, F., Lamour, Y. (1996). Effects of Metrifonate, a
Cholinesterase Inhibitor, on Local Cerebral Glucose Utilization in Young and Aged Rats.
Journal of Cerebral Blood Flow & Metabolism, 16:1014–1025.
Bechara, A. (2004). The role of emotion in decision-making: Evidence from neurological
patients with orbitofrontal damage. Brain & Cognition, 55(1): 30-40.
Bliss, T.V., Lømo, T. (1973). Long-lasting potentiation of synaptic transmission in the
dentate area of the anaesthetized rabbit following stimulation of the perforant path. J
Physiol (Lond) 232:331–356.
Bodner, M., Kroger, J. and Fuster, J.M. (1996). AAuditory memory cells in dorsolateral
prefrontal cortex. Neuroreport, 7:1905-1908.
Bruel-Jungerman, E., Davis, S., Laroche, S. (2007). Brain plasticity mechanisms and
memory: A party of four. The Neuroscientist, 13(5):492-505.
Butcher, R.K. (2007). Composite Data from Centrifugal Experimentation Regarding
Human Information Processing. Thesis. Wright State University.
Canfield, A. A., Comrey, A. L., and Wilson, R. C., (1949). A Study of Reaction Times to
Light and Sound as Related to Increased Positive Radial Acceleration, Aviation Medicine,
20:350-355.

144
Carlson, Neil R. (2007). Physiology of Behavior. (9th ed.). Boston: Allyn and Bacon.
Casali, J.G., Wierwille, W.W. (1984). On the measurement of pilot perceptual workload:
a comparison of assessment techniques addressing sensitivity and intrusion issues.
Ergonomics, 27(10):1033-1050
Courtney, S.M., Petit, L., Maisog, J.M., Ungerleider, L.G., and Haxby, J.V. (1998). An
area specialized for spatial working memory in human prefrontal cortex. Science, 279:
1347-1351.
Cummings, M. L. (2004). The Need for Command and Control Instant Message Adaptive
Interfaces: Lessons Learned from Tactical Tomahawk Human-in-the-Loop Simulations,
Adaptive Displays Conference, Los Angeles, CA.
Dubuc, Bruno. "The Brain from Top to Bottom." The Brain. Jan. 2002. Douglas Hospital
Research Centre. 15 Oct. 2008
<http://thebrain.mcgill.ca/flash/a/a_02/a_02_cr/a_02_cr_vis/a_02_cr_vis.html>.
Endsley, M. R. (1988). Situation awareness global assessment technique (SAGAT).
Proceedings of the National Aerospace and Electronics Conference (NAECON), 789-
795. New York: IEEE.
Ercoline, W.R., DeVilbiss, C.A., Yauch, D.W., & Brown, D.L. (2000). Post-roll effects
on attitude perception: The Gillingham illusion. Aviation, Space, and Environmental
Medicine, 71(5):489-495.
Ernsting, J., Nicholson, A.N., and Rainford, D.J. (eds.). Aviation Medicine 3rd edition.
(1999) pp. 43-58. Butterworth Heinemann, Oxford, England.
Fowler, B., Prlic, H. (1995). A comparison of visual and auditory reaction time and P300
latency thresholds to acute hypoxia. Aviat Space Environ Med, 7:645-50.
Fraisse, P. (1984). Perception and estimation of time. Annual Review of Psychology,
35:1-36.
Frankenhauser, M. (1958). Effects of prolonged gravitational stress on performance. Acta
Psychologica, 14:92-108.
Funashi, S., Bruce, C.J., and Goldman-Rakic, P.S. (1989). Mnemonic coding in the visual
space in the monkey’s dorsolateral prefrontal cortex. Journal of Neurophysiology,
61:331-349.
Gerloff, C., Corwell, B., Chen, R., Hallett, M., & Cohen, L.G. (1997). Stimulation over
the human supplementary motor area interferes with the organization of future elements
in complex motor sequences. Brain, 120:1587-1602.

145
Goodale, M.A., and Milner, A.D. (1992). Separate visual pathways for perception and
action. Trends in Neuroscience, 15:20-25.
Goodale, M.A., Meenan, J.P., Bulthoff, H.H., Nicolle, D.A., Murphy, K.H., and Raciot,
C.I. (1994). Separate neural pathways for the visual analysis of object shape in perception
and prehension. Current Biology, 4:604-610.
Goodale, M.A., and Westwood, D.A. (2004). An evolving vision of duplex vision:
Separate by interacting cortical pathways for perception and action. Current Opinion in
Neurobiology, 14:203-211.
Griffin M.J. (2001). The Validation of Biodynamic Models. Clinical Biomechanics. 16
(1, Suppl.): 81S-92S.
Grygoryan, R. (1999). Development of a Hemodynamics Computer Model of Human
Tolerance to High Sustained Acceleration Exposures. Air Force Research Laboratory
Technical Report, AFRL-HE-WP-TR-2006-0143.
Halpern, Diane F. (2003). Thought & Knowledge. (4th ed.). Mahwah: Lawrence Erlbaum
Associates.
Hassabis, D., Kumaran, D., Vann, S. D. & Maguire, E. A. (2007). Patients with
hippocampal amnesia cannot imagine new experiences. Proc Natl Acad Sci, 104:1726–
1731.
Hayashi, M. (2003). Hidden Markov models to identify pilot instrument scanning and
attention patterns. In Proceedings of the IEE International Conference on Systems, Man,
and Cybernetics, Washington DC, 2889-2896.
Hebb, D.O. (1949). The organization of behavior. New York: John Wiley.
Heinle, T.E., Ercoline, W.R. (2003).Spatial Disorientation: Causes, Consequences and
Countermeasures for the USAF. AFRL-HE-WP-TR-2003, ADP013861.
Hikosaka, O., Sakai, K., Miyauchi, S., Takino, R., Sakasi, Y., and Puetz, B. (1996).
Activation of human presupplementary motor area in learning of sequential procedures:
An fMRI study. Journal of Neurphysiology, 76:617-621.
Jennings, T., Tripp, L.D., Jr., Howell, L., Seaworth, J., Ratino, D., Goodyear, C. (1990).
The Effect of Various Straining Maneuvers on Cardiac Volumes at 1G and During +Gz
Acceleration. SAFE, 20(3):22-28.
Johnson, K.A., Becker, J.A. “The Whole Brain Atlas.” 1999. Harvard Medical School.
25Feb2009. <http://www.med.harvard.edu/AANLIB/home.html>.

146
Kaber, D.B., Onal, E., Endsley, M.C. (2000). Design of Automation for Telerobots and
the Effect on Performance, Operator Situation Awareness, and Subjective Workload.
Human Factors and Ergonomics in Manufacturing, 10(4):409–430.
Keppel, G. & Wickens, T.D. (2004). Design and Analysis: A Researcher's Handbook, 4th
edition. Upper Saddle River, NJ: Prentice Hall.
Kessler, S.R., Haberecht, M.F., Menon, V., Warsofsky, I.S., Dyer-Friedman, J., Neely,
E.K., Reiss, A.L. (2004). Functional Neuroanatomy of Spatial Orientation Processing in
Turner Syndrome. Cerebral Cortex, 14(2):174-180.
Krnjevic, K. (1999). Early Effects of Hypoxia on Brain Cell Function. Basic Sciences,
40(3):375-380.
Lee, J.M., Grabb, M.C., Zipfel, G.J., Choi, D.W. (2000). Brain tissue responses to
ischemia. The Journal of Clinical Investigation, 106(6):723-731.
Levenson, M.S. (2002). Amusement Ride-Related Injuries and Deaths in the United
States: 2002 Update. Consumer Products Safety Commission.
Lewis, J.W., Wightman, F.I., Brefczynski, J.A., Phinney, R.E., Binder, J.R., and DeYoe,
E.A. (2004). Human brain regions involved in recognizing environmental sounds.
Cerebral Cortex, 14:1008-1021.
Mangels, A. J., et al. (1998). Dissociable contributions of the prefrontal and neocerebellar
cortex to time perception. Cognitive Brain Research, 7:15-39.
Maunsell J, Van Essen D (1983). "Functional properties of neurons in middle temporal
visual area of the macaque monkey. I. Selectivity for stimulus direction, speed, and
orientation." J Neurophysiol, 49(5):1127-47.
McCloskey, K., Albery, W. B., Zehner, G., Bolia, S. D., Hundt, T. H., Martin, E. J., &
Blackwell, S. (1992). NASP re-entry profile: Effects of low-level +Gz on reaction time,
keypad entry, and reach error. AL-TR-1992-0130.
McHugh, S. B., Campbell, T. G., Taylor, A. M., Rawlins, J. N. P., and Bannerman, D.
M. (2008). A role for dorsal and ventral hippocampus in inter-temporal choice cost-
benefit decision making. Behavioral Neuroscience, 122(1):1–8.
McKinley, R.A., Tripp L.D. Jr., Bolia S.D., Roark M.R. (2005a). Computer Modeling of
Acceleration Effects on Cerebral Oxygen Saturation. Aviat Space Environ Med, 76: 733-
738.
McKinley R.A., Fullerton K.L., Tripp L.D. Jr., Esken R.L., Goodyear C. (2005b). A
Model of the Effects of Acceleration on a Pursuit Tracking Task. Air Force Research
Laboratory Technical Report, AFRL-HE-WP-TR-2005-0008.

147
McKinley R.A., Fullerton K.L., Tripp L.D. Jr., Goodyear C. (2005c) "Effects of
Acceleration on the Ability to Perceive Relative Motion", presented at the 76th
Aerospace Medical Association Annual Scientific Meeting, Kansas City, MO, May 8-12,
2005.
McKinley R.A., Tripp L.D. Jr., Loeffelholz, J., Esken R.L., Fullerton K.L., Goodyear C.
(2008). Human Information Processing In the Dynamic Environment. Air Force Research
Laboratory Technical Report, AFRL-HE-WP-TR-2008-0008.
Messaoudi, E., Kanhema, T. Soule, J., Tiron, A., Dagyte, G., da Sailva, B., Bramham,
C.R. (2007). Sustained Arc/Arg3.1 synthesis controls long-term potentiation
consolidation through regulation of local actin polymerization in the dentate gyrus in
vivo. The Journal of Neuroscience, 27(39):10445–10455.
Miller, G.A. (1956). The magical number seven, plus or minus two: some limits on our
capacity for processing information. Psychological Review, 63:81-97.
Milner, B., Corkin, S., and Teuber, H.-L. (1968). Further analysis of the hippocampal
amnesic syndrome: 14-year follow-up study of H.M. Neurophysiologia, 6:317-338.
Milner, B. (1970). Memory and the temporal regions of the brain. In Biology of Memory,
edited by K.H. Pribram and D.E. Broadbent. New York: Academic Press.
Morrissett, K., & McGowan, D. (2000). Further support for the concept of a GLOC
syndrome: A survey of military high-performance aviators. Aviat Space Environ Med,
71:496-500.
Musso, F., Konrad, A., Vucurevic, G., Schäffner, C., Friedrich, B., Frech, P., Stoeter, P.,
& Winterer, G. (2006). Distributed BOLD-response in association cortex vector state
space predicts reaction time during selective attention. NeuroImage, 29:1311 – 1318.
Naval Aerospace Medical Institute. G-Induced Loss of Consciousness (G-LOC). Chapter
7: Neurology. In: United States Naval Flight Surgeon’s Manual: Third Edition; 1991.
Nethus, T. E., Werchan, P. M., Besch, E. L., Wiegman, J. F., & Shahed, A. R. (1993).
Comparative effects of +Gz acceleration and maximal anaerobic exercise on cognitive
task performance in subjects exposed to various breathing gas mixtures. Abstract, Aviat
Space Environ Med, 64(5):422.
Newman D.G., White S.W., Callister R. (1998). Evidence of baroreflex adaptation to
repetitive +Gz in fighter pilot. Aviat Space Environ Med, 69:446-451.
Nichelli, P et al. (1996). Perceptual timing in cerebellar degeneration. Neuropsychologia,
34:863-871.

148
O'Donnell, R.D., Moise, S.L., Schmidt, R., Smith, R. (2003). Measurement and Modeling
of Human Performance Under Differing G Conditions. Air Force Research Laboratory
Technical Report, AFRL-HE-WPTR-2004-0034.
Peuskins, H., Sunaert, S., Dupont, P., Van Hecke, P., and Orban, G.A. Human brain
regions involved in heading estimation. Journal of Neuroscience, 21:2451-2461.
Phillips, C.A., Repperger, D.W., Kinsler, R., Bharwani, G., Kender, D. (2007). A
quantitative model of the human–machine interaction and multi-task performance: A
strategy function and the unity model paradigm. Computers in Biology and Medicine
37:1259 – 1271.
Phillips, C.A. (2000). Neuromuscular Control Systems. In: Human Factors Engineering.
Wiley, New York, (Chapter 9).
Porlier, G., Kelso, B., Landolt, J.P., and Fowler, B. (1987). “Study of the Effects of
Hypoxia on P300 and Reaction Time”, Proceedings of the 1987 Aerospace Medical
Association Annual Meeting, May, pp. A14.
Ratino, D.A., Repperger, D.W.,Goodyear, C., Potor, G., and Rodriquez, L.E. (1988).
Quantification of Reaction Time and Time Perception During Space Shuttle Operation,
Aviat Space Environ Med, 59:220–224.
Rauschecker, J.P., and Tian, B. (2000). Mechanisms and streams for processing of
“what” and “where” in auditory cortex. Proceedings of the National Academy of
Sciences, USA, 97:11800-11806.
Repperger, D. W., Frazier, J., Popper, S., and Goodyear, C. (1989). Attention Anomalies
As Measured by Time Estimation Under G Stress, Proceedings of the NAECON
Conference, Dayton OH, May, pp. 787-793.
Rogers, D. B., Ashare, A. B., Smiles, K. A., Frazier, J. W., Skowronski, V. D., & Holden,
F. M. (1973). Effect of modifies seat angle on air-to-air weapon system performance
under high acceleration. Memorandum-AMRL-TR-73-5. Wright-Patterson AFB, OH: AF
Aerospace Medical Research Laboratory
Rogers, D. B. (2003). Design and safety analysis tool for amusement park rides. SAFE
Symposium, Sept. 22-24. Jacksonville, FL.
Rossen, R., Kabat, H., Anderson, J.P. (1943). Acute arrest of cerebral circulation in man.
Arch Neurol Pschiat, 50:510-28.
Rubia., K., Smith, A. (2004). The neural correlates of cognitive time management: a
review. Acta Neurobiologica, 64:329-340.

149
Salzmann, E.W., Leverett, S.D. (1956). Orthostatic venoconstriction studies by miniature
balloon technique. Fed Proc, 15:160-161.
Schacter, D.L., Addis, D.R., and Buckner, R.L. (2007). Remembering the past to imagine
the future: the prospective brain. Nature Reviews Neuroscience, 8(9):657-661.
Shindy, W.W., Posley K.A., and Fuster, J.M. (1994). Reversible deficit in haptic delay
tasks from cooling prefrontal cortex. Cerebral Cortex, 4:443-450.
Smith, K., Dickhaut, J., McCabe, K., Pardo, J.V. (2002). Neuronal Substrates for Choice
under Ambiguity, Risk, Gains and Losses. Management Science, 48(6):711-718.
Stoll, A. M. (1956). Human tolerance to positive G as determined by the physiological
end points. Aviation Medicine, August, p. 356.
Sugar, O., Gerard, R.W. (1938). Anoxia and brain potentials. J Neurophysiol, 1:558-572.
Szpunar, K. K., Watson, J. M. & McDermott, K. B. (2007). Neural substrates of
envisioning the future. Proc Natl Acad Sci, 104:642–647.
Tsao, Y., Wittlieb, E., Miller, B., & Wang, T. (1983). Time estimation of a secondary
event. Perceptual and Motor Skills, 57:1051-1055.
Tsao, D.Y., Vanduffel, W., Sasaki, Y., Fize, D., Knutsenm T.A., Mandeville, J.B., Wald,
L.L., Dale, A.M., Rosen, B.R., Van Essen, D.C., Livingston, M.S., Orban, G.A., and
Tootell, R.B.H. (2005). Steropsis activates V3A and caudal intraparietal areas in macques
and humans. Neuron, 39:555-568.
Tripp, L.D., Jr., Jennings, T.J., Seaworth, J.F., Howell, L.L., Goodyear, C. (1994). Long-
Duration +Gz Acceleration on Cardiac Volumes Determined by Two-Dimensional
Echocardiography. J Clin Pharmacol 34:484-488.
Tripp, L.D., Chelette, T, Savul, S.A., and Widman, B.S. (1998). Female exposure to
high-G: Effects of simulated combat sorties on cerebral and arterial O2 Saturation. Aviat
Space Environ Med 69(9):869-874.
Tripp, L.D., Warm, J.S., Matthews, G., Chiu, P.Y., Deaton, J.E., Albery, W.B. +Gz
acceleration loss of consciousness: Time course of performance deficits with repeated
experience. Proceedings of the 46th Annual Meeting of the Human Factors and
Ergonomics Society, Baltimore, MD 30 September – 4 October 2002. (130-134).
Tripp, L.D., Werchan, P., Deaton, J.E., Warm, J.S., Matthews, G., Chiu, P.Y. The Effect
of repeated exposure to G-induced loss of consciousness on recovery time and
psychomotor task performance 12th International Symposium on Aviation Psychology,
Dayton, OH. 14-17 April 2003. (1166-1171).

150
Volcow, N.D., Chang, L., Wang, G., Fowler, J.S., Franceschi, D., Sedler, M.J., Gatley,
S.J., Hitzemann, R., Ding, Y., Wong, C., Logan, J. (2001). Higher Cortical and Lower
Subcortical Metabolism in Detoxified Methamphetamine Abusers. Am J Psychiatry,
158:383-389.
Wang, J., Zhou, T., Qui, M., Du, A., Cai, K., Wang, Z., Zhou, C., Meng, M., Zhuo, Y.,
Fan, S., Chen, L. (1999). Relationship between ventral stream for object vision and dorsal
stream for spatial vision: an fMRI + Erp study. Human Brain Mapping, 8:170-181.
Walsh, V., Ellison, A., Battelli, L., and Cowey, A. (1998). Task-specific impairments and
enhancements induced by magnetic stimulation of human visual area V5. Proceedings of
the Royal Society of London (B), 265:537-543.
Warrick, M. J., & Lund, D. W. (1946). Effect of moderate positive acceleration (G) on
the ability to read aircraft instrument dials. Memorandum-TSEAA-694-10.
White, W. J. (1960). Variations in absolute visual thresholds during acceleration stress.
ASD-TR-60-34 (DTIC-AD-243612).
White, W. J. (1962). Quantitative instrument reading as a function of illumination and
gravitational stress. Journal of Engineering Psychology, 3:127-133.
Wickens, C.D. (1984). Processing resources in attention. In R. Parasuraman & D.R.
Davies (eds.), Varieties of attention. (pp. 63-102). New York, NY: Academic Press.
Wickens, C. (2005). Attentional tunneling and task management. Technical Report
AHFD-05-23/NASA-05-10 December 2005 Prepared for NASA Ames Research Center
Moffett Field, CA Contract NASA NAG 2-1535.
Wickens, C.D., Self, B.P., Andre, T.S., Reynolds, T.J., Small, R.L. (2007). Unusual
Attitude Recoveries with a Spatial Disorientation Icon. International Journal of Aviation
Psychology, 17(2):153-165.
Wilson, G.F. (2002). An analysis of mental workload in pilots during flight using
multiple psychophysiological measures. The International Journal of Aviation
Psychology, 12(1): 3-18
Zakay, D., Fallach, E. (1984). Immediate and remote time estimation – a comparison.
Acta Psychologica, 57:69-81.
Zakay, D. (1990). The evasive art of subjective time measurement: Some methodological
dilemmas. In R. A. Block (Ed.), Cognitive models of psychological time, (pp. 59-84).
Hillsdale, NJ: Erlbaum.

151
12.0 APPENDIX A: MODEL SOURCE CODE
Option Explicit On
Imports System.IO
Imports System.Math
Public Class Form1
Inherits System.Windows.Forms.Form
#Region " Windows Form Designer generated code "
Public Sub New()
MyBase.New()
'This call is required by the Windows Form Designer.
InitializeComponent()
'Add any initialization after the InitializeComponent() call
End Sub
'Form overrides dispose to clean up the component list.
Protected Overloads Overrides Sub Dispose(ByVal disposing As
Boolean)
If disposing Then
If Not (components Is Nothing) Then
components.Dispose()
End If
End If
MyBase.Dispose(disposing)
End Sub
'Required by the Windows Form Designer
Private components As System.ComponentModel.IContainer
'NOTE: The following procedure is required by the Windows Form
Designer
'It can be modified using the Windows Form Designer.
'Do not modify it using the code editor.
Friend WithEvents MainMenu1 As System.Windows.Forms.MainMenu
Friend WithEvents OpenGzFileDialog As
System.Windows.Forms.OpenFileDialog
Friend WithEvents SaveOutputFileDialog As
System.Windows.Forms.SaveFileDialog
Friend WithEvents MnuFile As System.Windows.Forms.MenuItem
Friend WithEvents MnuOpenFile As System.Windows.Forms.MenuItem
Friend WithEvents MnuExit As System.Windows.Forms.MenuItem
Friend WithEvents MnuRun As System.Windows.Forms.MenuItem
Friend WithEvents MnuSaveAs As System.Windows.Forms.MenuItem
Friend WithEvents PicBxLogo As System.Windows.Forms.PictureBox
<System.Diagnostics.DebuggerStepThrough()> Private Sub
InitializeComponent()
Dim resources As System.Resources.ResourceManager = New
System.Resources.ResourceManager(GetType(Form1))
Me.MainMenu1 = New System.Windows.Forms.MainMenu()
Me.MnuFile = New System.Windows.Forms.MenuItem()

152
Me.MnuOpenFile = New System.Windows.Forms.MenuItem()
Me.MnuRun = New System.Windows.Forms.MenuItem()
Me.MnuSaveAs = New System.Windows.Forms.MenuItem()
Me.MnuExit = New System.Windows.Forms.MenuItem()
Me.OpenGzFileDialog = New System.Windows.Forms.OpenFileDialog()
Me.SaveOutputFileDialog = New
System.Windows.Forms.SaveFileDialog()
Me.PicBxLogo = New System.Windows.Forms.PictureBox()
Me.SuspendLayout()
'
'MainMenu1
'
Me.MainMenu1.MenuItems.AddRange(New
System.Windows.Forms.MenuItem() {Me.MnuFile})
'
'MnuFile
'
Me.MnuFile.Index = 0
Me.MnuFile.MenuItems.AddRange(New
System.Windows.Forms.MenuItem() {Me.MnuOpenFile, Me.MnuRun,
Me.MnuSaveAs, Me.MnuExit})
Me.MnuFile.Text = "File"
'
'MnuOpenFile
'
Me.MnuOpenFile.Index = 0
Me.MnuOpenFile.Text = "Open Gz File"
'
'MnuRun
'
Me.MnuRun.Index = 1
Me.MnuRun.Text = "Run Model"
'
'MnuSaveAs
'
Me.MnuSaveAs.Index = 2
Me.MnuSaveAs.Text = "Save Model Output As"
'
'MnuExit
'
Me.MnuExit.Index = 3
Me.MnuExit.Text = "Exit"
'
'OpenGzFileDialog
'
Me.OpenGzFileDialog.Filter = "*txt|*.txt"
'
'SaveOutputFileDialog
'
Me.SaveOutputFileDialog.Filter = "*txt|*.txt"
'
'PicBxLogo
'
Me.PicBxLogo.Image =
CType(resources.GetObject("PicBxLogo.Image"), System.Drawing.Bitmap)
Me.PicBxLogo.Location = New System.Drawing.Point(0, 8)
Me.PicBxLogo.Name = "PicBxLogo"

153
Me.PicBxLogo.Size = New System.Drawing.Size(328, 400)
Me.PicBxLogo.SizeMode =
System.Windows.Forms.PictureBoxSizeMode.StretchImage
Me.PicBxLogo.TabIndex = 2
Me.PicBxLogo.TabStop = False
'
'Form1
'
Me.AutoScaleBaseSize = New System.Drawing.Size(5, 13)
Me.ClientSize = New System.Drawing.Size(328, 409)
Me.Controls.AddRange(New System.Windows.Forms.Control()
{Me.PicBxLogo})
Me.Menu = Me.MainMenu1
Me.Name = "Form1"
Me.Text = "Human Cognition Under Gz Stress"
Me.ResumeLayout(False)
End Sub
#End Region
Dim GzFilePath As String
Dim OutfilePath As String
Private Sub MnuExit_Click(ByVal sender As System.Object, ByVal e As
System.EventArgs) Handles MnuExit.Click
Close()
End Sub
Private Sub MenuItem2_Click(ByVal sender As System.Object, ByVal e
As System.EventArgs) Handles MnuOpenFile.Click
OpenGzFileDialog.ShowDialog()
GzFilePath = OpenGzFileDialog.FileName
End Sub
Private Sub MenuItem4_Click(ByVal sender As System.Object, ByVal e
As System.EventArgs) Handles MnuRun.Click
'Variable Declaration
Dim line As String
Dim linevalues() As String
Dim NewCurrentLine As String
Dim finished As Boolean = False
Dim header As Boolean = True
Dim total As Integer
Dim k As Integer
Dim Gz As Double
Dim Gz_t1 As Double = 0 'Gz at Time "t-1"
Dim Gz_t2 As Double = 0 'Gz at Time "t-2"
Dim Gz_t3 As Double = 0 'Gz at Time "t-3"
Dim Gz_t4 As Double = 0 'Gz at Time "t-4"
Dim Gz_t5 As Double = 0 'Gz at Time "t-5"
Dim Gz_t6 As Double = 0 'Gz at Time "t-6"
Dim Gz_t7 As Double = 0 'Gz at Time "t-7"
Dim Gz_t8 As Double = 0 'Gz at Time "t-8"
Dim Gz_t9 As Double = 0 'Gz at Time "t-9"
Dim Gz_t10 As Double = 0 'Gz at Time "t-10"
Dim Gz_t11 As Double = 0 'Gz at Time "t-11"
Dim Gz_t12 As Double = 0 'Gz at Time "t-12"

154
Dim Gz_t13 As Double = 0 'Gz at Time "t-13"
Dim Gz_t14 As Double = 0 'Gz at Time "t-14"
Dim Gz_t15 As Double = 0 'Gz at Time "t-15"
Dim Gz_t16 As Double = 0 'Gz at Time "t-16"
Dim GzIncreasing As Boolean = False
Dim GzPlateau As Boolean = False
Dim GzDecreasing As Boolean = False
Dim Gz_Avg As Double 'Average Gz value over
4 time steps
Dim EffectiveGz As Double 'Effective Value of G
due to G-suit and AGSM
Dim Time As Double
Dim PeakCounter As Double = 0 'Counts number of
Gz Peaks
Dim GsuitGdelta As Double = 0
Dim counter4me As Integer = 0
'Neuromuscular Control Constants
Dim Psum As Double = 0 'Force Summation for Feedback Error
Dim Lr As Double = 1.0 'Leg muscle length (% of optimal)
Dim PrIn As Double = 0.0 'Initial required isometic force (%
of max)
Dim alpha As Double = 0.5 'Force feedback reciprical time
constant
Dim Pfeed As Double = 0 'Normalized Force Feedback
Dim Pdelta As Double = 0 'Force Differential Error
Dim Pr As Double = 0 'Required isometric force
Dim Pe As Double 'Force Feedback Error
Dim PoHat As Double 'Force force-length
Dim timrat As Double = 0.04
Dim tprime As Double
Dim Ttot As Double = 55 'Total Time of muscle contraction
(Gz Profile)
Dim PoHapr As Double 'Force Endurance
Dim Ap As Double 'Muscle Activation
Dim dolhat As Double 'Muscle Recruitment
Dim Pprim As Double 'Output Force
'Hemodynamic constants
Dim SysPressIniH As Double = 15998 'Initial Systolic Pressure
at heart (Pa) = 120mmHg
Dim SysPressEye As Double 'Systolic Pressure at Eye
Level
Dim SysPressH As Double 'Current Blood Pressure
Value at Heart Level (Pa)
Dim SysPressCere As Double 'Systolic Pressure at
Cerebellum
Dim SysPressPreFront As Double 'Systolic Pressure at
Dorsolateral Prefrontal Cortex
Dim SysPressHprim As Double 'Normalized Systolic blood
pressure at heart
Dim SysPressHmax As Double = 29330 'Maximum systolic blood
pressure at heart (Pa)
Dim CardiacOutput As Double
Dim HeartRate As Double = 75 'Beats per minute

155
Dim Resistance As Double = 2 'Peripheral resistance of
blood vessels (Unit = Pa*min/mL)
Dim Rprim As Double = 2 / 32 'Normalized Peripheral
resistance
Dim R_t1 As Double = 2 / 32 'Resistance at time "t-1"
Dim SV As Double = 82.6 'Stroke Volume (mL)
Dim SV_t1 As Double = 82.6 'Stroke Volume at time
"t-1"
Dim SVprim As Double = 1 'Normalized stroke volume
Dim Gzhapr As Double = 1
Dim BloodDensity As Double = 1060 'Units are Kg/m^3
Dim H As Double 'Height of tissue above
heart (m)
Dim He As Double = 0.327 'Height of Eye Level
above heart
Dim H_Cere As Double 'Heught of Cerebellum above
heart
Dim H_PreFront As Double 'Height of Prefrontal
Cortex above heart
Dim PressDiff As Double 'Hydrostaic Pressure
between heart and eye level
Dim PressDiff_1G As Double = 2933 'Pressure Difference at 1G
between eye and heart (Pa)
Dim PressDiffH As Double 'Difference in pressure
from 1G pressure value at heart level
Dim SysPressEyeIni As Double 'Initial (1 Gz) Systolic
Blood Pressure at Eye Level
Dim SysPressReqEye As Double 'Required Systolic Blood
Pressure at Eye
Dim SysPressReqH As Double 'Required Systolic Blood
Pressure at Heart
Dim deltaPress As Double 'Difference in required
pressure and output pressure
Dim PressErr As Double 'Pressure Error
Dim PressFeed As Double 'Feedback Loop Pressure
Dim PressPrim As Double 'Output Pressure
Dim PressSum As Double 'Sum for differential error
Dim AlphaB As Double = 0.05 'Reciprical Pressure
Feedback Time Constant
Dim AlphaHR As Double = 0.003 'Reciprical Heartrate Time
constant (Originally 0.07) (Best was 0.0035)
Dim AlphaSV As Double = 0.0025 'Reciprical Stroke Volume
Time constant (Best was 0.0025)
Dim AlphaR As Double = 0.0004 'Reciprical Resistance
Time constant
Dim HRmax As Double = 180 'Maximum Heart Rate
Dim HR_t1 As Double = 75 / HRmax 'Heartrate at Time "t-1"
Dim HR_t2 As Double = 75 / HRmax 'Heartrate at Time "t-2"
Dim HR As Double = 0 'Heartrate at time "t"
Dim HRprim As Double = 75 / HRmax 'Normalized Heartrate
Dim HRhapr As Double = 1
Dim RealCerSat As Double = 100 'Cerebral Oxygen Saturation
'Calcuations of muscle activation constants & initial values
tprime = timrat 'Time to Fatigue
Time = timrat
PoHat = Sin(PI * (Lr - 0.5)) 'Force-Length Relationship

156
PoHapr = PoHat * (0.15 + 0.85 * (1 - Sin(PI * tprime / 2)))
Ap = Pr / PoHapr
If Ap > 1 Then
Ap = 1.0
ElseIf Ap < 0 Then
Ap = 0.0
End If
dolhat = (Acos(1 - 2 * Ap)) / PI
Pprim = (PoHapr / 2) * (1 - Cos(PI * dolhat))
'Calcuations of hemodynamic constants & initial values
SysPressH = SysPressIniH
SysPressHprim = 17646.108 / SysPressHmax
SysPressEyeIni = SysPressIniH - 9.8 * BloodDensity * He
CardiacOutput = SV * HeartRate
PressPrim = CardiacOutput * Resistance
'Open Gz Input File
Dim GzInfile As New StreamReader(GzFilePath)
'Write Data to Output File
Dim Outfile As New StreamWriter(OutfilePath) 'Open Gz Output
File
'Write data file header:
While header
NewCurrentLine = "Time" & vbTab & "Gz" & vbTab & "Heart
Rate" & vbTab & "Stroke Volume" & vbTab & "Cardiac Output" & vbTab &
"Systolic Pressure at Heart" & vbTab & "Eye-Level Systolic BP" & vbTab
& "Required Systolic BP" & vbTab & "Resistance" & vbTab & "RealCerSat"
& vbTab & "Cerebellum O2" & vbTab & "Prefrontal O2" & vbTab &
"Cerebellar Metabolism" & vbTab & "Prefrontal Metabolism" & vbTab &
"Motion Inference Performance" & vbTab & "Precision Timing Performance"
Call Outfile.WriteLine(NewCurrentLine)
header = False
NewCurrentLine = ""
End While
'Write Inital Data
NewCurrentLine = Time & vbTab & Gz & vbTab & Pprim & vbTab &
PrIn
NewCurrentLine = ""
'Get Input Data
While Not finished
line = GzInfile.ReadLine()
If line Is Nothing Then
finished = True
Else
'Remove known spaces in data
line = line.Trim
line = line.Replace(" ", ",")
line = line.Replace(vbTab, ",")
linevalues = Split(line, ",")
total = linevalues.Length
While k < total
If linevalues(k) = "" Then

157
'Do nothing
Else
NewCurrentLine += linevalues(k) & ","
End If
k += 1 'increment counter variable for next line
element
End While
k = 0 'reset counter for next line
linevalues = Split(NewCurrentLine, ",")
Time = linevalues(0)
Gz = linevalues(1)
NewCurrentLine = "" 'Reset variable for next line of
data
counter4me = counter4me + 1
'Neuromuscular Isometric Control With Fatigue
Dim i As Integer
'PrIn = (0.0059 * (Gz ^ 2.6387))
PrIn = (0.002 * (Gz ^ 2.9796))
If PrIn > 1 Then
PrIn = 1
ElseIf PrIn < 0 Then
PrIn = 0
End If
'G3: Normalized Time
tprime = Time / Ttot
'G4: Time varying force generated by muscle
PoHapr = PoHat * (0.15 + 0.85 * (1 - Sin(PI * tprime /
2)))
' For i = 2 To 5
Pdelta = PrIn - Pprim
Psum = Psum + alpha * Pdelta
Pe = PrIn + Psum
Ap = Pe / PoHapr
If Ap > 1 Then
Ap = 1
ElseIf Ap < 0 Then
Ap = 0
End If
dolhat = (Acos(1 - 2 * Ap)) / PI
Pprim = (PoHapr / 2) * (1 - Cos(PI * dolhat))
' Next
'Hemodynamic Equations
If Gz > 1 Then
GsuitGdelta = (Gz - 1)
GsuitGdelta = (GsuitGdelta * (Gzhapr))
If GsuitGdelta > 4 Then
GsuitGdelta = 4
ElseIf GsuitGdelta < 0 Then
GsuitGdelta = 0
End If
EffectiveGz = Gz - GsuitGdelta

158
Else
EffectiveGz = Gz
End If
PressDiff = 9.8 * (EffectiveGz) * BloodDensity * He
PressDiffH = PressDiff - PressDiff_1G
SysPressReqH = (SysPressIniH + PressDiffH) /
SysPressHmax
SysPressEye = SysPressH - PressDiff
'Determine whether Gz is increasing, decreasing, or
plateau
Gz_Avg = (Gz_t4 + Gz_t3 + Gz_t2 + Gz_t1 + Gz) / 5
Gzhapr = (0.32 + 0.68 * (1 - Sin(PI * tprime / 2)))
If Time > (55) Then
Gzhapr = 0.32
End If
deltaPress = SysPressReqH - SysPressHprim
PressSum = PressSum + AlphaB * deltaPress
PressErr = (SysPressReqH + PressSum)
If Gz >= 1.6 Then
HeartRate = (PressErr * 5) + 70
If HeartRate > 170 Then
HeartRate = 170
End If
End If
If Gz >= 1.6 Then
SV = 82.6 - (PressErr * 4)
If SV < 6 Then
SV = 6
End If
End If
End If
If Gz > 1.6 Then
Resistance = (PressErr * 0.2) + 2
End If
CardiacOutput = HeartRate * SV
SysPressH = CardiacOutput * Resistance
If SysPressH > SysPressHmax Then 'Ensure Blood
Pressure Remains between 120 and 300 mmHg
SysPressH = SysPressHmax
ElseIf SysPressH < 15998.68 Then
SysPressH = 15998.68
End If
SysPressHprim = SysPressH / SysPressHmax
If (Gz < 1.6 And HeartRate > 75) Then
HeartRate = HeartRate - 0.008 * (HeartRate - 75)
End If

159
If (Gz < 1.6 And SV < 82.6) Then
SV = SV + 0.008 * (82.6 - SV)
End If
If (Gz < 1.6 And Resistance > 2) Then
Resistance = Resistance - 0.008 * (Resistance - 2)
End If
HR_t2 = HR_t1
HR_t1 = HRprim
SV_t1 = SVprim
R_t1 = Rprim
'Brain Metabolism Equations
Dim PressDiff_PreFront As Double
Dim PressDiff_Cere As Double
Dim PreFrontMet As Double = 43 'Metabolic Rate of
Dorsolateral Prefrontal Cortex (mmol/100 g of tissue/min)
Dim CereMet As Double = 33 'Metabolic Rate of
Cerebellar Cortex (mmol/100 g of tissue/min)
Dim PreFrontO2 As Double = 100 'Relative % oxygen
satuarion in Prefrontal Cortex
Dim CereO2 As Double = 100 'Relative % oxygen
satuarion in Cerebellum
Dim PreFrontCM_new As Double = 0 'New Prefrontal
Cortex Metabolism Rate due to Gz
Dim CereCM_new As Double = 0 'New Cerebellum
Metabolism due to +Gz
Dim DelCereCM As Double = 0
Dim DelPrefrontCM As Double = 0
Dim PrecTimePerf As Double = 100 'Precision Timing
Task Performace
Dim MotInfPerf As Double = 100 'Motion Inference
Task Performance
RealCerSat = ((0.0023 * (SysPressEye / 2) + 16.1) + 71.439
- 2)
H_Cere = -0.019 'Cerebellum 1.9cm
below Eye Level; Prefrontal Cortex 2.7cm above Eye level
H_PreFront = 0.027 '
PressDiff_Cere = 9.8 * Gz * BloodDensity * H_Cere
PressDiff_PreFront = 9.8 * Gz * BloodDensity * H_PreFront
SysPressCere = SysPressEye - PressDiff_Cere
SysPressPreFront = SysPressEye - PressDiff_PreFront
PreFrontO2 = RealCerSat
CereO2 = ((0.0023 * SysPressCere / 2) + 16.1) + 71.439
PreFrontCM_new = PreFrontMet - (((100 - PreFrontO2) / 100)
* PreFrontMet)
CereCM_new = CereMet - (((100 - CereO2) / 100) * CereMet)
DelPrefrontCM = (((100 - PreFrontO2) / 100) * PreFrontMet)
DelCereCM = (((100 - CereO2) / 100) * CereMet)

160
MotInfPerf = (-18.483 * DelPrefrontCM) + 101.11
PrecTimePerf = (-18.483 * DelCereCM) + 101.11
If PrecTimePerf > 100 And Time < 20 Then
PrecTimePerf = 100
End If
Gz_t16 = Gz_t15
Gz_t15 = Gz_t14
Gz_t14 = Gz_t13
Gz_t13 = Gz_t12
Gz_t12 = Gz_t11
Gz_t11 = Gz_t10
Gz_t10 = Gz_t9
Gz_t9 = Gz_t8
Gz_t8 = Gz_t7
Gz_t7 = Gz_t6
Gz_t6 = Gz_t5
Gz_t5 = Gz_t4
Gz_t4 = Gz_t3
Gz_t3 = Gz_t2
Gz_t2 = Gz_t1
Gz_t1 = Gz
'Write Output Data To File
NewCurrentLine = Time & vbTab & Gz & vbTab & HeartRate &
vbTab & SV & vbTab & CardiacOutput & vbTab & SysPressH & vbTab &
SysPressEye & vbTab & SysPressReqH & vbTab & Resistance & vbTab &
RealCerSat & vbTab & CereO2 & vbTab & PreFrontO2 & vbTab & DelCereCM &
vbTab & DelPrefrontCM & vbTab & MotInfPerf & vbTab & PrecTimePerf
Call Outfile.WriteLine(NewCurrentLine)
NewCurrentLine = ""
End While
'Close output file
Outfile.Close()
header = True
End Sub
Private Sub MnuSaveAs_Click(ByVal sender As System.Object, ByVal e
As System.EventArgs) Handles MnuSaveAs.Click
SaveOutputFileDialog.ShowDialog()
OutfilePath = SaveOutputFileDialog.FileName
End Sub
End Class