a practical introduction to modeling complex …...a practical introduction to modeling complex...
TRANSCRIPT

A practical introduction to modeling complex systems. A primer for thinking about the introduction and spread of infectious diseases along the farm-to-fork continuum. Amy L. Greer, BSc, MSc, PhDTier 2 Canada Research Chair in Population Disease Modeling Department of Population Medicine, Ontario Veterinary College, University of Guelph

Outline
• Food-borne disease risk in Canada as a “One Health” case study.
• Using statistical models to identify acute environmental effects.
• Pre-harvest interventions to prevent and control the spread of food-borne pathogens in animal products and produce.
• The challenging health economics of pre-harvest interventions.
• Conclusions and ideas for moving forward.

Thomas et al. 2013

Thomas et al. 2013

Improving food safety through a One Health approach
Chofnes et al. 2012

Improving food safety through a One Health approach
Chofnes et al. 2012


www.cdc.gov
Post-harvest interventions
Pre-harvest interventions
Focus on environmental exposures

Seasonally oscillating environmental exposures
0!10!
20!
30!
40!
01/1994! 01/1996! 01/1998! 01/2000! 01/2002! 01/2004! 01/2006! 01/2008!
Date!
TMAX (C)! MAXCIE/10!Delaware River dissolved O2 (*2)!
Philadelphia,*PA,*USA*
Figure courtesy of Dr. David Fisman, DLSPH

Seasonally oscillating environmental exposures
0!10!
20!
30!
40!
01/1994! 01/1996! 01/1998! 01/2000! 01/2002! 01/2004! 01/2006! 01/2008!
Date!
TMAX (C)! MAXCIE/10!Delaware River dissolved O2 (*2)!
Philadelphia,*PA,*USA*
Figure courtesy of Dr. David Fisman, DLSPH

Seasonally oscillating environmental exposures
0!10!
20!
30!
40!
01/1994! 01/1996! 01/1998! 01/2000! 01/2002! 01/2004! 01/2006! 01/2008!
Date!
TMAX (C)! MAXCIE/10!Delaware River dissolved O2 (*2)!
Philadelphia,*PA,*USA*
Figure courtesy of Dr. David Fisman, DLSPH

Seasonally oscillating environmental exposures
0!10!
20!
30!
40!
01/1994! 01/1996! 01/1998! 01/2000! 01/2002! 01/2004! 01/2006! 01/2008!
Date!
TMAX (C)! MAXCIE/10!Delaware River dissolved O2 (*2)!
Philadelphia,*PA,*USA*
Figure courtesy of Dr. David Fisman, DLSPH

Seasonally oscillating environmental exposures
0!10!
20!
30!
40!
01/1994! 01/1996! 01/1998! 01/2000! 01/2002! 01/2004! 01/2006! 01/2008!
Date!
TMAX (C)! MAXCIE/10!Delaware River dissolved O2 (*2)!
Philadelphia,*PA,*USA*
Figure courtesy of Dr. David Fisman, DLSPH
Need methods that account for predicted seasonal relationships between environmental conditions and incidence of seasonal infectious
diseases

A methodological caveat
• Establishing causal links between environmental factors and disease occurrence is difficult when the disease is seasonal.
• Relationships may be confounded with underlying factors.
• Strong correlation is necessary but not necessarily sufficient.
• Aggregation of exposures may lead to “ecological fallacy”

Is it really the season?
R²#=#0.93894#
0#
10#
0# 2# 4# 6# 8# 10# 12#
Cases#per#week#
Figure courtesy of L. Kinlin & A. White

Is it really the season?
R²#=#0.93894#
0#
10#
0# 2# 4# 6# 8# 10# 12#
Cases#per#week#
Figure courtesy of L. Kinlin & A. White

Is it really the season?
R²#=#0.93894#
0#
10#
0# 2# 4# 6# 8# 10# 12#
Cases#per#week#
Figure courtesy of L. Kinlin & A. White

Is it really the season?
R²#=#0.93894#
0#
10#
0# 2# 4# 6# 8# 10# 12#
Cases#per#week#
Figure courtesy of L. Kinlin & A. White

Is it really the season?
R²#=#0.93894#
0#
10#
0# 2# 4# 6# 8# 10# 12#
Cases#per#week#
Figure courtesy of L. Kinlin & A. White

Environment and disease
What environmental factors are associated with an increased occurrence of disease?
Hypothesis
Environmental factors that increase pathogen survival, persistence, or proliferation in the environment will be related temporally and spatially to human and/or animal outbreaks or case occurrence.

Poisson regression
Environmental Exposure
Seasonal smoothers sin(2π/52) cos(2π/52)
Poisson Regression
Analysis
Expected cases
Figure courtesy of L. Kinlin & A. White

Case-crossover analysis
• Evaluate acute associations between environmental exposures and cases
• 2:1 matched design
• Random directionality of control selection
M Tu W Th F Sa Su M Tu W Th F Sa Su M Tu Th F Sa Su W
case%onset%
hazard%period%
control%period%
control%period%
Figure courtesy of L. Kinlin & A. White Fisman et al. 2005 Greer et al. 2009

Figure courtesy of L. Kinlin & A. White

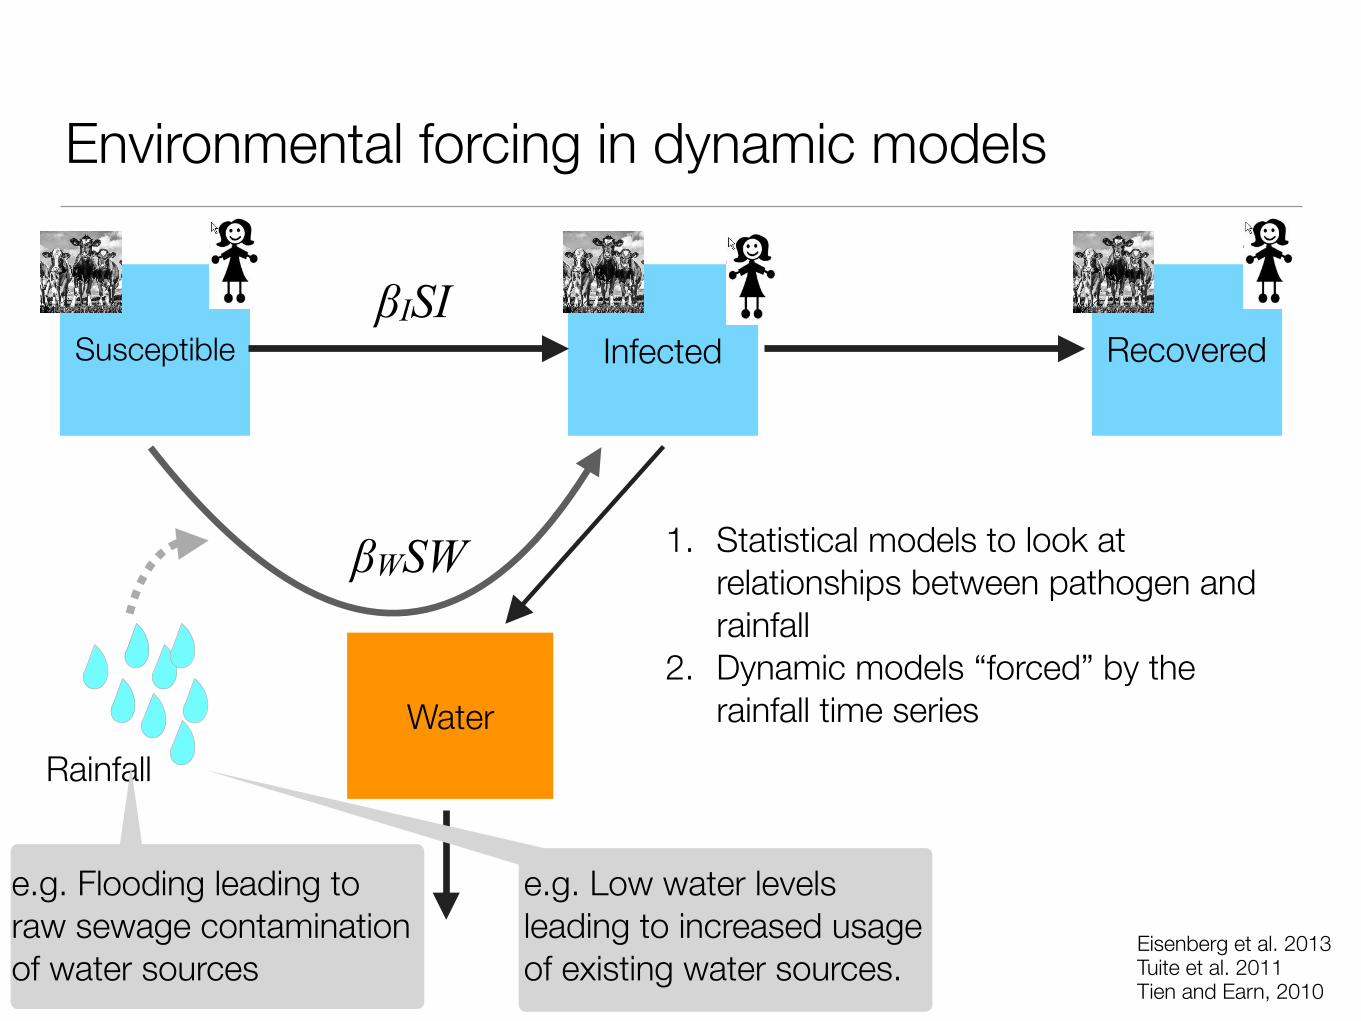
Environmental forcing in dynamic models
Eisenberg et al. 2013 Tuite et al. 2011 Tien and Earn, 2010
Susceptible Infected RecoveredβISI

Environmental forcing in dynamic models
Eisenberg et al. 2013 Tuite et al. 2011 Tien and Earn, 2010
Water
βWSW
Susceptible Infected RecoveredβISI

Environmental forcing in dynamic models
Eisenberg et al. 2013 Tuite et al. 2011 Tien and Earn, 2010
Water
βWSW 1. Statistical models to look at relationships between pathogen and rainfall
2. Dynamic models “forced” by the rainfall time series
Susceptible Infected RecoveredβISI

Environmental forcing in dynamic models
Eisenberg et al. 2013 Tuite et al. 2011 Tien and Earn, 2010
RainfallWater
βWSW 1. Statistical models to look at relationships between pathogen and rainfall
2. Dynamic models “forced” by the rainfall time series
Susceptible Infected RecoveredβISI
Environmental forcing in dynamic models
Eisenberg et al. 2013 Tuite et al. 2011 Tien and Earn, 2010
RainfallWater
βWSW
e.g. Flooding leading to raw sewage contamination of water sources
e.g. Low water levels leading to increased usage of existing water sources.
1. Statistical models to look at relationships between pathogen and rainfall
2. Dynamic models “forced” by the rainfall time series
Susceptible Infected RecoveredβISI

Using a “Cholera” model to think about leafy greens
Water
βW
Uncolonized plants
Colonized plants

Water
βW
Uncolonized plants
Colonized plants
Rainfall
temperature, UV, humidity etc.
spray vs. flood irrigation
environmental conditions, plant
lifecycle

Manure
βM
Uncolonized plants
Colonized plants
temperature, UV, humidity etc.
mechanism of application
environmental conditions, plant
lifecycle

Pre-harvest interventions for animal products
1. management practices to decrease animal exposure to pathogens in the farm environment
2. reducing contacts between different species
3. prevent contamination of feed and water sources
4. surveillance for “super-shedders”
5. vaccination

Farm environment
βE
Uncolonized cattle (S)
Colonized cattle (I)
temperature, UV, humidity etc.
βCI

Farm environment
βE
Uncolonized cattle (S)
Colonized cattle (I)
temperature, UV, humidity etc.
βCI
Super-shedding cattle (IS)
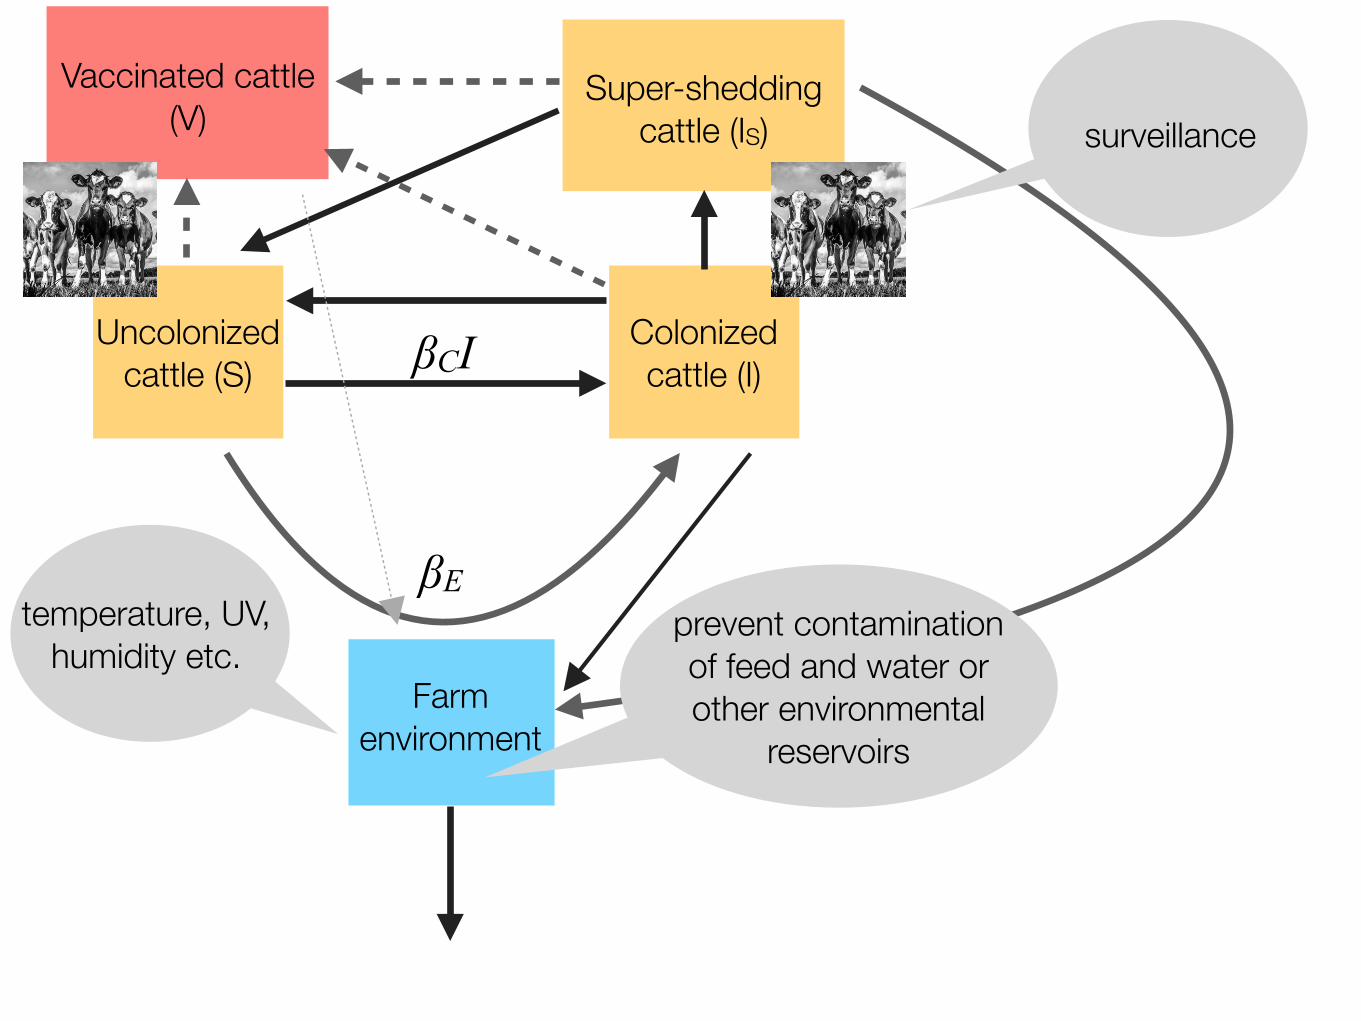
Vaccinated cattle (V)
Farm environment
βE
Uncolonized cattle (S)
Colonized cattle (I)
temperature, UV, humidity etc.
βCI
Super-shedding cattle (IS) surveillance
prevent contamination of feed and water or other environmental
reservoirs

Health economic challenges for One Health
• Is the intervention good value for money?
• Societal and governmental perspectives consider all direct and indirect costs regardless of to whom the costs are accrued.
An example
There are no direct economic implications for farmers with VTEC colonized cattle.
Farmers pay out of pocket for vaccine (economic loss for farmers)
Healthcare system benefits as a result of farmers out of pocket expenses with no benefit being seen by the farmers.
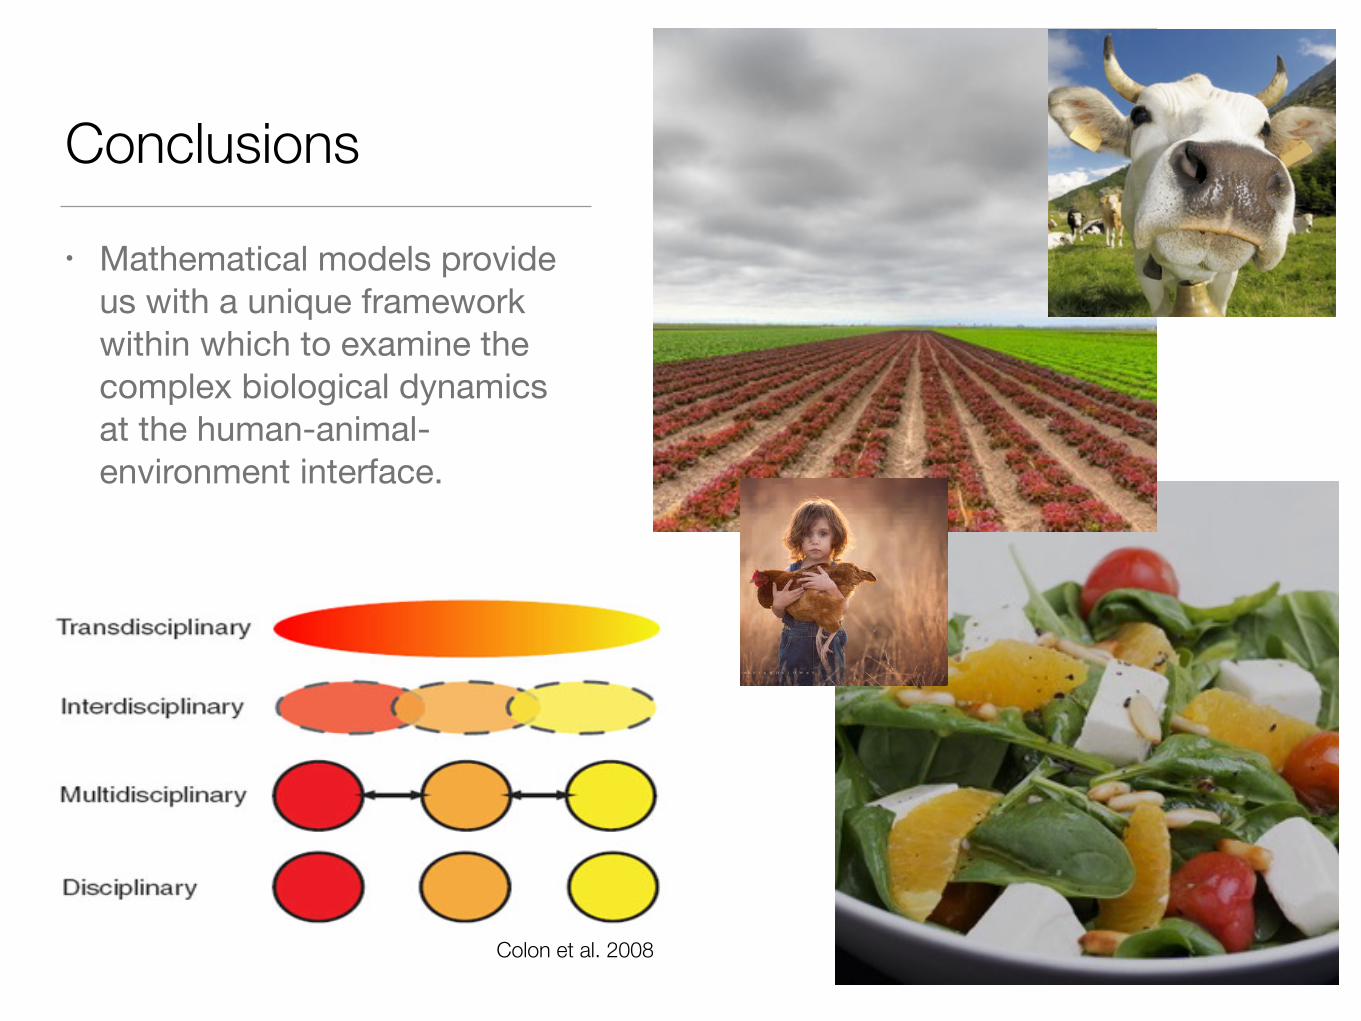
Conclusions
• Mathematical models provide us with a unique framework within which to examine the complex biological dynamics at the human-animal-environment interface.
Colon et al. 2008