a place to call home - eric against immigrants doesn’t seem to be part of their daily ... they...
TRANSCRIPT
A Place to Call Home:What Immigrants Say Now About Life in America

By Scott Bittle and Jonathan Rochkind
With Amber Ott and Paul Gasbarra
Prepared with support from
Download a copy of “A Place to Call Home” at http://www.publicagenda.org/pages/immigrants
Design: Sanura Weathers | Copyediting: Jason Miller and Sona Vogel
This work is licensed under the Creative Commons Attribution-Noncommercial-Share Alike
3.0 Unported License. To view a copy of this license, visit http://creativecommons.org/
licenses/by-nc-sa/3.0/ or send a letter to Creative Commons, 171 Second Street, Suite 300,
San Francisco, California, 94105, USA.
A Place to Call Home:What Immigrants Say Now About Life in America
Introduction 6
Part One: The Right Move 10Overall, immigrants say they’re quite satisfied with life in the United States , for themselves and their children. Discrimination against immigrants doesn’t seem to be part of their daily lives, because while majorities say it exists, majorities also say they haven’t experienced much discrimination personally. Right now, the biggest concern for immigrants is much the same as for native-born Americans: the economy and their own financial well-being. The economic tumult in our society is shaping some of their perceptions —and motivations.
Immigrants believe discrimination is commonplace, but the numbers seem stable, +
and most say it happens to “the other guy.”
The government’s immigration services get better marks than they did seven years ago, +
in Public Agenda’s study Now That I’m Here.
There is a drop in overall satisfaction among immigrants with life in the United States, +
and the state of the economy may be driving it.
Part Two: Fitting In 20Most immigrants say that they have become comfortable in the United States quickly, yet ties to their birth countries have become stronger since 2002, particularly among recent immigrants. Most of the immigrants we surveyed either were citizens already or were in the process of being naturalized. For most of them, citizenship was a practical step. So is learning to speak English, with most immigrants reporting that it is difficult to get ahead or keep a job without language skills.
In focus groups, immigrants often said life in the United States +
was not what they thought it would be.
Immigrants report closer ties to birth country than they did seven years ago. They spend more time +
with people from their birth country and are more likely to call home and send money.
Significant numbers of immigrants came to the United States without being able to speak +
English, and more than half of them still consider their language skills fair or poor. However, they consider speaking English important for getting ahead, and most say they’ve taken classes to improve their ability.
Growing numbers of immigrants cite practical reasons for seeking U.S. citizenship: Securing +
stronger rights and protections and ease in obtaining a job are just as important as showing commitment and pride in America.
3+ A Place to Call Home: What Immigrants Say Now About Life in America +
Summary of Findings

Part Three: Common Threads, Different Voices 28Although there are common themes among immigrants, certain groups do have unique perspectives. We chose to look at two groups, immigrants from Mexico and immigrants who identify themselves as Muslims as these groups are at the forefront of immigration policy and perceptions. Mexican immi-grants are more likely to say they’re happy in the United States, but also significantly more likely to perceive discrimination against immigrants. They’re also more likely to be lower-income and perhaps face more language barriers. Muslims, by contrast, are less likely to report discrimination and overwhelmingly more likely to say the United States will be their permanent home.
Mexican immigrants are more likely to say the United States is a better place to raise children +
and are less likely to speak English when they arrive. Overwhelming numbers say that the United States is a better place to make a living than is their birth country.
Mexican immigrants express particularly strong concerns about discrimination. +
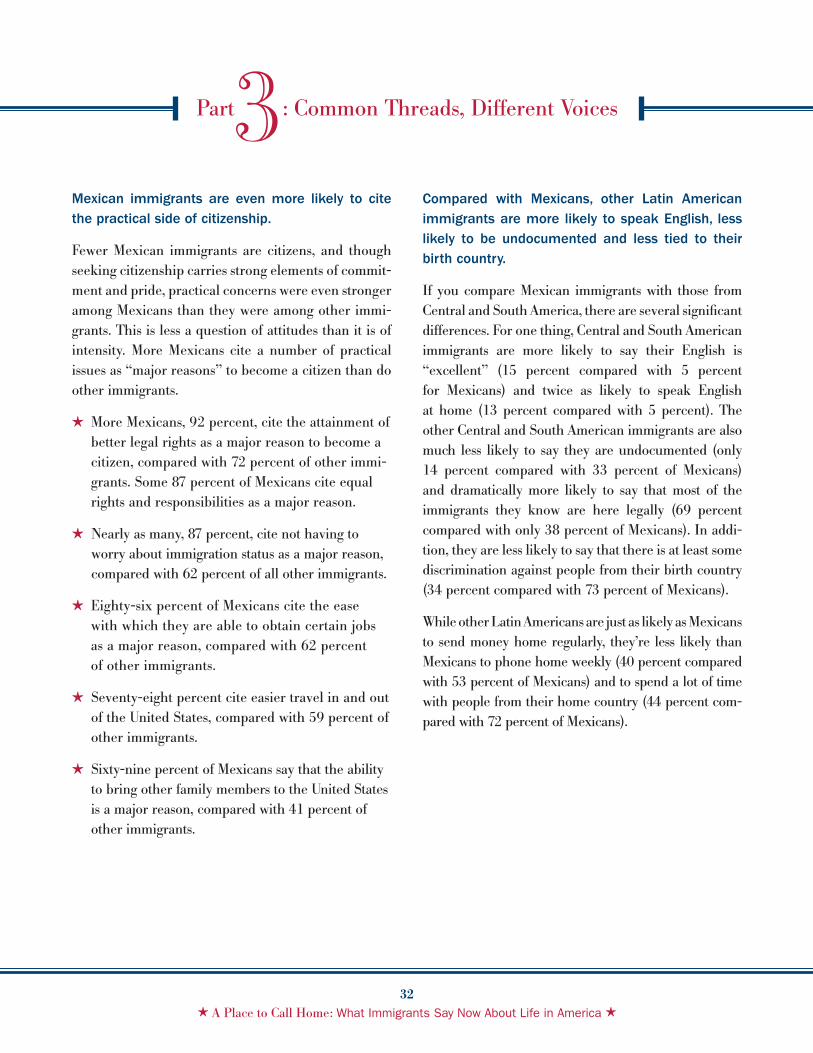
Mexican immigrants are even more likely to cite the practical side of citizenship. +
Compared with Mexicans, other Latin American immigrants are more likely to +
speak English, more likely to be legal residents and less tied to their birth country.
Muslim immigrants in America do not feel disaffection with the nation—far from it. +
If anything, their embrace of the United States and their expressions of patriotism are stronger than those of the other groups.
When it comes to immigration policy, majorities believe that illegal immigrants will become +
productive citizens, and strong majorities favor a “guest worker” program and a “path to citizenship” for immigrants who are legal residents. But some immigrants, particularly older ones and those from, certain regions, have reservations
4+ A Place to Call Home: What Immigrants Say Now About Life in America +
Summary of Findings

Methodology 42
Full Survey Results 46
Characteristics of the Sample 70
Acknowledgements 74
5+ A Place to Call Home: What Immigrants Say Now About Life in America +
Summary of Findings

Introduction
C ongress and the Bush administration tried to reform immigration policy in 2006 and failed. A year later they
tried again, with no more success. Now President Barack Obama and congressional leaders say they’ll try
once more. Political leaders are speaking of it in just those terms: one last chance, one last try.
“We’ve got one more chance to do this,” said Sen. Lindsey Graham, R-S.C., after a White House meeting
in June. “If we fail this time around, no politician is going to take this up in a generation.”1
Perhaps that’s hyperbole, but whether it is or not, the stakes remain high. It’s a cliché to say that America is a
nation of immigrants, but like most clichés, this one began as a statement of simple truth. Another truth is that if
we’re going to overhaul immigration policy, it only makes sense to listen to the people who will be most affected
by it: immigrants. To craft a just and practical policy, we need to see America through the immigrant’s eyes. That’s
true whether you favor an open door or a higher fence. You can’t hope to implement sound strategies unless you
understand what brings people to the United States and what they think about the nation once they get here.
1 “Guest Worker Program Poses Obstacle for Obama on Immigration Push,” June 25, 2009, The New York Times,
http://thecaucus.blogs.nytimes.com/2009/06/25/guest-worker-program-poses-obstacle-for-obama-on-immigration-push
That’s what Public Agenda hopes to accomplish with A Place to Call Home: What Immigrants Say Now About Life in America, the follow-up to our pioneering 2002 survey of immigrants, Now That I’m Here. In A Place to Call Home, we’ve extended our sampling to gain a more detailed view of Hispanics and Muslims. Because we surveyed both cell phone owners and landline households, we were able to capture the per-spectives of undocumented immigrants as well. Just as important, we can now see trend data on how immi-grants view a tumultuous period in history.
The past seven years have seen ferocious debate over immigration, even as legislation has remained stalled. The United States admits more than 1 million immi-grants a year, and the Census Bureau reports 12 percent of the population is foreign-born at 34.2 million. In addition, there are an estimated 12 million illegal or undocumented immigrants in the country.2
In 2002, the immigration debate was haunted by the ghosts of the September 11 terrorist attacks and the question of how to keep the country secure from further acts of terrorism. Those concerns haven’t gone away, of course, but the economic and cultural tensions that have always shaped immigration policy have reasserted themselves. While attempts to change immigration laws have failed, they’ve also kept the issue at the forefront of public debate. Employers who hire illegal immigrants are under increased pressure from the federal govern-ment to comply with existing laws, and a number of state and local governments have enacted their own laws to restrict services to immigrants without docu-ments. All this has led to a fever-pitch debate over how the country should deal with immigration.
One thing is clear from our research, and probably comforting to both sides of the immigration debate: The overwhelming majority of immigrants say they’re happy in the United States and would do it all over again if they could. Immigrants “buy in” to American society, for themselves and their children. They rate the United States as an improvement over their birthplace in almost all dimensions, and most say they expect their children to remain in this country. This sense of having made the right decision cuts across all groups, regard-less of income, immigration status or ethnic group.
Despite much rhetoric and a number of well-pub-licized incidents, many immigrants report that discrimination and government harassment aren’t a major part of their daily lives. Although many say discrimination does exist in the United States—against both immigrants in general and people from their birth country—most don’t report having personally encountered much discrimination. Thirty-eight percent of immigrants say they haven’t faced discrimination at all. Government immigra-tion officials get higher ratings now than they did in our 2002 survey.
Still, roughly one-quarter of immigrants report running into at least some discrimination personally, and about 1 in 10 immigrants reports having done so “a great deal.” One cannot discount the power these encounters have and the extent to which they reso-nate, not only for the immigrants themselves but also for their communities. When only a few individuals report bad experiences but solid majorities are con-vinced that discrimination exists, it’s a fair assumption that those few incidents can have lasting echoes.
2 “Yearbook of Immigration Statistics 2008,” Department of Homeland Security,
http://www.dhs.gov/ximgtn/statistics/publications/yearbook.shtm.
7+ A Place to Call Home: What Immigrants Say Now About Life in America +
Introduction
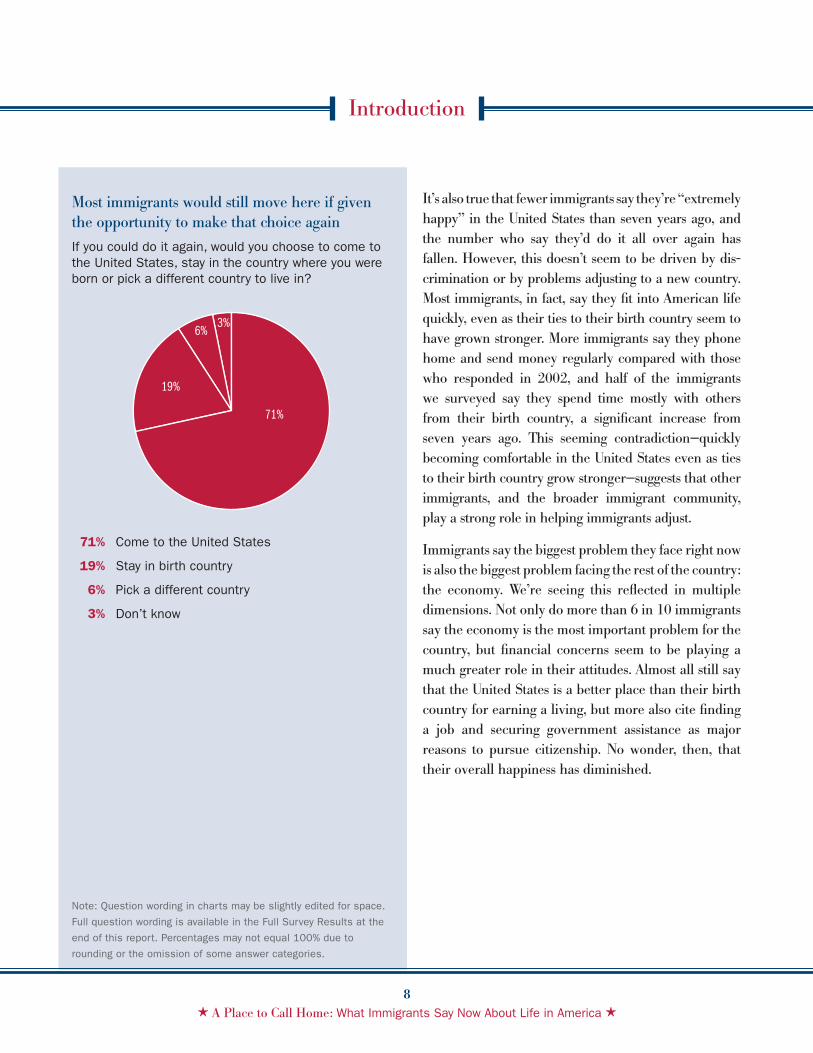
Most immigrants would still move here if given the opportunity to make that choice againIf you could do it again, would you choose to come to the United States, stay in the country where you were born or pick a different country to live in?
71% Come to the United States
19% Stay in birth country
6% Pick a different country
3% Don’t know
71%
19%
6%3%
It’s also true that fewer immigrants say they’re “extremely happy” in the United States than seven years ago, and the number who say they’d do it all over again has fallen. However, this doesn’t seem to be driven by dis-crimination or by problems adjusting to a new country. Most immigrants, in fact, say they fit into American life quickly, even as their ties to their birth country seem to have grown stronger. More immigrants say they phone home and send money regularly compared with those who responded in 2002, and half of the immigrants we surveyed say they spend time mostly with others from their birth country, a significant increase from seven years ago. This seeming contradiction—quickly becoming comfortable in the United States even as ties to their birth country grow stronger—suggests that other immigrants, and the broader immigrant community, play a strong role in helping immigrants adjust.
Immigrants say the biggest problem they face right now is also the biggest problem facing the rest of the country: the economy. We’re seeing this reflected in multiple dimensions. Not only do more than 6 in 10 immigrants say the economy is the most important problem for the country, but financial concerns seem to be playing a much greater role in their attitudes. Almost all still say that the United States is a better place than their birth country for earning a living, but more also cite finding a job and securing government assistance as major reasons to pursue citizenship. No wonder, then, that their overall happiness has diminished.
8+ A Place to Call Home: What Immigrants Say Now About Life in America +
Note: Question wording in charts may be slightly edited for space.
Full question wording is available in the Full Survey Results at the
end of this report. Percentages may not equal 100% due to
rounding or the omission of some answer categories.
Introduction

So as the debate renews on immigration reform, what do immigrants want? What path do they believe the nation should take?
For immigrants, there are several overarching themes for reform. A solid majority says that illegal immigrants become productive citizens—almost exactly the oppo-site of the view held by the general public. Perhaps not surprisingly, immigrants support new measures to bring illegal or undocumented immigrants more firmly into the mainstream. An overwhelming 84 percent support a “guest worker” program, while more than 7 in 10 back a “path to citizenship” for undocumented immi-grants who have no criminal record and have shown a commitment to the United States, though support for this latter varies according to age and ethnic group. As a whole, however, immigrants back some method of bringing illegal immigrants into society.
This report was based on six focus groups and a national telephone survey of 1,138 foreign-born adults. The margin of error is plus or minus 4 percent, although the margin is higher when comparing sub-groups. There are plenty of methodological hurdles intrinsic to interviewing this population. As in our prior study, we limited our definition of immigrants to people born outside the United States, and in order to capture their recollections of coming to America, we excluded anyone who immigrated under 5 years of age. And as before, we conducted the telephone survey in English and Spanish.
This time, we wanted to take a closer look at partic-ular ethnic groups that are often overlooked because of their relatively small size in the United States, including Middle Easterners, South and East Asians, and Central and South Americans. To do so, we sup-plemented our random-digit dialed (RDD) sample
with a list of phone numbers of those likely to identify with one of these ethnicities. The list was provided by Ethnic Technologies, a leading provider of multicul-tural lists. Within each household, an adult member was chosen randomly and screened to ensure that he or she matched our immigrant criteria.
Since we conducted our last survey on immigrants in 2002, the number of people in the United States who use a cell phone has increased significantly, and this number is even greater for immigrant popula-tions. According to both the 2009 National Health Interview Survey (NHIS) and the General Social Survey (GSS), 22 percent of foreign-born residents of the United States do not own a landline telephone but do own a cell phone. Thus we included a dual-frame cell phone sample alongside our landline sample to capture immigrants who do not have access to a land-line. In addition, our stratified random dialing design ensured that no matter where an immigrant lived in the United States, whether in a location that has a high density of immigrants or one where immigrants are fewer or farther between, all immigrants had a chance to be included in our survey.
One final difference from our last immigrant study: In this survey, we chose to ask respondents about their legal status in the United States. Before weighting, eight percent of our sample say that they are undocumented, and 57 percent say that they are United States citizens. Of those who say they are not citizens, 20 percent say they are in the process of becoming a citizen and 76 percent are not in the process. But 64 percent of the noncitizens say they plan to seek citizenship in the future.
A Place to Call Home is funded by the Carnegie Corporation of New York.
9+ A Place to Call Home: What Immigrants Say Now About Life in America +
Introduction

Part 1: The Right Move
Overall, immigrants say they’re quite satisfied with life in the United States, for themselves and their chil-
dren. Discrimination against immigrants doesn’t seem to be part of their daily lives. Although majorities
say it exists, majorities also say they haven’t personally experienced much of it. Right now, the biggest
concern for immigrants is much the same as for native-born Americans: the economy and their own financial well-
being. The economic tumult in our society may be shaping some of their perceptions—and motivations.
For any decision in life, whether it involves a job accepted or lost, a marriage made or ended, a school selected
or a vote cast, the evaluation comes down to one question: Would you do it all over again? There may be regrets
or dissatisfactions; that’s part of the human condition. But if life came with a time machine or a reset button,
would you make the same choice?
Part 1: The Right Move

By that standard, immigrants in America are clearly happy with their choice. More than 7 in 10 (71 percent) report that if they could do it all over again, they’d still come to the United States. Nor are they likely to give up and go home; indeed, equally large numbers (70 percent) say that they intend to make the United States their permanent home.
That goes for their children as well. About three-quarters of immigrant parents (74 percent) say it’s unlikely their children will want to live in their birth country, with a strong 58 percent saying it’s “very unlikely.”
The reasons for this seem straightforward: Immigrants buy in to American society. There’s always been a fierce debate among pundits and political scientists about “American exceptionalism,” the idea that the United States is unique among nations. Some find this idea ennobling, others pernicious. Maybe it’s no surprise, since immigrants have volunteered to build their lives here, but the people we surveyed have very little doubt: 76 percent say the United States is “a unique country that stands for something special in the world.” Only 20 percent disagree, saying that the United States is “just another country that is no better or worse than any other.”
Overall, would you say that you are extremely happy, somewhat happy or generally disappointed with life in the United States?
2009: Extremely happy Somewhat happy 2002*: Extremely happy Somewhat happy
If you could do it again, would you choose to come to the United States, stay in the country where you were born or pick a different country to live in?
2009: Come to the United States 2002*: Come to the United States
Most immigrants say they are happy in the United States and say they would do it again given the chance, though numbers have declined since 2002
*Source: “Now That I’m Here,” Public Agenda 2003, survey conducted in 2002.
0 20 40 60 80 100%
71%
80%
0 20 40 60 80 100%
55% 41%
34% 53%
96%
87%
0 20 40 60 80 100%
71%
80%
0 20 40 60 80 100%
55% 41%
34% 53%
96%
87%
11+ A Place to Call Home: What Immigrants Say Now About Life in America +
Part 1: The Right Move

When asked to make specific comparisons about the United States and their birth country, the United States comes out far ahead on many of the fundamen-tals of daily life, things native-born Americans may take for granted. Strong majorities say that the United States does a better job than their birth country when it comes to:
Offering the opportunity to earn a good living +
(88 percent).3
Having a trustworthy legal system (70 percent). +
Making good health care available (67 percent). +
Maintaining a good education system +
(62 percent).
In fact, three-quarters of immigrant parents of school-age children say their child is getting a better education in the United States than they themselves received at that same age.
Smaller majorities also give the United States an edge in areas like “being a good place to raise chil-dren” and “having a free and independent media” (both 55 percent).
Immigrants believe discrimination is common-place, but the numbers seem stable, and most say it happens to “the other guy.”
The history of immigration in the United States shows that the ideas of an open door and a cold reception are not incompatible in the public’s view. There’s often been discrimination against people based on their race and ethnicity, whether they were born in the United States or not.
That said, although our survey finds that immigrants recognize discrimination in the American experi-ence, it isn’t necessarily a substantial part of their personal experience.
More than 6 in 10 immigrants (63 percent) say there’s some discrimination against immigrants in the United States today. One in five (22 percent) say there’s “a great deal” of discrimination. And 43 percent say there’s at least some discrimination against people from their birth country (15 percent say “a great deal”).
However, only 9 percent of immigrants say that they have personally experienced “a great deal” of dis-crimination, with another 16 percent reporting that they experienced “some.” That means 73 percent of immigrants say they’ve experienced “only a little” (35 percent) or no discrimination (38 percent). The number of those who have personally experienced “a great deal” or “some” discrimination does not vary by immigration status, religion, level of English-language ability or country of origin.
3 In the survey, respondents were asked specifically about the country in which they were born unless they declined to specify their home country
(six respondents, or 0.5 percent of those surveyed), in which case they were asked to refer to their “home country.” For example, someone from
France would be asked the question: “Do you think the United States or France does a better job when it comes it to… having more opportunity to
earn a good living?”
12+ A Place to Call Home: What Immigrants Say Now About Life in America +
Part 1: The Right Move Part 1: The Right Move
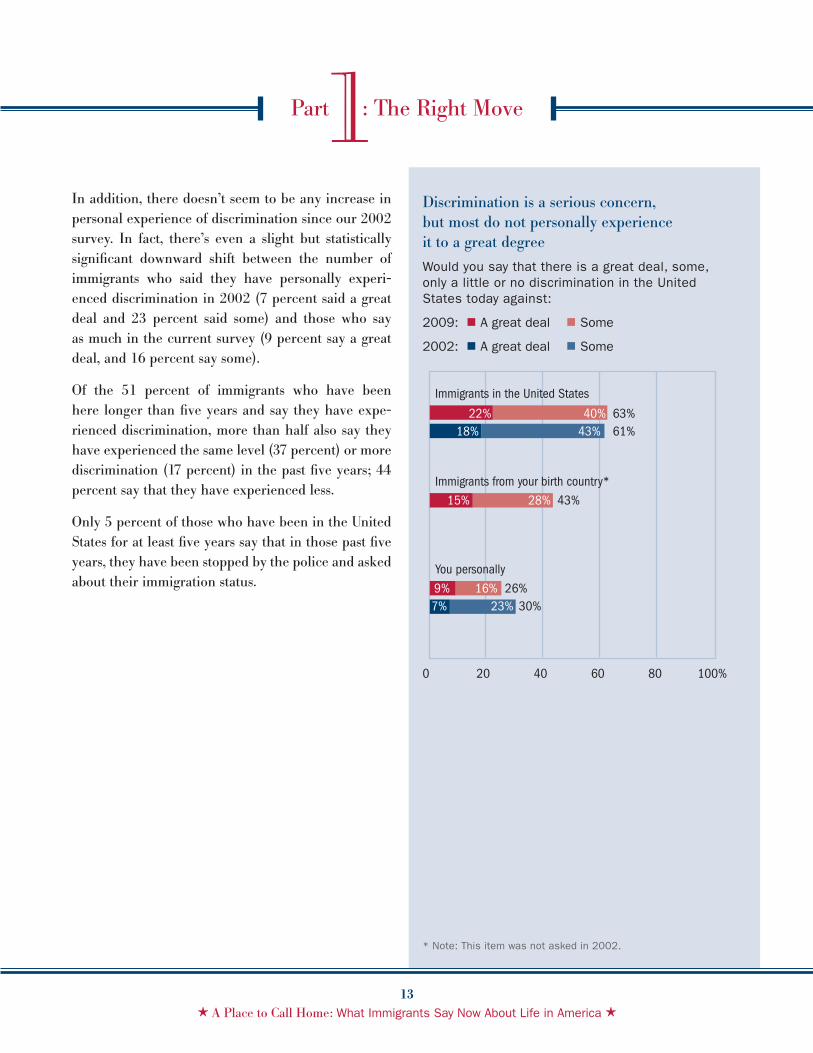
In addition, there doesn’t seem to be any increase in personal experience of discrimination since our 2002 survey. In fact, there’s even a slight but statistically significant downward shift between the number of immigrants who said they have personally experi-enced discrimination in 2002 (7 percent said a great deal and 23 percent said some) and those who say as much in the current survey (9 percent say a great deal, and 16 percent say some).
Of the 51 percent of immigrants who have been here longer than five years and say they have expe-rienced discrimination, more than half also say they have experienced the same level (37 percent) or more discrimination (17 percent) in the past five years; 44 percent say that they have experienced less.
Only 5 percent of those who have been in the United States for at least five years say that in those past five years, they have been stopped by the police and asked about their immigration status.
Discrimination is a serious concern, but most do not personally experience it to a great degreeWould you say that there is a great deal, some, only a little or no discrimination in the United States today against:
2009: A great deal Some
2002: A great deal Some
* Note: This item was not asked in 2002.
0 20 40 60 80 100%
22% 40%
Immigrants in the United States
63%18% 43% 61%
15% 28%Immigrants from your birth country*
43%
9% 16% 26%7% 23% 30%
You personally
Part 1: The Right Move
13+ A Place to Call Home: What Immigrants Say Now About Life in America +
Part 1: The Right Move
The government’s immigration services get better marks than they did seven years ago.
While comprehensive immigration reform has eluded policymakers, there have been significant changes in how the government approaches immigration law. Since we first surveyed immigrants in 2002, the federal government split the old Immigration and Naturalization Service into two agencies, to separate processing visas and citizenship applications from enforcement of immigration laws. Federal officials also became more aggressive in enforcing immigra-tion laws after September 11, hiring more agents and making enough new detentions to create substantial backlogs in immigration courts.4
When it comes to their dealings with the government, nearly half of the immigrants (47 percent) we spoke with have had contact with “U.S. immigration ser-vices” in the past 10 years. Some 15 percent say that they had contact within the past year.5
Overall, immigrants gave federal immigration officials better ratings than did their counterparts in 2002. We saw a 10-point rise in the number of people giving pos-itive ratings (from 48 percent to 58 percent). Nearly 6 in 10 (58 percent) of current immigrants who recently dealt with immigration services say that it is easy to get information, and 21 percent say it’s “very easy.”
Immigrants who are not citizens but are legal resi-dents gave government immigration services about the same positive ratings as citizens. Undocumented immigrants were slightly more ambivalent about their experiences overall, but a majority gave positive or neutral ratings.
There is a drop in overall satisfaction among immi-grants with life in the United States, and the state of the economy may be driving it.
The global financial crisis, vast in scope and fright-ening in speed, has overwhelmed other public concerns in surveys over the past year. In this area, immigrants are no different from other Americans. In our survey, 6 in 10 (63 percent) immigrants volunteer the economy as the most important problem facing the nation, far ahead of any other issue. Other sources prove this point as well. Mexican government statis-tics show that fewer Mexicans are emigrating to the United States, and the ones already here are sending less money home, both trends Mexican officials attri-bute to the economy.6
The effect of the economy on immigrants’ attitudes in our survey may be apparent in a number of ways. Although strong majorities of immigrants seem content with life in the United States, there is less satisfaction than there was in 2002. Fewer say they’d “do it all
4 “Study Finds Immigration Courtrooms Backlogged,” June 17, 2009,
The New York Times, http://www.nytimes.com/2009/06/18/us/18immig.html
5 Our 2002 survey was conducted when immigration enforcement and citizenship applications were both handled by the same agency,
the Immigration and Naturalization Service (INS). Our survey questions referred specifically to the INS. Since then, the INS has split into
two agencies: Citizenship and Immigration Services (CIS) and Immigration and Customs Enforcement (ICE). Our 2009 survey questions
refer to “U.S. immigration services.”
6 See, for example, “Mexican Data Show Migration to the U.S. in Decline,” May 14, 2009, The New York Times,
http://www.nytimes.com/2009/05/15/us/15immig.html; and “Remittances by Mexicans in U.S. Plummet,” June 1, 2009,
The New York Times, http://www.nytimes.com/2009/06/02/world/americas/02mexico.html
14+ A Place to Call Home: What Immigrants Say Now About Life in America +
Part 1: The Right Move Part 1: The Right Move

Immigrants say the United States is a unique countryWhich of these two statements comes closer to your own view?
76% The United States is a unique country that stands for something special in the world
20% The United States is just another country that is no better or worse than any other
4% Don’t know/refused
76%
20%
4%
… And they give the United States consistently better ratings than their birth countryPlease tell me if you think the United States or your birth country does a better job when it comes to the following item or if they are about the same.
United States Birth Country About the Same
Being a good place to raise children55%
18% 25% 43%
0 20 40 60 80 100%
Having a free and independent media as well as forms of free expression
55%9% 34% 43%
Having a higher standard of morality49%
16% 31% 47%
Letting people practice the religion they choose44%
5%50% 55%
Having more opportunity to earn a good living88%
2%9% 11%
Having a legal system you can trust70%
23% 28%5%
Making good health care available67%
15% 16% 31%
Having a good education system62%
14% 23% 37%
Part 1: The Right Move
15+ A Place to Call Home: What Immigrants Say Now About Life in America +
Part 1: The Right Move

While U.S. immigration services are now more likely to get positive ratings…As far as you remember, was your experience dealing with government immigration services an overall positive one, an overall negative one or somewhere in the middle?*
2009 2002**
… A substantial minority still finds it difficult to get information In your experience, how hard is it to get information and answers about immigration and naturalization issues from the government? Is it easy or hard?*
* Note: Asked of those who had dealings with government
services in the past ten years. In 2002, wording used
Immigration and Naturalization Services (I.N.S.).
**Source: “Now That I’m Here,” Public Agenda 2003.
21% Very easy
36% Somewhat easy
26% Somewhat hard
13% Very hard
36%
26%
21%
13%
* Note: Asked of those who had dealings
with government services in the past ten years.
0 20 40 60 80 100%
Overall positive experience
58%48%
Overall negative experience
7%12%
Somewhere in the middle31%
35%
16+ A Place to Call Home: What Immigrants Say Now About Life in America +
Part 1: The Right Move

So what defines those immigrants who believe that they made the wrong choice by coming to the United States? We tried to find common features among the one-quarter of immigrants surveyed who say they wouldn’t come here if they had it to do over again. That includes those who say they would have stayed in their birth country (19 percent) and those who would have immi-grated somewhere else (6 percent).
The biggest differences between this group and other immigrants seem to be language and discrimination.
Language is by far the biggest difference, though the +same number (76 percent) say they came to this country knowing either no or only a little English, 74 percent report that their English is fair or poor (34 percent of them say that it is poor compared with 24 percent among those who came here knowing little or no English and say they would immigrate again).
They’re significantly more likely to say that there is a +“great deal” of discrimination against immigrants (38 percent, compared with 17 percent among those who say they’d do it all over again).
One in five say that they have personally experi- +enced a “great deal” of discrimination, more than twice the number of the overall sample, and only 6 percent among those who say they’d immigrate again say the same.
Most of these regretful immigrants have been in the +United States for a substantial period of time. More than half, 56 percent, came to the United States before 2001.
Other potential dividing lines don’t seem to make much difference. This isn’t a matter of income, religion or edu-cation; this group shows no real differences in these areas when compared with other immigrants.
Nor is it a question of ethnicity or birth country. Some 29 percent, the largest single group, were listed as “other,” in other words, not Asian, Middle Eastern, Central or South American or Mexican. Latin Americans do make up half this group when Mexicans (28 percent) are com-bined with Central and South Americans (22 percent).
Finally, this group is more likely to be undocumented (27 percent), though that number remains relatively small.
Part 1: The Right Move So Who are the Disenchanted?
over again,” falling from 80 percent in 2002 to 71 percent now. In addition, although an overwhelming 87 percent say they’re happy with life in the United States, there’s been a significant drop in enthusiasm. In 2002, 55 percent said that they were “extremely happy,” compared with only 34 percent now.
To some extent, these numbers match surveys of the general public over the past year, which have found record numbers of Americans saying the country is “on the wrong track.”7 With immigrants, however, there are also shifts in several other areas that suggest economic strains are starting to tell.
In both 2002 and today, strong majorities of immigrants say it’s important to work hard and stay off govern-ment assistance. But those numbers have shifted. For example, those who think it is “extremely important” for immigrants to stay off welfare has dropped from 73 percent in 2002 to 63 percent today. There’s also an increase in the number of immigrants who say that qualifying for government programs like Medicaid or food stamps is a major reason for becoming a citizen. Only 36 percent of immigrants say that this is a major reason to pursue citizenship, but this is 14 points higher than when we asked in 2002.
If anything, economic concerns are stronger among more recent and undocumented immigrants. Newer immigrants (those who arrived in 2001 or later) are more likely to cite getting a job (82 percent versus 65 percent) and being eligible for government programs (46 percent versus 31 percent) as major reasons to
become citizens. In addition, 86 percent of undocu-mented immigrants cite the economy as their number one concern (compared with 59 percent of citizens and other legal residents).
At the same time, as you will see in the other find-ings, other concerns that immigrants might have, including fitting into the American fabric, expe-riencing discrimination and concerns about their children, did not change or have even decreased since 2002. This strongly suggests that the current state of the economy may be the driving force behind the lower levels of satisfaction.
And though the survey found that almost 9 in 10 say the United States was a better place than their birth country for earning a good living, our focus groups did pick up some suggestions that this might change, at least for some immigrants. A number of focus group participants pointed out that the standard of living is rising in other countries, such as China and India, which means that similar opportunities may be opening up there as well.
“Nowadays, for example in China, people make [a] very decent [living]. If you’re looking at the relative purchasing power, people in China are pretty com-fortable, as they are here. Talking about opportunity-wise, I have a lot of friends who are, relatively speaking, much better off than my friends here.” - A San Francisco participant originally from China
7 In a recent CBS News/New York Times Poll, half of Americans said that things in this country have pretty seriously
gotten off on the wrong track, compared with 44 percent who said things are generally going in the right direction (June 2009).
18+ A Place to Call Home: What Immigrants Say Now About Life in America +
Part 1: The Right Move

Part 1: The Right Move

Part Two: Fitting InPart 2: Fitting InPart 2: Fitting In
Most immigrants say that they have become comfortable in the United States quickly, yet ties to their
birth countries have become stronger since 2002, particularly among recent immigrants. Most of the
immigrants we surveyed either were citizens already or were in the process of being naturalized. For
most of them, citizenship is a practical step. So is learning to speak English, with most immigrants reporting
that it is difficult to get ahead or keep a job without language skills.
Immigrants clearly buy into American values, but how long does it take them to feel comfortable in American
society? Although immigrants embrace what the United States stands for, this is no guarantee that they are
able to fit in on a day-to-day basis.

The immigrants we surveyed don’t seem to feel that fitting in is a major barrier and in fact say the process moved quickly. More than three-quarters (77 percent) say that it takes fewer than five years to “feel comfort-able here and part of the community,” and nearly half (47 percent) say it took fewer than two.
Such easy comfort with their adopted home generally isn’t being propelled by money or a common lan-guage. Just more than three-quarters (76 percent) say that they came to the United States with “very little money,” and only 20 percent say they had “a good amount of money to get started.” Some 45 percent say that they came to this country not speaking any English at all, an increase of 10 points since 2002. In general, we aren’t talking about people who move freely between nations, so-called citizens of the world. We’re talking about people who say they’re taking a big financial and cultural gamble when the emigrate to the United States.
In focus groups, immigrants often said life in the United States was not what they thought it would be.
In the focus groups we conducted as part of this study, one of the consistent themes was of immigrants being surprised by how much work it takes to succeed in the United States. Even with all of its advantages over their birth countries, the reality for many immigrants is that it can be difficult to live in the United States and achieve a good standard of living.
“There’s the assumption that when you come here you will become wealthy very fast and very easily. I have to work 12, 16 hours a day to make a living. [In my birth country]…they work, like, from nine until two and then go home.” - A woman in the Detroit, Michigan, focus group
Her sentiment is partly borne out by the survey, which also asked how often immigrants found themselves living “paycheck to paycheck.” Some 70 percent of immigrants reported doing so “always,” “most of the time” or “sometimes.” When Newsweek asked the same question of the general public in January 2009, only 59 percent said they lived paycheck to paycheck.8
Among our focus groups, there was a general sense that America has no better publicist than Hollywood on this point—although movies and television often broadcast a misleading picture.
“All the movies [are] just great propaganda…like it’s a lot of fun and [you have] a lot of money and all that. You don’t think about, like, you have to pay [the] mortgage. You don’t know.” - A man in New York
8 When asked, “How often, if ever, do you and your family live from paycheck to paycheck: always, most of the time, sometimes, hardly ever
or never?” 23 percent said always, 16 percent said most of the time, 20 percent said sometimes, 17 percent hardly ever and 21 percent
never (Princeton Survey Research Associates International/Newsweek Poll, January 2009).
21+ A Place to Call Home: What Immigrants Say Now About Life in America +
Part 2: Fitting In

“When I came here, the first thing I imagined was I want to live la vida loca, the great life. When I recently arrived here, I wound up in an area that was very bad, in a two-bedroom apartment where 12 people were living. They were sharing their rent, and I said, ‘What have I gotten myself into?’ With time, I wound up renting another apartment. I didn’t imagine it would be like this.” - A woman in the Los Angeles focus group
Immigrants report closer ties to their birth country than they did seven years ago. They spend more time with people from their birth country and are more likely to call home and send money.
There’s some suggestion, however, that when it comes to being “comfortable” in communities, other immigrants play a critical role. Compared with results from 2002, more immigrants say that they spend time with people from their birth country and have closer ties there.
Half of the immigrants we surveyed (51 percent) say they spend “a lot” of time with people from their birth country, a jump of 14 points from 2002. Other kinds of birth-country ties have strengthened as well. One is the simple act of telephoning. The number of immigrants who tell us that they call home at least once a week rose 12 points (40 percent from 28 percent). Granted, this may be partly because telecommunications is better and cheaper than even a few years ago. Cell phones are common, international calling is less expensive and innovations like Skype and instant messaging make it easier to keep in touch.
These strengthened ties are not merely emotional, either; they’re financial. While there’s been no real change in the number of immigrants who say they send money to their birth country regularly, the number who say they do so “once in a while” increased 14 points, to 44 percent. And the number who say they never send money fell from 55 percent to 37 percent.
About one-quarter of our sample was made up of more recent immigrants, those who arrived since 2001. On the whole, their ties to the United States aren’t as strong. For example:
One-third say they will go back to live in their +
birth country someday.
Three in ten (32 percent) say it is likely that their +
children will one day want to live in their birth country (compared with 18 percent of those here before 2001).
One-third (34 percent) say that if they had it +
to do over, they would either stay where they were born (26 percent) or pick a different country (8 percent).
Six in ten (61 percent) say that they spend +
a lot of time with people from their birth country, compared with 47 percent of immigrants here before 2001.
More than twice as many (66 percent +
compared with 29 percent) telephone home at least once a week.
22+ A Place to Call Home: What Immigrants Say Now About Life in America +
Part 2: Fitting In Part 2: Fitting In

The recent immigrants in A Place to Call Home do seem to have different attitudes on these points than those who were recent arrivals in our 2002 study, Now That I’m Here—in other words, those who were new and still adjusting to American life in the 1990s as opposed to the 2000s. When we compare immi-grants who arrived between 2001 and 2009 with those from the 2002 study who arrived between 1990 and 2001, we find:
The 2001-2009 group are more likely to spend a +
lot of time with people from their birth country (61 percent versus 35 percent in the 2002 survey).
They’re also more likely to call their birth +
country at least once a week (66 percent compared with 38 percent).
And, of those who came to the United States +
knowing little or no English, they’re more likely to say they speak their native language most of the time at home (86 percent compared with 55 percent).
At least as far as perceptions go, a majority of the immi-grants we surveyed in 2009 (57 percent) suggest that recent immigrants “have the same respect for American laws and customs as immigrants like you.” About a third (32 percent) say that recent immigrants have less respect, though only 15 percent of immigrants who have arrived after 2001 agree.
Among our focus groups, there was a strong sense that American culture is a difficult force to resist. Many immi-grants mentioned the materialism often associated with America as a drawback, although how they responded to it depended greatly on their personal beliefs.
Significant numbers of immigrants came to the United States without being able to speak English, and more than half still consider their language skills fair or poor. However, they consider speaking English important for getting ahead, and most say they’ve taken classes to improve their ability.
One of the perpetual flashpoints in the immigration debate has been over language: to what extent immi-grants speak English and to what extent the nation should accommodate those who don’t. As mentioned above, a sizable number of immigrants (45 percent) come to the United States with no knowledge of English. Overall, about half of them (52 percent) report that they can read a book or newspaper “a little” or “not at all.” Even more of them, 63 percent, consider their ability to speak English to be “fair” or “poor.”
This is a barrier, and immigrants know it. More than half of immigrants (52 percent) say it is “very hard” to get a job without knowing English (although, interest-ingly, that’s a 10-point decline from 2002), and more than half (56 percent) say that the United States should expect all immigrants to learn English.
Immigrants are willing to take practical steps to address this. Seven in ten of those who came to this country knowing very little or no English at all say that they’ve taken classes to improve their English, a jump of 23 percent from 2002. Nearly three-quarters (74 percent) of immigrants overall say that it is more important for schools to teach immigrant children English as quickly as possible than it is to teach them other subjects in their native language. Some 88 percent of those with school-age children consider their child’s English to be “excellent” or “good.”
Part 2: Fitting In
23+ A Place to Call Home: What Immigrants Say Now About Life in America +
Part 2: Fitting In
Despite this, English isn’t the primary language in many immigrant homes. Nearly two-thirds (64 percent) of those who came to the United States speaking little or no English say that they mostly speak their native lan-guage at home, a 25-point increase from 2002.
There’s also a significant difference based on when immigrants came here and how much money they have. Ninety percent of those who still don’t speak English well came to the country with very little money. Recent immigrants (since 2001) are more likely to have arrived already knowing how to speak English (30 percent com-pared with 22 percent), but the recent immigrants who did not are also much more likely to speak their native language in the home (86 percent compared with 55 percent). These immigrants are also more doubtful about their skills, with 75 percent reporting that their English is “fair” or “poor,” compared with 58 percent of immigrants who have been here a while.
Growing numbers of immigrants cite practical reasons for seeking U.S. citizenship: Securing stronger rights and protections and the ease with which they are able to get a job are just as important as showing commitment and pride in America.
The ultimate in “fitting in” is to become a citizen. In our survey, 46 percent of those we spoke to say that they are not U.S. citizens, and 15 percent say they are undocumented.9 Of the noncitizens who are legal resi-dents, 87 percent say they are either in the process or planned to become citizens in the future.
Among those who are citizens or plan to pursue citi-zenship, one-third say, becoming a U.S. citizen is “a dream come true.” A majority, however, view the step more matter-of-factly; 46 percent call it “necessary” and 17 percent “practical.”
When we ask all immigrants about specific reasons for becoming citizens, the top considerations are obtaining the right to vote and “better legal rights and protec-tions,” both at 78 percent. “Showing commitment and pride” came in at 71 percent, while “making it easier to get certain jobs” and not worrying about immigration status both came in at 69 percent.
Though these responses were consistent overall with those from our 2002 survey, there were some consider-able shifts. There are 14-point increases in those who say getting certain jobs and making it easier to travel are major reasons to become citizens. Qualifying for gov-ernment programs like Medicaid and food stamps also saw a 14-point increase, although, as noted, this still remains quite low on the overall list, with 36 percent calling it a major reason.
There was also a 13-point increase among those who say that a major reason to seek citizenship was to make it easier to bring other family members to the United States (49 percent) and an 11-point increase among those who wished to dispel their worries about their immigration status.
9 Undocumented immigrants were identified with the following question: Before you answer the next question, I want to assure you that this
interview is totally confidential. Some immigrants have gotten all of their documents together and become legal residents. Other immigrants
are still preparing their documents and are considered undocumented. Are you a legal resident, or are you an undocumented immigrant?
24+ A Place to Call Home: What Immigrants Say Now About Life in America +
Part 2: Fitting In Part 2: Fitting In

Citizens and legal residents consider U.S. citizenship “necessary” and “practical” Which of these best describes what becoming a U.S. citizen means to you?*
46% Something necessary
33% A dream come true
17% Something practical
1% Something not so important
2% Don’t know/refused
Recent immigrants have closer ties to their birth country Recent from 2009 survey (2001-2009)
Recent from 2002 survey (1990-2001)*
*Source: “Now That I’m Here,” Public Agenda 2003.
** Note: Asked only of those who came
to the United States speaking little or no English.
46%
33%
17%2%1%
* Note: Asked only of citizens, those in the process
of becoming a citizen, and those who are planning
to become a citizen in the future.
0 20 40 60 80 100%
61%35%
66%38%
86%55%
Those saying “a lot” of the people they know and spend time with come from the country where they were born
Those saying they telephone family or friends in their birth country at least once a week
Those saying they speak their native language most of the time in their home**
Part 2: Fitting In
25+ A Place to Call Home: What Immigrants Say Now About Life in America +
Part 2: Fitting In

Equal rights and commitment lead the reasons for pursuing citizenship although immigrants are increasingly likely to favor practical benefitsFor each of the following, please tell me if it is a major reason for becoming a citizen.
2009: Major Minor
2002*: Major Minor
*Source: “Now That I’m Here,” Public Agenda 2003.
** Note: Not asked in 2002.
Practical Bene�ts
0 20 40 60 80 100%
To have equal rights and responsibilities**
To get the right to vote
To have better legal rights and protections in the United States
To show a commitment and pride in being an American
80% 88%8%
78% 90%76% 91%
12%15%
78% 88%70% 86%
10%16%
71% 84%65% 86%
14%21%
To make it easier to get certain jobs
82%77%
69%55%
13%22%
0 20 40 60 80 100%
To make it easier to bring other family members to this country
49% 17%36% 24%
66%60%
So you would not have to worry about your immigration status
69% 13%58% 20%
82%78%
To make it easier to travel in and out of the United States
65% 17%51% 26%
82%77%
36% 20%22% 20%
56%42%
To qualify for government programs like Medicaid or food stamps
Rights and Responsibilities Practical Bene�ts
0 20 40 60 80 100%
To have equal rights and responsibilities**
To get the right to vote
To have better legal rights and protections in the United States
To show a commitment and pride in being an American
80% 88%8%
78% 90%76% 91%
12%15%
78% 88%70% 86%
10%16%
71% 84%65% 86%
14%21%
To make it easier to get certain jobs
82%77%
69%55%
13%22%
0 20 40 60 80 100%
To make it easier to bring other family members to this country
49% 17%36% 24%
66%60%
So you would not have to worry about your immigration status
69% 13%58% 20%
82%78%
To make it easier to travel in and out of the United States
65% 17%51% 26%
82%77%
36% 20%22% 20%
56%42%
To qualify for government programs like Medicaid or food stamps
Rights and Responsibilities
26+ A Place to Call Home: What Immigrants Say Now About Life in America +
Part 2: Fitting In

Part 2: Fitting In
Part Three: Common Threads, Different VoicesPart 3 : Common Threads, Different VoicesPart 3 : Common Threads, Different Voices
A lthough there are common themes among immigrants, certain groups do have unique perspectives. We
chose to look at two groups, immigrants from Mexico and immigrants who identify themselves as
Muslims as these groups are at the forefront of immigration policy and perceptions. Mexican immigrants
are more likely to say they’re happy in the United States, but also significantly more likely to perceive discrimi-
nation against immigrants. They’re also more likely to be lower-income and perhaps face more language barriers.
Muslims, by contrast, are less likely to report discrimination and overwhelmingly more likely to say the United
States will be their permanent home.
When it comes to immigration policy, majorities believe that illegal immigrants will become productive citizens,
and strong majorities favor a “guest worker” program and a “path to citizenship” for undocumented immigrants.
But some immigrants, particularly older ones and those from certain groups, have reservations.

Mexican immigrants are more likely to say the United States is a better place to raise children and are less likely to speak English when they arrive. Overwhelming numbers say that the United States is a better place to make a living than their birth country.
Like other immigrants, Mexicans are generally happy with their life in the United States. Seven in ten say the United States is a unique country that stands for something special, and they’re just as likely as other immigrants to say they’d do it all over again.
Mexicans are more likely to believe that the United States is a good place to raise children (66 percent, compared with 50 percent of all other immigrants) and are just as skeptical as other immigrants that their children will go back to the country where they were born. An overwhelming 96 percent say that the United States is a better place to earn a good living than is their birth country.
That’s particularly noteworthy, because Mexican immigrants tend to be lower-income and more con-cerned about the economy. A staggering 9 in 10 say that they came to the United States with “very little money,” and they are more likely to cite the economy as a problem than are other groups—important, con-sidering the extremely high anxiety across the board.
Mexican immigrants are different in other ways, some of which are likely to pose challenges in American society. (See fact box on page 30) For one, the language problem among Mexican immigrants is a significant one. They are far more likely to say that they could not speak English when they first came to the United States. Fully 75 percent say they did not speak English at all, compared with 33 percent of other, non-Mexican immigrants. And of those who
came here without knowing English, they’re also much more likely to say they speak their native lan-guage at home (81 percent versus 54 percent among other immigrants) and more likely to say they speak fair or poor English (78 percent compared with 54 percent). They’re significantly less likely to say that the United States should require immigrants to learn English (44 percent compared with 61 percent). We conducted interviews in English as well as Spanish (the respondent chose the language) and did not interview in any other language, so it is not sur-prising that many survey respondents say that their English is only fair or poor.
Yet Mexicans who knew little or no English when they arrived are also about as likely as other immigrants to have taken an English course, and Mexican immigrants overall are just as likely to say that schools should teach immigrant children English as quickly as possible.
Mexican immigrants express particularly strong concerns about discrimination.
The most dramatic difference between Mexican immi-grants and other groups, whether in the survey or in focus groups, is in the level of discrimination they perceive around them and against them.
Three-quarters of Mexicans say that there is at least some discrimination toward immigrants, 18 points higher than other immigrants. The difference is even more dramatic when asked about discrimina-tion toward people from their birth country. Some 73 percent of Mexicans say that there is at least some dis-crimination toward people from their birth country, 42 percentage points higher than other immigrants.
29+ A Place to Call Home: What Immigrants Say Now About Life in America +
Part 3 : Common Threads, Different Voices

Based on the survey sample:
Three out of ten Mexicans came to the United States +after 2001 (comparable to other immigrants).
Twenty-seven percent of Mexicans are citizens, a +smaller number than other groups.
Thirty-three percent of Mexicans are undocumented, +a greater number than other groups.
Mexicans break down by political party affiliation +much as other immigrants do: 12 percent Republican, 39 percent Democrat, 24 percent Independent.
Fifty-six percent of Mexicans report not having a +high school diploma, compared with 17 percent of other immigrants.
Fifty-nine percent of Mexicans report having incomes +under $25,000. Twenty-seven percent report incomes under $15,000. Compare this with 33 percent of other immigrants reporting under $25,000 and 18 percent under $15,000.
Forty-five percent of Mexicans report having no +health insurance, compared with 20 percent of other immigrants.
Thirty-three percent have received food stamps, +compared with 16 percent of all other immigrants.
Part 3 : Common Threads, Different VoicesFact Box on Mexicans

In the focus groups, particularly an Atlanta group that was conducted in Spanish with recent Mexican immigrants, participants offered many stories about police harassment. No wonder, perhaps, that Mexicans who have been in the United States since at least 2000 are more likely to say that immigration laws have become stricter since the September 11 terrorist attacks (90 percent) and that elected offi-cials don’t care about them much (84 percent).
Yet Mexicans are no more likely to report experiencing discrimination themselves than are other immigrants. Nearly a quarter, 24 percent, say they have personally experienced either a great deal or some discrimina-tion simply because they are an immigrant (7 percent say “a great deal”).
Even though greater numbers of Mexicans are undoc-umented compared with other immigration groups, and even greater numbers report that most of the immigrants they know are illegal, their perception of personal discrimination is virtually the same as for other groups.
Mexicans are more likely to perceive discrimination but not experience it personallyWould you say that there is a great deal, some, only a little or no discrimination in the United States today against the following:
Percent who say a great deal or some:
Mexicans: Great deal Some
All other immigrants: Great deal Some
*Note: This difference is not statistically significant.
0 20 40 60 80 100%
Immigrants
32% 43% 75%
18% 39% 57%
Immigrants from your birth country
34% 39% 73%
7% 24% 31%
You personally*
7% 16% 24%
10% 16% 26%
31+ A Place to Call Home: What Immigrants Say Now About Life in America +
Part 3 : Common Threads, Different Voices
Mexican immigrants are even more likely to cite the practical side of citizenship.
Fewer Mexican immigrants are citizens, and though seeking citizenship carries strong elements of commit-ment and pride, practical concerns were even stronger among Mexicans than they were among other immi-grants. This is less a question of attitudes than it is of intensity. More Mexicans cite a number of practical issues as “major reasons” to become a citizen than do other immigrants.
More Mexicans, 92 percent, cite the attainment of +
better legal rights as a major reason to become a citizen, compared with 72 percent of other immi-grants. Some 87 percent of Mexicans cite equal rights and responsibilities as a major reason.
Nearly as many, 87 percent, cite not having to +
worry about immigration status as a major reason, compared with 62 percent of all other immigrants.
Eighty-six percent of Mexicans cite the ease +
with which they are able to obtain certain jobs as a major reason, compared with 62 percent of other immigrants.
Seventy-eight percent cite easier travel in and out +
of the United States, compared with 59 percent of other immigrants.
Sixty-nine percent of Mexicans say that the ability +
to bring other family members to the United States is a major reason, compared with 41 percent of other immigrants.
Compared with Mexicans, other Latin American immigrants are more likely to speak English, less likely to be undocumented and less tied to their birth country.
If you compare Mexican immigrants with those from Central and South America, there are several significant differences. For one thing, Central and South American immigrants are more likely to say their English is “excellent” (15 percent compared with 5 percent for Mexicans) and twice as likely to speak English at home (13 percent compared with 5 percent). The other Central and South American immigrants are also much less likely to say they are undocumented (only 14 percent compared with 33 percent of Mexicans) and dramatically more likely to say that most of the immigrants they know are here legally (69 percent compared with only 38 percent of Mexicans). In addi-tion, they are less likely to say that there is at least some discrimination against people from their birth country (34 percent compared with 73 percent of Mexicans).
While other Latin Americans are just as likely as Mexicans to send money home regularly, they’re less likely than Mexicans to phone home weekly (40 percent compared with 53 percent of Mexicans) and to spend a lot of time with people from their home country (44 percent com-pared with 72 percent of Mexicans).
32+ A Place to Call Home: What Immigrants Say Now About Life in America +
Part 3 : Common Threads, Different Voices Part 3 : Common Threads, Different Voices

Mexicans are more likely to cite legal rights, immigration status and jobs as major reasons to become a citizenFor each of the following, please tell me if it is a major reason for becoming a citizen:
Mexicans All other immigrants
0 20 40 60 80 100% 0 20 40 60 80 100%
76%68%
To show a commitment and pride in being an American
87%
62%
So you would not have to worry about your immigration status
69%41%
To make it easier to bring other family members to this country
87%77%
To have equal rights and responsibilities
85%75%
To get the right to vote
92%72%
To have better legal rights and protections in the United States
78%59%
To make it easier to travel in and out of the United States
86%62%
To make it easier to get certain jobs
48%31%
To qualify for government programs like Medicaid or food stamps
Part 3 : Common Threads, Different Voices
33+ A Place to Call Home: What Immigrants Say Now About Life in America +
Part 3 : Common Threads, Different Voices

Muslim immigrants in America do not feel disaffec-tion with the nation—far from it. If anything, their embrace of the United States and their expressions of patriotism are stronger than those exhibited by other groups.
One of the most striking facts about our subsample of Muslim immigrants is what isn’t happening. There’s been enormous political debate over the collision of the West with radical Islam, punctuated by September 11, the war in Iraq and riots and turmoil in Europe. Some worry that prejudice and government policy might push Muslims into radicalism; others worry that we don’t do enough to protect the country from radicals hiding among the Muslim population.
Our research finds no signs that Muslim immigrants are disaffected or detached from the rest of the United States. In fact, our surveys suggest that Muslims grab on to American ideals even more firmly than other immigrants do—and that’s saying something.
Six in ten Muslim immigrants (61 percent) report that they’re “extremely happy” in the United States, com-pared with only 33 percent of other immigrants. A stunning 92 percent of Muslims say that the United States will be their permanent home, compared with 69 percent among other immigrants. Muslims are more likely to give the United States higher ratings than their birth country on key questions, such as having a free and independent media. (Seventy-nine percent say the United States does a better job on this compared with 54 percent of other immigrants.)
Our focus group with Middle Eastern immigrants,10 including a majority of Muslims, conducted in Detroit, Michigan, was by far the most overtly patriotic.
Fewer Muslims cite discrimination as an issueWould you say that there is a great deal, some, only a little or no discrimination in the United States today against:
Muslims: A great deal Some
All Others: A great deal Some
* Note: This difference is not statistically significant.
0 20 40 60 80 100%
1%
You personally*
Immigrants
24% 27%
23%
3%
Immigrants from your home country
16% 29% 45%
16% 20%4%
10% 16% 26%
25% 27%
41% 64%
10 In the survey, Middle Eastern countries include Algeria, Egypt,
Iran, Iraq, Israel, Jordan, Kuwait, Lebanon, Libya, Morocco, Qatar,
Saudi Arabia, Syria, Tunisia, Yemen and Turkey.
34+ A Place to Call Home: What Immigrants Say Now About Life in America +
Part 3 : Common Threads, Different Voices

Based upon on the survey sample:
Three out of four Muslims immigrated before 2001. +
Fifty-seven percent of the Muslim sample came from +South Asia; 35 percent came from the Middle East.
Sixty-eight percent of Muslims are citizens; +an additional 26 percent are legal residents.
More than half, 55 percent, of Muslims are +Democrats, slightly more than other immigrants (43 percent).
Muslim education is comparable to that of the total +immigrant sample. Twenty-four percent have at least a two-year degree, while 77 percent have graduated from high school.
Fifty-seven percent of Muslims made less than +$25,000 a year. That’s 17 percent more in this bracket than other immigrants.
Fact Box on MuslimsPart 3 : Common Threads, Different Voices

“My personal experience with American people and with America, it’s very welcoming. I think America respects you if you are a good person and hard working.” - A man in the Detroit focus group
Perhaps most striking, given the debate over whether Muslims have been unfairly targeted in the “war on terror,” Muslims are also more likely to say there is no (or only a little) discrimination against immigrants in general in the United States (63 percent of Muslims compared with 32 percent of others). Only 19 percent of Muslims say there is at least some discrimination against people from their birth country compared with 35 percent of all other immigrants, and 1 percent of Muslims say that they have experienced a great deal of personal discrimination while 25 percent say they’ve experienced some discrimination.
The Muslim sample in our survey overwhelmingly hailed from two regions of the world: South Asia and the Middle East, both of which, of course, have substantial non-Muslim populations.11 Examined by region, there are some significant differences as well. South Asians and Middle Easterners are by far the most likely to come to the United States knowing how to speak English well, with 70 percent of South Asians and 76 percent of Middle Easterners who came here knowing little or no English saying their English is good or excellent. South Asians are also more likely than any group except Mexican immigrants to phone home regularly (50 percent, compared with 40 percent overall and 28 percent of Middle Easterners).
11 In the survey, South Asian countries include Afghanistan, Bangladesh, Bhutan,
Cambodia, India, Myanmar (Burma), Nepal, Pakistan, Philippines and Sri Lanka.
When it comes to plans for reform, most immi-grants strongly support bringing illegal or undocumented immigrants into the mainstream, including a guest worker program and a “path to citizenship” for illegal immigrants with a clean record. But one size does not fit all. Older immi-grants and those from certain regions of the world are more skeptical of these ideas.
We tend to have one overarching debate about immigra-tion in the United States, as if all immigrants came here for the same reasons and posed the same challenges. Obviously that’s not the case. Our study reveals a lot of common ground in the immigrant experience and deeply held values that cut across all kinds of people. But the tech worker isn’t the same as the day laborer, and the political refugee may have quite different con-cerns from those of the family trying to reunite.
The immigrants in our survey reflect this: Certain values and reform proposals, like a guest worker program and a procedure to allow illegal immi-grants to become citizens, have considerable support among immigrants overall. But immigrants aren’t monolithic when it comes to the immigration debate. What they think about government policy depends on who they are.
For example, one of the fiercest debates is over undoc-umented or illegal immigration. Surveys of the general public consistently find that Americans take a much harsher view of illegal immigration than the legal variety. For example, a Gallup survey in 2008 found
36+ A Place to Call Home: What Immigrants Say Now About Life in America +
Part 3 : Common Threads, Different Voices

that 64 percent of Americans believed that immigration is generally a “good thing” for the country. But only 31 percent in the same survey say illegal immigrants “in the long run become productive citizens and pay their fair share of taxes.” Nearly two-thirds say they cost the government too much.12
Immigrants overall, however, firmly take the opposite view. When we asked the same question in our survey, 57 percent replied that illegal immigrants do become productive citizens, a finding that may drive attitudes on other questions. But the results depend very much on the immigrant’s own background.
Not surprisingly, of course, undocumented immi-grants themselves are much more likely to believe this (74 percent). So do 72 percent of Mexican immi-grants. It’s perhaps significant that Mexicans report having more contact with undocumented immigrants, with more than half saying most of the immigrants they know are here illegally.
Fewer immigrants from other backgrounds share this positive view of illegal immigrants. For example, 48 percent of South Asian and Middle Eastern immi-grants say that illegal immigrants become productive citizens, while only 39 percent of East Asian immi-grants agree. Immigrants older than 50 are also less likely to say this.
12 Visit PublicAgenda.org for more details, http://publicagenda.
org/charts/people-are-divided-whether-immigrants-become-produc-
tive-citizens-or-if-they-cost-taxpayers-too-much-using-government.
Part 3 : Common Threads, Different Voices
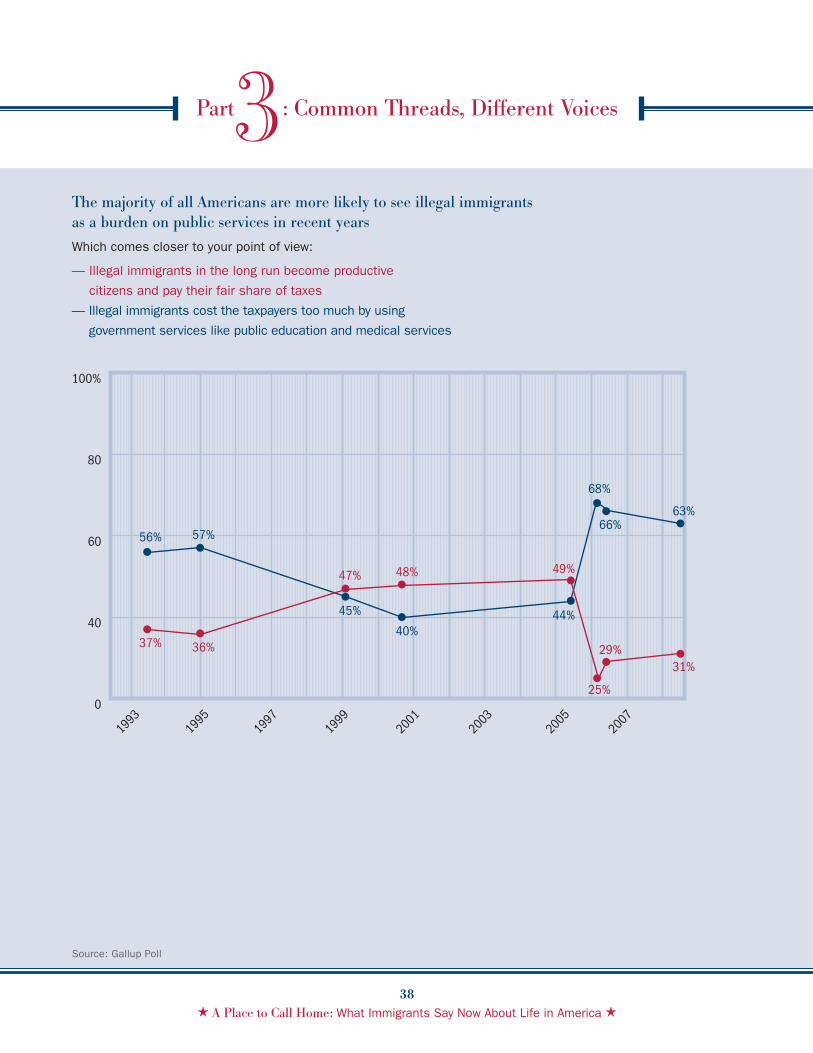
The majority of all Americans are more likely to see illegal immigrants as a burden on public services in recent yearsWhich comes closer to your point of view:
— Illegal immigrants in the long run become productive
citizens and pay their fair share of taxes
— Illegal immigrants cost the taxpayers too much by using
government services like public education and medical services
Source: Gallup Poll
0
40
60
80
100%
31%
37% 36%
47% 48% 49%
25%
29%
63%
56% 57%
45%
40%44%
68%
66%
1993
1995
1997
1999
2001
2003
2005
2007
38+ A Place to Call Home: What Immigrants Say Now About Life in America +
Part 3 : Common Threads, Different Voices Part 3 : Common Threads, Different Voices

Such attitudes tend to influence views on other ques-tions of public policy. Immigrants in general strongly support a “path to citizenship” for illegal immigrants. Seven in ten (72 percent) say that the government should offer a way for illegal immigrants with no criminal record and who have shown a commit-ment to the United States to become citizens. Only 21 percent oppose that policy, saying it would “reward people who broke the law.” Mexicans and other Latin Americans are even more likely to support a path to citizenship, at 84 percent for Mexicans and 81 percent for other Latin Americans.
Support among other groups is lower, with 62 percent of Middle Easterners, 54 percent of East Asians and 48 percent of South Asians in favor. Support also declines as people grow older: 85 percent of 18–to–29-year-olds favor the path to citizenship, but only 56 percent of those 65 and older do.
In our focus groups, we heard skepticism regarding recent immigrants from a number of participants who’d been in the country for some time. There was resistance to the idea of deporting illegal immigrants who were already here but also an interest in keeping “bad elements” out of the country.
Again, the survey found that these views were in some part determined by age. Indeed, the older immigrants get, the more skeptical they become. Immigrants under age 30 overwhelmingly (81 percent) say that recent immigrants have the same respect for American law and customs, but only 6 in 10 between the ages of 31 and 49 say this. That number falls to just more than 4 in 10 (43 percent) for those older than 65.
Overall, immigrants see illegal immigrants as productive citizens in the long runWhich comes closer to your point of view?
57%31%
12%
57% Illegal immigrants in the long run become productive citizens and pay their fair share of taxes
31% Illegal immigrants cost the taxpayers too much by using government services like public education and medical services
12% Don’t know/refused
Part 3 : Common Threads, Different Voices
39+ A Place to Call Home: What Immigrants Say Now About Life in America +
Part 3 : Common Threads, Different Voices
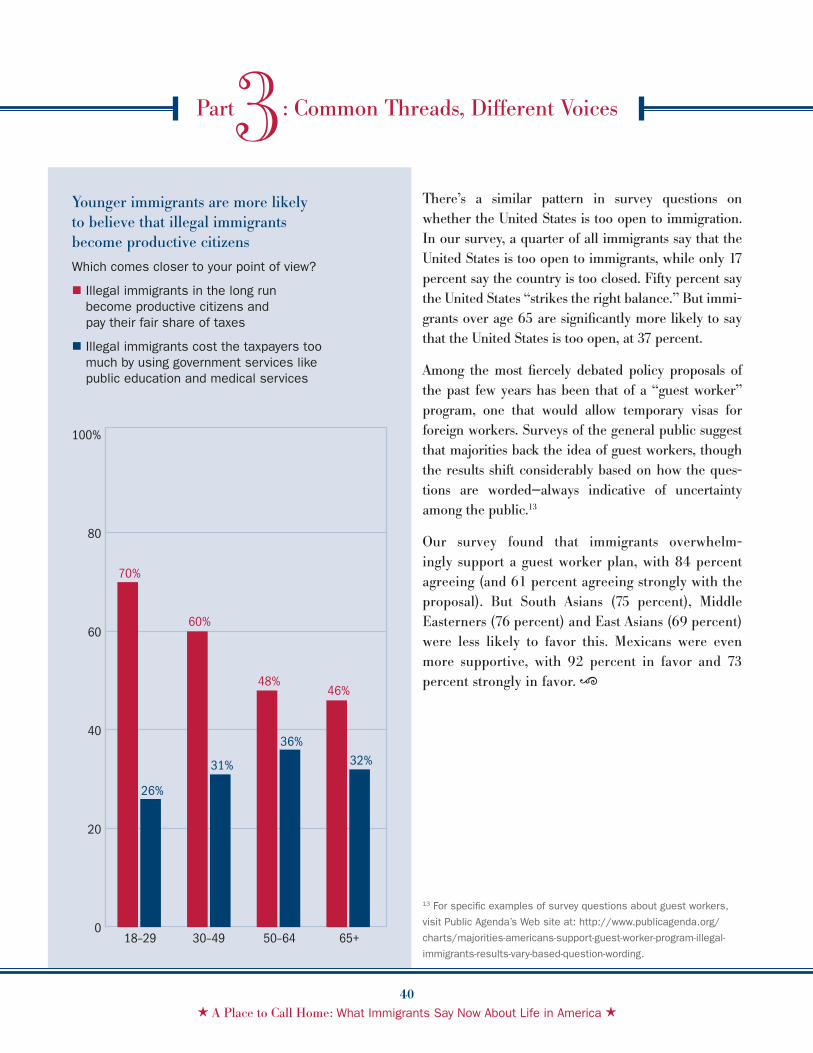
There’s a similar pattern in survey questions on whether the United States is too open to immigration. In our survey, a quarter of all immigrants say that the United States is too open to immigrants, while only 17 percent say the country is too closed. Fifty percent say the United States “strikes the right balance.” But immi-grants over age 65 are significantly more likely to say that the United States is too open, at 37 percent.
Among the most fiercely debated policy proposals of the past few years has been that of a “guest worker” program, one that would allow temporary visas for foreign workers. Surveys of the general public suggest that majorities back the idea of guest workers, though the results shift considerably based on how the ques-tions are worded—always indicative of uncertainty among the public.13
Our survey found that immigrants overwhelm-ingly support a guest worker plan, with 84 percent agreeing (and 61 percent agreeing strongly with the proposal). But South Asians (75 percent), Middle Easterners (76 percent) and East Asians (69 percent) were less likely to favor this. Mexicans were even more supportive, with 92 percent in favor and 73 percent strongly in favor.
13 For specific examples of survey questions about guest workers,
visit Public Agenda’s Web site at: http://www.publicagenda.org/
charts/majorities-americans-support-guest-worker-program-illegal-
immigrants-results-vary-based-question-wording.
Younger immigrants are more likely to believe that illegal immigrants become productive citizensWhich comes closer to your point of view?
Illegal immigrants in the long run become productive citizens and pay their fair share of taxes
Illegal immigrants cost the taxpayers too much by using government services like public education and medical services
0
20
40
60
80
100%
70%
26%
18–29
60%
31%
30–49
48%
36%
50–64
46%
32%
65+
40+ A Place to Call Home: What Immigrants Say Now About Life in America +
Part 3 : Common Threads, Different Voices

Part 3 : Common Threads, Different Voices

Methodology
A Place to Call Home is based on a telephone survey uti-lizing both landline and cellular telephones. Respondents include a representative sample of 1,138 foreign-born adults 18 years and older who currently live in the United States and came to the United States at the age of 5 or older. The survey was preceded by six focus groups conducted in sites across the country as well as 12 in-depth interviews with immigration experts in academia, public policy, law and community outreach.
Telephone Survey
Telephone interviews were conducted from April 23, 2009 through June 7, 2009. The interviews averaged 31 minutes in length. The response rate for the study was 25 percent.
The survey was offered in both English and Spanish. Four hundred seventy-one interviews were conducted with Spanish-speaking respondents.
Throughout the survey, special efforts were taken to make the interview process comfortable for immi-grants for whom English is, at best, a second language. Interviewers received enhanced training in order to sensitize them to the particular challenges of speaking with non-native English speakers regarding potentially anxiety-provoking issues. Survey questions were exten-sively pretested to reduce the overall wordiness of the instrument and improve question clarity. In addition, language was used to assure respondents that their information and responses would be kept confidential.
The margin of error for the report is plus or minus 5.4 percentage points. However, it is higher when com-paring subgroups or question items that weren’t asked of all respondents.
Sample Design
The study employed a dual-frame landline/cell phone telephone design. According to both the 2009 National Health Interview Survey (NHIS) and the General Social Survey (GSS), 22 percent of foreign-born residents of the United States do not own a landline telephone but do own a cell phone. Consequently, the cell phone portion of the sample was included to better represent immigrant households. A total of 159 interviews were completed via cell phone.
A disproportionate stratified sample design that combined random-digit dial (RDD) sample with listed sample (supplied by Ethnic Technologies, or E-Tech, a leading provider of multicultural marketing lists, ethnic identification software and ethnic data appending services) was used in this study to increase the incidence of households with foreign-born adults from specified heritages and oversample persons of South Asian, East Asian, Middle Eastern and Central/South American heritage. Thirty-eight percent of interviews completed came from this sample. The RDD sample utilized strata of areas known to have a high incidence of individuals of South Asian, East Asian, Middle Eastern and Central/South American heritage, but no strata was excluded from the sample design. The landline portion of the study employed an open design, meaning that as long as their heritage quota was open, anyone who was eligible would be asked to complete the study regardless of the strata in which they reside. Cell phone completes were not subject to heritage quotas.
43+ A Place to Call Home: What Immigrants Say Now About Life in America +
Methodology
Questionnaire
The questionnaire was designed by Public Agenda, and all interpretation of the data reflected in this report was done by Public Agenda. As in all surveys, question order effects and other nonsampling sources of error can sometimes affect results. Steps were taken to minimize these, including pretesting the survey instrument and randomizing the order in which some question and answer categories were read.
The interviewing was conducted by International Communications Research (ICR) in conjunction with Social Science Research Solutions (SSRS) in Media, PA.
Weighting Procedures
Survey data were weighted to (1) adjust for the fact that not all survey respondents were selected with the same probability, and (2) account for gaps in coverage and nonresponse biases in the survey frame. Weights were applied to balance heritage, age, years in the United States, education, region and gender. The overall design effect of the weighting procedure is 3.46.
The Focus Groups
Focus groups allow for an in-depth, qualitative exploration of the dynamics underlying the public’s attitudes toward complex issues. Insights from par-ticipants in these focus groups were important to the survey design, and actual quotes were drawn from the focus groups to give voice to attitudes captured statistically through the surveys. Six focus groups were conducted as follows:
A mix of immigrants from different countries +
and backgrounds in New York, NY;
Hispanic immigrants in Atlanta, GA, +
conducted in Spanish;
Hispanic immigrants in Los Angeles, CA, +
conducted in Spanish;
Asian immigrants in San Francisco, CA; +
Immigrants from Middle Eastern countries +
in the greater Detroit, MI, area; and
Immigrants making more than $75,000 +
a year in Boston, MA.
The Experts
Prior to conducting the focus groups and the telephone survey, Public Agenda interviewed 12 immigration experts to obtain grounding in the current substantive issues concerning immigrants in the United States. Experts were guaranteed anonymity to ensure their complete cooperation with the study.
Methodology
44+ A Place to Call Home: What Immigrants Say Now About Life in America +


Sou
th A
sia
East
Asi
a
Mid
dle
East
Cen
tral
and
S
outh
Am
eric
a
Mex
ico
Oth
er c
ount
ries
Totaln=1,138
% n=202%
n=194%
n=158%
n=269%
n=140%
n=175%
1. Overall, would you say that you are extremely happy, somewhat happy or generally disappointed with life in the United States?
Extremely happy 34 40 35 45 32 40 24
Somewhat happy 53 53 50 38 56 52 54
Generally disappointed 10 5 12 14 6 7 18
Don’t know 1 1 2 2 1 * *
2. What do you think is the most important problem facing the United States today? [BASE: Open ended.]
Aspects of the economy 42 48 40 38 43 45 37
Unemployment 20 16 14 11 21 29 15
Decaying social values/other social problems 6 4 12 11 4 2 8
Government/legislation 5 4 2 4 7 1 11
Health care/insurance affordability/availability 3 1 6 * 1 1 7
War/want peace 2 1 1 2 1 4 *
Aspects of foreign relations 3 1 * 2 1 2 4
Immigration problems/policies 2 – * 8 4 2 3
Discrimination/racism 2 * 5 3 2 2 *
Terrorism 2 4 * * 4 – 3
Education 1 2 2 6 * 1 *
Language 1 – 2 – 1 * –
Other 2 5 5 1 1 1 2
None/no problems 4 12 5 6 1 2 5
Don’t know 5 2 6 6 7 6 2
A Place to Call Home is based on a telephone survey, utilizing both landline and cellular telephones. Respondents include a representative sample of 1,138 foreign-born adults, 18 years and older who currently live in the United States and came to the United States at the age of 5 or older. The study employed a hybrid, stratified design that combined random digit dialing and listed sample to increase the incidence of households with foreign-born adults from South Asian, East Asian, Middle Eastern and Central/South American heritage. Interviews were conducted between April 23, 2009 and June 7, 2009.
Results of less than 0.5 percent are signified by an asterisk. Results of zero are signified by a dash. Responses may not always total 100 percent due to rounding. Combining answer categories may produce slight discrepancies between numbers in these survey results and numbers in the report.
46
+ A Place to Call Home: What Immigrants Say Now About Life in America +
Full Survey Results Full Survey Results

Sou
th A
sia
East
Asi
a
Mid
dle
East
Cen
tral
and
S
outh
Am
eric
a
Mex
ico
Oth
er c
ount
ries
Totaln=1,138
% n=202%
n=194%
n=158%
n=269%
n=140%
n=175%
3. As things stand now, is it MOST likely:
That the United States will be your permanent home 70 77 71 81 63 68 71
That someday you will go back to live in the country where you were born
17 16 11 15 21 19 16
That you will move someplace else to live 3 3 1 2 3 6 3
Don’t know 10 4 15 3 13 7 10
4. If you could do it again, would you choose:
To come to the United States 71 75 74 82 68 75 65
To stay in the country where you were born 19 16 14 4 26 18 25
To pick a different country to live in 6 5 5 9 4 6 8
Don’t know 3 4 8 4 2 1 3
5. When you arrived in the United States, how long did it take before you felt comfortable here and a part of the community?
1 to just under 2 years 47 56 33 50 57 48 46
2 to just under 5 years 30 24 37 35 23 31 30
5 to just under 10 years 9 5 11 4 10 10 8
10 years or more 5 9 11 4 2 4 3
I have never felt like I fit in 5 2 7 5 4 4 6
Don’t know 3 4 1 1 2 2 4
6. When you first came to this country, did you have a good amount of money to get you started or did you come with very little money in your pocket?
A good amount of money 20 38 22 37 12 6 34
Very little money 76 60 75 60 81 91 62
Don’t know 2 2 2 3 4 1 3
7. Which of these two statements comes closer to your own view?
The United States is a unique country that stands for somthing special in the world
76 87 76 82 80 70 76
The United States is just another country that is no better or worse than any other
20 8 17 13 19 29 18
Don’t know 3 4 7 4 * 1 4
Full Survey Results
47
+ A Place to Call Home: What Immigrants Say Now About Life in America +
Full Survey Results

Sou
th A
sia
East
Asi
a
Mid
dle
East
Cen
tral
and
S
outh
Am
eric
a
Mex
ico
Oth
er c
ount
ries
Totaln=1,138
% n=202%
n=194%
n=158%
n=269%
n=140%
n=175%
8. How much do you think America’s elected officials care about the issues facing immigrants—do you think they care a lot, a little or not at all?
Care a lot 26 40 37 44 15 13 37
A little 53 37 47 36 66 65 40
Not at all 15 17 3 6 16 19 18
Don’t know 6 6 13 13 3 3 6
9. Which comes closer to your view, even if neither is exactly right:
It is possible to be successful in the United States if you work hard, even if you do not have connections to help you
63 73 58 63 63 63 63
In order to be successful in the United States you need to have connections to people who can help you
35 26 38 36 35 36 37
Don’t know 1 2 4 * 2 1 *
10. Different countries have their own advantages and disadvantages. For each of the following items that I read, please tell me if you think the United States or the country where you were born does a better job when it comes to that item, or if they are about the same.14
Having more opportunity to earn a good living…
The United States 88 91 80 85 87 96 82
Home country/the country where you were born 2 2 5 1 4 * 3
They’re about the same 9 6 13 14 8 2 15
Don’t know 1 1 2 * * 2 *
Having a legal system you can trust…
The United States 70 83 68 67 77 70 61
Home country/the country where you were born 5 * 11 13 1 – 11
They’re about the same 23 15 18 16 19 28 28
Don’t know 2 1 3 4 3 2 1
14 In the survey, respondents were asked specifically about the country in which they were born unless they declined to specify their home country
(six respondents, or 0.5 percent of those surveyed), in which case they were asked to refer to their “home country.” For example, someone from
France would be asked the question: “Do you think the United States or France does a better job when it comes it to… having more opportunity to
earn a good living?”
48
+ A Place to Call Home: What Immigrants Say Now About Life in America +
Full Survey Results Full Survey Results

Sou
th A
sia
East
Asi
a
Mid
dle
East
Cen
tral
and
S
outh
Am
eric
a
Mex
ico
Oth
er c
ount
ries
Totaln=1,138
% n=202%
n=194%
n=158%
n=269%
n=140%
n=175%
Making good health care available…
The United States 67 72 64 64 70 76 54
Home country/the country where you were born 15 9 16 26 15 4 28
They’re about the same 16 18 15 7 12 19 16
Don’t know 2 1 4 2 3 1 1
Having a good education system…
The United States 62 67 71 63 54 63 60
Home country/the country where you were born 14 11 14 18 21 5 18
They’re about the same 23 21 13 18 23 31 21
Don’t know 1 * 2 1 2 * *
Being a good place to raise children…
The United States 55 40 69 61 47 66 43
Home country/the country where you were born 18 18 10 25 19 8 34
They’re about the same 25 38 20 10 29 26 22
Don’t know 2 4 1 3 5 – 1
Having a free and independent media as well as forms of free expression…
The United States 55 65 87 70 54 41 45
Home country/the country where you were born 9 7 4 9 7 9 15
They’re about the same 34 27 7 20 36 47 40
Don’t know 2 1 2 1 2 3 *
Having a higher standard of morality…
The United States 49 49 58 52 45 47 47
Home country/the country where you were born 16 22 10 14 17 11 25
They’re about the same 31 25 25 25 32 40 25
Don’t know 4 4 5 9 5 1 4
Letting people practice the religion they choose…
The United States 44 43 68 69 35 36 41
Home country/the country where you were born 5 5 2 6 5 – 14
They’re about the same 50 51 26 24 58 64 44
Don’t know 1 1 3 1 2 1 1
Full Survey Results
49
+ A Place to Call Home: What Immigrants Say Now About Life in America +
Full Survey Results
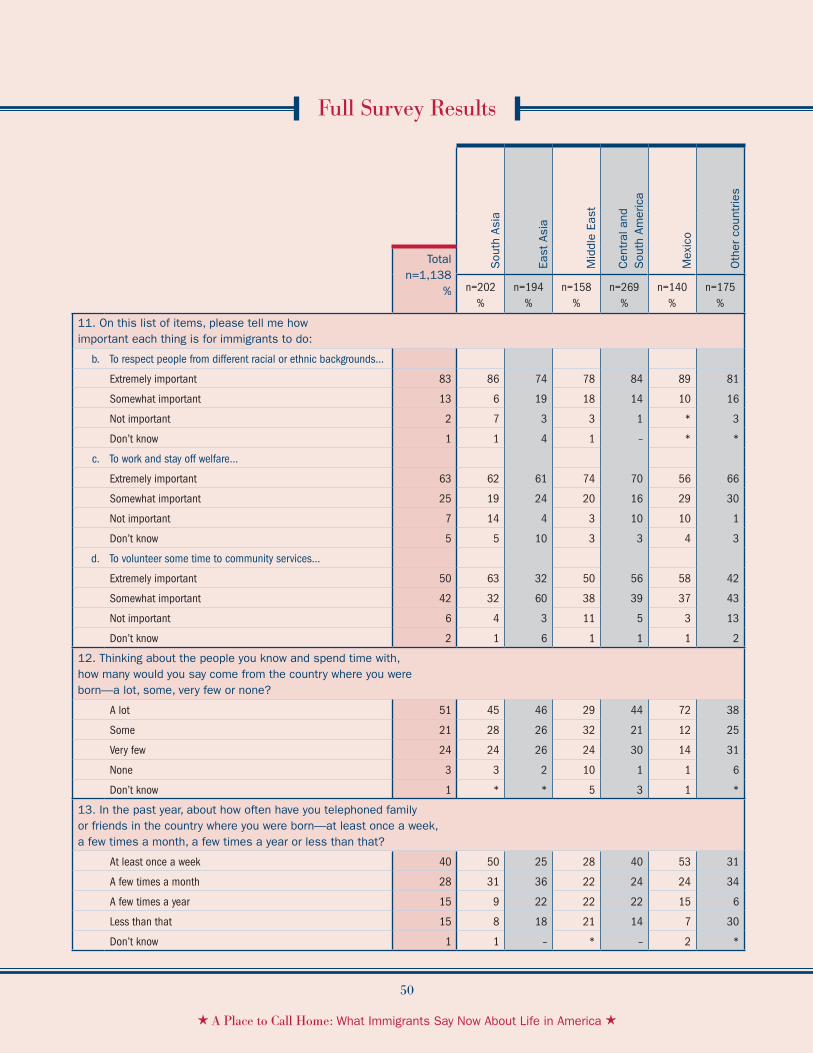
Sou
th A
sia
East
Asi
a
Mid
dle
East
Cen
tral
and
S
outh
Am
eric
a
Mex
ico
Oth
er c
ount
ries
Totaln=1,138
% n=202%
n=194%
n=158%
n=269%
n=140%
n=175%
11. On this list of items, please tell me how important each thing is for immigrants to do:
b. To respect people from different racial or ethnic backgrounds…
Extremely important 83 86 74 78 84 89 81
Somewhat important 13 6 19 18 14 10 16
Not important 2 7 3 3 1 * 3
Don’t know 1 1 4 1 – * *
c. To work and stay off welfare…
Extremely important 63 62 61 74 70 56 66
Somewhat important 25 19 24 20 16 29 30
Not important 7 14 4 3 10 10 1
Don’t know 5 5 10 3 3 4 3
d. To volunteer some time to community services…
Extremely important 50 63 32 50 56 58 42
Somewhat important 42 32 60 38 39 37 43
Not important 6 4 3 11 5 3 13
Don’t know 2 1 6 1 1 1 2
12. Thinking about the people you know and spend time with, how many would you say come from the country where you were born—a lot, some, very few or none?
A lot 51 45 46 29 44 72 38
Some 21 28 26 32 21 12 25
Very few 24 24 26 24 30 14 31
None 3 3 2 10 1 1 6
Don’t know 1 * * 5 3 1 *
13. In the past year, about how often have you telephoned family or friends in the country where you were born—at least once a week, a few times a month, a few times a year or less than that?
At least once a week 40 50 25 28 40 53 31
A few times a month 28 31 36 22 24 24 34
A few times a year 15 9 22 22 22 15 6
Less than that 15 8 18 21 14 7 30
Don’t know 1 1 – * – 2 *
50
+ A Place to Call Home: What Immigrants Say Now About Life in America +
Full Survey Results Full Survey Results

Sou
th A
sia
East
Asi
a
Mid
dle
East
Cen
tral
and
S
outh
Am
eric
a
Mex
ico
Oth
er c
ount
ries
Totaln=1,138
% n=202%
n=194%
n=158%
n=269%
n=140%
n=175%
14. How often do you send money to family living in the country where you were born? Do you do this regularly, once in a while or not at all?
Regularly 18 14 9 1 24 23 16
Once in a while 44 55 41 20 47 52 31
Not at all 37 31 46 78 28 24 53
Don’t know 1 – 3 1 1 * *
15. In your view, is it easy or hard for new immigrants to get a good job or do well in this country without learning English?
Very easy 4 3 3 1 3 4 6
Somewhat easy 10 13 8 10 6 6 18
Somewhat hard 32 37 30 39 32 39 19
Very hard 52 44 55 46 58 51 52
Don’t know 2 2 4 3 1 * 5
16. When you first came to the United States to live, did you already know how to speak English well, did you know a little, or did you not speak English at all?
Already knew how to speak English well 24 61 19 37 6 – 55
Knew a little 31 33 60 34 21 25 24
Did not speak English at all 45 4 21 27 73 75 21
Don’t know * 1 * 2 – – –
17. Which do you speak MOST of the time in your home—English or your native language, or do you speak them both about the same? [BASE: Asked of those who knew a little English or did not speak English at all when they came to the United States.]
English 14 16 14 35 13 5 39
Native language 64 46 58 23 67 81 34
Both about the same 21 38 28 42 19 15 27
Some other language * – – – * – –
Full Survey Results
51
+ A Place to Call Home: What Immigrants Say Now About Life in America +
Full Survey Results
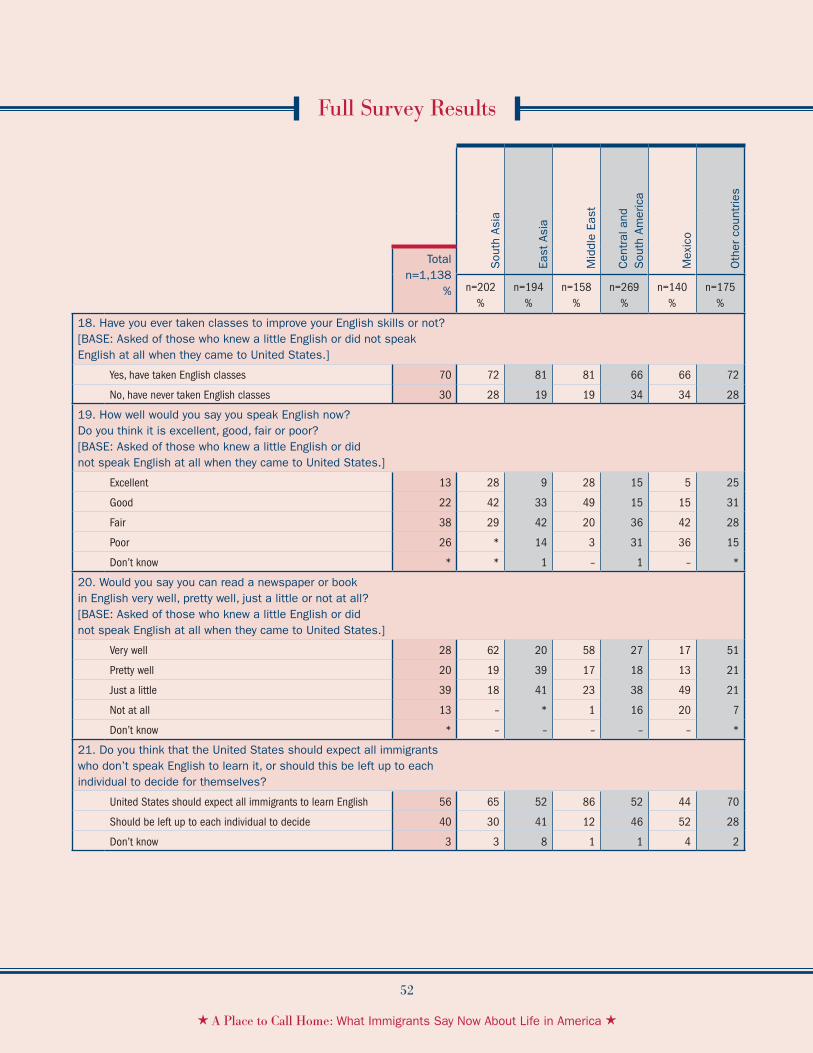
Sou
th A
sia
East
Asi
a
Mid
dle
East
Cen
tral
and
S
outh
Am
eric
a
Mex
ico
Oth
er c
ount
ries
Totaln=1,138
% n=202%
n=194%
n=158%
n=269%
n=140%
n=175%
18. Have you ever taken classes to improve your English skills or not? [BASE: Asked of those who knew a little English or did not speak English at all when they came to United States.]
Yes, have taken English classes 70 72 81 81 66 66 72
No, have never taken English classes 30 28 19 19 34 34 28
19. How well would you say you speak English now? Do you think it is excellent, good, fair or poor? [BASE: Asked of those who knew a little English or did not speak English at all when they came to United States.]
Excellent 13 28 9 28 15 5 25
Good 22 42 33 49 15 15 31
Fair 38 29 42 20 36 42 28
Poor 26 * 14 3 31 36 15
Don’t know * * 1 – 1 – *
20. Would you say you can read a newspaper or book in English very well, pretty well, just a little or not at all? [BASE: Asked of those who knew a little English or did not speak English at all when they came to United States.]
Very well 28 62 20 58 27 17 51
Pretty well 20 19 39 17 18 13 21
Just a little 39 18 41 23 38 49 21
Not at all 13 – * 1 16 20 7
Don’t know * – – – – – *
21. Do you think that the United States should expect all immigrants who don’t speak English to learn it, or should this be left up to each individual to decide for themselves?
United States should expect all immigrants to learn English 56 65 52 86 52 44 70
Should be left up to each individual to decide 40 30 41 12 46 52 28
Don’t know 3 3 8 1 1 4 2
52
+ A Place to Call Home: What Immigrants Say Now About Life in America +
Full Survey Results Full Survey Results

Sou
th A
sia
East
Asi
a
Mid
dle
East
Cen
tral
and
S
outh
Am
eric
a
Mex
ico
Oth
er c
ount
ries
Totaln=1,138
% n=202%
n=194%
n=158%
n=269%
n=140%
n=175%
23. When it comes to students who are new immigrants, is it more important for the public schools:
To teach them English as quickly as possible, even if this means they fall behind in other subjects
74 74 74 88 72 75 70
To teach them other subjects in their native language even if this means it takes them longer to learn English
21 19 21 10 22 21 25
Don’t know 5 7 5 2 6 5 5
24. Are you the parent of any of these children who are under 18 years old or not? [BASE: Asked of those who have children under 18 in household.]
Yes, parent of child/children under 18 years old 74 74 89 84 66 72 74
No, not a parent of child/children under 18 years old 26 25 11 16 33 28 26
24a. Do you have any children who went to elementary, middle and/or high school in the United States? [BASE: Asked of those who live alone or who have no children under the age of 18 in their household.]
Yes 38 20 32 56 42 36 47
No 62 80 68 44 58 64 53
25. Were any of these children born in the United States or not? [BASE: Asked of those who have children under 18 in households or who have children who went to elementary, middle or high school in the United States.]
Yes, children born in the United States 79 79 70 61 80 86 78
No, children not born in the United States 20 21 30 39 20 14 20
Don’t know 1 – – – – – 3
26. How likely do you think it is that any of these children would want to live in the country where you were born? [BASE: Asked of those who have children under 18 in household.]
Very likely 7 16 3 5 1 8 7
Somewhat likely 16 19 5 17 17 20 10
Somewhat unlikely 16 19 10 28 20 13 19
Very unlikely 58 44 72 43 54 57 62
Don’t know 4 2 11 7 4 2 2
Full Survey Results
53
+ A Place to Call Home: What Immigrants Say Now About Life in America +
Full Survey Results

Sou
th A
sia
East
Asi
a
Mid
dle
East
Cen
tral
and
S
outh
Am
eric
a
Mex
ico
Oth
er c
ount
ries
Totaln=1,138
% n=202%
n=194%
n=158%
n=269%
n=140%
n=175%
27. Overall, how well would you say your child speaks English? [BASE: Asked of all parents of children under the age of 18 in household]
Excellent 67 82 72 82 57 57 78
Good 21 14 20 7 25 24 21
Fair 8 1 7 – 13 15 –
Poor 1 2 – 6 2 – 1
Don’t know 2 2 1 5 2 4 *
27a. Overall, how well would you say your child speaks English? [BASE: Total respondents who have children who went to elementary, middle, or high school in the U.S.]
Excellent 84 82 78 88 77 89 89
Good 14 18 22 12 22 7 9
Fair 1 – – – 1 4 1
Poor * – – – – – 1
Don’t know – – – – – – –
28. Would you say that overall, your child’s friends are more likely to be children of immigrants, children whose parents are from the United States or both about equally? [BASE: parents of children under the age of 18 in household]
Children of immigrants 8 4 7 2 18 5 11
Children whose parents are from the United States 14 26 18 30 4 1 34
Both about equally 76 70 67 64 76 94 55
Don’t know 1 * 8 3 – – –
29. Would you say that overall, your child tends to associate with other children from your birth country or not? [BASE: Asked of parents whose child’s friends are more likely to be children of immigrants]
Yes 68 82 92 58 47 64 82
No 26 18 8 42 53 7 18
Don’t know 6 – – – – 29 –
54
+ A Place to Call Home: What Immigrants Say Now About Life in America +
Full Survey Results Full Survey Results

Sou
th A
sia
East
Asi
a
Mid
dle
East
Cen
tral
and
S
outh
Am
eric
a
Mex
ico
Oth
er c
ount
ries
Totaln=1,138
% n=202%
n=194%
n=158%
n=269%
n=140%
n=175%
30. Is your child currently enrolled in elementary, middle or high school? [BASE: Asked of parents of children under the age of 18 in household]
Elementary 30 42 34 18 50 24 22
Middle 33 34 26 34 16 47 24
High school 28 17 33 32 27 25 36
Not applicable/in day care/not in school 9 7 6 16 8 5 18
Don’t know * 1 – – – – –
31. Thinking about the education your child is getting, do you think it is better, worse or about the same as the education you got at his/her age? [BASE: Asked of parents of children under the age of 18 in household who are currently enrolled in elementary, middle, or high school.]
Better 75 72 80 66 63 85 65
Worse 8 13 6 10 21 4 5
The same 16 14 12 23 16 11 30
Don’t know 1 – 2 – – 1 *
31a. Thinking about the education your child got at his/her elementary, middle or high school, do you think it was better, worse or about the same as the education you got at his/her age? [BASE: Total Respondents who have children who went to elementary, middle, or high school in the U.S.]
Better 65 80 69 52 81 75 43
Worse 10 5 3 8 7 6 18
The same 21 13 28 13 8 11 37
Don’t know 2 2 – 27 2 – 1
Full Survey Results
55
+ A Place to Call Home: What Immigrants Say Now About Life in America +
Full Survey Results

Sou
th A
sia
East
Asi
a
Mid
dle
East
Cen
tral
and
S
outh
Am
eric
a
Mex
ico
Oth
er c
ount
ries
Totaln=1,138
% n=202%
n=194%
n=158%
n=269%
n=140%
n=175%
32. Do you think public schools today do an excellent, good, fair or poor job of teaching your child to speak English as quickly as possible, or don’t you know enough to say? [BASE: Total parents of children under 18 in household whose child is currently enrolled in elementary, middle, or high school]
Excellent 26 37 23 43 16 37 2
Good 35 26 47 24 33 35 38
Fair 11 7 10 4 28 11 2
Poor 2 1 * 20 2 1 *
Child born here/already spoke English 8 11 3 4 3 6 20
Don’t know enough to say 18 19 17 5 18 12 38
32a. Do you think your child’s elementary, middle or high school did an excellent, good, fair or poor job of teaching your child to speak English as quickly as possible, or don’t you know enough to say? [BASE: Total Respondents who have children who went to elementary, middle, or high school in the U.S.]
Excellent 40 64 42 38 60 57 12
Good 22 3 33 21 29 18 18
Fair 6 – 17 2 1 15 1
Poor * – – – * – –
Child born here/already spoke English 17 23 6 8 3 6 39
Don’t know enough to say 14 10 2 30 6 4 30
34. About how many years has it been since you had to deal with the U.S. Immigration Services directly—has it been less than a year, between 1 and 10 years or more than 10 years?
Less than a year 15 26 16 6 12 7 24
Between 1 and 10 years 32 39 34 30 45 30 17
More than 10 years 38 30 38 49 26 43 43
I have no experience with the USCIS or another government agency
9 3 7 8 14 12 5
Don’t know 5 2 5 7 3 6 9
56
+ A Place to Call Home: What Immigrants Say Now About Life in America +
Full Survey Results Full Survey Results

Sou
th A
sia
East
Asi
a
Mid
dle
East
Cen
tral
and
S
outh
Am
eric
a
Mex
ico
Oth
er c
ount
ries
Totaln=1,138
% n=202%
n=194%
n=158%
n=269%
n=140%
n=175%
35. As far as you remember, was your experience dealing with government immigration services an overall positive one, an overall negative one, or somewhere in the middle? [BASE: Asked of those who have dealt with government immigration services.]
Overall positive experience 58 51 34 58 66 67 60
Overall negative experience 7 17 10 6 5 3 6
Somewhere in the middle 31 31 44 34 27 27 30
Don’t know 4 1 11 2 2 3 3
36. In general, do you think that government immigration workers: [BASE: Asked of those who have dealt with government immigration services 10 years ago or less.]
Are usually respectful and do their best to help new immigrants 68 87 72 56 64 61 68
Are usually disrespectful and don’t go out of their way to help new immigrants
20 9 13 24 31 23 18
Don’t know 9 4 14 19 5 9 14
37. In your experience, how hard is it to get information and answers about immigration and naturalization issues from the government? [BASE: Asked of those who have dealt with government immigration services 10 years ago or less.]
Very easy 21 26 14 22 10 16 45
Somewhat easy 36 42 47 42 41 32 23
Somewhat hard 26 21 18 25 21 46 18
Very hard 13 8 15 10 22 6 15
Don’t know 3 3 7 1 6 1 *
Refused * * – – – – –
38. Would you say there is a great deal of discrimination against immigrants in the United States today, some, only a little or none at all?
A great deal of discrimination 22 4 4 8 31 32 25
Some 40 41 45 43 41 43 33
Only a little 22 30 28 12 15 21 25
None at all 11 23 14 28 8 3 15
Don’t know 4 2 8 8 6 1 3
Full Survey Results
57
+ A Place to Call Home: What Immigrants Say Now About Life in America +
Full Survey Results

Sou
th A
sia
East
Asi
a
Mid
dle
East
Cen
tral
and
S
outh
Am
eric
a
Mex
ico
Oth
er c
ount
ries
Totaln=1,138
% n=202%
n=194%
n=158%
n=269%
n=140%
n=175%
39. And now thinking only of immigrants from the country where you were born, would you say that there is a great deal of discrimination against people from your birth country in the United States today, some, only a little or none at all?
A great deal of discrimination against people from your birth country
15 2 1 7 11 34 9
Some 28 30 30 22 23 39 18
A little 28 43 35 17 25 22 27
None at all 22 21 22 43 25 3 44
Don’t know 6 4 11 10 14 1 2
40. And how much discrimination have you personally experienced simply because you are an immigrant—a great deal of discrimination, some, only a little or none at all?
A great deal of discrimination 9 10 9 7 11 7 12
Some 16 15 27 25 15 16 9
Only a little 35 36 35 15 34 39 33
None at all 38 37 25 47 39 37 46
Don’t know 1 2 3 5 * – –
41. And in the past five years, would you say you have been discriminated against more, less or about the same as before? [BASE: Asked of those who came to the United States to live five years ago or earlier and have personally experienced any discrimination.]
More 17 16 7 12 16 32 8
Less 44 49 51 39 39 46 36
The same 37 32 39 37 43 22 55
Don’t know 1 1 2 12 2 – *
58
+ A Place to Call Home: What Immigrants Say Now About Life in America +
Full Survey Results Full Survey Results

Sou
th A
sia
East
Asi
a
Mid
dle
East
Cen
tral
and
S
outh
Am
eric
a
Mex
ico
Oth
er c
ount
ries
Totaln=1,138
% n=202%
n=194%
n=158%
n=269%
n=140%
n=175%
42. Thinking about the last time you were discriminated against, where did it happen? [BASE: Asked of those who have personally experienced any discrimination.] [BASE: Answers are open ended.]
At work 37 49 22 37 41 49 24
In your community 20 14 20 17 10 20 32
Don’t know 11 22 31 6 5 3 8
At school 8 5 10 7 8 6 13
Other 5 * 6 2 7 2 10
On the street 4 * 1 – 1 9 4
At someone’s house 3 1 2 13 2 5 *
At a store (mall, market, gas station, etc.) 3 5 2 9 3 5 *
Restaurant 2 – 1 * 6 * 3
Government office (welfare office, Social Security office, etc.) 1 – 1 6 3 * –
Looking for a job/during an interview 1 – 1 1 2 – 3
Medical provider (doctor’s office, clinic, hospital, etc.) 1 – 1 – 2 1 –
Public transportation (bus, subway, train, etc.) 1 1 * 1 * – 4
Airport * 3 – * * – –
Immigration offices/center/courts * – * * * * –
In a park * * * – – – –
Don’t Know 11 22 31 6 5 3 8
43. In the past five years, have you been stopped by police or other authorities and asked about your immigration status? [BASE: Asked of those who came to the United States to live five years ago or earlier.]
Yes 5 2 1 1 2 9 7
No 95 98 99 94 97 91 93
Don’t know * – – 5 – – –
Full Survey Results
59
+ A Place to Call Home: What Immigrants Say Now About Life in America +
Full Survey Results
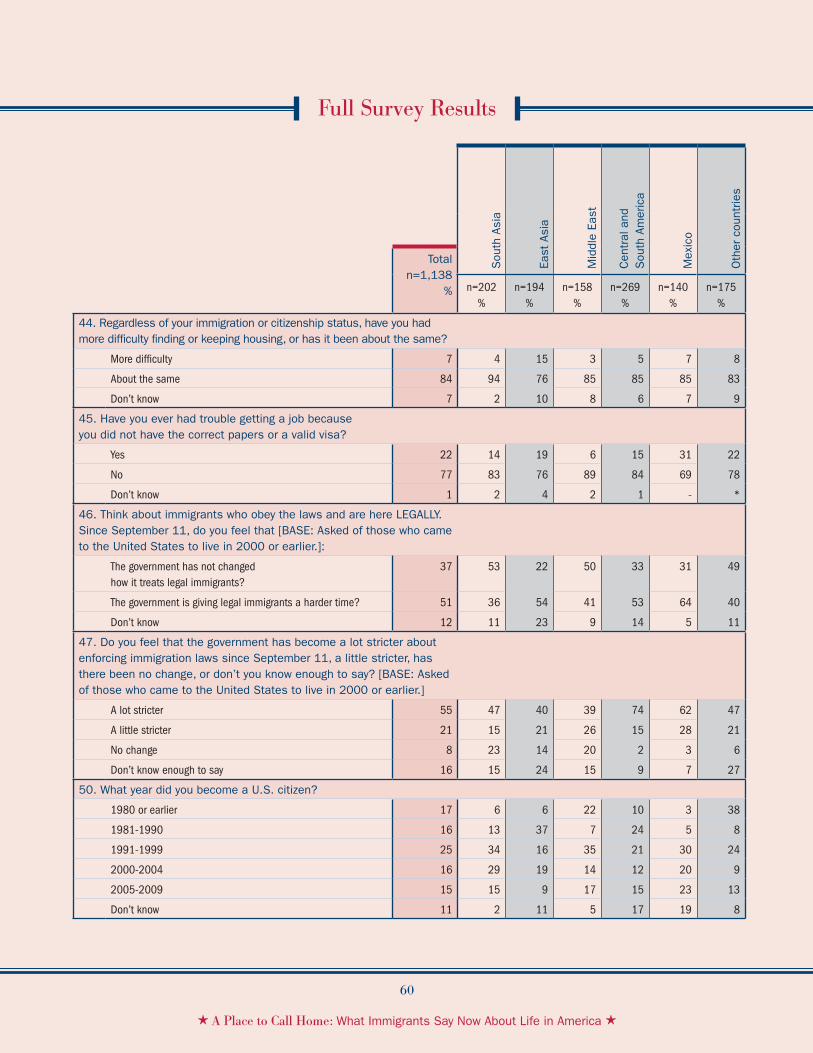
Sou
th A
sia
East
Asi
a
Mid
dle
East
Cen
tral
and
S
outh
Am
eric
a
Mex
ico
Oth
er c
ount
ries
Totaln=1,138
% n=202%
n=194%
n=158%
n=269%
n=140%
n=175%
44. Regardless of your immigration or citizenship status, have you had more difficulty finding or keeping housing, or has it been about the same?
More difficulty 7 4 15 3 5 7 8
About the same 84 94 76 85 85 85 83
Don’t know 7 2 10 8 6 7 9
45. Have you ever had trouble getting a job because you did not have the correct papers or a valid visa?
Yes 22 14 19 6 15 31 22
No 77 83 76 89 84 69 78
Don’t know 1 2 4 2 1 - *
46. Think about immigrants who obey the laws and are here LEGALLY. Since September 11, do you feel that [BASE: Asked of those who came to the United States to live in 2000 or earlier.]:
The government has not changed how it treats legal immigrants?
37 53 22 50 33 31 49
The government is giving legal immigrants a harder time? 51 36 54 41 53 64 40
Don’t know 12 11 23 9 14 5 11
47. Do you feel that the government has become a lot stricter about enforcing immigration laws since September 11, a little stricter, has there been no change, or don’t you know enough to say? [BASE: Asked of those who came to the United States to live in 2000 or earlier.]
A lot stricter 55 47 40 39 74 62 47
A little stricter 21 15 21 26 15 28 21
No change 8 23 14 20 2 3 6
Don’t know enough to say 16 15 24 15 9 7 27
50. What year did you become a U.S. citizen?
1980 or earlier 17 6 6 22 10 3 38
1981-1990 16 13 37 7 24 5 8
1991-1999 25 34 16 35 21 30 24
2000-2004 16 29 19 14 12 20 9
2005-2009 15 15 9 17 15 23 13
Don’t know 11 2 11 5 17 19 8
60
+ A Place to Call Home: What Immigrants Say Now About Life in America +
Full Survey Results Full Survey Results

Sou
th A
sia
East
Asi
a
Mid
dle
East
Cen
tral
and
S
outh
Am
eric
a
Mex
ico
Oth
er c
ount
ries
Totaln=1,138
% n=202%
n=194%
n=158%
n=269%
n=140%
n=175%
51. Are you also a citizen of another country or not, or are you not sure? [BASE: Asked of U.S. Citizens.]
Yes, also a citizen of another country 33 8 10 51 36 50 43
No, not a citizen of another country 54 78 71 36 56 25 51
Not sure 13 13 19 10 5 25 5
Don’t know 1 – – 3 3 – –
52. Are you currently in the process of becoming a U.S. citizen, is it something you plan to do in the future, or is it something you do not plan to do? [BASE: Asked of non-citizens]
In the process of becoming a U.S. citizen 18 26 9 66 14 9 30
Plan to do in the future 69 48 71 21 73 83 60
Do not plan to do 10 21 10 4 11 8 4
Don’t know 4 5 10 9 1 – 6
53. Which of these best describes what becoming a U.S. citizen (meant/means) to you? [BASE: Asked of citizens, those in the process of becoming a citizen, and those who are planning to become a citizen in the future.]
A dream come true 33 31 35 36 30 31 38
Something necessary 46 40 38 40 53 56 43
Something practical 17 27 17 21 14 12 18
Something not so important 1 1 3 * 1 * 1
Don’t know 2 1 7 3 1 * 1
Full Survey Results
61
+ A Place to Call Home: What Immigrants Say Now About Life in America +
Full Survey Results

Sou
th A
sia
East
Asi
a
Mid
dle
East
Cen
tral
and
S
outh
Am
eric
a
Mex
ico
Oth
er c
ount
ries
Totaln=1,138
% n=202%
n=194%
n=158%
n=269%
n=140%
n=175%
54. There are many reasons that people choose to become citizens. For each reason I read, please tell me if it (was/is) a major reason, a minor reason or not something you (thought about when you were becoming a citizen/would think about if you thought about becoming a citizen).
To have equal rights and responsibilities…
Major reason 80 66 68 81 82 87 81
Minor reason 8 18 16 8 5 3 5
Not a reason at all 9 11 9 7 7 9 9
Do not want to be a citizen * 2 1 – – – –
Don’t know 2 2 4 3 * * 5
To get the right to vote…
Major reason 78 62 59 77 84 85 84
Minor reason 12 25 30 10 8 7 4
Not a reason at all 9 11 10 8 7 6 11
Do not want to be a citizen 1 2 1 – – – 1
Don’t know 1 1 * 5 * 2 *
To have better legal rights and protections in the United States…
Major reason 78 64 69 80 72 92 75
Minor reason 10 23 15 6 12 3 12
Not a reason at all 9 9 10 7 13 5 11
Do not want to be a citizen 1 2 1 – – – 1
Don’t know 2 2 5 6 3 1 2
To show a commitment and pride in being an American…
Major reason 71 66 56 68 70 76 77
Minor reason 14 22 24 11 14 8 11
Not a reason at all 13 9 14 15 14 15 9
Do not want to be a citizen * 2 1 – – – –
Don’t know 3 2 5 5 2 1 4
62
+ A Place to Call Home: What Immigrants Say Now About Life in America +
Full Survey Results Full Survey Results

Sou
th A
sia
East
Asi
a
Mid
dle
East
Cen
tral
and
S
outh
Am
eric
a
Mex
ico
Oth
er c
ount
ries
Totaln=1,138
% n=202%
n=194%
n=158%
n=269%
n=140%
n=175%
So you would not have to worry about your immigration status…
Major reason 69 60 49 67 72 87 63
Minor reason 13 20 22 17 10 6 16
Not a reason at all 14 16 22 11 13 7 19
Do not want to be a citizen * 2 1 – – – –
Don’t know 3 2 6 5 5 – 3
To make it easier to get certain jobs…
Major reason 69 46 59 70 69 86 62
Minor reason 13 28 18 15 10 7 14
Not a reason at all 15 23 18 11 18 6 21
Do not want to be a citizen * 2 1 – 1 – –
Don’t know 2 2 4 3 2 * 2
To make it easier to travel in and out of the United States…
Major reason 65 55 48 68 68 78 60
Minor reason 17 23 23 16 13 12 20
Not a reason at all 15 20 22 11 13 8 18
Do not want to be a citizen * 2 1 – – – –
Don’t know 2 1 4 4 1 1 2
To make it easier to bring other family members to this country…
Major reason 49 28 38 35 56 69 38
Minor reason 17 27 24 24 15 11 15
Not a reason at all 32 41 33 37 27 19 46
Do not want to be a citizen * 2 1 – – – –
Don’t know 2 2 4 4 2 1 *
To qualify for government programs like Medicaid or food stamps…
Major reason 36 28 36 19 35 48 28
Minor reason 20 23 21 22 20 19 19
Not a reason at all 41 46 36 54 42 32 50
Do not want to be a citizen 1 2 1 – – – 1
Don’t know 3 2 7 4 3 1 2
Full Survey Results
63
+ A Place to Call Home: What Immigrants Say Now About Life in America +
Full Survey Results
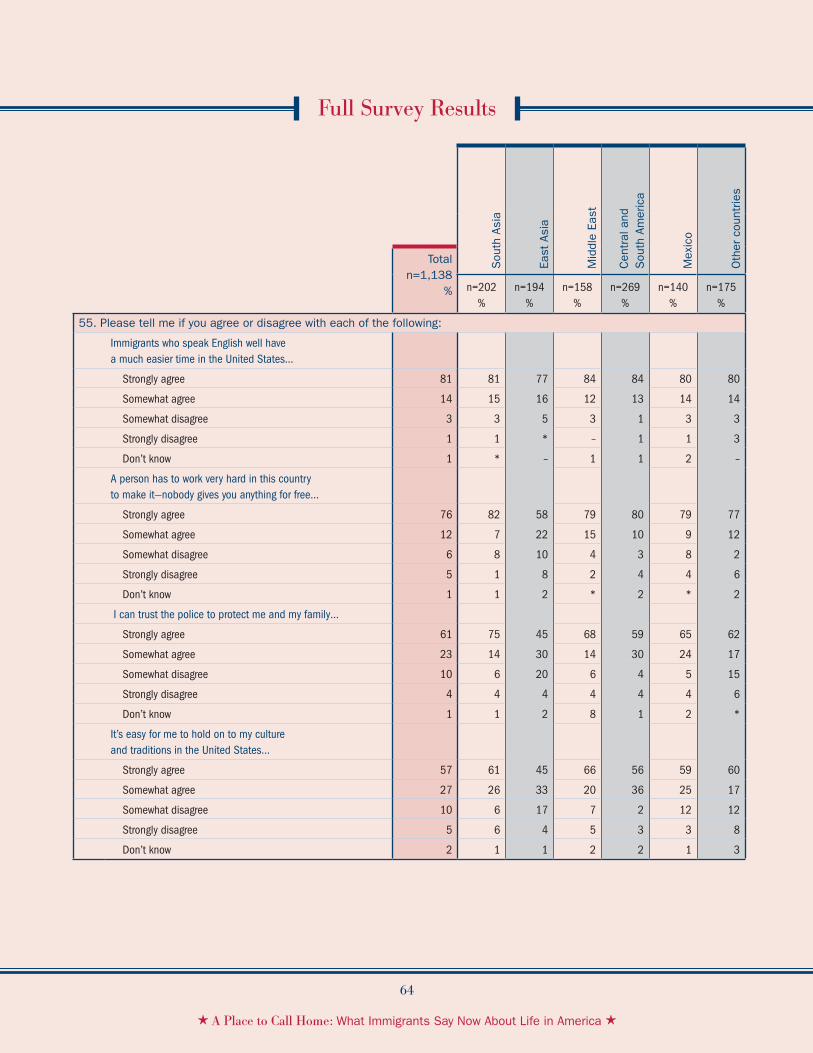
Sou
th A
sia
East
Asi
a
Mid
dle
East
Cen
tral
and
S
outh
Am
eric
a
Mex
ico
Oth
er c
ount
ries
Totaln=1,138
% n=202%
n=194%
n=158%
n=269%
n=140%
n=175%
55. Please tell me if you agree or disagree with each of the following:
Immigrants who speak English well have a much easier time in the United States…
Strongly agree 81 81 77 84 84 80 80
Somewhat agree 14 15 16 12 13 14 14
Somewhat disagree 3 3 5 3 1 3 3
Strongly disagree 1 1 * – 1 1 3
Don’t know 1 * – 1 1 2 –
A person has to work very hard in this country to make it—nobody gives you anything for free…
Strongly agree 76 82 58 79 80 79 77
Somewhat agree 12 7 22 15 10 9 12
Somewhat disagree 6 8 10 4 3 8 2
Strongly disagree 5 1 8 2 4 4 6
Don’t know 1 1 2 * 2 * 2
I can trust the police to protect me and my family…
Strongly agree 61 75 45 68 59 65 62
Somewhat agree 23 14 30 14 30 24 17
Somewhat disagree 10 6 20 6 4 5 15
Strongly disagree 4 4 4 4 4 4 6
Don’t know 1 1 2 8 1 2 *
It’s easy for me to hold on to my culture and traditions in the United States…
Strongly agree 57 61 45 66 56 59 60
Somewhat agree 27 26 33 20 36 25 17
Somewhat disagree 10 6 17 7 2 12 12
Strongly disagree 5 6 4 5 3 3 8
Don’t know 2 1 1 2 2 1 3
64
+ A Place to Call Home: What Immigrants Say Now About Life in America +
Full Survey Results Full Survey Results

Sou
th A
sia
East
Asi
a
Mid
dle
East
Cen
tral
and
S
outh
Am
eric
a
Mex
ico
Oth
er c
ount
ries
Totaln=1,138
% n=202%
n=194%
n=158%
n=269%
n=140%
n=175%
Most politicians are pretty much willing to say whatever it takes in order to get themselves elected…
Strongly agree 52 43 31 53 52 53 71
Somewhat agree 24 34 30 21 21 30 10
Somewhat disagree 10 15 9 4 11 8 9
Strongly disagree 8 2 18 8 7 7 3
Don’t know 6 6 12 13 8 2 6
The United States needs new immigrants to do the jobs that people born in the United States can’t or won’t do…
Strongly agree 48 38 27 29 56 66 37
Somewhat agree 22 30 30 23 20 18 20
Somewhat disagree 10 12 13 17 5 6 16
Strongly disagree 14 14 16 24 15 6 23
Don’t know 5 3 13 7 2 4 3
There’s a lot more discrimination and prejudice against immigrants who are not white than against immigrants who are white…
Strongly agree 33 27 20 13 40 41 33
Somewhat agree 26 31 29 34 16 29 25
Somewhat disagree 19 17 24 20 17 18 18
Strongly disagree 11 13 11 22 15 8 11
Don’t know 9 8 14 11 10 3 13
It’s easy for immigrants to come to the United States illegally and live here without getting caught…
Strongly agree 21 18 15 26 13 25 27
Somewhat agree 16 9 20 7 23 10 20
Somewhat disagree 19 21 22 13 16 22 16
Strongly disagree 34 39 34 39 36 37 27
Don’t know 8 8 9 15 11 3 10
Full Survey Results
65
+ A Place to Call Home: What Immigrants Say Now About Life in America +
Full Survey Results
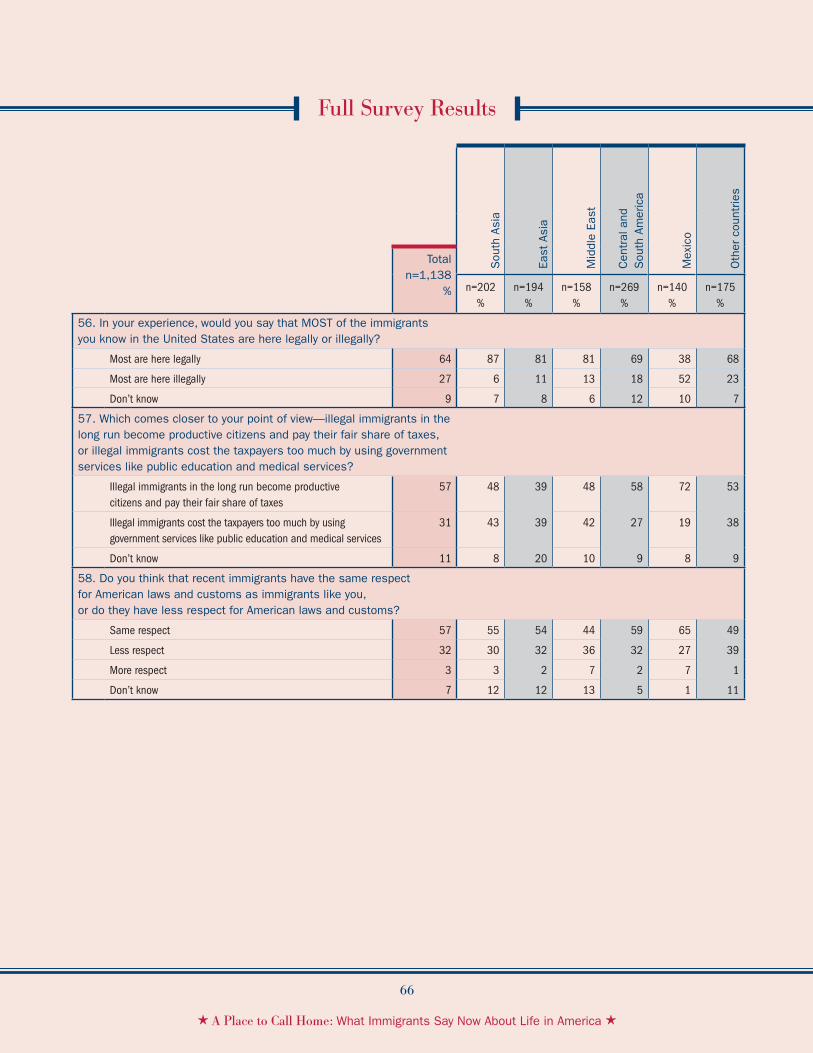
Sou
th A
sia
East
Asi
a
Mid
dle
East
Cen
tral
and
S
outh
Am
eric
a
Mex
ico
Oth
er c
ount
ries
Totaln=1,138
% n=202%
n=194%
n=158%
n=269%
n=140%
n=175%
56. In your experience, would you say that MOST of the immigrants you know in the United States are here legally or illegally?
Most are here legally 64 87 81 81 69 38 68
Most are here illegally 27 6 11 13 18 52 23
Don’t know 9 7 8 6 12 10 7
57. Which comes closer to your point of view—illegal immigrants in the long run become productive citizens and pay their fair share of taxes, or illegal immigrants cost the taxpayers too much by using government services like public education and medical services?
Illegal immigrants in the long run become productive citizens and pay their fair share of taxes
57 48 39 48 58 72 53
Illegal immigrants cost the taxpayers too much by using government services like public education and medical services
31 43 39 42 27 19 38
Don’t know 11 8 20 10 9 8 9
58. Do you think that recent immigrants have the same respect for American laws and customs as immigrants like you, or do they have less respect for American laws and customs?
Same respect 57 55 54 44 59 65 49
Less respect 32 30 32 36 32 27 39
More respect 3 3 2 7 2 7 1
Don’t know 7 12 12 13 5 1 11
66
+ A Place to Call Home: What Immigrants Say Now About Life in America +
Full Survey Results Full Survey Results

Sou
th A
sia
East
Asi
a
Mid
dle
East
Cen
tral
and
S
outh
Am
eric
a
Mex
ico
Oth
er c
ount
ries
Totaln=1,138
% n=202%
n=194%
n=158%
n=269%
n=140%
n=175%
59. When it comes to immigration in the United States do you think that our country is too open to immigrants from other countries, too closed to immigrants from other countries, or does our country strike the right balance in accepting immigrants from other countries?
Too open to immigrants from other countries 25 33 32 35 19 16 33
Too closed to immigrants from other countries 17 4 14 13 23 21 14
Strikes the right balance in accepting immigrants from other countries
50 58 42 42 47 58 44
Don’t know 8 5 12 10 10 4 9
60. When it comes to immigration in your community, do you think that people in your community are too open to immigrants from other countries, too closed to immigrants from other countries, or do they strike the right balance in accepting immigrants from other countries?
Too open to immigrants from other countries 22 26 31 35 18 17 23
Too closed to immigrants from other countries 13 5 14 7 16 20 6
Strike the right balance in accepting immigrants from other countries
54 61 43 48 54 55 56
Don’t know 11 8 12 10 11 7 16
Full Survey Results
67
+ A Place to Call Home: What Immigrants Say Now About Life in America +
Full Survey Results
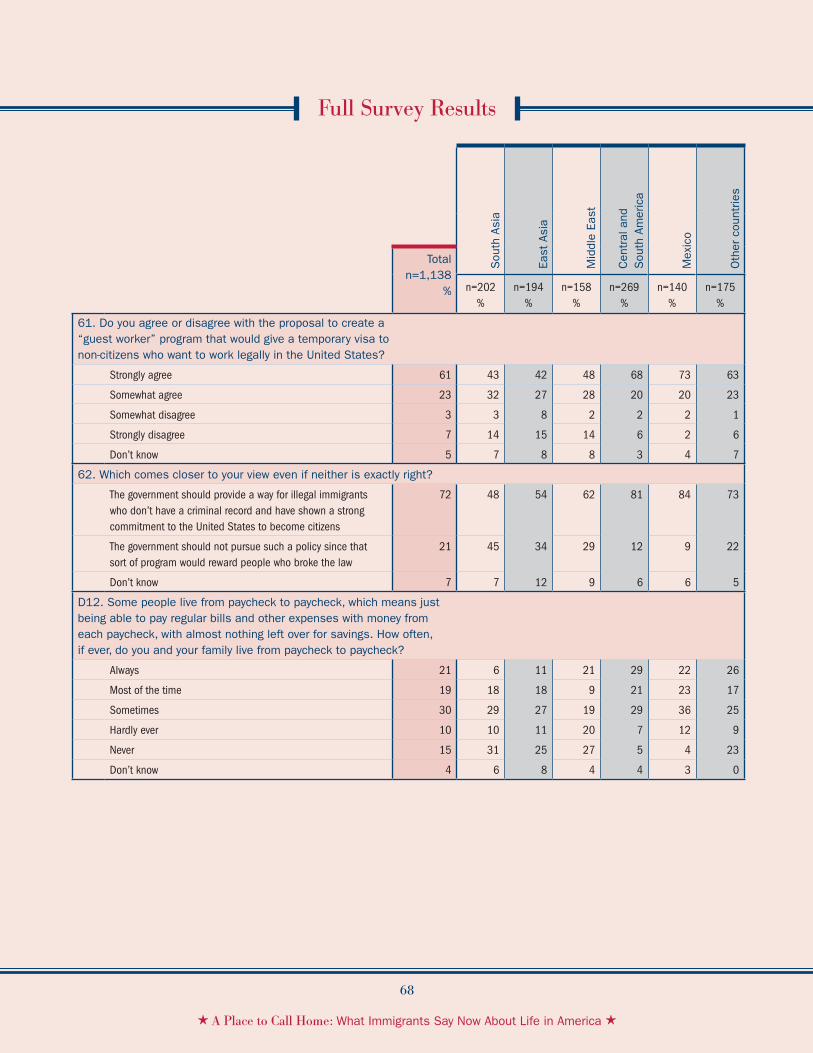
Sou
th A
sia
East
Asi
a
Mid
dle
East
Cen
tral
and
S
outh
Am
eric
a
Mex
ico
Oth
er c
ount
ries
Totaln=1,138
% n=202%
n=194%
n=158%
n=269%
n=140%
n=175%
61. Do you agree or disagree with the proposal to create a “guest worker” program that would give a temporary visa to non-citizens who want to work legally in the United States?
Strongly agree 61 43 42 48 68 73 63
Somewhat agree 23 32 27 28 20 20 23
Somewhat disagree 3 3 8 2 2 2 1
Strongly disagree 7 14 15 14 6 2 6
Don’t know 5 7 8 8 3 4 7
62. Which comes closer to your view even if neither is exactly right?
The government should provide a way for illegal immigrants who don’t have a criminal record and have shown a strong commitment to the United States to become citizens
72 48 54 62 81 84 73
The government should not pursue such a policy since that sort of program would reward people who broke the law
21 45 34 29 12 9 22
Don’t know 7 7 12 9 6 6 5
D12. Some people live from paycheck to paycheck, which means just being able to pay regular bills and other expenses with money from each paycheck, with almost nothing left over for savings. How often, if ever, do you and your family live from paycheck to paycheck?
Always 21 6 11 21 29 22 26
Most of the time 19 18 18 9 21 23 17
Sometimes 30 29 27 19 29 36 25
Hardly ever 10 10 11 20 7 12 9
Never 15 31 25 27 5 4 23
Don’t know 4 6 8 4 4 3 0
68
+ A Place to Call Home: What Immigrants Say Now About Life in America +
Full Survey Results Full Survey Results
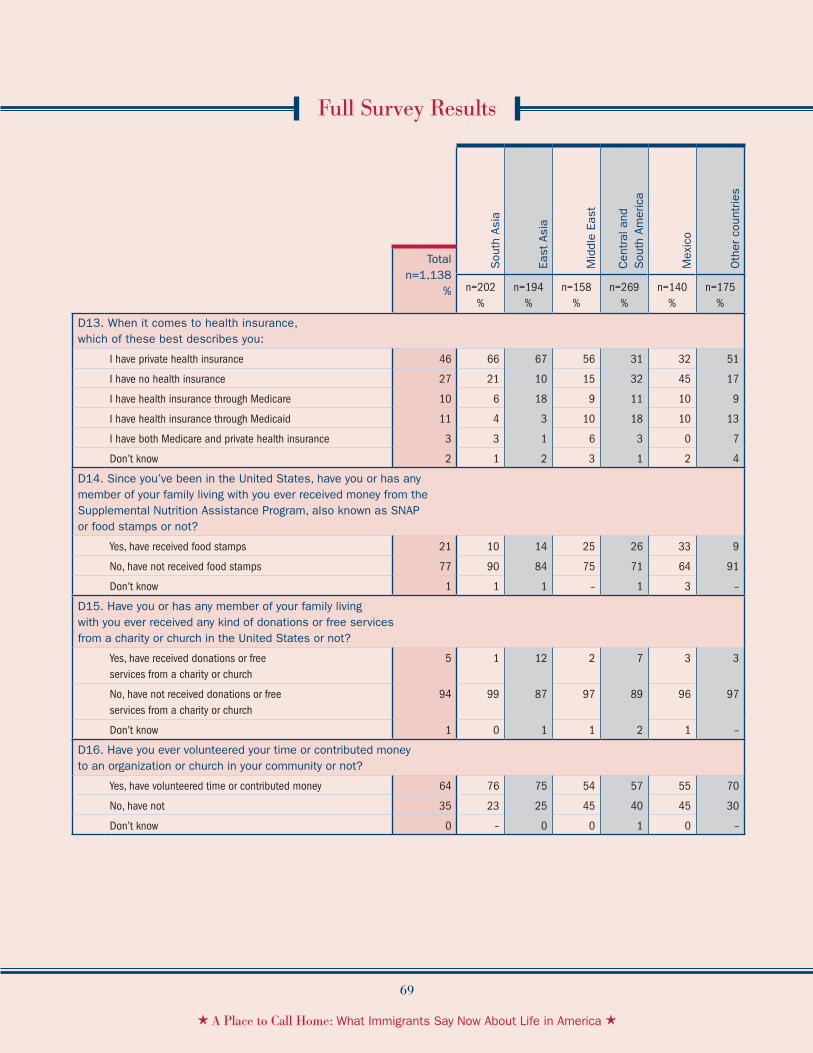
Sou
th A
sia
East
Asi
a
Mid
dle
East
Cen
tral
and
S
outh
Am
eric
a
Mex
ico
Oth
er c
ount
ries
Totaln=1,138
% n=202%
n=194%
n=158%
n=269%
n=140%
n=175%
D13. When it comes to health insurance, which of these best describes you:
I have private health insurance 46 66 67 56 31 32 51
I have no health insurance 27 21 10 15 32 45 17
I have health insurance through Medicare 10 6 18 9 11 10 9
I have health insurance through Medicaid 11 4 3 10 18 10 13
I have both Medicare and private health insurance 3 3 1 6 3 0 7
Don’t know 2 1 2 3 1 2 4
D14. Since you’ve been in the United States, have you or has any member of your family living with you ever received money from the Supplemental Nutrition Assistance Program, also known as SNAP or food stamps or not?
Yes, have received food stamps 21 10 14 25 26 33 9
No, have not received food stamps 77 90 84 75 71 64 91
Don’t know 1 1 1 – 1 3 –
D15. Have you or has any member of your family living with you ever received any kind of donations or free services from a charity or church in the United States or not?
Yes, have received donations or free services from a charity or church
5 1 12 2 7 3 3
No, have not received donations or free services from a charity or church
94 99 87 97 89 96 97
Don’t know 1 0 1 1 2 1 –
D16. Have you ever volunteered your time or contributed money to an organization or church in your community or not?
Yes, have volunteered time or contributed money 64 76 75 54 57 55 70
No, have not 35 23 25 45 40 45 30
Don’t know 0 – 0 0 1 0 –
Full Survey Results
69
+ A Place to Call Home: What Immigrants Say Now About Life in America +
Full Survey Results
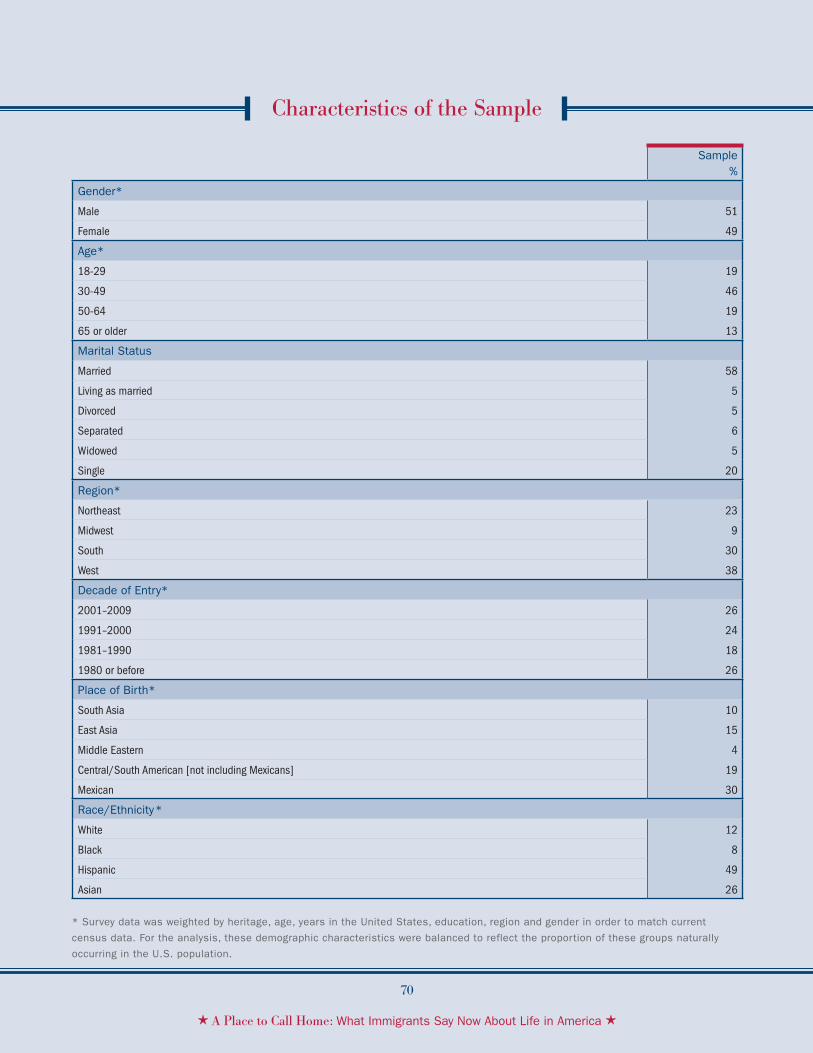
Sample%
Gender*
Male 51
Female 49
Age*
18-29 19
30-49 46
50-64 19
65 or older 13
Marital Status
Married 58
Living as married 5
Divorced 5
Separated 6
Widowed 5
Single 20
Region*
Northeast 23
Midwest 9
South 30
West 38
Decade of Entry*
2001–2009 26
1991–2000 24
1981–1990 18
1980 or before 26
Place of Birth*
South Asia 10
East Asia 15
Middle Eastern 4
Central/South American [not including Mexicans] 19
Mexican 30
Race/Ethnicity*
White 12
Black 8
Hispanic 49
Asian 26
* Survey data was weighted by heritage, age, years in the United States, education, region and gender in order to match current
census data. For the analysis, these demographic characteristics were balanced to reflect the proportion of these groups naturally
occurring in the U.S. population.
70
+ A Place to Call Home: What Immigrants Say Now About Life in America +
Characteristics of the Sample Characteristics of the Sample

Sample%
Citizen
U.S. citizen 46
Legal resident, not a citizen 35
Undocumented immigrant 15
Education*
Less than high school 29
High school graduate 27
Some college or trade school, no degree 11
Associate’s or two-year degree 7
Bachelor’s or four-year degree 14
Graduate/professional degree 11
Employment Status
Employed full-time 46
Employed part-time 16
Retired 11
Not Employed 23
Income
$15,000 or under 21
$15,001 to $25,000 20
$25,001 to $35,000 12
$35,001 to $50,000 10
$50,001 to $75,000 10
Over $75,000 15
Religious Affliation
Buddist 4
Catholic 46
Hindu 4
Judaism 1
Muslim15 5
Other Christian 22
No religion 13
Party Affiliation
Republican 13
Democrat 44
Independent 24
15 There are 124 Muslims in the sample before weighting.
Characteristics of the Sample
71
+ A Place to Call Home: What Immigrants Say Now About Life in America +
Characteristics of the Sample

About Carnegie Corporation of New York
Carnegie Corporation of New York was created by Andrew Carnegie in 1911 to promote “the advancement and diffusion of knowledge and understanding.” For over 95 years the Corporation has carried out Carnegie’s vision of philanthropy by building on these two major concerns: international peace and advancing educa-tion and knowledge.
72+ A Place to Call Home: What Immigrants Say Now About Life in America +

Founded in 1975 by social scientist and author Daniel Yankelovich and former U.S. Secretary of State Cyrus Vance, Public Agenda works to help the nation’s leaders better understand the public’s point of view and to help average citizens better understand critical policy issues. Our in-depth research on how citizens think about policy has won praise for its credibility and fairness from elected officials from both political parties and from experts and decision makers across the political spectrum. Our citizen education materials and award-winning Web site, publicagenda.org, offer unbiased information about the challenges the country faces. Twice nominated for the prestigious Webby award for best political site, PublicAgenda.org provides comprehensive information on a wide range of policy issues.
OFFICErSDaniel Yankelovich Chairman and Co-Founder
Lloyd Morrisett Chairman, Executive Committee
CO-FOUNDErCyrus Vance (1917–2002) Former Secretary of State
HONOrAry MEMBErS Peter G. PetersonChairman, Peter G. Peterson Foundation
Sidney HarmanFormer Chairman/CEO, Harman International Industries, Inc.
Bobby R. InmanAdmiral, U.S. Navy (retired)
BOArD OF DIrECTOrSDavid ColemanFounder, Student Achievement Partners, LLC
Philip HowardVice-Chairman, Covington & Burling and Founder, Common Good
Alice S. HuangSenior Faculty Associate, California Institute of Technology
Ann KirschnerUniversity Dean, Macaulay Honors College at the City University of New York
Alan I. LeshnerChief Executive Officer, American Association for the Advancement of Science
David MathewsPresident, Charles F. Kettering Foundation
Judith Davidson MoyersPresident, Public Affairs Television, Inc.
Deborah WadsworthSenior Advisor, Public Agenda
Mitchel WallersteinDean, Maxwell School of Citizenship and Public Affairs, Syracuse University
About Public Agenda
73+ A Place to Call Home: What Immigrants Say Now About Life in America +
The authors of “A Place to Call Home: What Immigrants Say Now About Life in America” would like to thank the following people for their support and assistance during the preparation of this report:
Our partners at the Carnegie Corporation of New York, especially Geri Mannion and Susan King, for providing us the opportunity to conduct this research and the freedom to explore the issues without constraint or bias;
Jean Johnson for her direction and assistance;
Steve Farkas and Ann Duffett, of the Farkas Duffett Research Group, for their consultation and guidance at the beginning stages of this research;
Samantha Dupont, who also contributed to this effort;
Shaheen Hasan and Melissa Feldsher for bringing our work to the attention of a broad audience;
Francie Grace, David White, Peiting Chen and Allison Rizzolo, of PublicAgenda.org, for producing a distinctive and highly informative online version of this report;
And Public Agenda President Ruth A. Wooden for her vision, insight and guidance.
Acknowledgements
74+ A Place to Call Home: What Immigrants Say Now About Life in America +


6 East 39th Street, New York, NY 10016 | T: 212.686.6610 | F: 212.889.3461 | www.PublicAgenda.org
437 Madison Avenue, New York, NY 10022 | T: 212.371.3200 | www.Carnegie.org