a place to call home - tn comptrollercomptroller.tn.gov/repository/re/housingreport.pdf · a place...
TRANSCRIPT

A Place to Call Home:
A Look at Housing in Tennessee
John G. Morgan Comptroller of the Treasury
Office of Research February 2005
STATE OF TENNESSEE
John G. Morgan COMPTROLLER OF THE TREASURY
Comptroller STATE CAPITOL
NASHVILLE, TENNESSEE 37243-0264
PHONE (615) 741-2501
February 14, 2005 The Honorable John S. Wilder Speaker of the Senate The Honorable Jimmy Naifeh Speaker of the House of Representatives and Members of the House and Senate Education Committees Ladies and Gentlemen: Transmitted herewith is the Office of Research’s study of the availability of affordable housing in Tennessee, as requested by members of the 2004 General Assembly. The study examines the state’s housing assistance funding, programming, and the needs of its citizens. I hope that the study provides useful information that will assist policymakers with the state’s approach to housing. Sincerely, John G. Morgan Comptroller of the Treasury
A Place to Call Home:
A Look at Housing in Tennessee
Bonnie S. Adamson, M.S.W. Senior Legislative Research Analyst
Russell Moore, M.S.W.
Senior Legislative Research Analyst
Sonya Phillips Associate Legislative Research Analyst
Ethel R. Detch, Director Douglas W. Wright, Assistant Director
Office of Research 505 Deaderick St., Suite 1700
Nashville, TN 37243-0268 phone 615/401-7911
fax 615/532-9237 www.comptroller.state.tn.us/orea/reports
John G. Morgan Comptroller of the Treasury
Office of Research February 2005

Comptroller of the Treasury, Office of Research. Authorization Number 307327, 600 copies, February 2005. This public document was promulgated at a cost of $2.34 per copy.

i
Executive Summary Stable housing is a foundation of healthy families, strong communities, and a productive society. Safe and healthy homes also play a major role in the physical, social, and educational development and welfare of children. “More than just a ‘roof over one’s head,’ the quality and location of housing powerfully shapes residents’ access to diverse bundles of social, psychological, political, and economic opportunities and resources.”1 In response to concerns about the availability of affordable housing, members of the 2004 General Assembly requested a study of housing assistance funding, programming, and needs. In Tennessee, 54 percent of low-income households spent more than 35 percent of their 1999 household income on housing. 2 The Census Bureau also reports that during that same period, 27,664 Tennessee households were without either complete kitchen or bathroom facilities.3 An overcrowded home has more than one person per room living in the unit; 61,191 homes in Tennessee met this criterion in 2001.4 As of August 2004, the Tennessee Housing Development Agency (THDA) had 5,855 federal Section 8 low-income rental assistance vouchers available in 75 counties across the state, with another 4,757 eligible families on waiting lists. The report concludes: Tennessee discontinued state funding for affordable housing. Tennessee once provided funding for affordable housing through the Housing Opportunities Using State Encouragement (HOUSE) program. Between July 1, 1989 and June 30, 1999, the dedicated funding streams for the HOUSE program generated approximately $125 million. In 2000, however, the General Assembly repealed laws that required a portion of those revenues be set aside for affordable housing; these two funding streams now accrue to the state’s general fund. As a result, agencies report that loss of HOUSE funds adversely affected their ability to provide rehabilitation assistance for rental and owner-occupied properties. Tennessee organizations previously used flexible HOUSE funds for various housing-related programs. Many providers indicated that they had to severely reduce or eliminate services altogether with the dissolution of the HOUSE funds. Some agencies reported reallocating money from other areas of their budget to attempt to salvage the programs. Others collaborated with community partners to try to replace HOUSE funding. (See pages 19-21.) Unlike a majority of states, Tennessee does not allocate monies to a state housing trust fund. The Housing Trust Fund Project defines such funds as “distinct accounts that
1 Lisa Robinson and Andrew Grant-Thomas, Race, Place, and Home: A Civil Rights and Metropolitan Opportunity Agenda, The Civil Rights Project, Harvard University, September 2004, p. 9. 2 THDA, Low-Income Tax Credit Program Needs Score Sheet 2004-05. 3 U.S. Census Bureau, 2000 Census Data Quick Facts, Table D-4. 4 Tennessee Housing Development Agency, Population and Housing Market Profile: Davidson County, http://www.state.tn.us/thda/Research/Census/davidson.pdf ., accessed Feb. 20, 2003.

ii
receive dedicated sources of public funds to support affordable housing.”5 Although Tennessee created a housing program fund and designated the Tennessee Housing Development Agency (THDA) to award grants to local housing programs, the taxes that formed the revenue stream for the program currently accrue to the state’s general fund.6 (See pages 17-18). In 2001, more than 275 housing trust funds in cities, counties, and states throughout the nation, provided at least $750 million annually for affordable housing programs, including the Affordable Housing Trust Fund in Knoxville and the Nashville Housing Fund. (See pages 21-22.) Through Public Chapter 961 of 2004, the General Assembly has already restored portions of the Realty Transfer Tax previously designated for conservation purposes and diverted to the General Fund in 2000, but not those portions earmarked for housing. The restoration of this tax revenue, as well as revenue from the Mortgage Recordation Tax, would greatly enhance THDA’s ability to assist numerous clients with housing services. The HOUSE program, which THDA administered, was comprised of funds from these taxes. Consequently, THDA had to terminate the program when these funds were no longer available to them. (See pages 22-23.) In many Tennessee communities, working class families cannot afford market rental rates and the need for rental assistance has outgrown program capacity. Census data analysis shows an average of only 161 affordable units (costing less than $530 a month) in the state per 100 households with very low-incomes (less than 50 percent of area median or $18,180 a year).7 While this may seem like an adequate supply of units, further analysis shows that more than half the households occupying these units had higher incomes. 8Although households with incomes below 80 percent of the area median income are eligible for federally subsidized housing through public housing developments and Section 8 housing choice vouchers, current program capacity is not adequate to serve all families in need. (See pages 23-24.) Proposed federal changes to the Section 8 program could provide Tennessee with more flexible funding and programming, but may reduce funding. The Bush administration has proposed converting all Section 8 program funding into flexible block grants to the states, a policy shift similar to the 1996 Welfare Reform Act. (See pages 25-26.) Lack of stable housing and poor housing conditions adversely affect children and their performance in school. Research has shown that “…30% of the poorest children (those from families with annual incomes of less than $10,000) had attended at least three different schools by third grade, while only 10% of middle-class children (from families with annual incomes of over $25,000) did so. Black children were more than twice as likely as white children to change schools this much.” (See pages 26-28.)
5 Mary E. Brooks, Housing Trust Fund Progress Report 2002: Local Responses to America’s Housing Needs, Housing Trust Fund Project, Center for Community Change, 2002. 6 See TCA § 13-23-402 and 13-23-403. 7 THDA, Low-Income Tax Credit Program Needs Score Sheet 2004-05. 8 THDA, Low-Income Tax Credit Program Needs Score Sheet 2004-05, Correspondence with THDA.

iii
Homeownership has increased over the past two decades; however, Tennessee continues to face challenges in boosting minority homeownership and reducing the number of foreclosures statewide. Despite an increase in the homeownership rate over the last 20 years, a gap persists between white and minority homeowners. The foreclosure rate is also higher than 20 years ago.9 (See pages 28-34.) Predatory lending practices fleece home equity from Tennessee homeowners and contribute to higher foreclosure rates. Borrowers stripped of their home equity are at an increased risk of foreclosure.10 Although the rate for subprime foreclosures is higher than average because of the greater credit risk among borrowers, some research suggests subprime loans with abusive characteristics, or predatory loans, substantially raise the subprime foreclosure rate. (See pages 34-40.) Tennessee does not operate an emergency mortgage assistance program.11 Since the 1980s, Pennsylvania has operated a Homeowners’ Emergency Mortgage Assistance Program (HEMAP). The program’s purpose is to “prevent widespread mortgage foreclosures and distressed sales of homes which result from default caused by circumstances beyond a homeowner’s control.” The program is also a cost-effective means to prevent homelessness and “allows homeowners to seek education, job training and alternative employment when they most need it.” North Carolina passed legislation establishing a mortgage assistance pilot program in 2004. (See pages 40-41.) In many cases, housing agencies can provide shelter but not the supportive services special needs populations require to live independently. Affordable assisted living and additional in-home support services would allow many elderly, disabled, and mentally ill residents to live somewhat independently in the community rather than forcing them into nursing homes or inpatient facilities. In addition to contributing to the quality of these individuals’ lives, such support services cost less. (See pages 41-42.) Many Tennessee Section 8 voucher holders have no legal protection from discrimination by property owners. Several housing program administrators expressed concern that voucher holders experience discrimination while searching for housing. Other states and some Tennessee municipalities have passed laws specifically prohibiting discrimination based on income source, which protects Section 8 voucher holders from denial of tenant application based solely on the use of a housing choice voucher to pay the rent. (See pages 42-43.)
9 Buffalo Branch, Federal Reserve Bank of New York, The Regional Economy of Upstate New York, “Examining the Rising Foreclosure Rate,” Spring 2003, p. 1. 10 Allen Fishbein, Harold L. Bunce, “Subprime Market Growth and Predatory Lending, “Housing Policy in the New Millennium Conference Proceedings, U.S. Department of Housing and Urban Development, 2001. 11 Pennsylvania Housing Finance Agency, “Homeowners’ Emergency Mortgage Assistance Program,” http://www.phfa.org/programs/hemap/, November 16, 2004; Pennsylvania Housing Finance Agency, “Answers to Common Questions About the Homeowner’s Emergency Mortgage Assistance Loan Program Administered by the Pennsylvania Housing Finance Agency,” http://www.phfa.org/programs/hemap/QandA.pdf, November 16, 2004.

iv
Survey respondents report a need for homeless people to receive special attention. In survey responses, agency staff consistently expressed the need for special attention to homeless subpopulations (such as victims of domestic violence, the severely mentally ill, the physically disabled, and substance abusers.) (See pages 43-44.) Tennessee does not maintain a comprehensive directory of successful affordable housing programs across the country. Direct and indirect providers of housing services may not be aware or have the time to research best housing practices. A directory of affordable housing programs would provide government officials, businesses, professional organizations and others interested in affordable housing with examples of best practices throughout the nation. The directory would also provide details on specific housing practices and identify areas of Tennessee with economic, demographic, and market conditions that might be appropriate to replicate. (See page 44.) Recommendations Legislative and administrative recommendations begin on page 45. The General Assembly may wish to consider:
• Appropriating state funds for housing assistance and creation of affordable housing units.
• Amending TCA § 13-23-402 to divert the mortgage recordation tax and the realty transfer tax back to THDA.
• Implementing strict legislation regulating the subprime lending markets to eliminate predatory lending practices.
• Providing initial startup funding for a secondary loan pool pilot program. • Providing THDA with funding to create a program to assist workers facing
foreclosure. • Passing legislation that supplements TCA § 4-21-203 to prohibit discrimination
against Section 8 voucher holders in Tennessee. The Tennessee Housing Development Agency should:
• Reexamine the programmatic requirements of the HOUSE program if the General Assembly restores funding to ensure the program continues to target changing housing needs.
• Continue to encourage and facilitate the expansion of homebuyer education and homeownership services into underserved areas of the state.
• Continue to encourage capacity building (improving management skills, resource development and diversification, training, etc.) among the state’s nonprofit housing organizations.
• Revisit efforts to develop a comprehensive directory of successful affordable housing programs across the country.
The Department of Financial Institutions should establish partnerships with local financial institutions that would provide more options for those seeking education regarding financial decisions.
Table of Contents Introduction ................................................................................................................. 1 Methodology................................................................................................................ 2 Survey analysis ............................................................................................... 2 Background................................................................................................................. 4 Federal Programs............................................................................................ 4 Rental Assistance...................................................................................... 4 Community Development .......................................................................... 6 Homeownership ...................................................................................... 10 Emergency Assistance............................................................................ 11 Programs for special populations ............................................................ 12 State Structure and Programs....................................................................... 15 Rental Assistance.................................................................................... 15 Housing Bonds ........................................................................................ 15 Tax Credits .............................................................................................. 16
Housing Opportunities Using State Encouragement (HOUSE) program................................................................................... 16 Grant Programs....................................................................................... 18 Home Buyer Education ........................................................................... 18 Property Tax Relief Program................................................................... 18
Analysis and Conclusions ......................................................................................... 19 Tennessee discontinued state funds for affordable housing ......................... 19 Tennessee does not allocate monies to a state housing trust fund .............. 21 Portions of Realty Transfer Tax restored to Conservation but not to Housing ......................................................................................... 22 Many working class families cannot afford market rental rates..................... 23 Section 8 changes may provide flexibility but reduce federal funds.............. 25
Children adversely affected by lack of stable housing and poor housing conditions ................................................................................ 26 Continuing challenges in boosting minority homeownership and reducing the number of foreclosures............................................................. 28 The Homeownership Gap by Race ......................................................... 28 The Homeownership Gap by Income...................................................... 31 Foreclosures............................................................................................ 31 Predatory lending practices negatively affect home equity and foreclosure rates............................................................................................ 34 Subprime Lending ................................................................................... 36 Impact on Foreclosures........................................................................... 37 North Carolina’s Experience.................................................................... 37 Federal Involvement ................................................................................ 39 Tennessee has no emergency mortgage assistance program ..................... 40 Housing agencies often cannot provide supportive services that special populations need to live independently ............................................. 41

Many Section 8 voucher holders have no legal protection from property owners’ discrimination..................................................................... 42 Survey respondents indicate the homeless need special attention............... 43 Tennessee does not maintain a comprehensive directory of successful housing program across the country ............................................................. 44
Recommendations .................................................................................................... 45 Legislative Recommendations ...................................................................... 45 Administrative Recommendations................................................................. 47 Appendices ............................................................................................................... 51 Appendix A: List of people interviewed ......................................................... 51 Appendix B: Housing Survey......................................................................... 53 Appendix C: Study Request Letter ................................................................ 59
Appendix D: Response Letter from Commissioner of Financial Institutions...................................................................................... 60 Appendix E: Response Letter from Executive Director, Tennessee Housing Development Authority................................................................... 61
List of Exhibits Exhibit 1: Maslow’s Hierarchy of Needs...................................................................... 1 Exhibit 2: Survey Respondents by Type of Organization............................................ 3 Exhibit 3: Services Provided by Survey Respondents ................................................ 3 Exhibit 4: Federal Section 8 Voucher Program in Tennessee .................................... 5 Exhibit 5: State Funds for Housing Grants for Low-Income Tennesseans Administered by THDA.............................................................................................. 17 Exhibit 6: Tennessee Housing Development Agency, 2004-05 Budget.................... 20 Exhibit 7: State Funding for Housing, 2002............................................................... 20 Exhibit 8: State Housing Trust Funds........................................................................ 22 Exhibit 9: THDA Section 8 Voucher Program as of August 31, 2004: Vouchers in Use........................................................................................................ 24 Exhibit 10: THDA Section 8 Voucher Program as of August 31, 2004: Families Waiting........................................................................................................ 25 Exhibit 11: Homeownership Rate in Tennessee, 1984-2003 .................................... 29 Exhibit 12: U.S. Homeownership Rate by Race and Ethnicity: 1994, 1998, 2002 .... 29 Exhibit 13: Homeownership Gap in Tennessee, 2000 .............................................. 30 Exhibit 14: Inventory of Loans in Foreclosure, First Quarter, 2004........................... 32 Exhibit 15: Full-Cycle Lending: A Continuum of Homeownership Support Services....................................................................................................... 49
1
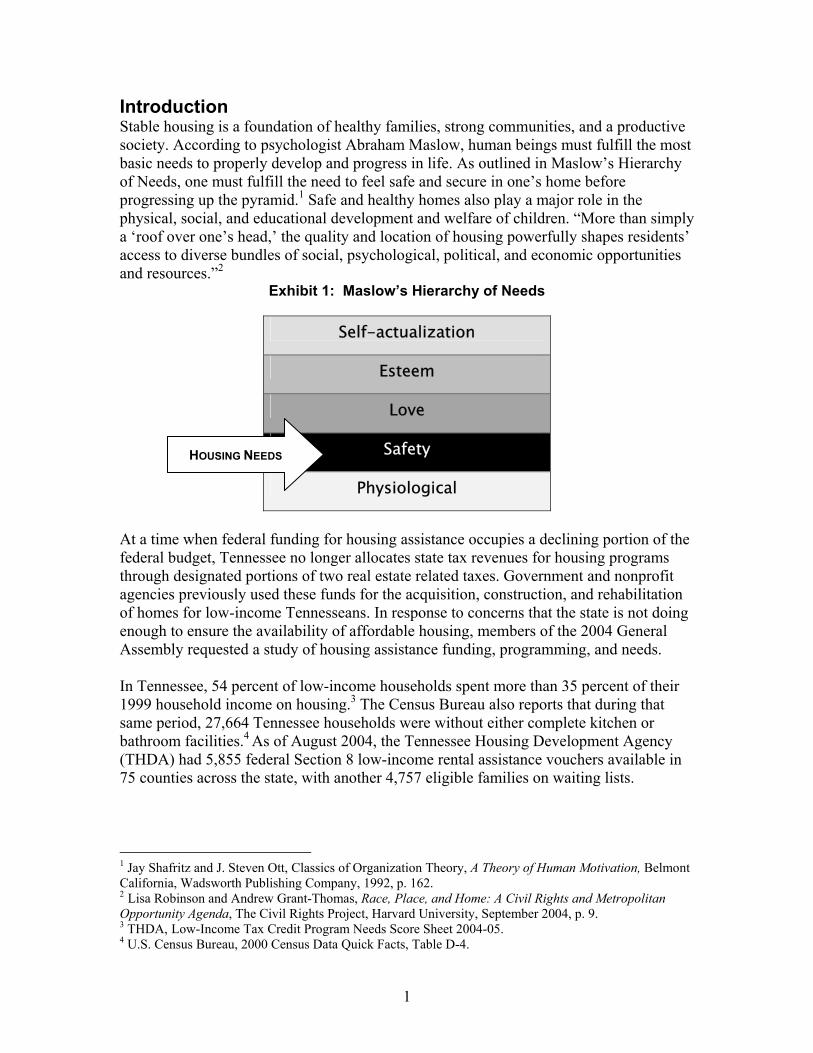
Introduction Stable housing is a foundation of healthy families, strong communities, and a productive society. According to psychologist Abraham Maslow, human beings must fulfill the most basic needs to properly develop and progress in life. As outlined in Maslow’s Hierarchy of Needs, one must fulfill the need to feel safe and secure in one’s home before progressing up the pyramid.1 Safe and healthy homes also play a major role in the physical, social, and educational development and welfare of children. “More than simply a ‘roof over one’s head,’ the quality and location of housing powerfully shapes residents’ access to diverse bundles of social, psychological, political, and economic opportunities and resources.”2
Exhibit 1: Maslow’s Hierarchy of Needs
Self-actualization
Esteem
Love
Safety
Physiological
At a time when federal funding for housing assistance occupies a declining portion of the federal budget, Tennessee no longer allocates state tax revenues for housing programs through designated portions of two real estate related taxes. Government and nonprofit agencies previously used these funds for the acquisition, construction, and rehabilitation of homes for low-income Tennesseans. In response to concerns that the state is not doing enough to ensure the availability of affordable housing, members of the 2004 General Assembly requested a study of housing assistance funding, programming, and needs. In Tennessee, 54 percent of low-income households spent more than 35 percent of their 1999 household income on housing.3 The Census Bureau also reports that during that same period, 27,664 Tennessee households were without either complete kitchen or bathroom facilities.4 As of August 2004, the Tennessee Housing Development Agency (THDA) had 5,855 federal Section 8 low-income rental assistance vouchers available in 75 counties across the state, with another 4,757 eligible families on waiting lists.
1 Jay Shafritz and J. Steven Ott, Classics of Organization Theory, A Theory of Human Motivation, Belmont California, Wadsworth Publishing Company, 1992, p. 162. 2 Lisa Robinson and Andrew Grant-Thomas, Race, Place, and Home: A Civil Rights and Metropolitan Opportunity Agenda, The Civil Rights Project, Harvard University, September 2004, p. 9. 3 THDA, Low-Income Tax Credit Program Needs Score Sheet 2004-05. 4 U.S. Census Bureau, 2000 Census Data Quick Facts, Table D-4.
HOUSING NEEDS

2
Methodology To gather information about available housing programs and services, as well as related needs in Tennessee, the Office of Research surveyed public and private nonprofit agencies. (See Appendix B.) In addition, analysts visited housing authorities, public nonprofits, and private agencies providing housing assistance in 13 counties of varying sizes across the state.5 Analysts also reviewed state statutes, research reports, and other states’ funding patterns and programs to determine national and state housing trends and possible best practices for meeting housing related needs. Comptroller’s staff interviewed administrators in the:
• Tennessee Housing Development Agency; • Department of Mental Health and Developmental Disabilities; • Department of Finance and Administration; • Commission on Aging and Disability; and • Department of Financial Institutions.
The project’s objectives were:
• To determine the funding patterns for housing assistance in Tennessee and compare to other states.
• To provide a comprehensive description of services available to help citizens with housing needs.
• To examine how funding changes in the last decade have affected services.
• To determine the current and developing housing needs across the state.
• To provide recommendations to meet existing and anticipated housing needs in Tennessee.
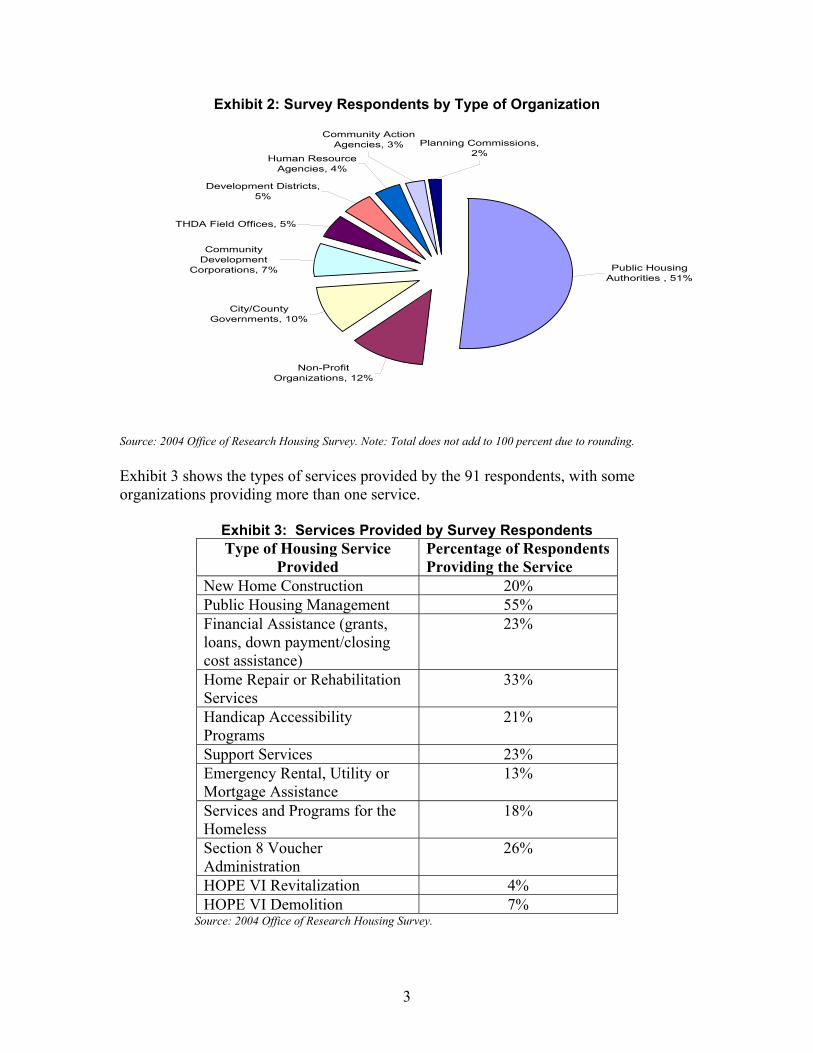
Survey analysis Office of Research staff surveyed both direct and indirect providers of housing services across Tennessee. Staff mailed surveys to approximately 143 organizations, including 90 public housing authorities, nine THDA field offices, seven development districts, seven human resource agencies, 13 community action agencies, three nonprofit agencies, and 14 local government agencies. Public housing authorities are the largest group of providers of affordable housing assistance in the state and had the highest representation and response rate. Staff also distributed surveys to a number of persons at interviews and housing meetings across the state. Ninety-one agencies responded; Exhibit 2 shows the response rate by type of organization.
5 Analysts conducted site visits in Bradley, Davidson, Greene, Hamilton, Henderson, Knox, Madison, Montgomery, Rhea, Sequatchie, Shelby, Sullivan, and Trousdale counties. Interview subjects included local public housing authority administrators and staff, human resource and community action agencies, community development corporations, local governments, and nonprofits.
3
Exhibit 2: Survey Respondents by Type of Organization
Public Housing Authorities , 51%
Non-Profit Organizations, 12%
City/County Governments, 10%
Community Development
Corporations, 7%
THDA Field Offices, 5%
Development Districts, 5%
Human Resource Agencies, 4%
Community Action Agencies, 3% Planning Commissions,
2%
Source: 2004 Office of Research Housing Survey. Note: Total does not add to 100 percent due to rounding. Exhibit 3 shows the types of services provided by the 91 respondents, with some organizations providing more than one service.
Exhibit 3: Services Provided by Survey Respondents Type of Housing Service
Provided Percentage of Respondents Providing the Service
New Home Construction 20% Public Housing Management 55% Financial Assistance (grants, loans, down payment/closing cost assistance)
23%
Home Repair or Rehabilitation Services
33%
Handicap Accessibility Programs
21%
Support Services 23% Emergency Rental, Utility or Mortgage Assistance
13%
Services and Programs for the Homeless
18%
Section 8 Voucher Administration
26%
HOPE VI Revitalization 4% HOPE VI Demolition 7%
Source: 2004 Office of Research Housing Survey.

4
Respondents mentioned other services including homebuyer education, planning, and research. Through the survey, researchers sought to determine the greatest areas of need throughout the state, learn about any impact that funding changes have had on organizational programs and services, and allow respondents to comment on housing issues. Background The following section contains a detailed description of federal and state programs addressing housing needs for low- and middle-income families and individuals in Tennessee. The report’s conclusions begin on page 19. Federal Programs Most funding for housing assistance comes from the federal Department of Housing and Urban Development (HUD). In 2002, Tennessee agencies providing housing related services received a total of $437,515,000 from HUD for rental assistance, homeownership, emergency shelter, supportive living, and community development programs.6 Unless otherwise referenced, all information in this section came from the websites of HUD (www.hud.gov) and the National Low Income Housing Coalition (www.nlihc.org). Rental Assistance According to a 1998 HUD survey of public housing waiting lists, the national average time a family waited for rental assistance was 11 months. The demand for public housing exceeds capacity in almost every area of the country and the public housing stock is shrinking as older units are demolished and not replaced at the same rate. HUD’s most widely recognized programs deal with rental assistance to low-income families earning less than 80 percent of the area median income (AMI). Eligible families and individuals receive rental assistance from state or local housing authorities through subsidized rent in public housing developments, privately owned multi-family Section 8 housing developments, or Housing Choice vouchers. HUD determines unit eligibility and rent subsidy amounts based on the Fair Market Rate (FMR) for the area. HUD calculates the FMR for different size living units using local market rates and area median incomes including the cost of utilities excluding phone service. Section 8 voucher holders cannot use vouchers in units with rents above the area FMR. For a two bedroom apartment in Tennessee, the monthly FMR ranges from $375 in most rural counties to $678 in the Nashville Metropolitan Service Area (MSA) consisting of Williamson, Davidson, Sumner, Robertson, Cheatham, Dickson, Rutherford, and Wilson counties. Residents of public housing developments pay rent on a sliding scale based on household income up to 30 percent of their adjusted monthly income or 10 percent of
6 U.S. Census Bureau, Consolidated Federal Funds Report for Fiscal Year 2002.

5
their gross monthly income. According to HUD, 43 percent of public housing households nationally are families with children, 22 percent are elderly households without children, and the remaining 35 percent are households headed by people with disabilities or those without children. Women head 38 percent of households in public housing; persons of color head just over half. Recipients of project-based Section 8 rental assistance living in privately owned developments pay 30 percent of their adjusted monthly income in rent with HUD subsidizing the remainder of the applicable FMR directly to the property owner. Families receiving tenant-based rental assistance in the form of Section 8 Housing Choice Vouchers can choose units from private property owners who accept vouchers for rent with HUD funds subsidizing their rent payments from 90 percent to 110 percent of FMR. Eligible units must meet federal housing quality standards and families may not pay more than 40 percent of monthly adjusted income for rent and utilities when the rent exceeds the payment standard. Elderly or disabled renters can apply for special vouchers that subsidize their living at home, in supportive community housing, or in designated public housing developments. Housing choice vouchers are portable, meaning a family can use them to move anywhere in the country where a functioning voucher program exists, although HUD places some limits on portability for families within their first year in the program. As of August 2004, Tennessee has 14,977 project-based Section 8 rental units available for low-income families and 30,617 Section 8 housing choice vouchers in use across the state. Local agencies administer 25,013 of those vouchers in 19 counties including the four largest urban areas. THDA manages the remaining 5,604 in 76 counties. Exhibit 4 shows the number of vouchers in use by county.
Exhibit 4: Federal Section 8 Voucher Program in Tennessee
Source: THDA and HUD websites.
Shelby
Davidson
1 - 150 151 - 375
Vouchers In Use As of August 31, 2004
525 - 1,300 1,301 - 3,600
376 - 524
3,601 - 5,000

6
HUD offers the Family Self-Sufficiency (FSS) Program to all Section 8 public housing residents and housing choice voucher holders. FSS is an employment and savings incentive program with two components: case management to help with employment and other goals and an escrow account into which the local public housing authority (PHA) deposits increased rental charges paid by a family as their income rises.
Federal Rental Assistance Programs Program/ Administrating agency
Target Population
Benefits/Services National Data Tennessee FY 2004 Funding
Public Housing/HUD Households with incomes less than 80% of the AMI
Sliding scale rent in public housing developments up to 30% of adjusted income
In FY 2004, HUD distributed $3.6 billion to 3,050 PHAs for 1.2 million housing units in 14,000 developments.
TN agencies received $79,620,000 in Public Housing capital funds
Project-based Section 8/HUD
Households with incomes less than 80% of the AMI with 40% of units reserved for households with incomes less than 30% of the AMI
Sliding scale rent in privately owned developments up to 30% of adjusted income
HUD distributed $3.6 billion in FY 2004 to subsidize more than 1.4 million units.
TN agencies received $104,972,000 in operating funds for low-income housing
Section 8 Housing Choice Vouchers/HUD
Households with incomes less than 80% of the AMI with 75% of vouchers going to households with incomes less than 30% of the AMI
Vouchers for subsidized rent in private market rental units
FY 2004 appropriations of $14.23 billion supported 2.1 million vouchers nationwide
$282,022,000 supported 30,617 housing choice vouchers statewide.
Family Self-Sufficiency/HUD
Residents of public housing and Section 8 program participants
Employment assistance, case management, and savings incentive program
In FY 2003, $48 million provided service coordinators for 67,770 voucher holders and 7,700 public housing residents
State level data not available.
Community Development In 1993, Congress created the HOPE VI program in response to a report from the National Commission on Severely Distressed Public Housing that urged Congress to develop a revitalization plan for public housing. The goals of the HOPE VI program are to improve the housing options for residents of distressed public housing developments and revitalize the surrounding communities. HUD distributes HOPE VI funds in grants available to local governments and nonprofits through a competitive process based on four factors:
• demonstrated need for revitalization assistance, • applicant capacity,

7
• revitalization plan quality, and • grant fund leverage potential.
According to the National Low Income Housing Coalition, as of 2002, HOPE VI developments had created 33,853 new public housing units to replace 78,259 demolished units, a net loss of 44,406. Furthermore, not all of the new HOPE VI units are affordable or accessible to the poorest displaced residents of the original development. When reauthorizing HOPE VI through 2006, Congress added tenant protection from permanent displacement and mandated resident participation in the planning process. The current administration has recommended no further appropriations for the HOPE VI program. The Housing and Community Development Act (HCDA) of 1974 established the Community Development Block Grant (CDBG) program. The program provides annual formula grants to entitled cities, urban counties, and states to develop viable urban communities by providing decent housing and a suitable living environment, and by expanding economic opportunities, principally for low- and moderate-income persons. Urban areas or cities with populations over 50,000 and counties of 200,000 or more, called “entitlement” jurisdictions, automatically receive 70 percent of the annual appropriations ($4.33 billion in 2004). The majority, or 70 percent, of CDBG funds must go to activities that benefit people with “low and moderate-incomes” defined as households with incomes below 80 percent of the area median income. CDBG funds are among the most flexible federal funds available to cities, states, and community-based organizations. Every jurisdiction must have a public participation plan encouraging and providing for input from low-income people. Public hearings are required in all stages of the CDBG program. An activity benefits the target population and is eligible for CDBG funds if it meets one of the following:
• Housing benefit- improving a single-family home occupied by a low- or moderate-income household or multi-family building occupied by at least 51 percent low- and moderate-income households. Eligible units must meet area “affordable housing” definitions.
• Area benefit- community improvements such as road or park construction in “service areas” with at least 51 percent lower-income households that benefit the target population.
• Limited clientele- a service or facility that has clientele of at least 51 percent low-income persons.
• Job creation or retention- projects designed to create jobs filled by or “available” to low-income people; “available to” means not requiring any specific skills or level of schooling. The employer agrees to give low-income applicants first consideration for the positions.
Local government entities use CDBG grant funds for programs such as housing construction and rehabilitation, down payment assistance, tenant education, construction and renovation of public facilities to make them handicapped accessible, and capacity building. They also use these funds to provide public services such as job training, transportation, and childcare.

8
The Brownfields Economic Development Initiative (BEDI), also a part of the Housing and Community Development Act (HCDA), is a competitive grant program for use by local governments to stimulate and promote economic and community development. Specifically targeting “brownfields” or vacant properties that may be contaminated, BEDI assists cities in redeveloping abandoned, idled, or underused industrial and commercial properties or facilities. To that end, federal regulations promote bundling BEDI funds with the Section 108 loan guarantee program. The Section 108 federal loan guarantee provision allows cities to use their current and future CDBG funds as security to borrow up to five times their most recent CDBG allocation to finance revitalization projects. The Government Accountability Office (GAO) estimates that there are 425,000 brownfield sites throughout the nation. The HOME Investment Partnership (HOME) program, the largest federal block grant program designed exclusively to create affordable housing for low-income households with less than 80 percent of the AMI, has the following priorities:
• to increase decent, safe, and affordable housing for very low-income households, focusing on rental units,
• to provide rental assistance to low-income tenants to make housing more affordable,
• to strengthen partnerships between local governments and nonprofit community development agencies through consolidated planning, and
• to mobilize financial planning resources of the private sector and governments in support of affordable housing.
HOME provides formula grants to states, local governments, and consortia designated as participating jurisdictions (PJs) to fund a wide range of activities that build, buy, and/or rehabilitate affordable housing for rent or homeownership. PJs also use these funds to provide direct rental assistance to low-income people. Grantees must set aside 15 percent of their HOME funds for Community Housing Development Organizations (CHDOs), nonprofit housing organizations that meet a series of HOME requirements. HUD provides technical assistance activities as well as set-asides for qualified community based nonprofit housing agencies to build the capacity of these partners. According to the National Low Income Housing Coalition, every federal HOME dollar generates three additional dollars in local public and private investment. The United States Department of Agriculture plays a significant role in affordable rural housing through its Rural Development division. Rural Development operates a number of affordable housing programs, with a major emphasis on “the acquisition of safe and sanitary housing through purchase or construction.”7 Rural Development helps low- and moderate-income rural Tennesseans buy, build, or improve their homes through both single- and multi-family programs, including:
7 USDA Rural Development, 2003 report, p.4, http://www.rurdev.usda.gov/rd/pubs/#state, accessed October 27, 2004.

9
• Direct Loans (Single Family) – Direct loans to very low- and low-income applicants, with repayment ability and loan payment based on income. Adjustable interest rates can reduce house payments as needed.
• Guaranteed Loans (Single Family) – Rural Development guarantees the loans of a local bank for moderate-income families unable to afford a down payment.
• 504 loans – Very low-income families receive home improvement and repair loans for the removal of health and safety hazards. Participants may borrow up to $20,000 at an interest rate of 1 percent.
• Rural Rental Housing (Multi-family) – Rural Development provides construction financing for affordable rental units in rural areas, as well as subsidized rental assistance.
• Farm Labor Housing (Multi-family) – provides loans/grants for rental housing in rural areas for domestic farm laborers. Example: The Farm Labor Housing program funded a four-bedroom housing unit for migrant workers on a Tipton County farm.8
Federal Community Development Programs
Program/ Administrating Agency
Purpose/Target Population
Structure National Data Tennessee Funding Data
HOPE VI/ HUD Replace distressed public housing with diverse options and revitalize surrounding communities.
Competitive grants to local governments or housing authorities
In FY 2004, Congress appropriated $149 million. As of 2002, grantees have created 33,853 new units.
In FY 2003, HUD awarded Nashville, Memphis, and Chattanooga each $250,000 for HOPE VI
Community Development Block Grant (CDBG)/ HUD
Develop viable urban communities by providing decent housing and suitable living environments principally for low- and moderate- (80% AMI) income persons.
Flexible annual formula grants 70% to entitled state & local governments based on population (cities over 50,000, counties over 200,000). 30% of funds go to nonprofits
In FY 2004, Congress appropriated $4.93 billion in CDBG funds
In FY 2004, Tennessee agencies received $27,611,000 in entitlement CDBG grants and $31,243,000 in competitive CDBG grants
Brownfields Economic Development Initiative (BEDI)/ HUD
Stimulate economic and community development targeting vacant or underused commercial and industrial properties
Competitive grants to local governments for use in conjunction with Section 108 allowing CDBG funds to secure loans
In FY 2003, BEDI received $25 million. In FY 2004, Congress provided $6.35 million to guarantee $275 million in loans but no BEDI money
State level data not available
HOME Investment Partnership/ HUD
Create affordable housing for low- and moderate-income families emphasizing
Flexible formula grants requiring a 25% match to state & local governments and
40% of 2004 appropriations of $5 billion or at least $3 million annually to each
In FY 2004, the state received $18,156,000 and local agencies
8 USDA Rural Development, 2003 report, http://www.rurdev.usda.gov/rd/pubs/#state; USDA Rural Development, Tennessee website, http://www.rurdev.usda.gov/tn/housing.htm, accessed October 27, 2004. Note: USDA indicates its Farm Labor Housing program helps increase efficiency, worker comfort, and allows for a reduction in housing expenses incurred by farming operations.
10
consolidated planning housing consortia state, plus $500,00 to states without another participating jurisdiction
received $14,032,000 in HOME grants
Rural Development/ Department of Agriculture (USDA)
Increase availability of safe, affordable housing in rural areas
USDA grants funds and secures loans for families or developers to buy, build, or improve housing
In FY 2004, Congress appropriated $3.46 billion for Rural Development programs and $8.48 billion in borrowing authority
In FY 2003, 3,200 families received $1.25 million in grants & $125.2 million in loans
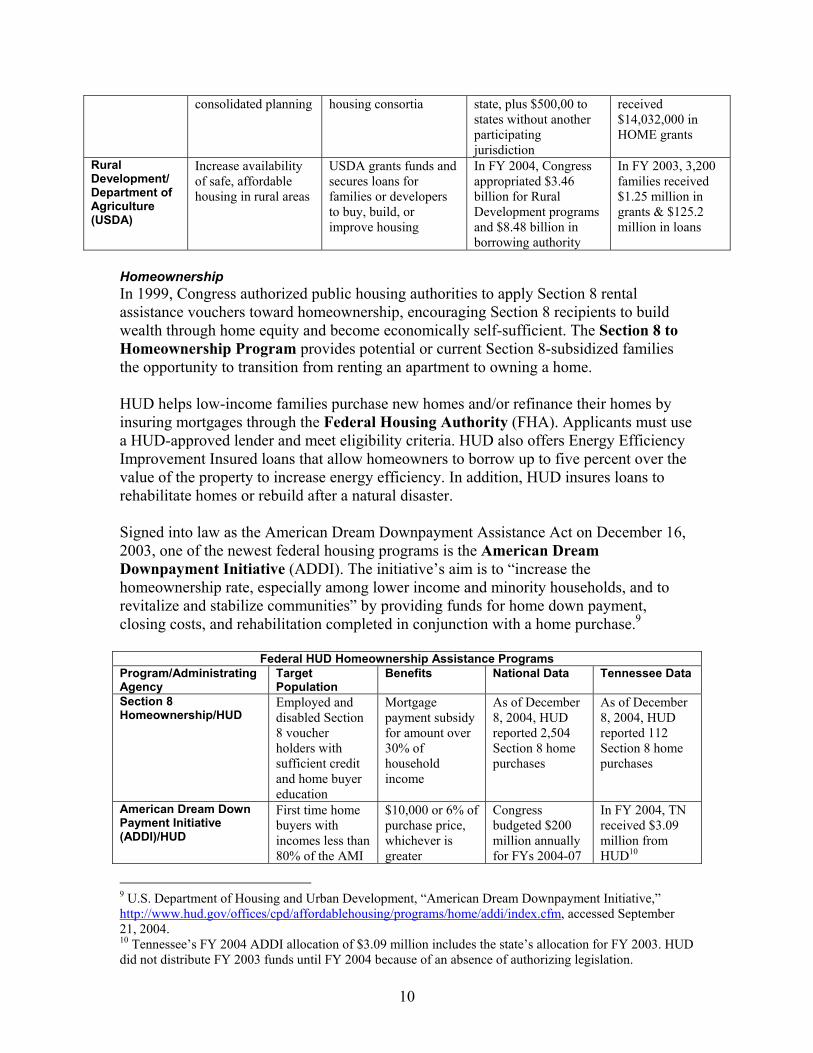
Homeownership In 1999, Congress authorized public housing authorities to apply Section 8 rental assistance vouchers toward homeownership, encouraging Section 8 recipients to build wealth through home equity and become economically self-sufficient. The Section 8 to Homeownership Program provides potential or current Section 8-subsidized families the opportunity to transition from renting an apartment to owning a home. HUD helps low-income families purchase new homes and/or refinance their homes by insuring mortgages through the Federal Housing Authority (FHA). Applicants must use a HUD-approved lender and meet eligibility criteria. HUD also offers Energy Efficiency Improvement Insured loans that allow homeowners to borrow up to five percent over the value of the property to increase energy efficiency. In addition, HUD insures loans to rehabilitate homes or rebuild after a natural disaster. Signed into law as the American Dream Downpayment Assistance Act on December 16, 2003, one of the newest federal housing programs is the American Dream Downpayment Initiative (ADDI). The initiative’s aim is to “increase the homeownership rate, especially among lower income and minority households, and to revitalize and stabilize communities” by providing funds for home down payment, closing costs, and rehabilitation completed in conjunction with a home purchase.9
Federal HUD Homeownership Assistance Programs Program/Administrating Agency
Target Population
Benefits National Data Tennessee Data
Section 8 Homeownership/HUD
Employed and disabled Section 8 voucher holders with sufficient credit and home buyer education
Mortgage payment subsidy for amount over 30% of household income
As of December 8, 2004, HUD reported 2,504 Section 8 home purchases
As of December 8, 2004, HUD reported 112 Section 8 home purchases
American Dream Down Payment Initiative (ADDI)/HUD
First time home buyers with incomes less than 80% of the AMI
$10,000 or 6% of purchase price, whichever is greater
Congress budgeted $200 million annually for FYs 2004-07
In FY 2004, TN received $3.09 million from HUD10
9 U.S. Department of Housing and Urban Development, “American Dream Downpayment Initiative,” http://www.hud.gov/offices/cpd/affordablehousing/programs/home/addi/index.cfm, accessed September 21, 2004. 10 Tennessee’s FY 2004 ADDI allocation of $3.09 million includes the state’s allocation for FY 2003. HUD did not distribute FY 2003 funds until FY 2004 because of an absence of authorizing legislation.

11
Emergency Assistance The Emergency Food and Shelter Program (EFSP) helps families survive financial emergencies and crises and avoid becoming homeless. EFSP funds supplement the work of local agencies in the neediest areas by providing food, shelter, and utility assistance. HUD defines areas of need based on unemployment rates and number of resident individuals below the poverty level. Congress established the Low Income Home Energy Assistance Program (LIHEAP) in response to the energy crisis of the 1970s to provide very low-income households with assistance meeting their home energy needs. The Department of Health and Human Services (DHHS) distributes LIHEAP funds to states using a block grant formula based on the number of households in poverty and relative weather conditions. States design their own programs for disbursement of the LIHEAP dollars. The Basic Energy Assistance and Crisis Assistance components assist low-income individuals, seniors, and the disabled to pay monthly energy bills and make up most program expenditures. States can spend up to 15 percent of their LIHEAP allocation on weatherization programs to help households improve energy efficiency. According to the National Low Income Housing Coalition, fewer than 20 percent of all eligible households in the country received LIHEAP assistance in FY 2004.
Federal Emergency Assistance Programs Program/ Administrating Agency
Purpose/Target Population
Benefits/ Services
National Data Tennessee Data
Emergency Food and Shelter Program (EFSP)/ administered by the Federal Emergency Management Agency (FEMA) until FY 2004 but transferred to HUD in FY 2005
Supplement local efforts to prevent homelessness by helping families through financial crisis. Local service providers determine individual eligibility requirements.
Meals, groceries, temporary lodging, or one month’s rent or mortgage payment
FY 2001 appropriations of $140 million provided 81. 9 million meals, 4 million nights of shelter, 199,998 utility payments, and 156,973 rent/ mortgage payments. FY 2004 funds totaled $151,507,000
In FY 2004, Tennessee agencies received a total of $2,508,000
Low Income Home Energy Assistance Program (LIHEAP)/Department of Health and Human Services (DHHS)
Help very low-income (less than 50% of the AMI) households with their energy bills. Flexible formula grants allow states to design their own programs.
Basic Energy Assistance for monthly bills and Crisis Assistance for emergency help with energy costs
FY 2004: $1.79 billion in LIHEAP funding helped nearly 4.6 million homes
In FY 2004, Tennessee received $24,392,000 in LIHEAP funding

12
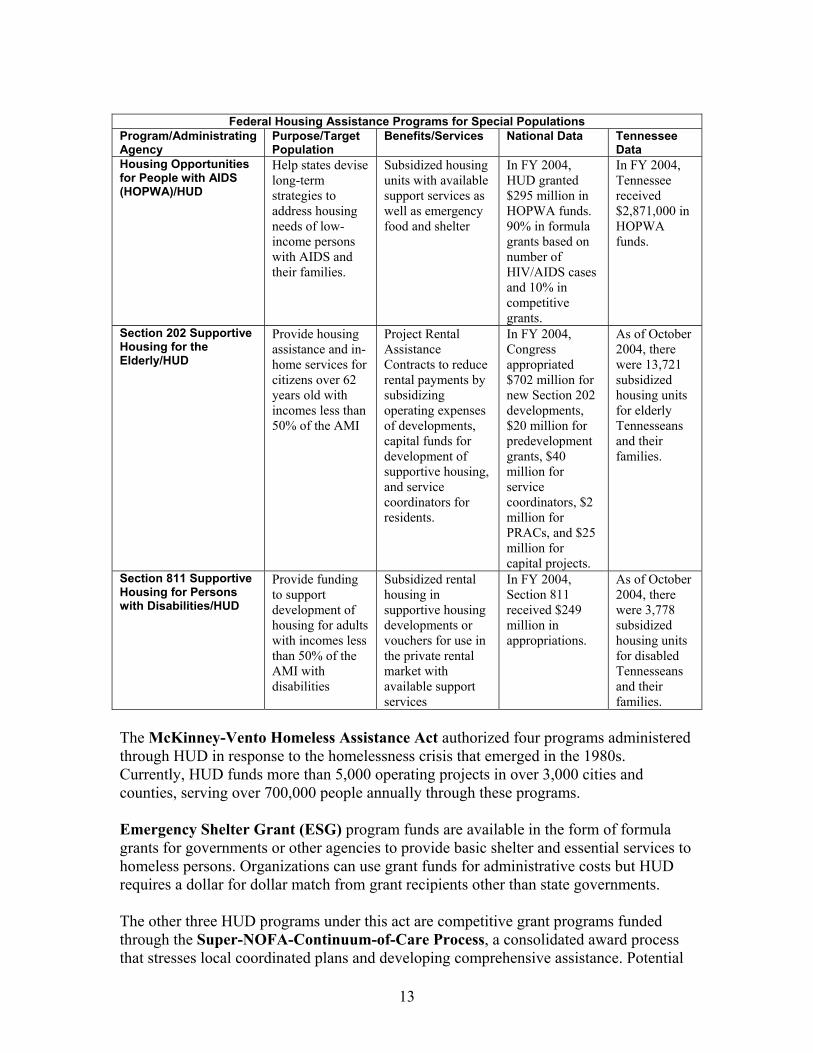
Programs for special populations Congress passed the AIDS Housing Opportunities Act in 1990, which created the Housing Opportunities for People with AIDS (HOPWA) program to provide funding to address the needs of low-income persons living with AIDS and their families. Currently, 38 states and 79 cities receive HOPWA formula grants and the HUD Office of HIV/AIDS administers 30 of the competitively won grants. Established under the 1959 Housing Act, the Section 202 Supportive Housing for the Elderly program provides funds to help communities assist low-income senior citizens with housing and in-home services. The average age of a Section 202 resident is 79, with 39 percent over 80. The average annual income in Section 202-supported households is $10,018. About a third of all Section 202 properties have a full-time service coordinator who assists low-income elderly and disabled residents in the community around a Section 202 property. Service coordinators assess residents’ needs, broker services, and monitor service delivery. Additionally, HUD has added three relatively new Section 202 components:
• predevelopment planning grants, • assisted living conversion grants to meet the growing need for affordable assisted
living, and • emergency capital repair funds for existing developments.
Created by Congress in 1990, the Section 811 Supportive Housing for Persons with Disabilities program provides funding to nonprofit developers building and operating housing for low-income individuals with physical or developmental disabilities or chronic mental illness and their families. The Section 811 program has three main components:
• interest-free capital advances to nonprofits for constructing, acquiring, or rehabilitating supportive housing. Developers do not have to repay these capital advances as long as the development remains available for low-income disabled households for at least 40 years.
• Project Rental Assistance Contracts (PRACs), covering the difference between the developments’ operating costs and residents’ rental payments of 30 percent of their adjusted income.
• tenant-based rental contract housing vouchers for use in the mainstream rental market (limited to 25 percent of appropriations).
HUD allocates Section 811 units to each HUD field office based on need, including the number of disabled citizens over 16 in the service area. Application for Section 811 funds must include a supportive services plan, but agencies cannot require residents to accept any services as a condition of occupancy.
13
Federal Housing Assistance Programs for Special Populations
Program/Administrating Agency
Purpose/Target Population
Benefits/Services National Data Tennessee Data
Housing Opportunities for People with AIDS (HOPWA)/HUD
Help states devise long-term strategies to address housing needs of low-income persons with AIDS and their families.
Subsidized housing units with available support services as well as emergency food and shelter
In FY 2004, HUD granted $295 million in HOPWA funds. 90% in formula grants based on number of HIV/AIDS cases and 10% in competitive grants.
In FY 2004, Tennessee received $2,871,000 in HOPWA funds.
Section 202 Supportive Housing for the Elderly/HUD
Provide housing assistance and in-home services for citizens over 62 years old with incomes less than 50% of the AMI
Project Rental Assistance Contracts to reduce rental payments by subsidizing operating expenses of developments, capital funds for development of supportive housing, and service coordinators for residents.
In FY 2004, Congress appropriated $702 million for new Section 202 developments, $20 million for predevelopment grants, $40 million for service coordinators, $2 million for PRACs, and $25 million for capital projects.
As of October 2004, there were 13,721 subsidized housing units for elderly Tennesseans and their families.
Section 811 Supportive Housing for Persons with Disabilities/HUD
Provide funding to support development of housing for adults with incomes less than 50% of the AMI with disabilities
Subsidized rental housing in supportive housing developments or vouchers for use in the private rental market with available support services
In FY 2004, Section 811 received $249 million in appropriations.
As of October 2004, there were 3,778 subsidized housing units for disabled Tennesseans and their families.
The McKinney-Vento Homeless Assistance Act authorized four programs administered through HUD in response to the homelessness crisis that emerged in the 1980s. Currently, HUD funds more than 5,000 operating projects in over 3,000 cities and counties, serving over 700,000 people annually through these programs. Emergency Shelter Grant (ESG) program funds are available in the form of formula grants for governments or other agencies to provide basic shelter and essential services to homeless persons. Organizations can use grant funds for administrative costs but HUD requires a dollar for dollar match from grant recipients other than state governments. The other three HUD programs under this act are competitive grant programs funded through the Super-NOFA-Continuum-of-Care Process, a consolidated award process that stresses local coordinated plans and developing comprehensive assistance. Potential

14
grantees as well as those seeking renewal of existing grants must all participate in their communities’ Continuum of Care process to earn consideration for funding.
• HUD awards Supportive Housing Program (SHP) funds to states, communities, and nonprofits to finance transitional housing, permanent supportive housing, support services, innovative and alternative housing, and safe havens.
• PHAs and nonprofits receive new Section 8 Moderate Rehabilitation for Single Room Occupancy Dwellings for Homeless Individuals (SRO) grants to provide rental assistance to homeless individuals through the construction of single room units. HUD funds SRO renewals through the Housing Certificate Fund.
• State and local governments, PHAs, and Indian housing agencies receive Shelter Plus Care (S+C) grants to provide rental assistance to homeless persons with disabilities in conjunction with support services funded through another source.
McKinney-Vento Homeless Assistance Act Programs
Program/ Administrating Agency
Purpose/Target Population
Structure/Benefits National Data Tennessee Data
Emergency Shelter Grant Program (ESG)/HUD
Provide basic shelter and essential services to homeless persons.
Formula grants to governments and other agencies to construct, rehab, maintain, or operate shelters and provide case management, substance abuse treatment and/or childcare.
In FY 2004, Tennessee received $2,139,083 in ESG funds: $1,379,083 for the state program and $760,000 for the four major urban areas.
Section 8 Rehabilitation for Single Room Occupancy Dwellings for Homeless Individuals (SRO)/HUD
Increase availability of transitional and emergency housing for the homeless.
Rental assistance to homeless persons through the construction of single room units.
In FY 2004, Congress appropriated $929 million for Emergency Shelter grants, transitional housing and new permanent housing for homeless individuals and families including SRO rehabilitation programs
State level data not available.
Supportive Housing Program (SHP)/HUD
Help homeless people meet three goals: -residential security -increase skills and income -self-determination.
Finance transitional or supportive housing, support services, innovative or alternative housing or safe havens.
In FY 2004, Congress appropriated $122 million for Supportive Housing programs
In FY 2003, Tennessee received a total of $11,325,140 in new and renewed SHP grants.
Shelter Plus Care (S+C)/HUD
Supplement already funded support services with funds for rental assistance for disabled homeless individuals.
Rental assistance through subsidized units.
In FY 2004, Congress appropriated $194 million for S+C programs nationwide
In FY 2003, Tennessee agencies received a total of $3,871,200 in S+C grants
15
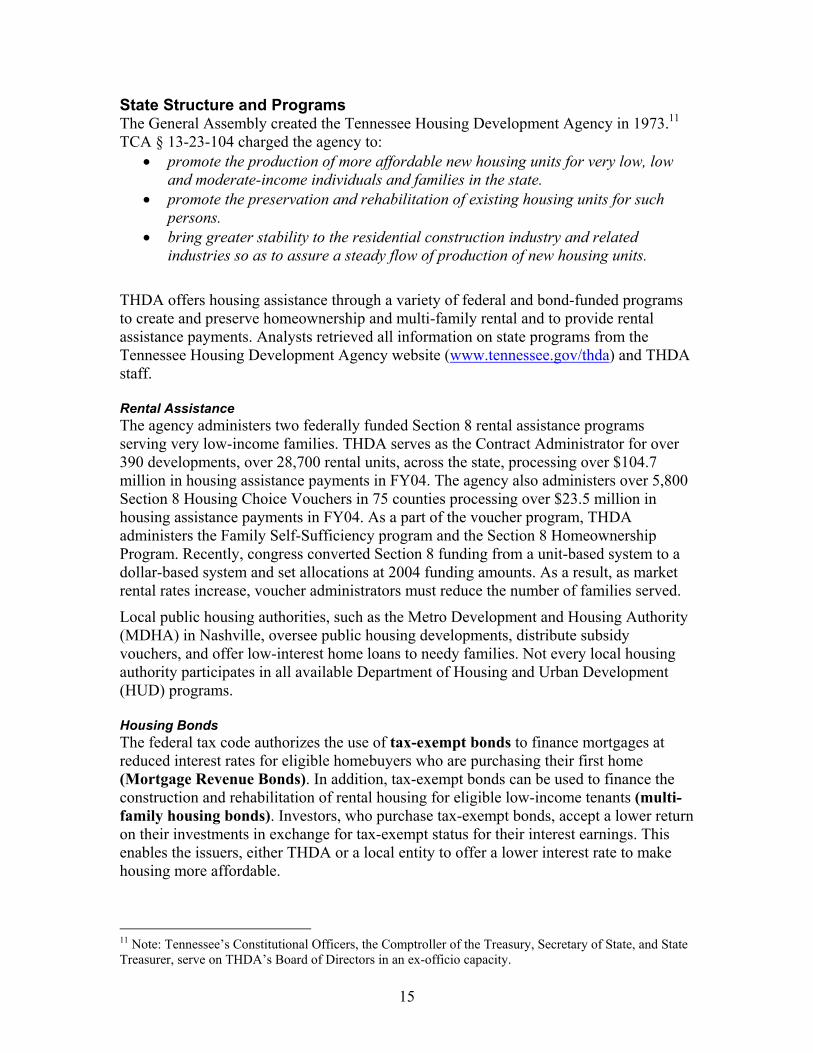
State Structure and Programs The General Assembly created the Tennessee Housing Development Agency in 1973.11 TCA § 13-23-104 charged the agency to:
• promote the production of more affordable new housing units for very low, low and moderate-income individuals and families in the state.
• promote the preservation and rehabilitation of existing housing units for such persons.
• bring greater stability to the residential construction industry and related industries so as to assure a steady flow of production of new housing units.
THDA offers housing assistance through a variety of federal and bond-funded programs to create and preserve homeownership and multi-family rental and to provide rental assistance payments. Analysts retrieved all information on state programs from the Tennessee Housing Development Agency website (www.tennessee.gov/thda) and THDA staff. Rental Assistance The agency administers two federally funded Section 8 rental assistance programs serving very low-income families. THDA serves as the Contract Administrator for over 390 developments, over 28,700 rental units, across the state, processing over $104.7 million in housing assistance payments in FY04. The agency also administers over 5,800 Section 8 Housing Choice Vouchers in 75 counties processing over $23.5 million in housing assistance payments in FY04. As a part of the voucher program, THDA administers the Family Self-Sufficiency program and the Section 8 Homeownership Program. Recently, congress converted Section 8 funding from a unit-based system to a dollar-based system and set allocations at 2004 funding amounts. As a result, as market rental rates increase, voucher administrators must reduce the number of families served.
Local public housing authorities, such as the Metro Development and Housing Authority (MDHA) in Nashville, oversee public housing developments, distribute subsidy vouchers, and offer low-interest home loans to needy families. Not every local housing authority participates in all available Department of Housing and Urban Development (HUD) programs. Housing Bonds The federal tax code authorizes the use of tax-exempt bonds to finance mortgages at reduced interest rates for eligible homebuyers who are purchasing their first home (Mortgage Revenue Bonds). In addition, tax-exempt bonds can be used to finance the construction and rehabilitation of rental housing for eligible low-income tenants (multi-family housing bonds). Investors, who purchase tax-exempt bonds, accept a lower return on their investments in exchange for tax-exempt status for their interest earnings. This enables the issuers, either THDA or a local entity to offer a lower interest rate to make housing more affordable.
11 Note: Tennessee’s Constitutional Officers, the Comptroller of the Treasury, Secretary of State, and State Treasurer, serve on THDA’s Board of Directors in an ex-officio capacity.

16
Nationally, the average MRB individual borrower earns two-thirds the national median income and half the conventional homebuyer’s income. In multi-family bond-financed developments, 40 percent of the residents must have incomes below 60 percent of the area median income (AMI) and 20 percent must have incomes less than 50 percent of the AMI. These income-restricted apartments financed through multi-family bonds must remain affordable for at least 15 years. In FY04, THDA funded 2,958 single-family loans for a total of $271.9 million. These loans included 30-year fixed rate mortgages under three programs. The Great Rate program provided below market 30-year fixed rate mortgages and 30-year fixed rate mortgages with a four percent grant for a down payment and closing costs. THDA offered zero percent 30-year fixed rate mortgages for low-income families working with nonprofit agencies under the New Start Zero Percent program. In addition, THDA provided below market rate 30-year fixed mortgages to aid families affected by the 2003 natural disasters under the Disaster Relief and Economic Recovery program. THDA allocates bond authority on a tax-exempt basis to local issuers to finance affordable rental housing. In 2004, local entities issued $47.4 million in bonds to create or rehabilitate units of affordable housing. Tax Credits The Low-Income Housing Tax Credit (LIHTC) program, created by the Tax Reform Act of 1986, provides a dollar-for-dollar reduction of federal income tax liability for owners of low-income rental housing based on development costs. Either 20 percent of units in these developments must be reserved for renters with incomes less than 50 percent of the area median income or 40 percent reserved for renters with incomes below 50 percent of the AMI. LIHTC-financed apartments must remain affordable for at least 30 years. Like housing bonds, federal law caps states’ allocation of available credits based on population. In 2004, Congress raised the cap to $1.80 per capita, with a minimum of $2,075,000 per state. According to the National Low Income Housing Coalition, each year the LIHTC program leverages about $6 billion in private investments and produces more than 125,000 affordable apartments. As tax expenditures, the LIHTC program does not require direct appropriations. The estimated cost to the Department of Treasury was $6.2 billion in FY 2003. For 2003, THDA reports allocating a total of $10,653,939 in low-income housing tax credits to create or rehabilitate 1,857 rental units for low-income Tennesseans. Housing Opportunities Using State Encouragement (HOUSE) Program In 1989, the General Assembly created the HOUSE program (TCA § 13-23-402), a state-funded grant program for acquisition, construction, and rehabilitation of homes for low-income Tennesseans. Between 1989 and 1999, THDA awarded over $98 million in grants to cities, counties, and nonprofits, which assisted over 13,000 eligible households for a variety of projects. During the decade the program was funded, homeowner rehabilitation was the most common use of HOUSE funds ($48,452,942) followed by single-family new construction ($20,620,437).
17
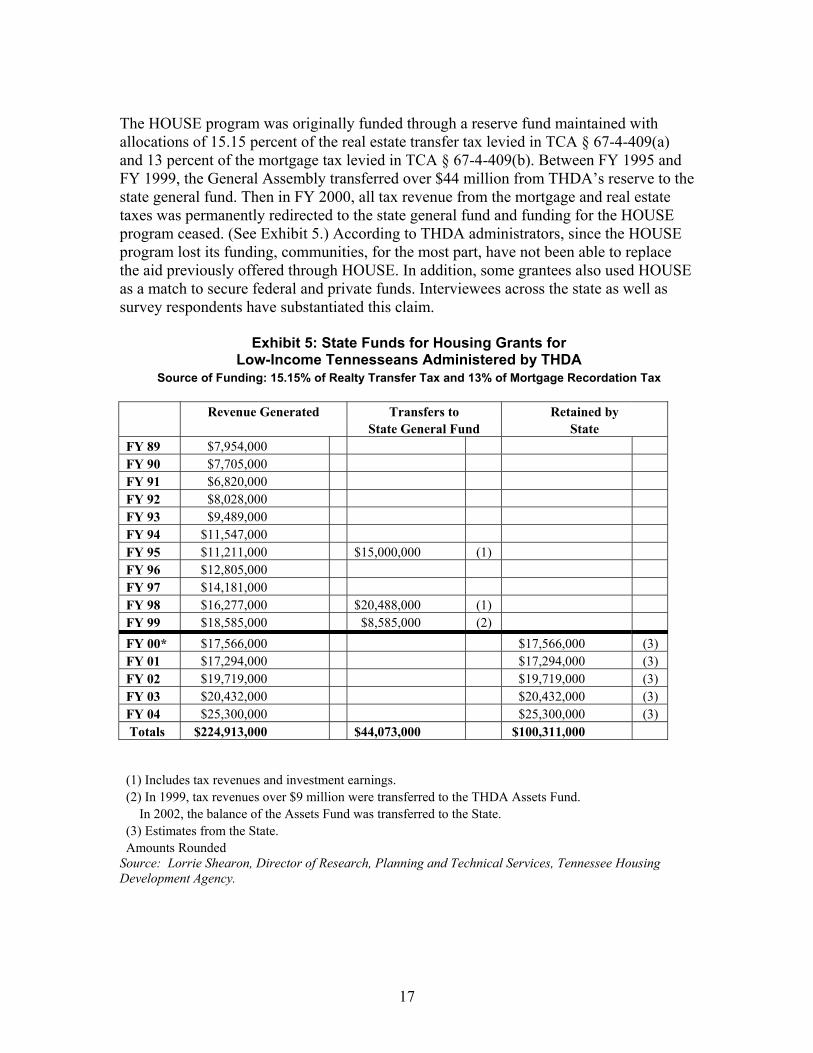
The HOUSE program was originally funded through a reserve fund maintained with allocations of 15.15 percent of the real estate transfer tax levied in TCA § 67-4-409(a) and 13 percent of the mortgage tax levied in TCA § 67-4-409(b). Between FY 1995 and FY 1999, the General Assembly transferred over $44 million from THDA’s reserve to the state general fund. Then in FY 2000, all tax revenue from the mortgage and real estate taxes was permanently redirected to the state general fund and funding for the HOUSE program ceased. (See Exhibit 5.) According to THDA administrators, since the HOUSE program lost its funding, communities, for the most part, have not been able to replace the aid previously offered through HOUSE. In addition, some grantees also used HOUSE as a match to secure federal and private funds. Interviewees across the state as well as survey respondents have substantiated this claim.
Exhibit 5: State Funds for Housing Grants for Low-Income Tennesseans Administered by THDA
Source of Funding: 15.15% of Realty Transfer Tax and 13% of Mortgage Recordation Tax Revenue Generated Transfers to Retained by State General Fund State FY 89 $7,954,000 FY 90 $7,705,000 FY 91 $6,820,000 FY 92 $8,028,000 FY 93 $9,489,000 FY 94 $11,547,000 FY 95 $11,211,000 $15,000,000 (1) FY 96 $12,805,000 FY 97 $14,181,000 FY 98 $16,277,000 $20,488,000 (1) FY 99 $18,585,000 $8,585,000 (2) FY 00* $17,566,000 $17,566,000 (3) FY 01 $17,294,000 $17,294,000 (3) FY 02 $19,719,000 $19,719,000 (3) FY 03 $20,432,000 $20,432,000 (3) FY 04 $25,300,000 $25,300,000 (3) Totals $224,913,000 $44,073,000 $100,311,000
(1) Includes tax revenues and investment earnings. (2) In 1999, tax revenues over $9 million were transferred to the THDA Assets Fund. In 2002, the balance of the Assets Fund was transferred to the State. (3) Estimates from the State. Amounts Rounded
Source: Lorrie Shearon, Director of Research, Planning and Technical Services, Tennessee Housing Development Agency.

18
Grant Programs THDA administers the federally funded HOME program in Tennessee cities and counties that do not receive HOME funds directly from HUD. Each year THDA invites local governments and nonprofits to submit applications to create or rehabilitate affordable housing units in their area. In 2004, HUD allocated $18.2 million in HOME funds to THDA to create and preserve affordable housing units. Also in 2004, THDA implemented the new American Dream Downpayment Initiative (ADDI), funded at $1.6 million, to provide $10,000 in down payment and closing cost assistance to 160 borrowers across the state. THDA continues to administer a variety of grant programs funded by agency earnings and recaptured HOUSE grant funds. For example, United Cerebral Palsy received money to increase accessibility in affordable housing for the disabled by building ramps for homes. In addition, Individual Development accounts help very low-income families achieve homeownership and a partnership with USDA Rural Development helps low-income homeowners with small repairs. Home Buyer Education THDA provides homebuyer education materials free to counselors providing homebuyer education to low-income families. THDA, in partnership with Amsouth and Neighborhood Reinvestment Corporation, have implemented the Homebuyer Education Initiative (HBEI) to provide free training to counselors across the state. HBEI also provides a certification process, which imposes quality standards for materials used and the method of delivery. THDA is funding certified counseling agencies to work with borrowers. Property Tax Relief Program Tennessee provides property tax relief to certain homeowners through the Property Tax Relief Program in the Comptroller’s Division of Property Assessments.12 Qualifying homeowners include low-income disabled and elderly homeowners and disabled veterans and their surviving spouses. Eligibility and relief benefits differ for qualifying homeowners. Annual income for elderly and disabled applicants cannot exceed $12,710; these applicants may qualify for property tax relief on only the first $18,000 of their property’s market value. For disabled veterans and their surviving spouses, the program sets no income limit and provides property tax relief on the first $140,000 of the property’s market value.
12 Tennessee Code Annotated § 67-5-701, et seq.

19
Analysis and Conclusions Tennessee discontinued state funding for affordable housing. Tennessee once provided funding for affordable housing through the Housing Opportunities Using State Encouragement (HOUSE) program. Between July 1, 1989 and June 30, 1999, the dedicated funding streams for the HOUSE program generated about $125 million. State law set aside 15.15 percent of the realty transfer tax and 13 percent of the mortgage recordation tax for the program until 2000. As of 2000, however, state law no longer requires a portion of those revenues be set aside for affordable housing; these two funding streams now accrue to the state’s general fund. From July 1, 2000 through June 30, 2004, the portions of the two real estate taxes that previously funded HOUSE raised an estimated $100.3 million. If portions of the realty transfer and mortgage recordation taxes had remained dedicated to funding the HOUSE program, Tennessee would have raised roughly $25.3 million for affordable housing in FY 2004. Between FY 2003 and FY 2004, funding generated by the two real estate taxes increased by 24 percent, the highest single-year percentage growth rate since the HOUSE program began in 1989. The growth resulted partly from record low interest rates that spurred a strong housing market. As a result, agencies report that loss of HOUSE funds adversely affected their ability to provide rehabilitation assistance for rental and owner-occupied properties. Tennessee organizations previously used flexible HOUSE funds for various housing-related programs. Of the Office of Research survey respondents that reported using HOUSE funds in the past, 85 percent used the funds for homeowner rehabilitation, 48 percent for rental housing, 26 percent for single-family development, and 11 percent to provide ramps for the disabled.13 Other reported uses were disaster relief grants, down payment/closing cost programs, special needs housing for the developmentally disabled, and second mortgage programs. Many providers indicated that they had to severely reduce or eliminate services altogether with the dissolution of the HOUSE funds. Some agencies reported reallocating money from other areas of their budgets to attempt to salvage the programs while other agencies collaborated with community partners to try to replace HOUSE funding. The federal government provides most funding for affordable housing in Tennessee, supplemented by local governments and public and private nonprofit and for-profit entities. In 2004-05, THDA’s budget totaled $266 million, excluding bonds. Exhibit 6 provides an analysis of the 2004-05 THDA budget by funding and source. As shown in Exhibit 6, 94.3 percent of THDA’s funding for 2004-05 comes from the federal government. Federal rental assistance funding comprises 88.5 percent of the 2004-05 budget.
13 Survey respondents often used HOUSE for multiple programs and could select more than one response on the survey question regarding HOUSE funds use. As a result, the sum of percentages is more than 100.
20
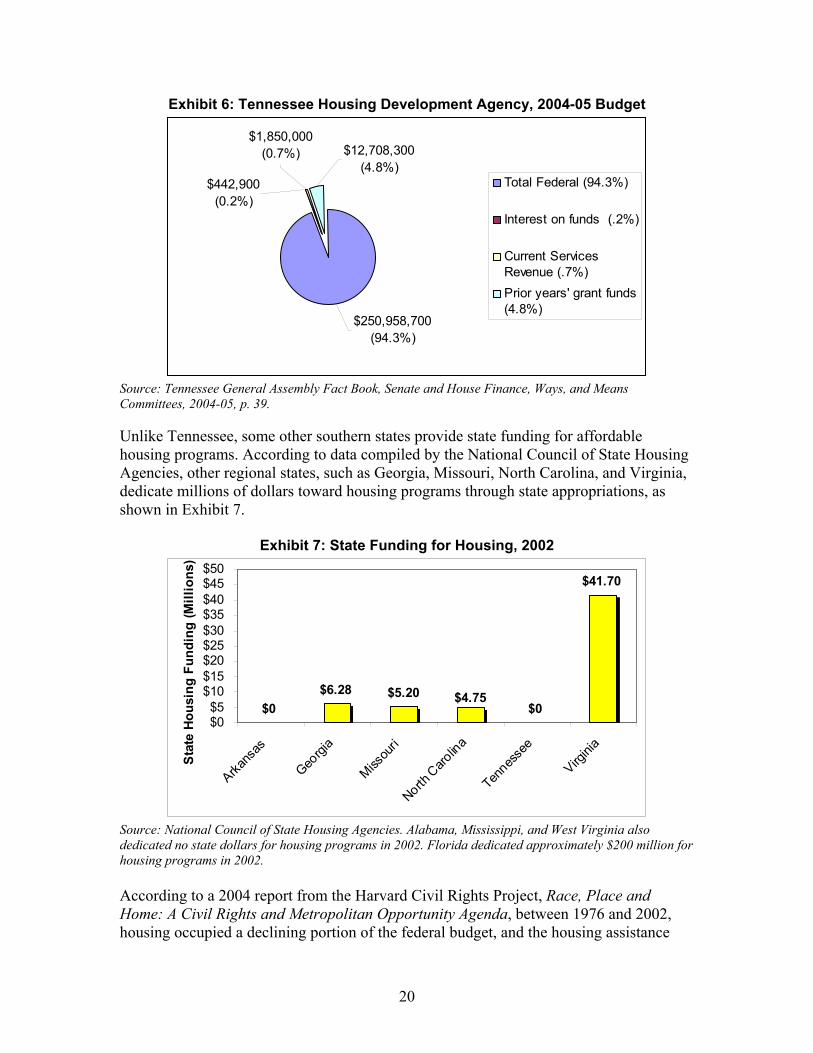
Exhibit 6: Tennessee Housing Development Agency, 2004-05 Budget
$442,900(0.2%)
$1,850,000 (0.7%) $12,708,300
(4.8%)
$250,958,700 (94.3%)
Total Federal (94.3%)
Interest on funds (.2%)
Current ServicesRevenue (.7%)Prior years' grant funds(4.8%)
Source: Tennessee General Assembly Fact Book, Senate and House Finance, Ways, and Means Committees, 2004-05, p. 39. Unlike Tennessee, some other southern states provide state funding for affordable housing programs. According to data compiled by the National Council of State Housing Agencies, other regional states, such as Georgia, Missouri, North Carolina, and Virginia, dedicate millions of dollars toward housing programs through state appropriations, as shown in Exhibit 7.
Exhibit 7: State Funding for Housing, 2002
$0$6.28 $5.20
$0
$41.70
$4.75
$0$5
$10$15$20$25$30$35$40$45$50
Arkans
as
Georgi
a
Missou
ri
North C
arolin
a
Tennes
see
Virgini
a
Sta
te H
ousi
ng F
undi
ng (M
illio
ns)
Source: National Council of State Housing Agencies. Alabama, Mississippi, and West Virginia also dedicated no state dollars for housing programs in 2002. Florida dedicated approximately $200 million for housing programs in 2002. According to a 2004 report from the Harvard Civil Rights Project, Race, Place and Home: A Civil Rights and Metropolitan Opportunity Agenda, between 1976 and 2002, housing occupied a declining portion of the federal budget, and the housing assistance

21
budget authority dropped by 50 percent.14 In addition, housing assistance has changed in the past 30 years in the following ways:
• A greatly diminished federal role in low-income housing production; • A shift in emphasis from direct expenditures to boost housing supply to a
demand-side strategy that emphasizes the provision of vouchers to low-income renters for use in the private housing market; and
• An increasing role for state and local governments in administering housing assistance both in the form of federal block grants and tax credits. 15
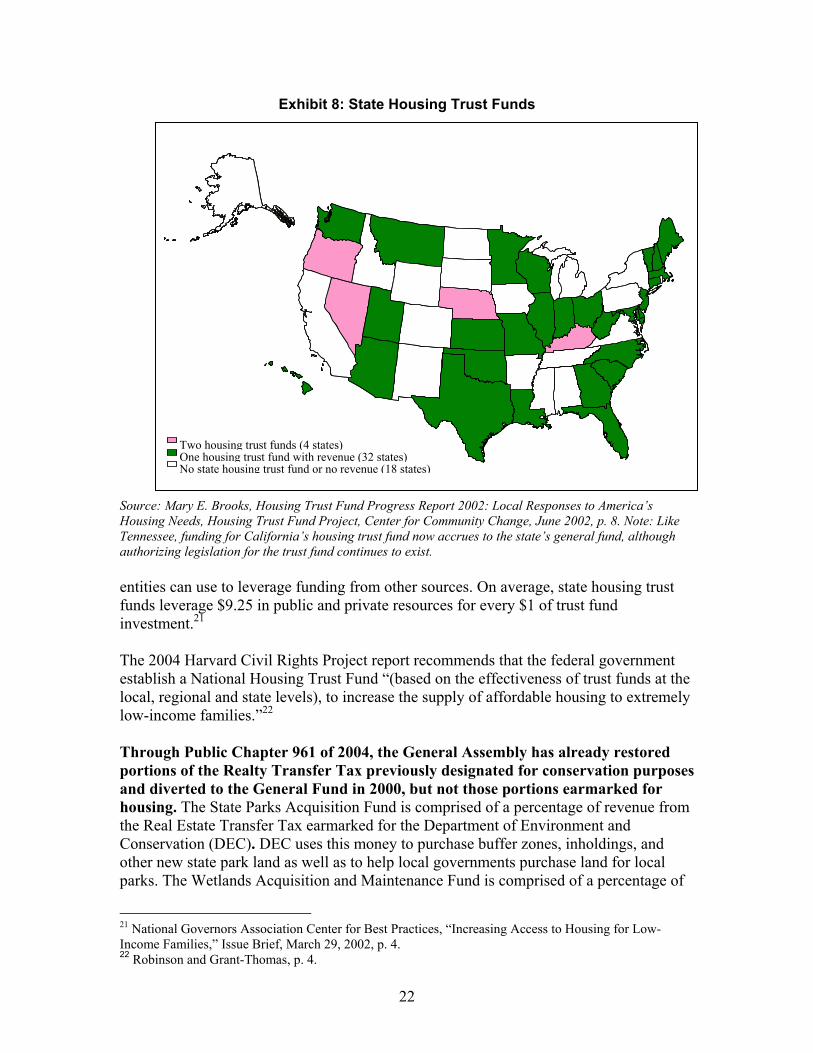
Unlike a majority of states, Tennessee does not allocate monies to a state housing trust fund. The Housing Trust Fund Project defines housing trust funds as “distinct accounts that receive dedicated sources of public funds to support affordable housing.”16 Although Tennessee created a housing program fund and granted THDA authorization to award grants to local housing programs, the taxes that formed the revenue stream for the program currently accrue to the state’s general fund.17 (See page 17.) In 2001, there were more than 275 housing trust funds in cities, counties, and states throughout the nation, providing at least $750 million annually for affordable housing programs, including the Affordable Housing Trust Fund in Knoxville and the Nashville Housing Fund. A 2001 survey showed 35 state housing trust funds with revenue in 31 states, with Kentucky, Nebraska, Nevada, and Oregon operating multiple state housing trust funds.18 In 2003, Louisiana created a housing trust fund, raising the number of states to 32. Real estate transfer taxes commonly provide revenue for state housing trust funds, although states draw funding from many sources, such as:
• Interest from state-held funds (i.e., unclaimed property funds and budget stabilization funds);
• Interest from real estate and/or mortgage escrow accounts; • Unclaimed lottery earnings; and • Document recording fees.19
States with housing trust funds support a wide variety of affordable housing services and programming. Some states, such as Arizona, Texas, and Kentucky, designate funding for use in rural areas.20 Housing trust funds also provide funds that public and private
14 Robinson and Grant-Thomas, p. 51. 15 Charles J. Orlebeke, “The Evolution of Low-income Housing Policy, 1949-1999,” Housing Policy Debate 11, no. 2, cited in Lisa Robinson and Andrew Grant-Thomas, p. 9. 16 Mary E. Brooks, Housing Trust Fund Progress Report 2002: Local Responses to America’s Housing Needs, Housing Trust Fund Project, Center for Community Change, June 2002, p. 1. 17 See TCA § 13-23-401, 13-23-402 and 13-23-403. Note: THDA’s housing program fund and assets fund still exist in state law. 18Ibid., p.8. 19Ibid., p. 2. 20 Pamela Friedman, “Current Issues in Rural Housing and Homelessness,” Rural Assistance Center, Vol. 1, No.1, September 2003, p. 2.
22
Exhibit 8: State Housing Trust Funds Source: Mary E. Brooks, Housing Trust Fund Progress Report 2002: Local Responses to America’s Housing Needs, Housing Trust Fund Project, Center for Community Change, June 2002, p. 8. Note: Like Tennessee, funding for California’s housing trust fund now accrues to the state’s general fund, although authorizing legislation for the trust fund continues to exist. entities can use to leverage funding from other sources. On average, state housing trust funds leverage $9.25 in public and private resources for every $1 of trust fund investment.21 The 2004 Harvard Civil Rights Project report recommends that the federal government establish a National Housing Trust Fund “(based on the effectiveness of trust funds at the local, regional and state levels), to increase the supply of affordable housing to extremely low-income families.”22 Through Public Chapter 961 of 2004, the General Assembly has already restored portions of the Realty Transfer Tax previously designated for conservation purposes and diverted to the General Fund in 2000, but not those portions earmarked for housing. The State Parks Acquisition Fund is comprised of a percentage of revenue from the Real Estate Transfer Tax earmarked for the Department of Environment and Conservation (DEC). DEC uses this money to purchase buffer zones, inholdings, and other new state park land as well as to help local governments purchase land for local parks. The Wetlands Acquisition and Maintenance Fund is comprised of a percentage of
21 National Governors Association Center for Best Practices, “Increasing Access to Housing for Low-Income Families,” Issue Brief, March 29, 2002, p. 4. 22 Robinson and Grant-Thomas, p. 4.
No state housing trust fund or no revenue (18 states)
Two housing trust funds (4 states)One housing trust fund with revenue (32 states)

23
revenue from the Real Estate Transfer Tax earmarked for the Tennessee Wildlife Resources Agency (TWRA) to purchase and maintain wetlands for recreational and conservation purposes. Low-income families as well as local communities could also benefit greatly from restoration of this tax revenue, as well as revenue from the Mortgage Recordation Tax, to their annual budget. The HOUSE program, which THDA administered, was comprised of funds from these taxes. Consequently, THDA had to terminate the program when these funds were diverted to the General Fund. In many Tennessee communities, working class families cannot afford market rental rates and the need for rental assistance has outgrown program capacity. Although households with incomes below 80 percent of the area median income are eligible for federally subsidized housing through public housing developments and Section 8 housing choice vouchers, current program capacity is not adequate to serve all families in need. Thirty-six percent of respondents to the Comptroller’s 2004 housing survey ranked the lack of affordable housing as the number one housing related need in their community; 33 percent ranked funding as their number one need. More than half of the survey respondents indicated that low-income persons have the greatest unmet need for affordable housing, and that this problem is growing. Fifty-one percent of respondents indicated a significant increase in the need for affordable housing programs and services offered while 34 percent indicated a marginal increase in need. The Out of Reach housing affordability study by the National Low Income Housing Coalition concluded that a Tennessee household would need income equal to 202 percent of minimum wage, or $28,072 annually, to afford a two-bedroom apartment.23 According to the 2000 census, 179,843 Tennessee renter households not living in public housing had incomes of less than 60 percent of the area median annual income, or $21,816, in 1999 (state average median was $36,360). Of these households, 54 percent, or 97,155, did not live in affordable housing, meaning they spent more than 35 percent of their income ($7,636 annually or $636 monthly) on housing expenses. Census data analysis shows an average of only 161 affordable units (costing less than $530 a month) in the state per 100 households with very low-incomes (less than 50 percent of area median or $18,180 a year). While this may seem like an adequate supply of units, further analysis shows that 53 percent of the households occupying these units had higher incomes. As a result, families with the lowest incomes often cannot find affordable housing, especially in the larger urban areas24 According to THDA administrators, every Section 8-administering agency in the state has a waiting list for Section 8 rental assistance, with families waiting up to two years for a voucher or a spot in public housing. In many cases, administrators must close waiting lists, no longer accepting applications for months or years until the number of families
23 National Low Income Housing Coalition, Out of Reach 2003, http://www.nlihc.org/oor2003/table9.htm, accessed March 8, 2004. 24 THDA, Low-Income Tax Credit Program Needs Score Sheet 2004-05, Correspondence with THDA.

24
waiting decreases. THDA administers only about 20 percent of the total number of rental assistance vouchers in use in Tennessee, but with waiting list numbers equal to 81 percent of total available vouchers. THDA’s figures are representative of the situation faced by all Tennessee organizations involved with the Section 8 program. Exhibits 9 and 10 show the number of vouchers in use as well as eligible families on waiting lists by county through THDA. Families who pay more than 35 percent of their income in housing costs are more vulnerable to eviction, frequent relocation, and sporadic or chronic homelessness. In addition, low-income families often live in substandard housing. The 2000 Census showed that 27,664 Tennessee families lived in houses lacking complete kitchen or bathroom facilities. Some families must rely on friends or family for shelter. An overcrowded home has more than one person per room living in the unit; 61,191 homes in Tennessee met this criterion in 2001.25
Exhibit 9: THDA Section 8 Voucher Program As of August 31, 2004
Source: THDA Website, http://10.171.13.4/s8ra/unitsxcty/unitsxcty.aspx.
25 Tennessee Housing Development Agency, Population and Housing Market Profile: Davidson County, http://www.state.tn.us/thda/Research/Census/davidson.pdf ., accessed Feb. 20, 2003.
Hamilton
Sequatchie
Polk
Rhea
M
Hancock
Greene Carter
Vouchers In Use
0 - 125 126 - 250 251 - 375 376 - 500
501 + Non-THDA local Section 8 administrators

25
Exhibit 10: THDA Section 8 Voucher Program As of August 31, 2004
Source: THDA Website, http://10.171.13.4/s8ra/waiting/waiting.aspx. Proposed federal changes to the Section 8 program could provide Tennessee with more flexible funding and programming, but may reduce federal funding. The Bush administration has proposed converting all Section 8 program funding into flexible block grants to the states, a policy shift similar to the 1996 Welfare Reform Act. This change to the Section 8 voucher program is controversial, with HUD supporting the changes and housing advocacy organizations and management associations, (such as the National Low Income Housing Coalition and the National Affordable Housing Management Association), opposing the changes. Other organizations, such as the National Housing Council and the National Council of State Housing Agencies, maintain a neutral position on the issue.26 Supporters argue the proposed changes would improve the program by providing:
• Flexible funding – the flexible nature of the block grant would afford states some latitude in designing housing programs that best meet their needs. In addition, the flexibility would reduce the amount of voucher funding returned to the federal government by state and local governments.
• Flexible programming – States could increase the homeownership portion of the housing choice program, as well as coordinate with other federal/state programs, such as TANF and the Workforce Investment Act.
• Less regulation – States would now calculate the Fair Market Rent, as opposed to HUD, resulting in more accurate housing market appraisals.
26 Cathy Atkins, “Section 8 or Housing Assistance for Needy Families: What’s in a Name?” National Conference of State Legislatures, August 2003.
Dickson
Marion Hamilton
GrundySequatchie
Bledsoe
PolkBradley
McMinn
Rhea
Hancock Hawkins Sullivan
Greene Washington
Johnson
Carter
Families Waiting
0 - 75 76 - 150 151 - 225
301 - 375 Non-THDA local Section 8 administrators
226 - 300
26
Housing quality inspections would be less frequent and could use state and local housing quality standards rather than national standards.
Opponents argue the changes could lead to:
• Less funding – Under the present program, Congress adjusts housing voucher allocation allotments for inflation and market rent increases. Under the proposal, while states would gain control over established voucher amounts, there seems to be no guarantee the block grant would account for changes in rental rates or inflation. States would then have to supplement federal block grant funds with state dollars, decrease housing assistance, or reduce the number of housing vouchers.
• Controversial rules and regulations on the state level – States may restrict the use of vouchers to particular buildings or particular areas. States might also set time limits on housing assistance, similar to welfare reform.
• Uncertainty among related housing organizations – Some lenders and landlords might get “cold feet” over the uncertainty of sufficient, stable funding and no longer participate in Section 8 programs.
• Political vouchers – States might allocate vouchers to areas based on political influence.27
Lack of stable housing and poor housing conditions adversely affect children and their performance in school. Research has shown a direct correlation between student mobility and school performance. According to the Kids Mobility Project Report, reading scores for students who moved three times or more were half those who had not moved at all. Additionally, students who missed 20 percent of days scored 20 points lower on standardized tests than those who attended consistently. Other key findings of the project include:
• When housing consumes too much of the family income, parents are forced to skimp on food. Children suffer from poor nutrition, which leads to chronic health problems and decreased school performance.
• Parents struggling to provide adequate housing may be unable to give their children the kind of support they need to learn well, and do not maintain connections with school, read to their children, provide consistent homework support, or provide a positive home learning environment.
• Homeownership encourages stronger families, more success in K-12 school performance and greater success later in life. Compared to the children of renters (of the same age, income, race, etc.) the children of homeowners are 25 percent more likely to graduate from high school and 116 percent more likely to graduate from college. 28
Author Richard Rothstein further contends that high student mobility impedes academic achievement. In his book, Class and Schools: Using Social, Economic, and Educational
27 Ibid. 28 Greater Minnesota Housing Fund, “The Importance of Stable Housing for Children and Families” http://www.gmhf.com/, accessed September 7, 2004.

27
Reform to Close the Black-White Achievement Gap, Rothstein cites a 1994 GAO study that found “30% of the poorest children (those from families with annual incomes of less than $10,000) had attended at least three different schools by third grade, while only 10% of middle-class children (from families with annual incomes of over $25,000) did so. Black children were more than twice as likely as white children to change schools this much.” Further, “…statistical analysis concluded that if black students’ average mobility were reduced to the level of white students’ average mobility, this improvement in housing stability alone would eliminate 14% of the black-white test score gap.”29 The National Low Income Housing Coalition’s 2004 Advocates’ Guide to Housing and Community Development Policy also outlined several negative factors resulting from high student mobility:
• Mobile students may receive poor assessments and placements and are likely to have incomplete school records.
• Teachers are less likely to commit themselves to students they perceive are just passing through and are less likely to regard transient students as competent.
• Transient children are more likely to repeat grades, not receive needed special education, and not perform as well on standardized tests as stable students.
The guide also suggests that the instability of transient students disrupts stable students’ ability to learn. Teachers often lose valuable classroom time repeating previously taught information to bring the transient student to the level of the other students. Teachers also have less time to spend with individual students.30 Stability is not the only shelter-related factor influencing children’s educational performance. Hazardous conditions in a home can also affect a child’s development. The Residential Lead-Based Paint Hazard Reduction Act of the Housing and Community Development Act of 1992 authorized the Lead Hazard Control Grants Program to provide grants to state and local governments to control lead-based paint hazards in low-income owner-occupied and rental housing. The intent of this program was to redirect the national approach from reaction to prevention of poisoned children.31
Once ingested, lead inhibits a child’s ability to absorb iron, one of the basic building blocks of brain, nerve and bone development. It also stunts a broad range of chemical transmitters that affect hearing, sight and perception.
29 Richard Rothstein, Class and Schools: Using Social, Economic, and Educational Reform to Close the Black-White Achievement Gap, Washington, D.C., Economic Policy Institute, Teachers College, Columbia University, 2004, p. 46. 30 National Low Income Housing Coalition, 2004 Advocates’ Guide to Housing and Community Development Policy, Housing and Education http://www.nlihc.org/advocates/housingedu.htm, accessed September 7, 2004. 31 National Low Income Housing Coalition, 2004 Advocates Guide to Housing and Community Development Policy, Lead Hazard Control and Healthy Homes, http://www.nlihc.org/advocates/leadcontrol.htm , accessed September 14, 2004.

28
The resulting brain and nerve damage can trigger a cascade of secondary effects that include learning disabilities, hyperactivity, [and] increased aggression. …children who have lead-poisoned brains have a vastly diminished capacity to learn. A diminished capacity not from lack of effort, or lack of instruction, but simply because the tissues in the brain lack the physiological ability to perform the chemically based process necessary for learning. 32
Further, studies have shown that minority children from segregated, impoverished neighborhoods consistently perform well below their white counterparts in school. Schools in high-poverty areas are more likely to be under-funded and overcrowded with weak curricula, insufficiently trained teachers and high teacher turnover. Other problems include high dropout rates and the manifestation of more health problems in these minority youth. Affordable housing initiatives and social policy reform in poverty-stricken, racially segregated areas would likely help facilitate efforts to improve equity in education.33 Homeownership has increased over the past two decades; however, Tennessee continues to face challenges in boosting minority homeownership and reducing the number of foreclosures statewide. The national homeownership rate reached a record level in 2003, with a homeownership rate of 68.3 percent. The increase in the U.S. homeownership rate during the 1990s was higher than any other decade since the 1950s.34 The South’s homeownership rate totaled 70.1 percent in 2003.35 Slightly above the rate for the South as a whole, Tennessee’s homeownership rate in 2003 was 70.8 percent.36 The homeownership rate has increased in Tennessee over the past 20 years, as shown in Exhibit 11. The Homeownership Gap by Race Despite an increase in the homeownership rate over the last twenty years, a homeownership gap persists between white and minority households, as shown in Exhibit 12. While homeownership rates improved for all racial groups between 1994 and 2002, black and Hispanic homeownership rates remained well below the national average; white homeownership rates exceeded the national average. Minority homeownership increased substantially during the 1990s, although the overall homeownership gap between whites
32 Arizona School Boards Association, Inc., “Lead Poisoning: Why Some Children Can’t Learn,” http://www.azsba.org/lead2cannot.htm , accessed September 17, 2004. 33 Robinson and Grant-Thomas, p. 31-32. 34 Patrick A. Simmons, “Changes in Minority Homeownership During the 1990s,” Fannie Mae Foundation Census Note 07, Fannie Mae Foundation, September 2001. 35 Insurance Information Institute, Snapshot of Housing in America, 2002-2003, Homeownership Rates by Region, 1990-2003, Source of Information: U.S. Census Bureau. 36 U.S Census Bureau, Housing Vacancies and Homeownership Annual Statistics: 2003, Table 13: Homeownership Rates by State, 1984-2003.

29
Exhibit 11: Homeownership Rate in Tennessee, 1984-2003
71.967.6 67.467.3
70.867
40
45
50
5560
65
70
75
80
1984
1986
1988
1990
1992
1994
1996
1998
2000
2002
Year
Hom
eow
ners
hip
Rat
e (P
erce
ntag
e)
Source: U.S Census Bureau, “Housing Vacancies and Homeownership Annual Statistics,” 2003.
Exhibit 12: U.S. Homeownership Rate by Race and Ethnicity: 1994, 1998, 2002
66.3 67.964 70 71.867.7
47.345.642.348.2
44.741.2
54.752.651.3
0
20
40
60
80
100
1994 1998 2002
Year
Hom
eow
ners
hip
Perc
enta
ge R
ate
United States White Black Hispanic Asian/Other
Source: U.S Census Bureau, Housing Vacancies and Homeownership Annual Statistics: 2003, Table 20: Homeownership Rates by Race and Ethnicity of Householder, 1984-2003. and minorities still widened slightly.37 Between 1990 and 2000, the homeownership gap between white and African-American Tennesseans decreased slightly, sliding from 24.5 to 23.5 percent.38 Homeownership is important because it serves as a proxy for socioeconomic achievement and the degree of mobility among minority groups. Minority homeowners demonstrate
37 Simmons, Fannie Mae Foundation. 38 Bryan Ricketts, “Racial Homeownership Gaps in Tennessee and Its Metropolitan Areas: A Comparison of 1990 and 2000 Homeownership Rates,” Housing Matters, Tennessee Housing Development Agency, Vol. 2, No. 23, Summer 2003, p.4.

30
socioeconomic achievement through making a down payment, paying closing costs, and earning sufficient income to repay their mortgage. Homeownership is also an indicator of socioeconomic mobility. Homeowners build wealth as they build home equity, equity they can use to fund a child’s education, start a business, go back to school themselves, or transfer the deed to their family at a future date.39 THDA research attributes most of the persistent homeownership gap in Tennessee to certain attributes more common among African-American families, such as:
• Lower incomes; • More families with one wage earner; • Higher urban concentrations; and • Relatively younger households.40
THDA research also found owner cost burden, meaning housing costs exceed 30 percent of household income, was much higher among minority homeowners with mortgages.41 Exhibit 13 illustrates the homeownership gap in Tennessee’s metropolitan areas.
Exhibit 13: Homeownership Gap in Tennessee, 2000
74.2% 75.0% 72.8% 66.5% 71.0% 76.2% 74.4%53.9%49.7%44.4%43.8%43.3%45.6%45.3%
0%20%40%60%80%
100%
Chatta
noog
a
Tri-Citie
s
Knoxv
ille
Clarks
ville
Nashv
ille
Jack
son
Memph
is
Metropolitan Statistical Area
Hom
eow
ners
hip
Rat
e
African-American White
Source: Bryan Ricketts, “Racial Homeownership Gaps in Tennessee and Its Metropolitan Areas: A Comparison of 1990 and 2000 Homeownership Rates,” Housing Matters, Tennessee Housing Development Agency, Vol. 2, No. 23, Summer 2003.
39 Simmons, Fannie Mae Foundation. 40 Dean Namboothiri, “Racial Differences in Housing Tenure and Housing Cost Burden in Tennessee,” Housing Matters, Tennessee Housing Development Agency, Vol. 2, No. 1, Winter 02-03, p. 4. 41 Ibid.

31
The Homeownership Gap by Income According to Harvard University’s Joint Center for Housing Studies, 52 percent of low-income households owned their own homes in 2001, compared with 82 percent of upper-income households.42 Low-income homeownership is a new phenomenon in American history, prompting some researchers to note “the most startling fact about homeownership today lies in the title . . . ‘Low-income homeownership’.”43 The opportunities for low-income households to own their own homes have increased greatly over the past 40 years, particularly in the 1990s. Low-Income Homeownership: Examining the Unexamined Goal, a joint publication of the Brookings Institution and the Joint Center for Housing Studies comments on the rise in low-income homeownership:
Today a buyer can put as little as nothing down, get a variable-rate mortgage, and amortize a loan for as long as thirty years. The secondary mortgage market, buttressed by statistical techniques that assign a “credit score” that correlates well with loan repayment behavior, has let lenders (which now include mortgage companies as well as traditional banks) reach out to people whom the lenders of the 1960s would have shunned. Low-income households are no longer shut out; now families with incomes of $30,000 or less can buy a house. From 1993 to 2000 the number of home-purchase loans to low-income families surged by 79 percent.44
Low-income homeowners do face special challenges, however. Unlike middle-and high-income homeowners, they often lack the financial reserves to maintain timely mortgage payments following the loss of a job, a serious medical condition or sickness, or other emergency. The National Consumer Law Center indicates limited savings and low equity leave low-income homeowners vulnerable to mortgage delinquencies and default/foreclosure.45 Foreclosures Although the homeownership rate has increased on both the national and state level, the foreclosure rate is also higher than 20 years ago.46 Homeowners face serious economic difficulties before (the loss of a job), during (penalties and fees), and after (the loss of an equity-building asset and a weakened, damaged credit history) the foreclosure process. Concentrations of high foreclosure rates also negatively impact communities, neighborhoods, and regions, resulting in high vacancy rates, declining housing values, and overall economic instability. Not surprisingly, the foreclosure rate differs by loan category, with the foreclosure rate for prime loans well under the rate for subprime loans. According to the Mortgage 42 Nicolas P. Retsinas and Eric S. Belsky, editors, Low-Income Homeownership: Examining the Unexamined Goal, Washington, D.C.: Brookings Institution Press and Harvard University Joint Center for Housing Studies, 2002, p. II. 43 Ibid., p. 3. 44 Ibid., p. 4. 45 National Consumer Law Center, “Sustainable Homeownership: The Importance of Homeownership,” http://www.nclc.org/initiatives/sustainable_home/, accessed December 17, 2004. 46 Buffalo Branch, Federal Reserve Bank of New York, The Regional Economy of Upstate New York, “Examining the Rising Foreclosure Rate,” Spring 2003, p. 1.

32
Bankers Association’s National Delinquency Survey, 1.27 percent of all loans were in foreclosure at the end of the first quarter of 2004. A comparison between prime and subprime loans in foreclosure shows a much lower number of prime loan foreclosures (.53 percent) compared with subprime loan foreclosures (5.05 percent).47 At 1.55 percent of loans in foreclosure in the first quarter of 2004, Tennessee’s foreclosure rate was higher than the nation as a whole and slightly above the average for surrounding states. Exhibit 14 provides a comparison of the percentage of loans in foreclosure at the end of the first quarter of 2004. Exhibit 14 also shows the foreclosure rate for subprime loans is much higher than the rate for all loans. Kentucky and Mississippi had the highest percentage of subprime loans in foreclosure, followed by North Carolina, Georgia, and Tennessee. Citing the large number of foreclosures in the state, THDA officials indicate a need for improved homebuyer education in the state.48 Depending on specific economic conditions, individual counties may post high foreclosure rates. A February 2004 CNN/Money article showed Grainger County posted 1,744 foreclosed listings in 2003, one of the highest foreclosure rates in the country. A local real estate agent interviewed for the article credited this large number of foreclosures to the closure of a furniture plant in a border county, linking the increase in foreclosures with the increase in unemployment.49
Exhibit 14: Inventory of Loans in Foreclosure, First Quarter, 2004
1.55 2.180.52
1.73 1.23 1.432.45
1.26 1.1
7.159.02
5.7 5.635.898.4
02468
10
Tennes
see
Kentuc
ky
Virgini
a
North C
arolin
a
Alabam
a
Georgi
a
Mississ
ippi
Arkans
as
Missou
ri
State
Inve
ntor
y of
loan
s in
fo
recl
osur
e
All Loans Prime Loans Subprime Loans
Source: Mortgage Bankers Association, “The National Delinquency Survey” for First Quarter, 2004, Data as of March 31, 2004.
47 Mortgage Bankers Association, “The National Delinquency Survey” for First Quarter, 2004, Data as of March 31, 2004. Note: the foreclosure inventory for FHA and VA loans totaled 2.78 percent and 1.53 percent, respectively. 48 Interview with Janice Myrick, Executive Director, THDA, June 16, 2004. 49 Sarah Max, “The Next Big Trend: Foreclosure,” CNN/Money, February 5, 2004.

33
A 2004 report on affordable housing in Pennsylvania addresses that state’s rising foreclosure rate, identifying the following contributory factors:
Weak economic trends – workers who lose their jobs have difficulty continuing to make timely mortgage payments.
Aging housing stock – older homes often require higher maintenance expenses.
Increased and inappropriate access to credit – increase in subprime lending.
Abusive lending practices, such as predatory lending – higher than appropriate interest rates and fees, deceptive lending practices.
Pennsylvania’s property tax burden – per capita property taxes increased 70 percent between 1989 and 1999.50
While ultimately concluding the causes driving the increase remain unclear and unexplained, a Federal Reserve Board of New York report suggests a link between high foreclosure rates and:
Residential mortgages with high Loan to Value, or LTV, ratios - particularly second mortgages and/or home equity loans resulting in LTV ratios over 100 percent. Mortgages with high LTV ratios have increased over the last 20 years.
Borrowers with economic difficulties/financial crises – borrowers who
lose jobs, lose spouses, divorce, and/or struggle with unplanned medical or emergency expenses. In addition, some research indicates the 1990s rise in low-income homebuyers may put upward pressure on foreclosure rates because this demographic group may be more likely to default on a mortgage. Other research does not confirm the relationship between low-income homebuyers and higher foreclosure rates.
State-level public policy choices – some research indicates the
foreclosure rate is higher in states where the foreclosure process is faster and cheaper for lenders, especially states that permit lenders to avoid court-supervised foreclosures.51
The Federal Reserve Board of New York also cites a study indicating the foreclosure rate is lower in states where the legal costs associated with foreclosure are higher for lenders. Thus, in states where the foreclosure process is more costly, such as states with mandatory judicial foreclosures, lenders are more apt to negotiate a mortgage payment plan with borrowers.52 50 The Reinvestment Fund, “Choices in Pennsylvania: Developing a Rational Framework for Housing Investment in Pennsylvania,” Winter 2004. 51 Buffalo Branch, Federal Reserve Bank of New York, p. 2. 52 Terrence M. Clauretie, “The Impact of Interstate Foreclosure Cost Differences and the Value of Mortgages on Default Rates,” AREUEA Journal, Vol. 15, No. 3, 1987, p. 156.

34
Twenty-one states require judicial foreclosure, a process in which foreclosures must begin with the lender filing a complaint or petition in court, according to the National Consumer Law Center.53 Tennessee does not require judicial foreclosures, instead the mortgage contract or deed of trust defines the foreclosure process, also known as a nonjudicial foreclosure. Tennessee law also does not require lenders to send personal notice of foreclosure to the owner.54 Based on research, Tennessee’s nonjudicial foreclosure method contributes to the state’s foreclosure rate by making the legal costs of foreclosure cheaper for lenders. Research also indicates that the length of the statutory redemption period influences foreclosure rates.55 Although state law grants citizens a two-year right of redemption, Southeast Tennessee Legal Services indicates this right plays no significant role in the foreclosure process because borrowers uniformly waive this right in the deed of trust or mortgage contract.56 Predatory lending practices fleece home equity from Tennessee homeowners and contribute to higher foreclosure rates. Predatory lending refers to abusive or fraudulent subprime lending practices, such as making unaffordable asset-based loans – i.e., basing a loan on equity in a property rather than a borrower’s ability to repay – or convincing a borrower to refinance a loan repeatedly to collect unnecessary fees.57 Predatory loans can substantially reduce homeowners’ net worth, as home equity comprises over half the net worth of certain households, particularly minority and low-income households.58 Although many do not engage in the practice, lenders that make predatory loans extract a sizeable price from homeowners. One research organization estimates Tennessee homeowners lose over $142 million annually because of predatory lending practices.59 According to THDA’s 2002 Housing Summit survey results, all areas of the state believed predatory lending was “somewhat a problem” in their communities.60 Evidence of predatory lending can be found in the personal stories of borrowers and, more recently, in settlements and lawsuits, with at least three lenders collectively paying up to $784 million in 2002 because of predatory lending legal actions.61 A former loan officer at a Citibank subsidiary testified to the deceptive mortgage lending practices used in the lending institution – “If someone appeared uneducated, inarticulate, was a
53 National Consumer Law Center, Repossessions and Foreclosures, 5th ed. 2002, Appendix I, as cited in Southeast Tennessee Legal Services, “Foreclosure Law and Procedures in Tennessee,” p. 1. 54 Southeast Tennessee Legal Services, “Foreclosure Law and Procedures in Tennessee.” 55 “The statutory right of redemption gives the borrower the right to redeem his/her property after the foreclosure sale for the amount paid at the sale,” Clauretie, p.158. 56 TCA § 66-8-101; Southeast Tennessee Legal Services, “Foreclosure Law and Procedures in Tennessee,” p. 4. 57 Roberto G. Quercia, Michael A. Stegman, and Walter R. Davis, “The Impact of North Carolina’s Anti-Predatory LendingLaw: A Descriptive Assessment,” Center for Community Capitalism, University of North Carolina at Chapel Hill, June 25, 2003, p. 3. 58 Ibid. 59 Eric Stein, “Quantifying the Economic Cost of Predatory Lending,” Center for Responsible Lending, July 25, 2001 (revised October 30, 2001), pp. 18-19. 60 Tennessee Housing Development Agency, “Brief Summary of Housing Summit Survey Results, Tennessee by Grand Division,” December 11, 2002. 61 Sue Kirchhoff, “More U.S. home buyers fall prey to predatory lenders,” USA Today, http://www.usatoday.com/money/perfi/housing/2004-12-06-subprime-predatory-lending_x.htm, accessed December 6, 2004.

35
minority, or was particularly old or young, I would try to include all the (additional costs) CitiFinancial offered.”62 Public and private entities throughout the nation have denounced predatory lending or disassociated themselves from the practice, including Fannie Mae, the American Bankers Association, the Mortgage Banking Association of America, the Federal Trade Commission, the Federal Reserve Board, and the Department of Housing and Urban Development. However, because the definition of predatory lending is unclear, policymakers must carefully balance legislative and regulatory remedies with continued access to subprime loans for households with less than perfect credit scores. In remarks made at a National Conference of State Legislatures meeting in 2001, a banking official emphasized the importance of a surgical approach to predatory lending, stating, “In our efforts to protect consumers we must balance our actions in order to avoid the unintended consequence of eliminating consumers’ access to the very credit or services they need to improve their economic situation.”63 One Federal Reserve Board official indicates the key concept in reducing predatory lending is distinguishing between predatory and subprime lending.64 Attesting to the difficulty of finding this balance is the state of Georgia, which had to amend its 2002 predatory lending legislation in 2003, partly in response to concerns the original law’s vague wording on covered loans and liability caused Standard and Poor’s to announce it would no longer rate securitizations containing Georgia home loans.65 Despite disagreement over the precise definition of predatory lending, there is some consensus among governmental agencies and research organizations on the characteristics of a predatory loan. Some common characteristics of a predatory loan include:
• High Fees - points and fees beyond that justified by the cost or risk of lending money to the borrower. An example from Fayetteville, North Carolina, included a $48,000 home loan, with a $4,352 origination fee, $1,089 in points, $175 for an underwriting fee, a $200 “processing” fee, and a $175 “document prep” fee, all of which are rolled into the loan and financed along with the principal.
• Excessive Mortgage Broker Compensation – broker attempts to sell the borrower a loan with the most fees and highest rate possible, including sometimes charging fees of eight to 10 points. The broker may also receive a “yield spread premium,” whereby a lender financially rewards a mortgage broker in exchange for placing the borrower in a higher interest rate category than that justified by the borrower’s credit.
62 Elizabeth Warren and Amelia Warren Tyagi, “The Cement Life Raft,” excerpted from The Two-Income Trap: Why Middle-Class Mothers and Fathers are Going Broke, PBS Frontline website, http://www.pbs.org/wgbh/pages/frontline/shows/credit/more/cement.html, accessed November 29, 2004. 63 Barbara Kent, Director, Consumer Affairs and Financial Products, New York State Banking Department, Predatory Lending Presentation, NCSL Annual Meeting, San Antonio, Texas, August 14, 2001. 64 Remarks by Gov. Edward M. Gramlich at the Texas Association of Bank Counsel -27th Annual Convention, South Padre Island, Texas, October 9, 2003. 65 Jack Milligan, “Learning the Hard Way: The Case of Georgia’s Antipredatory Lending Law,” knowledgeplex, http://www.knowledgeplex.org/news/45224.html?p=1, September 1, 2004, accessed December 16, 2004.
36
• “Packing” – adding unwanted extras to the loan without the borrower’s knowledge. A common practice is the addition of a type of credit insurance designed to repay the lender upon the borrower’s death. Generally, the lender adds the overpriced credit insurance to the loan as a single premium and finances it over the life of the loan.
• Balloon payments – financing method in which the borrower may pay off only the accrued interest each month, resulting in a huge balloon payment at the end of the loan term. Elderly borrowers with balloon payments may encounter difficulty in refinancing a balloon payment loan and may face foreclosure.
• Flipping - repeated refinancing of a loan with fees providing the borrower with no net tangible benefit.66
Subprime Lending Clarifying the difference between subprime lending and predatory lending is important for policymakers. The North Carolina Commissioner of Banks indicates “[w]hile most predatory lending is subprime, not all subprime lending is predatory.”67 Subprime lending refers to the secondary loan market in which borrowers with lower credit scores pay a higher price to lenders for access to credit. The number of subprime loans has grown dramatically over the past decade, with a recent GAO study reporting subprime lending increased from $34 billion in 1994 to $213 billion eight years later.68 Subprime lending has benefited borrowers with weak credit histories who often had little or no access to credit in past decades. National research states that “[s]ubprime mortgages can provide an important function, enabling borrowers who do not meet credit standards in the prime market to buy new homes, to improve their homes, or to access the equity in their homes for other purposes. However, the subprime market also can be a fertile ground for predatory lending activities.”69 Because low-income borrowers pay higher interest rates in exchange for access to credit, they may struggle to meet their debt obligations. The National Consumer Law Center indicates the limited savings and low equity of low-income homeowners leaves them vulnerable to mortgage delinquency and foreclosure if there are significant fluctuations in income and expenses.70
66 North Carolina Department of Justice, Consumer Protection Section, “Predatory Mortgage Lending,” 1999, 2000. 67 Joseph A. Smith, Jr., North Carolina Commissioner of Banks, “North Carolina’s Predatory Lending Law: Its Adoption and Implementation,” Presented to the National Conference of State Legislatures Annual Meeting, July 26, 2002. 68 National Low Income Housing Coalition, 2004 Advocates Guide to Housing and Community Development Policy “Predatory Lending,” http://www.nlihc.org/advocates/predatory.htm, accessed December 17, 2004. 69 Allen Fishbein, Harold L. Bunce, “Subprime Market Growth and Predatory Lending, “Housing Policy in the New Millennium Conference Proceedings, U.S. Department of Housing and Urban Development, 2001, p. 278. 70 National Consumer Law Center, “Sustainable Homeownership: The Importance of Homeownership,” http://www.nclc.org/initiatives/sustainable_home/, accessed December 17, 2004.

37
Impact on Foreclosures Research indicates one consequence of predatory lending is that borrowers stripped of their home equity are at an increased risk of foreclosure.71 Although the rate for subprime foreclosures is higher than average because of the greater credit risk among borrowers, some research suggests subprime loans with abusive characteristics, or predatory loans, substantially raise the subprime foreclosure rate, pointing to research from the 2000 joint predatory lending report from the Department of Housing and Urban Development and the Department of Treasury.72 Some states have developed mortgage foreclosure prevention programs that can help predatory lending victims retain their homes through counseling, advocacy, and foreclosure alternatives.73 North Carolina’s Experience In 1999, North Carolina became the first state to enact legislation that prohibited abusive practices by predatory lenders, the product of a consensus among banks, mortgage bankers and brokers, nonprofit organizations, and other stakeholders.74 The law’s goal was to “protect consumers from abusive practices that can rob them of their homes without restricting consumers’ access to credit.”75 The law included specific provisions, such as:
• prohibiting prepayment penalties on first-lien mortgages of less than $150,000;
• prohibiting lenders from refinancing an existing home loan when there is no net benefit to the borrower and recommending a borrower contemplating a home loan refinance to default on an existing loan;
• prohibiting the financing of single premium credit insurance and the financing of fees, balloon payments, negative amortization, lending without regard to ability to repay a loan; and
• requiring borrowers receive financial counseling before assuming high-coast loans.76
Over the past five years, four organizations studied the law’s impact, with all four studies concluding the overall number of subprime loans decreased in North Carolina following passage of the law. Studies disagree over whether this decrease is good (fewer loans in the state with predatory terms) or bad (less access to subprime loans for borrowers who are high credit risks). In 2002, a nonprofit research and policy organization called the Center for Responsible Lending released North Carolina’s Subprime Home Loan Market After Predatory Lending Reform, which presented the following key findings:
71 Fishbein and Bunce, 2001. 72 Stein, p.4. 73 Family Housing Fund, “Mortgage Foreclosure Prevention: Programs and Trends,” December 1998, pp. 12-13. 74 Smith, Jr., North Carolina Commissioner of Banks. 75 Heather Morton, “North Carolina’s Predatory Mortgage Lending Law,” State Legislatures, December 2004, p. 24. 76 Ibid.
38
• Subprime home lending continues to thrive in North Carolina; • North Carolina borrowers, including low-income borrowers, continue to have
access to a wide range of choices when selecting a home loan; and • By preventing predatory terms on 31,500 subprime loans made in North Carolina
in 2000, the law has saved borrowers an estimated $100 million or more. However, researchers with Georgetown University’s School of Business and the Mortgage Bankers Association came to different conclusions, finding:
• the law has limited access to mortgage loans for higher-risk borrowers; • any reductions in predatory mortgage lending have occurred at the
expense of legitimate home loans, with declines among lower-income borrowers; and
• fewer refinance loans are given in predominately minority neighborhoods than before the law.
However, examining only the aggregate trend in subprime lending – did it go up or did it go down? – fails to consider the relative contribution of certain categories of subprime loans to the overall subprime rate. Researchers with the University of North Carolina-Chapel Hill’s Business School state:
Previous studies have noted a decline in overall subprime lending following the law’s enactment. We suggest that such a finding is to be expected given that the purpose of the law was to reduce the number of subprime loan originations with predatory or abusive terms. To us, the relevant question is what component(s) of subprime lending decline, and which remained stable or increased after the law was implemented.77
To address this concern, those researchers analyzed 3.3 million subprime loans between 1998 and 2002, concluding there was a reduction in predatory loans without restricting borrower access to loans in the subprime market; in other words, the authors concluded North Carolina’s decline in subprime lending resulted from a reduction in refinance loans with predatory terms. Analyzing the subprime market in North Carolina before and after passage of the law, the report concluded :
• predatory lending activity decreased sharply, with the number of subprime refinance loans declining 20 percent while subprime home purchase loans increased 43 percent;
• loans with prepayment penalties of three years or more dropped 72 percent, while rising in neighboring states, including Tennessee; and
• subprime loans to North Carolina borrowers with low credit scores increased by almost one-third, consistent with the increase in most neighboring states.78
77 Quercia, Stegman, and Davis, p.1. 78 Ibid., pp. 16-18, 20.

39
Federal Involvement In January 2004, the federal Office of the Comptroller of the Currency (OCC) issued a rule that preempts state laws concerning savings and loans and banks with federal charters, resulting in federal preemption of predatory lending laws in some states. All 50 state Attorneys General, the Conference of State Bank Supervisors, and the National Association of REALTORS® objected to this federal preemption of state anti-predatory lending laws.79 According to the National Conference of State Legislatures, several states have extended the federal preemption to state-chartered banks in efforts to achieve uniform banking regulation among state and federally chartered financial institutions.80 Although state-chartered banks /financial institutions still fall under state jurisdiction, some states, including Tennessee, are concerned about the uneven regulatory field state predatory lending legislation might create between federal and state lending regulations. In response to OCC preemption, Congress is now debating two different approaches to predatory lending legislation at the federal level. Both approaches would add more predatory lending protections to federal law, such as the outlawing of prepayment penalties after a certain amount of time. The approaches differ, however, on the degree of regulation, with at least two bills enacting more stringent regulations and another bill more lenient ones. These two approaches also differ on whether federal law should preempt all state and local anti-predatory lending.81 A Joint Predatory Lending study committee created in 2002 by the Speakers of the Tennessee House and Senate was charged with examining predatory lending laws in other states for replication in Tennessee. The committee reviewed current programs in place to eradicate the practice, listened to testimonies of victims across the state, and devised legislation to help address the growing problem of predatory lending. In April 2004, the Bredesen Administration created the Consumer Resources Division within the Department of Financial Institutions. The division is a clearinghouse for citizens who request financial information and education and seek complaint assistance regarding institutions chartered and licensed in the state of Tennessee. The Consumer Resources Division collects data on the degree and type of consumer complaints, which should prove useful in allowing policymakers to determine the extent of complaints about mortgage company practices. Signed into law in May 2004, Public Chapter 747 provides Tennessee with a regulatory enforcement approach to curb predatory lending practices. Among other changes, the law requires mortgage loan originators to register with the Department of Financial Institutions, grants more enforcement powers to revoke and suspend mortgage
79 Center for Responsible Lending, “Federal Preemption Favors Predatory Lending,” June 18, 2004, http://www.responsiblelending.org/pdfs/ib010-Fed_Preemption_Favors_PL-0604.pdf, accessed, September 13, 2004. 80 Morton, p. 25. 81 National Low Income Housing Coalition, 2004 Advocates’ Guide to Housing and Community Development Policy, “Predatory Lending,” http://www.nlihc.org/advocates/predatory.htm, accessed December 17, 2004.
40
professionals’ licenses, and increases the penalty dollar amount the Department can levy for violations of the law.82 Tennessee does not operate an emergency mortgage assistance program. Since the 1980s, Pennsylvania has operated a Homeowners’ Emergency Mortgage Assistance Program (HEMAP). The program’s purpose is to “prevent widespread mortgage foreclosures and distressed sales of homes which result from default caused by circumstances beyond a homeowner’s control.” The program is also a cost-effective means to prevent homelessness and “allows homeowners to seek education, job training and alternative employment when they most need it.” 83 Pennsylvania operates HEMAP as a loan program. Recipients may receive two types of loans: 1) continuing loans – in which the agency brings homeowners’ mortgages current and provides continuing help with recipients’ monthly mortgage payments; 2) non-continuing loans– in which the agency brings recipients’ monthly mortgage payments current, with homeowners responsible for their mortgage payments after the closing. Total program assistance per recipient cannot exceed 24 monthly payments or $60,000. HEMAP makes loans at nine percent interest, receiving funding from state appropriations and recipient loan repayments. To be eligible for the program, a homeowner must:
• have suffered financial hardship through no fault of their own; • been at least 60 days delinquent on monthly mortgage payments; • reside in Pennsylvania; • occupy and own the home in foreclosure; • have a favorable mortgage credit history prior to the delinquency during
the previous five years; • demonstrate reasonable prospects of being able to resume normal
mortgage payments after assistance ends; • not have more than two existing liens against the mortgage so that
HEMAP assistance has no less than a third-lien position; • meet with designated counseling agencies within 30 days of receiving
notice of the program; • contribute a minimum contribution or repayment of $25 per month per
mortgage assisted; and • recertify each year to determine continued eligibility for the program. 84
82 Public Chapter 747, Tennessee Public Acts, 2004. 83 Pennsylvania Housing Finance Agency, “Homeowners’ Emergency Mortgage Assistance Program,” http://www.phfa.org/programs/hemap/, accessed November 16, 2004; Pennsylvania Housing Finance Agency, “Answers to Common Questions About the Homeowner’s Emergency Mortgage Assistance Loan Program Administered by the Pennsylvania Housing Finance Agency,” http://www.phfa.org/programs/hemap/QandA.pdf, accessed November 16, 2004. 84 In determining whether an applicant’s financial problems have occurred through no fault of the applicant, Pennsylvania requires applicants to detail certain income and expense information and the circumstances that caused their financial hardship (i.e., Pennsylvania considers the loss of employment due to layoff, strike or plant closing, serious medical problems, divorce or separation as circumstances that are beyond

41
In 2004, the North Carolina General Assembly passed legislation establishing the North Carolina Home Protection Pilot Program and Loan Fund. The state’s legislature appropriated $1.75 million for the program, designed to help workers who have lost their jobs as a result of changing economic conditions in the state avoid foreclosure. The General Assembly granted the North Carolina Housing Finance Agency discretion in developing, implementing, and administering the pilot program, requiring that the agency report to the legislature on the program’s effectiveness no later than May 1, 2005.85 The North Carolina General Assembly also appropriated $25,000 for the state’s Housing Finance Agency to prepare a report on the problem of increasing foreclosures, improvements to state law regarding foreclosure procedures and filings, and the benefits and feasibility of creating a foreclosure avoidance loan fund.86 Unlike Pennsylvania’s program, which is statewide, North Carolina will pilot its program in eight of its 100 counties.87 North Carolina also limits eligibility to individuals who have lost their jobs or have become underemployed (pay reduction, etc.), while Pennsylvania’s program allows other conditions such as serious medical problems and divorce. North Carolina allows assistance for no more than 18 months or $20,000, loaning participants funds at zero percent interest, with a minimum payment of $25.88 Changing macroeconomic conditions provided the impetus for creation of the Pennsylvania and North Carolina programs, with the closing of steel mills in Pennsylvania in the 1980s and the closing of manufacturing and textile mills in recent years in North Carolina leaving former employees at increased risk for mortgage default and foreclosure. In many cases, housing agencies can provide shelter but not the supportive services special needs populations require to live independently. In response to the Comptroller’s 2004 housing survey, 12 percent of respondents ranked services to special needs populations as the second most pressing need in their service area and 14 percent ranked it third. Affordable assisted living and additional in-home support services would allow many elderly, disabled, and mentally ill residents to live somewhat independently in the community rather than forcing them into nursing homes or inpatient facilities. In addition to contributing to the quality of these individuals’ lives, such support services cost less.
Unnecessary stays in hospital beds and regional mental health institutes, due to the lack of supportive community housing options, further compound this issue
one’s control. Conversely, quitting a job, committing a crime and being jailed, or money mismanagement would render an applicant ineligible for mortgage assistance.) 85 General Assembly of North Carolina, Session Law 2004-124, Part XX – A., Housing Finance Agency, Section 20A.1. (a). 86 Ibid. 87 Interview with Keir Morton, Housing Policy Analyst, and Tisha Herring, Loss Mitigation Specialist, North Carolina Housing Finance Agency, December 15, 2004. Note: North Carolina’s General Assembly authorized the state’s housing agency to select counties according to relevant economic indicators (i.e., county foreclosure rate, county unemployment rate, etc). 88 Ibid.
42
[of mental health housing needs]. Per day [per person] inpatient regional mental health institute stays range from $514 (Lakeshore) to $657.96 (Memphis). Housing options could be more effectively and efficiently provided through our community if developed and coordinated.89
Often, the monthly rent for assisted living facilities is well above what a senior or disabled person on a fixed income can afford. For 2004, the average social security monthly benefit payment is $862 for a disabled individual and $922 for a retired worker. Thus, some seniors have no other choice but to turn to public housing for shelter. Continued in-home support programs such as Meals on Wheels have proven successful in providing a means to ensure that seniors are taking necessary medications and receiving at least two meals a day, among other needed supports. Other supportive services critical to the health and well-being of the disabled and mentally ill and their ability to live independently in the community include case management, home making, and medical supervision. Many Tennessee Section 8 voucher holders have no legal protection from discrimination by property owners. Several housing program administrators expressed concern that voucher holders experience discrimination while searching for housing. Under the federal Fair Housing Act, passed in 1968 and amended in 1974 and 1988, no provider can:
• Refuse to rent or sell housing to anyone • Tell inquiring citizens housing is unavailable when in fact it is available • Show apartments or homes in certain neighborhoods only • Advertise housing to preferred groups of people only
However, the act deals only with discrimination based on color, national origin, religion, sex, familial status, or handicap. No federal or state provision protects against discrimination based on income level or source of income; therefore, there is no recourse for such discrimination. Other states and some municipalities within the state of Tennessee have passed laws specifically prohibiting discrimination based on income source, which protects Section 8 voucher holders from denial of tenant application based solely on the use of a housing choice voucher to pay the rent. The City of Memphis adopted a local fair housing ordinance that extends fair housing protections to additional protected classes not covered by the federal ordinance, including Section 8 voucher holders. In accordance with the ordinance, property owners of multi-family dwellings must accept an application and screen a voucher holder in the same manner that they screen a non-voucher holder. An owner can still deny tenancy based on other factors such as poor credit or rental history or a negative criminal background. However, these screening procedures must apply to all applicants, not just voucher holders. 90 89 Marie Williams, “Creating Homes Initiative (CHI) Phase II 2005 More!,” Tennessee DMHDD Strategic Plan to Partner with Communities to Create Housing Options for People with Mental Illness and Co-Occurring Disorders Effectively and Strategically in Tennessee, updated March 27, 2003, p. 3. 90 E-mail to author from Grace Stepter, Manager, Housing Choice Voucher Program, Memphis Housing Authority, received September 9, 2004.

43
It is also illegal in Massachusetts to discriminate against voucher holders:
It shall be an unlawful practice...For any person furnishing credit, services or rental accommodations to discriminate against any individual who is a recipient of federal, state, or local public assistance, including medical assistance, or who is a tenant receiving federal, state, or local housing subsidies, including rental assistance or rental supplements, because the individual is such a recipient, or because of any requirement of such public assistance, rental assistance, or housing subsidy program. 91
Connecticut has a similar law:
It shall be a discriminatory practice in violation of this section: To refuse to sell or rent after the making of a bona fide offer, or to refuse to negotiate for the sale or rental of, or otherwise make unavailable or deny, a dwelling to any person because of …. lawful source of income… 92
The Connecticut state law defines “lawful source of income” as income derived from “social security, [SSI], housing assistance, child support, alimony or public or general assistance.” 93
Other states and cities with laws prohibiting Section 8 Voucher Discrimination include New Jersey, the District of Columbia, and Chicago, Illinois.94
Survey respondents report a need for homeless people to receive special attention. Analysts requested that organizations responding to the housing survey submit any housing needs assessments they had conducted in their coverage area within the past five years. Several assessments identified an increasing need to address homelessness. Agency staff consistently expressed the need for special attention to homeless subpopulations (such as victims of domestic violence, the severely mentally ill, the physically disabled, and substance abusers.) Other areas mentioned included distinctions between homelessness types and varying strategies for each:
1. Literally Homeless-Individuals or families sleeping or living on the streets or in places not meant for human habitation, in emergency shelters, transitional housing, or permanent supportive housing.
2. Episodically Homeless-Individuals or families experiencing one or more episodes of “literal” homelessness over the course of a stated period.
3. Chronically Homeless-An unaccompanied, disabled individual who has been persistently homeless for more than a year or who has been homeless for four or more times in the prior three years.
91 General Laws of Massachusetts, Chapter 151B: Section 4(10). 92 Connecticut General Statutes, §46a-64c. 93 Connecticut General Statutes, §46a-63(3). 94 National Housing Law Project, Section 8 Housing, http://www.nhlp.org/html/sec8/source_of_income_3.htm , accessed September 20, 2004.

44
4. Temporarily Displaced-Individuals or families that usually manage to maintain residential stability but experience temporary displacement from permanent housing due to a variety of factors (sudden loss of income, medical emergency, natural disaster, etc.) and need temporary housing assistance to regain residential stability.
5. Precariously or Marginally Housed-Individuals or families who lack a permanent residence and are most often living “doubled-up” or “tripled-up” with other family members or friends or in sub-standard housing with a high potential for eviction due to non-payment of rent, utility cutoff, or condemnation of the property due to the property’s condition.95
Respondents suggest that increased funding in these areas could enable agencies to create, expand, or continue programs benefiting individuals and families in these categories. Such programs could include life skills and employment training with job search assistance, housing counseling to assist families facing foreclosure/eviction, rehabilitation, and aftercare programs for those addicted to drugs or alcohol, and a number of other programs depending on the individual or families’ needs.96 Tennessee does not maintain a comprehensive directory of successful affordable housing programs across the country. Direct and indirect providers of housing services may not be aware or have the time to research best housing practices. A directory of affordable housing programs would provide government officials, businesses, professional organizations and others interested in affordable housing with examples of best practices throughout the nation. The directory would also provide details on specific housing practices and identify areas of Tennessee with economic, demographic, and market conditions that might be appropriate for successful program replication.
95 FY 2004-2005 Needs Assessments for Homeless Populations, City of Memphis Housing and Community Development, September 16, 2004. 96 Housing and Homeless Needs Assessment, Northeast Tennessee/Virginia HOME Consortium, Consolidated Plan 2003-2005, August 4, 2004.

45
Recommendations Legislative Recommendations The General Assembly may wish to consider appropriating state funds for housing assistance and creation of affordable housing units. State allocations would help offset shrinking federal dollars for housing assistance and would allow more state control to target programs at the specific areas of need. The General Assembly may wish to consider amending TCA § 13-23-402 to divert the mortgage recordation tax and the realty transfer tax back to THDA. Numerous housing providers across the state used the THDA HOUSE fund, which was comprised of revenue from these two taxes, to provide several housing programs such as homeowner rehabilitation, single family development, rental housing, and ramps for the disabled. Housing providers have consistently reiterated the importance of restoring these funds to reinstate much-needed programs and services and to help revive their stressed budgets. The General Assembly may wish to consider implementing strict legislation regulating the subprime lending markets to eliminate predatory lending practices. The legislation should clearly define “predatory lending practice” so as not to impede those citizens whose only option is subprime lending. The legislation should also outline repercussions for lawbreakers. The state of North Carolina could serve as a model, as it has recently implemented legislation that has proven to reduce the incidences of predatory lending, thus saving its citizens millions of dollars annually. The General Assembly may wish to provide initial startup funding for a secondary loan pool pilot program. One approach to alleviating the financial impact of predatory loans is to provide capital so borrowers can refinance themselves out of predatory loans. By providing initial startup funding for a secondary loan pool pilot program, the General Assembly would enable housing organizations to make subprime loans to borrowers without the predatory lending characteristics sometimes found in the subprime market. By doing so, these organizations would supplement the lending efforts of legitimate subprime lenders, enabling Tennessee to expand credit access to borrowers with low credit scores, possibly reduce the incidence of predatory lending across the state, and do so without fear of constraining legitimate subprime lending. Recipient organizations could use the initial funding to establish a revolving loan pool that eventually becomes self-financing. The General Assembly could appropriate the initial funds, contingent upon recipient organizations leveraging funding from other public and private funding sources. The Executive Director of Affordable Housing Resources, Inc. suggests $500,000 to $1 million in secondary loan seed money would allow the nonprofit organization to leverage approximately ten times that amount from other sources.97 Local nonprofits, lenders, and other governmental and community development organizations have collaborated to form anti-predatory lending initiatives in Memphis and Nashville. The Nashville initiative, HomeSAFE Nashville, began in 2003, and is a $2 million collaboration involving Fannie Mae, the Nashville Housing Fund, Affordable Housing Resources, Inc., First Tennessee, Union Planters, National Bank of Commerce,
97 Interview with Eddie Latimer, Executive Director, Affordable Housing Resources, Inc., June 30, 2004.
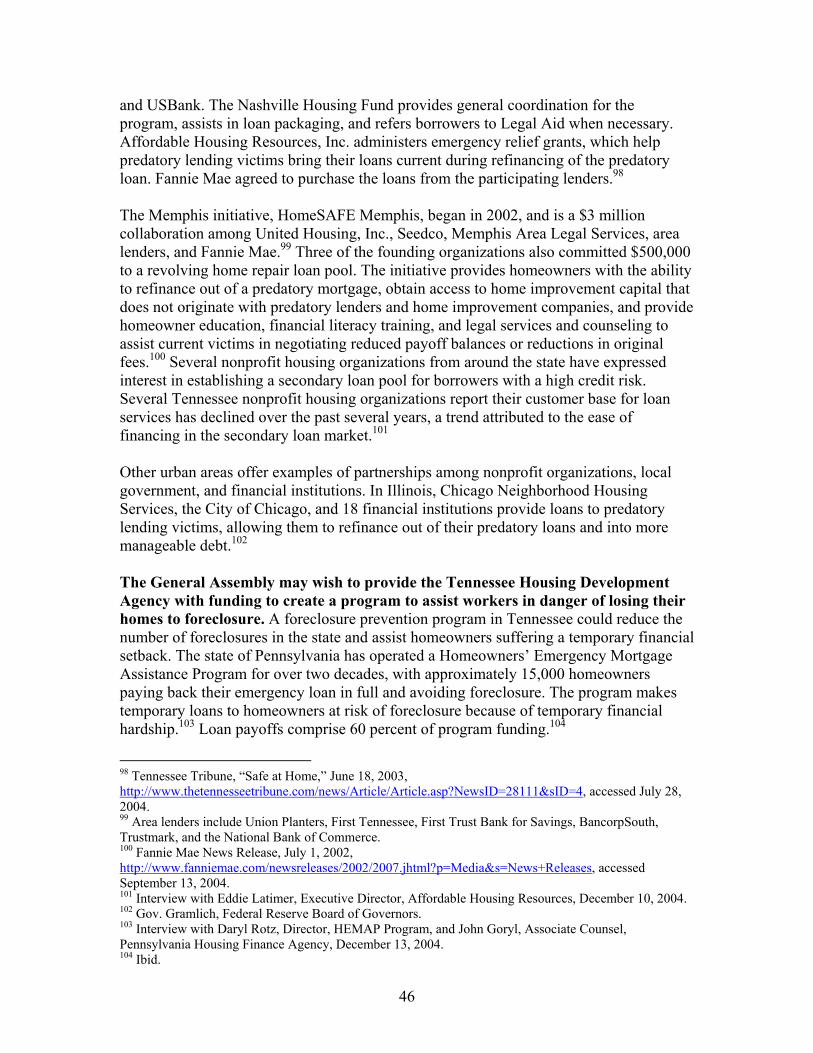
46
and USBank. The Nashville Housing Fund provides general coordination for the program, assists in loan packaging, and refers borrowers to Legal Aid when necessary. Affordable Housing Resources, Inc. administers emergency relief grants, which help predatory lending victims bring their loans current during refinancing of the predatory loan. Fannie Mae agreed to purchase the loans from the participating lenders.98 The Memphis initiative, HomeSAFE Memphis, began in 2002, and is a $3 million collaboration among United Housing, Inc., Seedco, Memphis Area Legal Services, area lenders, and Fannie Mae.99 Three of the founding organizations also committed $500,000 to a revolving home repair loan pool. The initiative provides homeowners with the ability to refinance out of a predatory mortgage, obtain access to home improvement capital that does not originate with predatory lenders and home improvement companies, and provide homeowner education, financial literacy training, and legal services and counseling to assist current victims in negotiating reduced payoff balances or reductions in original fees.100 Several nonprofit housing organizations from around the state have expressed interest in establishing a secondary loan pool for borrowers with a high credit risk. Several Tennessee nonprofit housing organizations report their customer base for loan services has declined over the past several years, a trend attributed to the ease of financing in the secondary loan market.101 Other urban areas offer examples of partnerships among nonprofit organizations, local government, and financial institutions. In Illinois, Chicago Neighborhood Housing Services, the City of Chicago, and 18 financial institutions provide loans to predatory lending victims, allowing them to refinance out of their predatory loans and into more manageable debt.102 The General Assembly may wish to provide the Tennessee Housing Development Agency with funding to create a program to assist workers in danger of losing their homes to foreclosure. A foreclosure prevention program in Tennessee could reduce the number of foreclosures in the state and assist homeowners suffering a temporary financial setback. The state of Pennsylvania has operated a Homeowners’ Emergency Mortgage Assistance Program for over two decades, with approximately 15,000 homeowners paying back their emergency loan in full and avoiding foreclosure. The program makes temporary loans to homeowners at risk of foreclosure because of temporary financial hardship.103 Loan payoffs comprise 60 percent of program funding.104
98 Tennessee Tribune, “Safe at Home,” June 18, 2003, http://www.thetennesseetribune.com/news/Article/Article.asp?NewsID=28111&sID=4, accessed July 28, 2004. 99 Area lenders include Union Planters, First Tennessee, First Trust Bank for Savings, BancorpSouth, Trustmark, and the National Bank of Commerce. 100 Fannie Mae News Release, July 1, 2002, http://www.fanniemae.com/newsreleases/2002/2007.jhtml?p=Media&s=News+Releases, accessed September 13, 2004. 101 Interview with Eddie Latimer, Executive Director, Affordable Housing Resources, December 10, 2004. 102 Gov. Gramlich, Federal Reserve Board of Governors. 103 Interview with Daryl Rotz, Director, HEMAP Program, and John Goryl, Associate Counsel, Pennsylvania Housing Finance Agency, December 13, 2004. 104 Ibid.

47
In 2004, the North Carolina General Assembly passed legislation establishing the North Carolina Home Protection Pilot Program and Loan Fund. The General Assembly appropriated $1.75 million for the program, designed to help workers who have lost their jobs as a result of changing economic conditions in the state avoid foreclosure. If Tennessee operated a homeowners’ emergency mortgage assistance program, the state could reduce the number of foreclosures in the state. The General Assembly may wish to consider passing legislation that supplements TCA § 4-21-203 to prohibit discrimination against Section 8 voucher holders in Tennessee. TCA § 4-21-203 relates Tennessee’s commitment to cooperate with HUD in enforcing the Fair Housing Act of 1968. However, this law does not list Section 8 voucher holders as a protected class. Supplemental legislation could increase voucher holders’ ability to find affordable housing. Other states and some cities within the state of Tennessee already have programs like this, which have proven to be successful. Administrative Recommendations If the General Assembly restores funding to the HOUSE program, The Tennessee Housing Development Agency should reexamine the programmatic requirements to ensure the program continues to target changing housing needs. Reexamining programmatic requirements will ensure a restored HOUSE program reflects the current affordable housing environment. THDA should closely examine the use of HOUSE funds prior to 2000 and determine how the needs and capacities of HOUSE-eligible institutions have changed over the past five years. In addition, THDA should help local housing programs improve their internal capacity so they can take advantage of HOUSE funding. THDA should also resume considering certain factors outlined in TCA § 13-23-403 in the allocation of future funding while also encouraging grantees to meet their local housing needs through a variety of housing strategies - multi-family, etc. The Tennessee Housing Development Agency should continue to encourage and facilitate the expansion of homebuyer education and homeownership services into underserved areas of the state. THDA examined access to homebuyer education in Tennessee in a 2002 report, concluding:
• discrepancies exist across Tennessee in the availability, curriculum, fee structure, quality, and statewide monitoring of homebuyer education delivered across the state;
• access to homebuyer education in rural counties is often unavailable and, if provided, may require travel to a location outside of the county;
• the inability of existing programs to fully meet the need of THDA program participants inhibits the success of THDA programs;
• the need for homebuyer education services will increase in Tennessee based on the growth of THDA programs and the nationally recognized value of homebuyer education programs; and

48
• THDA may need to assume a lead role in assuring quality homebuyer education is available across the state.105
THDA identified several areas in which the agency could take a greater role in homebuyer education, including resource development and distribution, certification of homebuyer education providers, training, information clearinghouse functions, and data collection. Following the report’s release, THDA began a new training program entitled the “Tennessee Homebuyer Education Initiative.”106 As part of the initiative, THDA has certified homebuyer education trainers, coordinated training sessions, and made over $105,000 in payments to certified agencies for homebuyer education services to THDA loan customers over the last two years. THDA continues to coordinate, evaluate, and monitor the program. A continuum of support services before, during, and after the purchase of a home not only improves the homeownership rate, but also assures, through post-purchase assistance, the increased homeownership rate is sustainable. Chattanooga Neighborhood Enterprise, Inc. has designed its homeownership programs around the concept of full-cycle lending, in which the organization assists customers from their first contact through the final loan payment, as shown in Exhibit 15.107 In encouraging and facilitating the expansion of homeownership services and homebuyer education throughout the state, THDA should consider the example of Minnesota’s Home Ownership Center, a program the National Conference of State Legislatures considers a “unique partnership of state and local government with nonprofits and the lending industry.”108 The Home Ownership Center is not a direct provider of homeownership services; instead, the Center provides other organizations with training, technical and financial support so
that homeowner support services (education, loan counseling, homeownership education, etc.) reach citizens throughout the state. According to the Center’s website, they place a
particular emphasis on serving people who traditionally have low homeownership levels, such as people with developmental disabilities, minorities, refugees, immigrants, female-headed households and people with poor credit histories.109 All these demographic groups 105 THDA, “Access to Homebuyer Education in Tennessee: Survey Results and THDA’s Utilization of Homebuyer Education Services,” March 21, 2002. 106 Note: AmSouth Bank, Fannie Mae, FDIC, and the Neighborhood Reinvestment Corporation partner with THDA to provide homebuyer education initiative event funding and support. 107 Chattanooga Neighborhood Enterprise, Inc. provides pre-purchase counseling and education, loan origination, processing, underwriting, closing; loan shipping, servicing; and post-purchase counseling, http://www.cneinc.org/, accessed December 17, 2004. 108 David Lawson, “The Minnesota Home Ownership Center: Serving Low-Income and Immigrant Populations,” National Conference of State Legislatures, August 2002, p. 1. 109 The Home Ownership Center website, http://www.hocmn.org/index.cfm?pageID=1, accessed November 23, 2004.
49
Exhibit 15: Full-Cycle Lending: A Continuum of Homeownership Support Services
Source: NeighborWorks Full-Cycle Lending Process, Family Housing Fund, “Mortgage Foreclosure Prevention: Programs and Trends,” December 1998.
have below average homeownership rates. The Center has also focused on two issues identified in this report as problems for Tennessee: foreclosures and predatory lending. The Center collaborated with other housing organizations to create a foreclosure/predatory lending hotline and a task force on predatory lending practices. A Home Ownership Center could improve the quantity and quality of homeownership services in Tennessee, as well as enhance communication and collaboration among the private, public, and nonprofit organizations involved with housing in Tennessee. The Tennessee Housing Development Agency should continue to encourage capacity building among the state’s nonprofit housing organizations. THDA officials have identified a need for improved capacity and collaboration among the state’s nonprofit organizations for funding and strategic planning. In April 2004, several private and public institutions, including THDA, sponsored a free two-day statewide capacity building conference, “Reaching New Heights: Capacity Building for Non-Profits,” for nonprofits and Community Housing Development Organizations.110 THDA should continue to 110 Don Harris, Deputy Executive Director, THDA, “THDA Co-Sponsors Capacity Building Conference,” Housing Matters, Vol. 2, No.4, Winter 03/04. Note: Co-sponsors also included AmSouth Bank, the Federal
Positive impact on community life Improved economic conditions
• Outreach • Pre-purchase
Education • Counseling
Flexible Loan Products
• Post-purchase counseling
• Foreclosure Prevention
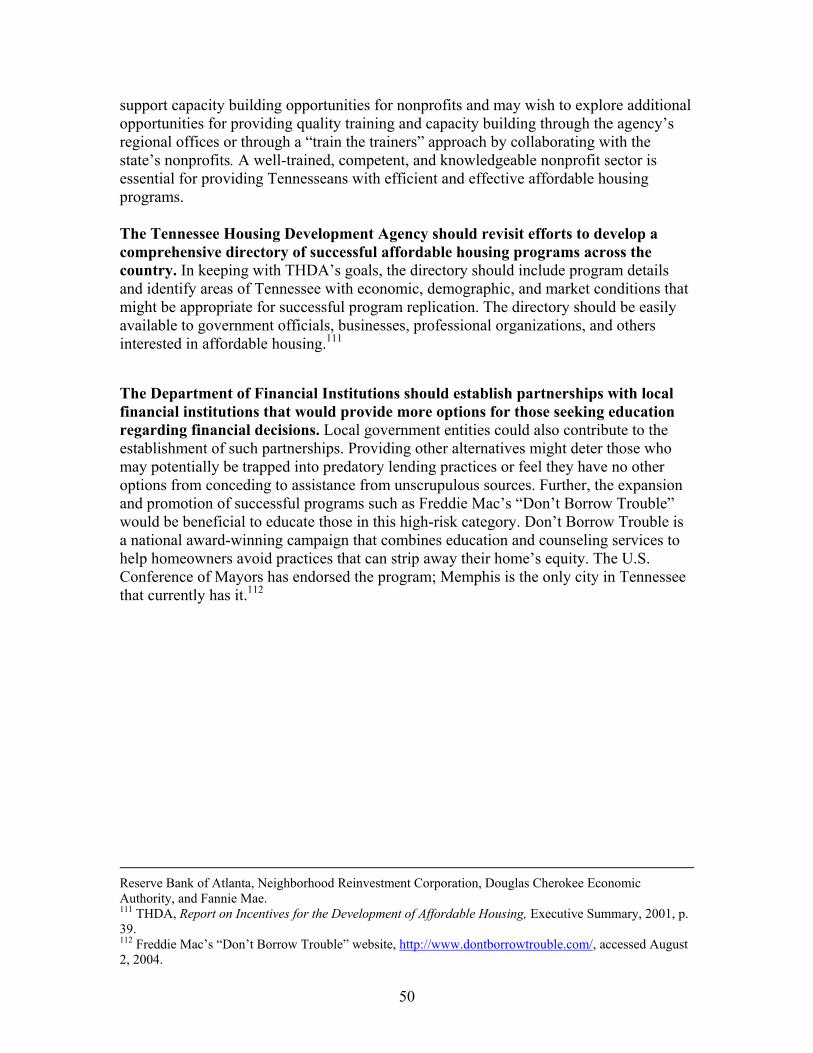
50
support capacity building opportunities for nonprofits and may wish to explore additional opportunities for providing quality training and capacity building through the agency’s regional offices or through a “train the trainers” approach by collaborating with the state’s nonprofits. A well-trained, competent, and knowledgeable nonprofit sector is essential for providing Tennesseans with efficient and effective affordable housing programs. The Tennessee Housing Development Agency should revisit efforts to develop a comprehensive directory of successful affordable housing programs across the country. In keeping with THDA’s goals, the directory should include program details and identify areas of Tennessee with economic, demographic, and market conditions that might be appropriate for successful program replication. The directory should be easily available to government officials, businesses, professional organizations, and others interested in affordable housing.111
The Department of Financial Institutions should establish partnerships with local financial institutions that would provide more options for those seeking education regarding financial decisions. Local government entities could also contribute to the establishment of such partnerships. Providing other alternatives might deter those who may potentially be trapped into predatory lending practices or feel they have no other options from conceding to assistance from unscrupulous sources. Further, the expansion and promotion of successful programs such as Freddie Mac’s “Don’t Borrow Trouble” would be beneficial to educate those in this high-risk category. Don’t Borrow Trouble is a national award-winning campaign that combines education and counseling services to help homeowners avoid practices that can strip away their home’s equity. The U.S. Conference of Mayors has endorsed the program; Memphis is the only city in Tennessee that currently has it.112
Reserve Bank of Atlanta, Neighborhood Reinvestment Corporation, Douglas Cherokee Economic Authority, and Fannie Mae. 111 THDA, Report on Incentives for the Development of Affordable Housing, Executive Summary, 2001, p. 39. 112 Freddie Mac’s “Don’t Borrow Trouble” website, http://www.dontborrowtrouble.com/, accessed August 2, 2004.

51
Appendix A: List of People Interviewed Housing Authorities Administrators for the Memphis Housing Authority Rebecca Adams, Executive Director, Greeneville Housing Authority Lisa Bonadio, Executive Director, Dayton Housing Authority Carolyn Flagg, Executive Director, Brownsville Housing Authority Hank Helton, Director of Development, Metro Development Housing Authority Winston Henning, Executive Director, Jackson Housing Authority Karena Milligan, Program Director, Bristol Housing Authority Phil Ryan, Executive Director, Metro Development Housing Authority Kim Satterfield, Executive Director, Hartsville Housing Authority Steve Scyphers, Executive Director, Bristol Housing Authority LeeAnn Worshaim, Resident Services, Greeneville Housing Authority
Tennessee Housing Development Agency Ted Fellman, Chief Financial Officer Don Harris, Deputy Executive Director Janice Myrick, Executive Director Lorrie Shearon, Director of Research, Planning and Technical Services Ed Yandell, Director of Multifamily and Special Programs
Tennessee Department of Financial Institutions Marsha Anderson, Staff Attorney Bradley Jackson, Administrative Services Assistant/Legislative Liaison Nicole Lacey, Assistant Commissioner, Consumer Resources Division
Commission on Aging and Disability Charles Hewgley, Assistant Director Nancy Peace, Executive Director
Non-Profits, Human Resource Agencies and Community Development Corporations Becky Butler, Executive Director, Jackson Affordable Housing Eddie Latimer, Executive Director, Affordable Housing Resources, Inc. Tracey McCartney, Executive Director, Tennessee Fair Housing Council Melanie McMahan, Housing Coordinator, Bradley-Cleveland Community Services Agency Members of the Memphis Community Development Council Alvin Nance, Executive Director, Knoxville Community Development Corporation Joyce Nunley, CSBG Director, Southeast Tennessee Human Resource Agency Philip Thompson, Senior Vice President, CIO, Chattanooga Neighborhood Enterprise, Inc.

52
Interviewees from other states John Goryl, Associate Counsel, Pennsylvania Housing Finance Agency Tisha Herring, Loss Mitigation Specialist, North Carolina Housing Finance Agency Keir Morton, Housing Policy Analyst, North Carolina Housing Finance Agency Daryl Rotz, Director, Pennsylvania Homeowners’ Emergency Mortgage Assistance Program Other interviewees Kim Darden, Supervisor, Comptroller of the Treasury, Division of Property Assessments, Property Tax Relief Program Terry Livingston, Operations Analyst, U.S. Department of Housing and Urban Development The Honorable Nathan Vaughn, Tennessee State Representative Wanda Willis, Executive Director, Tennessee Commission on Developmental Disabilities Marie Williams, Executive Director of Recovery, Tennessee Department of Mental Health and Developmental Disabilities Jason Cavendar, Budget Analyst, Tennessee Department of Finance and Administration

53
Appendix B: Survey Instrument
State of Tennessee Comptroller of the Treasury
Office of Research Housing Survey
I. General Information Name ___________________________ Phone _______________________ Title ___________________________ E-mail_______________________ Organization _______________________________________________________ Address ___________________________________________________________ ___________________________________________________________ Number of years with the organization ________________________________ II. Agency Structure/Programming 1. Please check the housing-related services and programs provided/administered by your organization (mark all that apply) ___ new home construction ___ public housing management ___ financial assistance (housing grants/loans, downpayment/closing cost assistance,etc.) ___ home repair/rehabilitation ___ handicap accessibility programs ___ supportive services (budget counseling, substance abuse) ___ emergency rental, utility, and/or mortgage assistance ___ services/programs for the homeless ___ Section 8 voucher administration ___ HOPE VI Revitalization ___ HOPE VI Demolition ___ other _____________________________________________ 2. Please indicate the primary geographic area served by your organization (mark all that apply) and specify your organization’s geographic boundaries (i.e. a multi-county organization should list the counties served in the provided space) ___ neighborhood _________________________________________________ ___ city _________________________________________________________ ___ county ______________________________________________________ ___ multi-county __________________________________________________ ___ state

54
___ other _________________________________________________________ 3. Please list other organizations (private, public, non-profit) your agency/organization collaborates with to meet community housing needs __________________________________________________________________ __________________________________________________________________ __________________________________________________________________ __________________________________________________________________ __________________________________________________________________ III. Target Population 4. Please indicate the target population served by your agency (mark all that apply) ___ low-income persons ___ persons 55 years of age or older ___ persons with physical disabilities ___ persons with mental illness ___ families with children ___ persons who are homeless ___ victims of domestic violence ___ persons with HIV/AIDS ___ other _____________________________________________ 5. How many clients (individuals, families) do you estimate you provide with housing assistance or services on an annual basis? Individuals_____ Families _____ IV. Funding 6. Please provide your agency’s sources of funding for the following two fiscal years 1998-99 2003-04 Federal $ ___________ _________ State ____________ _________ Local (public) ___________ _________ Private ____________ _________ Other __________ ___________ ________ Total $ ___________ _________
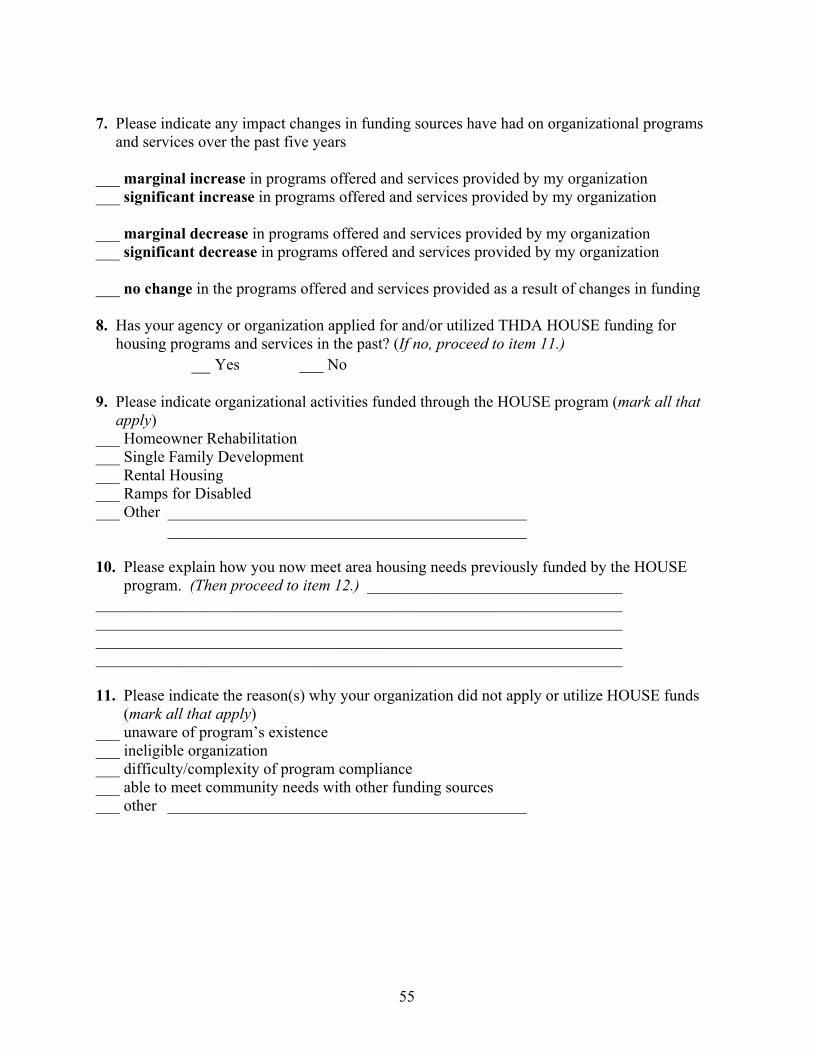
55
7. Please indicate any impact changes in funding sources have had on organizational programs and services over the past five years ___ marginal increase in programs offered and services provided by my organization ___ significant increase in programs offered and services provided by my organization ___ marginal decrease in programs offered and services provided by my organization ___ significant decrease in programs offered and services provided by my organization ___ no change in the programs offered and services provided as a result of changes in funding 8. Has your agency or organization applied for and/or utilized THDA HOUSE funding for housing programs and services in the past? (If no, proceed to item 11.)
__ Yes ___ No 9. Please indicate organizational activities funded through the HOUSE program (mark all that apply) ___ Homeowner Rehabilitation ___ Single Family Development ___ Rental Housing ___ Ramps for Disabled ___ Other _____________________________________________ _____________________________________________ 10. Please explain how you now meet area housing needs previously funded by the HOUSE program. (Then proceed to item 12.) ________________________________ __________________________________________________________________ __________________________________________________________________ __________________________________________________________________ __________________________________________________________________ 11. Please indicate the reason(s) why your organization did not apply or utilize HOUSE funds (mark all that apply) ___ unaware of program’s existence ___ ineligible organization ___ difficulty/complexity of program compliance ___ able to meet community needs with other funding sources ___ other _____________________________________________

56
V. Housing Need 12. Please provide your assessment of the general trend in affordable housing over the last five years ___ marginal increase in the need for affordable housing programs and services in my community ___ significant increase in the need for affordable housing programs and services in my community ___ marginal decrease in the need for affordable housing programs and services in my community ___ significant decrease in the need for affordable housing programs and services in my community ___ no change in the need for affordable housing programs and services in my community 13. Has your agency performed a housing needs assessment in the past five years? __ Yes (please include a copy of your agency’s most recent needs assessment with your
returned survey) ___ No 14. Please indicate the most pressing housing needs in your service area (Please rank the following in order of need using numbers from 1 = most important to 9 = least important. Do not use any number more than once) ___ General lack of affordable housing Scarcity of Section 8 vouchers/housing, lack of affordable houses and rental units ___ Housing services
Need for homeowner/homebuyer training, downpayment and closing cost assistance, support services (substance abuse, budgeting), weatherization, utility and rent assistance
___ Housing research data
Lack of state and local data on housing needs, more research needed on community housing needs to better determine resource allocation
___ Fragmentation of programs, services, and funding Need for better organization, communication, and collaboration among housing providers to avoid duplicative services and improve overall service delivery ___ Community participation Lack of promotion and participation from realtors, lending institutions, private developers. Zoning issues/affordable land for development, predatory lending.

57
___ Funding Need for more local, state, and federal resources, more flexible funding streams, more funding options (loans, grants, credits, etc.) ___ Special needs populations Emergency beds and transitional housing, accessibility for the disabled and elderly, language, cultural, and knowledge barriers among immigrants ___ Local and state capacity
Need to build staff capacity (knowledge, ability, training, etc.) on the local level, technical assistance for grants, funding, and development, best practices dissemination and publication
___ Other _____________________________________________ _____________________________________________ _____________________________________________ 15. Which group or groups of people have the greatest unmet housing needs in your community? (Please rank the following in order of need using numbers from 1 = greatest need to 8 = least need. Do not use any number more than once) ___ low-income persons ___ persons 55 years of age or older ___ persons with physical disabilities ___ persons with mental illness ___ persons who are homeless ___ victims of domestic violence ___ persons with HIV/AIDS ___ other _____________________________________________ 16. What are the three most important housing priorities you think the legislature should focus on? (Please rank in order of importance, with number one being the most important) 1. _______________________________________________________________ 2. _______________________________________________________________ 3. _______________________________________________________________ 17. Please include any additional comments or information that will help us with our housing study. If you are aware of any programs and/or policies in other communities or states that could serve as best practices for Tennessee, please include this information. __________________________________________________________________ __________________________________________________________________ __________________________________________________________________ __________________________________________________________________ __________________________________________________________________

58
____________________________________________________________________________________________________________________________________ __________________________________________________________________ __________________________________________________________________
Please check the box if you would like to receive a copy of the final housing report
If you feel any of the above questions require a more detailed explanation than can be given in the available space, please add pages or clarify by phone or email. If you have any questions about or problems with the survey, please call Bonnie Adamson at (615) 401-7919, or e-mail at [email protected]. Please complete the survey and return it to the Office of Research by August 10, 2004. The survey and requested documents may be returned in the enclosed business reply envelope or via fax at (615) 532-9237. Please feel free to attach additional sheets as needed. Thank you for your time and cooperation.

59
Appendix C: Letter requesting OREA study

60
Appendix D: Response Letter from Commissioner of Financial Institutions

61
Appendix E: Response Letter from Executive Director, Tennessee Housing Development Authority

Offices of Research and Education Accountability Staff
Director ◆Ethel Detch
Assistant Director (Research)
◆Douglas Wright
Assistant Director (Education Accountability)
Phil Doss
Principal Legislative Research Analysts ◆Kim Potts
Senior Legislative Research Analysts ◆Bonnie Adamson Kevin Krushenski ◆Russell Moore Margaret Rose Greg Spradley
Associate Legislative Research Analysts Corey Chatis
Jessica Gibson Jessica King Erin Lyttle
◆Sonya Phillips
Executive Secretary ◆Sherrill Murrell
◆indicates staff who assisted with this project