a pilot protocol study on how designers construct function ... · a pilot protocol study on how...
TRANSCRIPT

Design Computing and Cognition DCC’12. J.S. Gero (ed),
pp. xx-yy. © Springer 2012
1
A Pilot Protocol Study on How Designers Construct
Function Structures in Novel Design
Chiradeep Sen
Oregon State University, Corvallis, OR, USA
Joshua D. Summers
Clemson University, Clemson, SC, USA
This paper reports a pilot protocol study that examines how designers construct
function models as they develop and explore solution architectures for novel de-
sign problems. The purpose of this pilot project is to establish the experiment
method and analysis protocol so that a repeatable and statistically large pool of
participants can be used to draw significant conclusions about function model
construction. In the study, voluntary participants with varied levels of experience
in product design and function modeling are given a novel design problem and
asked to develop functional architectures as part of concept development, using
function structures as the modeling tool/language. The modeling actions are vide-
otaped and the designers are interviewed using a predesigned questionnaire after
the experiment. The data is analyzed using a predefined protocol that encodes the
addition, deletion, and modification of model elements such as functions, flows,
and text, and also actions such as reading the problem statement and pausing. The
protocol analysis reveals patterns of modeling activities, such as forward chaining
(expanding the model by adding functions to the head of flows and flows outgoing
of functions), backward chaining (adding functions to the tail of flows and adding
flows incoming to functions), and nucleation (starting with a few disconnected
functions and flows, and gradually connecting them to complete the model). In
aggregate, these observations provide insight into designers' thinking patterns
while exploring solutions to unseen problems using function structures. The pro-
tocol is demonstrated to be complete within the scope of the study. The prelimi-
nary findings based on the two participants indicate that various parameters of so-
lution exploration may largely vary between designers. The overall approach of
model expansion also varies between forward chaining and nucleation. However,
at a finer resolution of observing modeling actions, designers generally prefer nu-

C. Sen and J.D. Summers 2
cleation or forward chaining of functions and forward or backward chaining of
flows.
Introduction
The purpose of the reported experiment is to establish an experiment
method and analysis protocol to examine how mechanical product design-
ers use function structure graphs to develop and explore solution architec-
tures to novel design problems. This understanding can be useful in de-
veloping new design enablers, new approaches to early stage reasoning
and analysis systems, and new methods for teaching students how to more
effectively execute the design process. Function models are a popularly
discussed product model used in early design to decompose the problem
[1, 2], explore the solutions space [2, 3], search solutions [4], generate
concepts [5, 6], and to archive design knowledge [7]. Many representa-
tions of mechanical functions are proposed in previous research, both in
artificial intelligence [8-12] and in engineering design [1, 2]. Typically,
these models are designed to support specific reasoning tasks. Specifical-
ly, function structure graphs and its extensions have been used to develop
tools for concept generation [4-6], product similarity analysis [13], and
failure modeling [14, 15] and failure propagation [16]. These graphs have
also been used extensively to model the functionality of reverse engineered
products [7] that are archived in a web-based data base named the Design
Repository1. However, how designers interact with these models to de-
velop and explore solutions to new, previously unaddressed problems
has not been objectively examined. Objective observation of function modeling by designers could help
identify modeling action patterns, such as forward chaining, backward
chaining, or nucleation, the type of stimuli and their use by the designers,
and the type of information they prefer to capture for exploring solutions
to new problems. This could in turn help identify important cognitive and
behavioral trends about solution exploration. It could also provide insight
to the design of formal representations of functions to enable early com-
puter-aided design tools. For example, if designers tend to identify func-
tions of a device before identifying the flows, a function-focused represen-
tation may be suitable, while if designers think of the device mainly in
terms of its flows, then a flow-based representation may be more useful.
Recent research proposed a formal representation of functions and showed
that it could support early automated reasoning using the balance laws of
1 http://repository.designengineeringlab.org/, accessed on Feb 23, 2011

A Protocol Study of Function Modeling Actions 3
mass and energy [17]. This experiment could reveal patterns of user-
model interactions that could identify requirements for the user interface of
such computer tools. The protocol study, described next, is an exploratory
experiment designed with these anticipations.
Function Structures as an Early Design Representation
Functionality of mechanical devices is modeled in many different repre-
sentations. Notable representations include The Function-Behavior-
Structure model [18], the situated FBS model [19], the Function-Behavior-
State model [20], a design pattern-based view [21], the Structure-
Behavior-Function model [9, 22, 23], and the Functional Representation
[10, 24]. This paper specifically focuses on user interaction with the
graph-based Function Structure representation and this model is discussed
in further detail. The use of function structures to model to support early
design tasks is popularly recommended in design texts [1-3] and also wide-
ly explored in design research [4, 6, 13, 15, 25]. A function structure is a
graph-based model of a product, where the nodes are transformative ac-
tions and the edges are the flows of material, energy, and signal undergo-
ing transformations. Fig1 shows the function structure for a hairdryer ob-
tained from a web-based archive of reverse engineered product design
information, called the Design Repository1 [7, 26]. The flow name abbre-
viations are clarified in the legend.
Fig1. Function structure graph for a hairdryer product stored in the Design Repos-
itory
This representation is described as a means to decompose a design
problem [1, 2], search solutions [4], generate concepts [5, 6], and to ar-
chive design knowledge [7]. In order to enforce consistency of terms used
in these models, many controlled vocabularies of function verbs and flow
nouns are developed [27-30]. A notable example is the Functional Basis,
developed by examining consumer products through systematic reverse
Import
EE
EE – Electrical Energy
HE – Human Energy
ME – Mechanical Energy
Transfer
EE
Actuate
EE
Regulate
EE
Distribute
EE
Transfer
EE
Convert
EE to Th.E
Convert
HE to CS
Import
HE
Guide
HE
Export
HE
Import
Gas
Guide
Gas
Export
Gas
Transfer
EE
Convert
EE to ME
Transfer
ME
Convert
ME to Pn.ETh. E – Thermal Energy
Pn. E – Pneumatic Energy
CS – Control Signal
EE EE EE EE
EE
EE EE
Th.E
EE ME ME
Pn.E
Air Air
Hot
Air
Hot
Air
HE HE HE
HE
intensity
on/off
HE
EE

C. Sen and J.D. Summers 4
engineering [2] and cataloging their functions and flows in a three-level
hierarchical vocabulary. The Design Repository is an archive of these re-
verse engineered products and is currently expanding to support other re-
search needs. The information stored in the repository, especially those re-
lated to function and failure of a product are used to develop early design
tools for concept generation [4-6], product similarity analysis [13], failure
modeling [14, 15], and failure propagation [16]. While function structures
are widely used, especially to model reverse engineered products, the actu-
al process of how these models are constructed and can be used by a de-
signer to solve novel design problems (forward design) has not been objec-
tively and systematically studied through experiments. The experiment
described next is only a first step in this direction and describes results for
only two participants. In recent future, this approach will be applied to run
more experiments of this type through collaborative research.
Design of the Experiment
In the experiment, voluntary participants with a variety of experiences in
product design and function modeling are given a new product design
problem and asked to develop and explore solution architectures using the
function structure graphs. Each modeling session is videotaped and the
designer interviewed subsequently. The video data is encoded using a
predefined protocol that captures the addition, deletion, and modification
of model elements such as functions, flows, and texts, and also actions
such as reading the problem statement and pausing.
Three basic types of model expansion sequences are examined in this
experiment: nucleation, forward chaining, and backward chaining. Nu-
cleation of a function is an action when a function is inserted into the mod-
el without attaching it to an existing flow, indicating that the designers has
identified a need for a function by its purpose or its name, but has not yet
determined its transformative actions. Similarly, nucleation of a flow indi-
cates that the designer identified the need for the flow’s presence in the
model, but has not indicated how it is going to be used.
Forward chaining is a sequence when the model is expanded by adding
outgoing flows to functions and adding recipient functions to the head of
those flows, indicating that the designer has already identified the func-
tional transformation process steps leading to a means (eventually modeled
at the head of the chain).
Backward chaining is a sequence, where the model is expanded by add-
ing input flows to a function and producer functions to the tail of those

A Protocol Study of Function Modeling Actions 5
flows, indicating that the designer has first determined the outcome (the
head function or flow of the chain) and is exploring how that outcome can
be obtained through transformations.
A given modeling session is not expected to be governed by one strate-
gy alone, rather, an appropriate mix and variation between these three se-
quences is expected. Typically, nucleated sub-functions can be joined by
both forward and backward chaining, until neighboring nuclei are connect-
ed through flows to complete the function structure.
Participant Selection
The participants are volunteer graduate students of a design research lab
with comparable educational background and training in design theory and
methodology. Prior to selection, they are given a survey to collect data
about their familiarity with function modeling and product design. For the
first, the number of years of using and constructing function models in
forward design and reverse engineering are collected, along with the num-
ber of unique products modeled or designed and the number of design pro-
jects done in different capacities (e.g., designer, leader, advisor). For the
second, the volunteer is asked to list products under five categories—
consumer appliances, shop tools, machinery and mechanisms, electronics,
and toys—that he or she has used, studied (taken apart), or designed.
Based on this survey, two participants are chosen for the study. The first
participant, P1, has approximately ten years of experience with mechanical
product design as both designer and team leader and four years of experi-
ence in function modeling, while the second participant, P2, has approxi-
mately two years of experience in both areas. As a next step, this experi-
ment will be repeated using more participants from collaborating research
labs, in order to increase the replication and credibility of the data. How-
ever, this extension is out of scope for this current paper.
Design Problem and Task
In order to ensure that the designers actually face a novel design problem
and could still develop models for the solution, the design product must be
new to the designer, yet one whose principles are familiar in real life. Ac-
cordingly, the following problem is developed.
“Design an automatic clothes-ironing machine for use in hotels. The
purpose of the device is to press wrinkled clothes as obtained from clothes
dryers and fold them suitably for the garment type. You are free to choose
the degree of automation. At this stage of the project, there is no re-
C. Sen and J.D. Summers 6
striction on the types and quantity of resources consumed or emitted.
However, an estimated 5 minutes per garment is desirable”.
While an ironing machine is unfamiliar to the participants, ironing is a
fairly well-understood activity, which enables the participants to intelli-
gently ideate the functions. The design instructions ask the participant to
develop and explore functional architectures for the design concept using
function structure graphs as the medium of expression. The participants
are given a marked area of a dry-erase board in the research lab—their fa-
miliar work environment—on which to construct their models.
The Protocol Coding Scheme
Before collecting data through the experiments, a scheme to encode the
collected data is developed. This coding scheme ensures that (1) all per-
sonal information such as handwriting are not accessible during data anal-
ysis, (2) the methods and algorithms for analyzing the data are committed
to before data collection, so that the analysis is not biased by observations
made at run-time of the experiments, and (3) all information used in analy-
sis, such that the model itself and its construction process, could be com-
pletely re-enacted entirely based on the encoded information, without re-
ferring to the raw data. These requirements are imposed on the coding
scheme in order to ensure objective, unbiased analysis. As the purpose of
the experiment is to study designers’ modeling actions, a list of atomic
model elements and modeling actions are identified for monitoring through
the code. Objective instructions for coding the raw data are also devel-
oped, as discussed next.
Atomic Model Elements
A pilot study was conducted to identify a set of modeling elements a de-
signer may use when modeling the ironing machine (Table 1). For objec-
tive identification of these elements, their definitions are also developed.
The code column indicates abbreviations to be entered during encoding the
data.
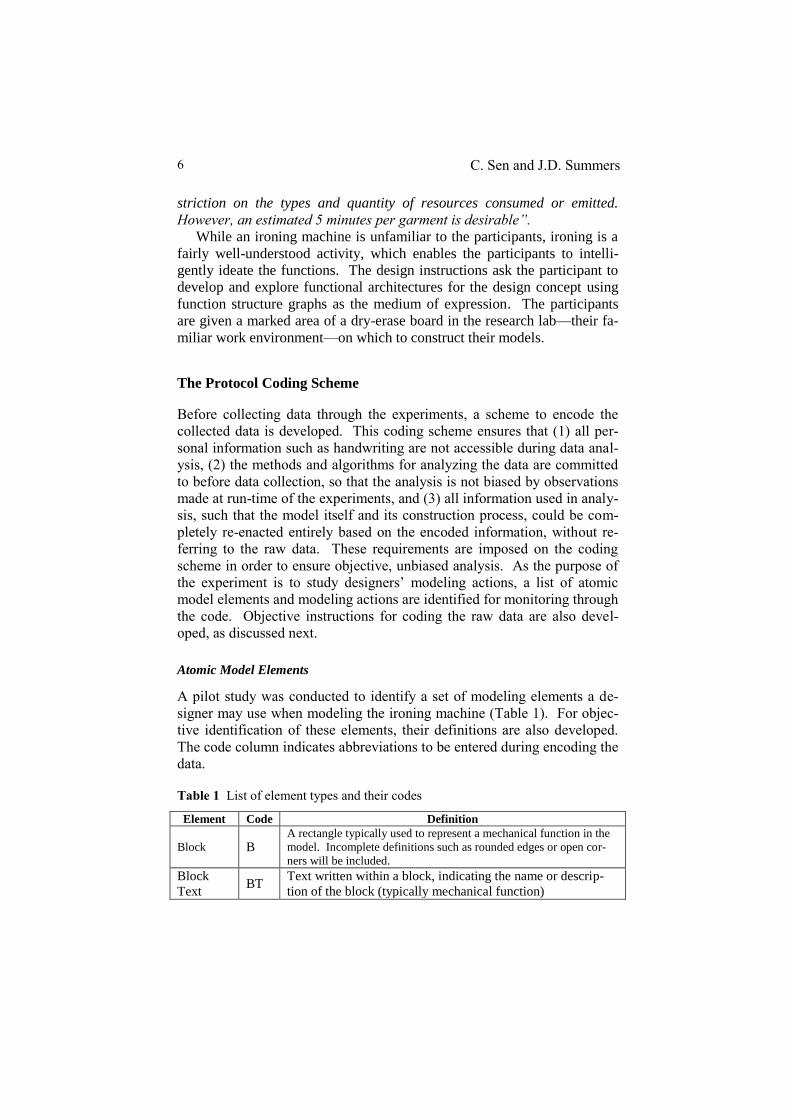
Table 1 List of element types and their codes
Element Code Definition
Block B A rectangle typically used to represent a mechanical function in the
model. Incomplete definitions such as rounded edges or open cor-
ners will be included.
Block
Text BT
Text written within a block, indicating the name or descrip-
tion of the block (typically mechanical function)

A Protocol Study of Function Modeling Actions 7
Element Code Definition
Edge E An arrow, including its stem and its head, attached to a block
or not, typically use to represent flows in the model
Edge Text ET Text written above, below, or beside an edge, indicating a name or
description of the flow
Source SC A circle or other shape, indicating the source of a flow or flows that
are not originating from a rectangle (function)
Sink SK A circle or other shape, indicating the terminus of a flow or flows
that are not terminating to a rectangle (function)
Note N A textual or symbolic expression that is not an ET or a BT
Symbol S A graphical expression (such as an arrow, a highlighting on existing
text (e.g., underlines, encircling, or a punctuation mark)
Symbol
Text ST
Text used to annotate a symbol, such as text written beside an arrow
that is not an E
Diamond D Diamond-shaped boxes in the graph-based part of the model, typi-
cally used to represent a decision point
Diamond
Text DT Text written inside a diamond
Edge Head EH The head of an edge, drawn at least one pregnant pause or more time
lapse after drawing the stem
Atomic Modeling Actions
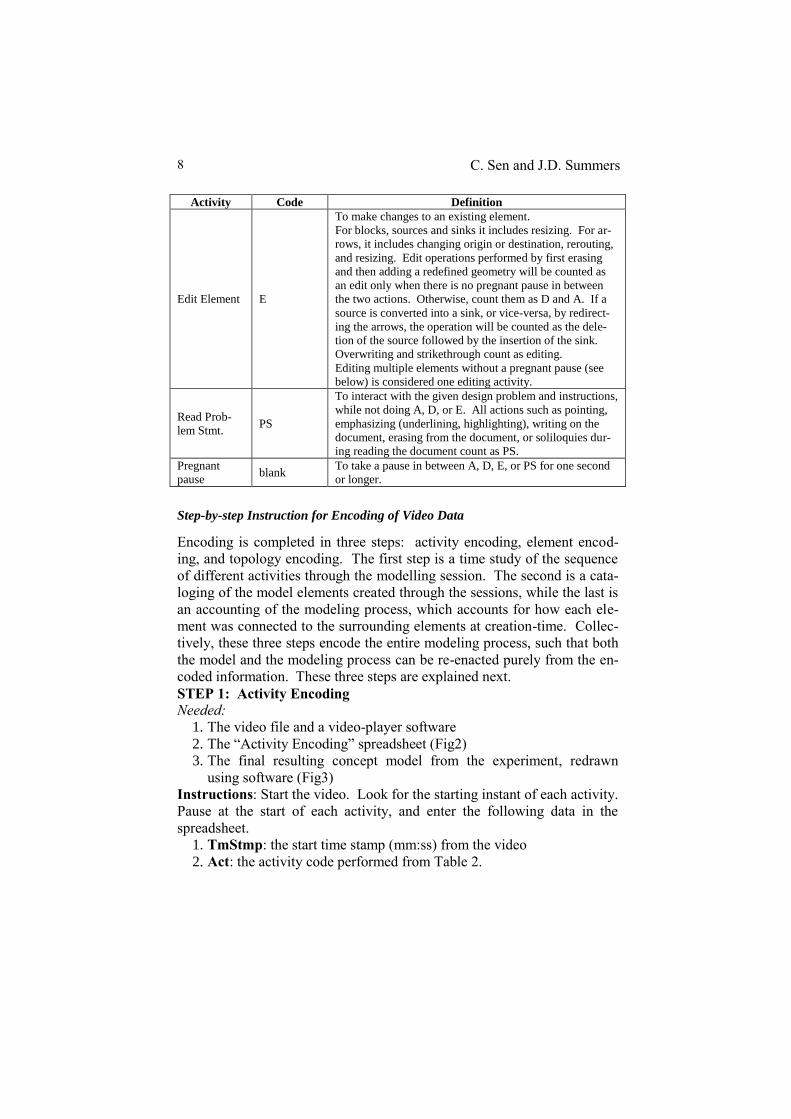
Based on the pilot study, five different activities and their definitions are
identified (Table 2).
Table 2 List of activities and their codes
Activity Code Definition
Add Element A
To insert an element in the model.
Incomplete construction will be counted in when other el-
ements are added to the model subsequent to inserting the
partial element, since it constitutes “using” the partial ele-
ment in the model. If the partial element is deleted after
construction without any other activity other than a preg-
nant pause, its insertion will not be counted.
Delete Ele-
ment D
To remove an element from the model by erasing its
graphics.
Partial deletion will be considered a full deletion when the
remainder of the element is subsequently not used in the
model.
Deletion of multiple elements without a pregnant pause
(see below) is considered one deletion activity.
C. Sen and J.D. Summers 8
Activity Code Definition
Edit Element E
To make changes to an existing element.
For blocks, sources and sinks it includes resizing. For ar-
rows, it includes changing origin or destination, rerouting,
and resizing. Edit operations performed by first erasing
and then adding a redefined geometry will be counted as
an edit only when there is no pregnant pause in between
the two actions. Otherwise, count them as D and A. If a
source is converted into a sink, or vice-versa, by redirect-
ing the arrows, the operation will be counted as the dele-
tion of the source followed by the insertion of the sink.
Overwriting and strikethrough count as editing.
Editing multiple elements without a pregnant pause (see
below) is considered one editing activity.
Read Prob-
lem Stmt. PS
To interact with the given design problem and instructions,
while not doing A, D, or E. All actions such as pointing,
emphasizing (underlining, highlighting), writing on the
document, erasing from the document, or soliloquies dur-
ing reading the document count as PS.
Pregnant
pause blank
To take a pause in between A, D, E, or PS for one second
or longer.
Step-by-step Instruction for Encoding of Video Data
Encoding is completed in three steps: activity encoding, element encod-
ing, and topology encoding. The first step is a time study of the sequence
of different activities through the modelling session. The second is a cata-
loging of the model elements created through the sessions, while the last is
an accounting of the modeling process, which accounts for how each ele-
ment was connected to the surrounding elements at creation-time. Collec-
tively, these three steps encode the entire modeling process, such that both
the model and the modeling process can be re-enacted purely from the en-
coded information. These three steps are explained next.
STEP 1: Activity Encoding
Needed:
1. The video file and a video-player software
2. The “Activity Encoding” spreadsheet (Fig2)
3. The final resulting concept model from the experiment, redrawn
using software (Fig3)
Instructions: Start the video. Look for the starting instant of each activity.
Pause at the start of each activity, and enter the following data in the
spreadsheet.
1. TmStmp: the start time stamp (mm:ss) from the video
2. Act: the activity code performed from Table 2.

A Protocol Study of Function Modeling Actions 9
Element IDs: a unique numeric ID (serial number) for the element operat-
ed on in that activity. In the printed photo, assign this unique ID to the el-
ement in the same order of their addition, deletion, or edition, using bub-
bles. An example data entry operation is shown in Fig2. The element IDs
represent the order of adding the elements in the model.
Fig2. Activity encoding for participant P1
In this case, the designer started reading the problem statement thirty
seconds into the experiment, as indicated by 0:30 in the first column. At
1:21, he started adding elements and added six elements (1 through 6).
This took him up to 1:48 on the clock, at which point he started a pregnant
pause. At 2:10, he started reading the problem statement again. At 2:18,
he stopped reading the problem statement, yet was not doing A, D, or E,
and therefore, the activity starting at 2:18 is recorded as a pregnant pause.
After entering the activity codes 1-6 into the columns, the redrawn image
of the final model is annotated by assigning these IDs to the elements by
bubbles, in the same order of their addition, as seen in Fig3.
Fig3. Assigning IDs to elements for P1
STEP 2: Element Encoding
Needed:
1. Completion of activity encoding
2. The Element Encoding spreadsheet (Fig4)
TmStmp Act
0:30 PS
1:21 A 1 2 3 4 5 6
1:48
2:10 PS
2:18
Element IDs
C. Sen and J.D. Summers 10
3. The redrawn final model, with element numbers
Instructions: For each element, enter the following information as shown
in Fig4.
1. Elem ID: Write the unique numeric ID of the elements from the
photo.
2. Elem Typ: Write the element type code from Table 1.
Fig4. Element encoding for participant P1
STEP 3: Topology Encoding
Needed:
1. Completion of element encoding
2. The video from the experiment
3. The Element Encoding spreadsheet
Instruction: For each element in the spreadsheet, enter the following in-
formation under Topology, as shown in Fig5.
1. Left column: enter the ID for the origin or input element. For
blocks, enter the ID of the already existing flow to whose head the
block is added (zero if no input flow already existed). For edges,
enter the ID of the already existing block from where the edge
originates (zero if the tail is not associated to an already existing
block). For BT and ET, enter the ID of the block or the edge to
which the texts belong.
2. Right column: enter the ID for the destination or output element.
For blocks, enter the ID of the already existing flow to whose tail the
block is added (zero if no output flow existed). For edges, enter the
ID of the already existing block to where the edge terminates (zero if
the head is not associated to an already existing block).
Elem ID Elem Typ
1 B
2 BT
3 E
4 ET
5 E
6 ET
7 E

A Protocol Study of Function Modeling Actions 11
Fig5. Topology encoding for participant P1
In Fig5, block 1 is the first element added to the model and hence has
zeros for both input and output. Block text 2 is added to block 1. Edge 3
has a dangling tail, but terminates on to block 1, which already existed.
Edge text 4 is added to edge 3. Edge 5 originates from existing block 1,
but has a dangling head. Edge text 6 is added to edge 5. Finally, edge 7
has a dangling tail, but terminates on to block 1.
The pre-defined set of model elements, modeling actions, and the steps
of activity-, element-, and topology-encoding constitute the coding
scheme. For illustration, the results from an actual experiment run are
used in Fig2 through Fig5. As noted earlier, the coding scheme is devel-
oped without using specific data points, before conducting the experiment.
Since element encoding captures each element’s type and topology en-
coding captures the connectivity between them, the model can be entirely
reconstructed from the information captured in the Element Encoding
spreadsheet, except that the exact literal strings in the texts (BT, ET, DT),
notes, and symbols cannot be reproduced. Further, since activity encoding
captures the sequence of adding, editing, and deleting those elements, the
clustering of those activities, and the pauses separating those clusters, the
model construction process can also be fully re-enacted in due time from
the information in the spreadsheet. This completeness gives the confi-
dence that all information produced by the designer during the experiment,
except the exact texts, notes, and symbols, are encoded in this coding
scheme. Notably, since the analysis focuses only on how designers con-
struct concept models rather than what those concepts specifically are, this
missing information is not necessary for the analysis. Thus, all infor-
mation necessary for analysis this study are captured in this coding
scheme.
Elem ID Elem Typ
1 B 0 0
2 BT 1
3 E 0 1
4 ET 3
5 E 2 0
6 ET 5
7 E 0 1
Topology

C. Sen and J.D. Summers 12
Sample Raw Data for Illustration
Fig6 shows the final model produced by participant P2 during the experi-
ment. For legibility, the smaller of the two models (eleven functions) is
shown. The model produced by P1 has seventeen functions. Both models
include blocks (B), block texts (BT), edges (E), edge texts (ET), and notes
(N), although P1 made more use of notes than P1. Only P1 used sources
(SC), sinks (SK), diamonds (D), and diamond texts (DT), while P2 left the
edge ends coming from or going to the environment dangling, as seen in
Fig6. The total number of nodes (function, sources, sinks, and diamonds)
in P2’s model was 58.
Post-Experiment Interview
Fig6. Sample final model produced by participant P2 (photo recolored for better
legibility in print)
After each experiment, both participants are interviewed using a question-
naire. It asks about the participants’ familiarity with ironing and folding
configurations of different garments, and also whether they were able to
ideate the design purely in terms of its functions, or if they needed to think
about the form of the device before translating it into a functional descrip-
tion. Both designers expressed that in the first few minutes they had diffi-
culties separating form from function, although later they could think pure-
ly in terms of the device’s required functions and flows. The duration of
the modeling sessions between the participants were comparable (P1 =
20:20, P2 = 23:57 mm:ss).
A Protocol Study of Function Modeling Actions 13
Observation, Analysis, and Implications
Once the video data is encoded using the coding scheme, it is presented in
two views for analysis: activity encoding sheet and activity graph, which
are discussed next. The pattern of modeling actions emerging from the
experimental data indicates that the various parameters of solution explora-
tion, such as modeling rate, number of edits, distribution of add, delete,
and edit operations, and the duration and distribution of pauses between
modeling actions may largely vary between designers. The overall ap-
proach of model expansion also varies between forward chaining and nu-
cleation. However, at a finer resolution of observing modeling actions, de-
signers generally show preference to nucleation or forward chaining of
functions and forward or backward chaining of flows.
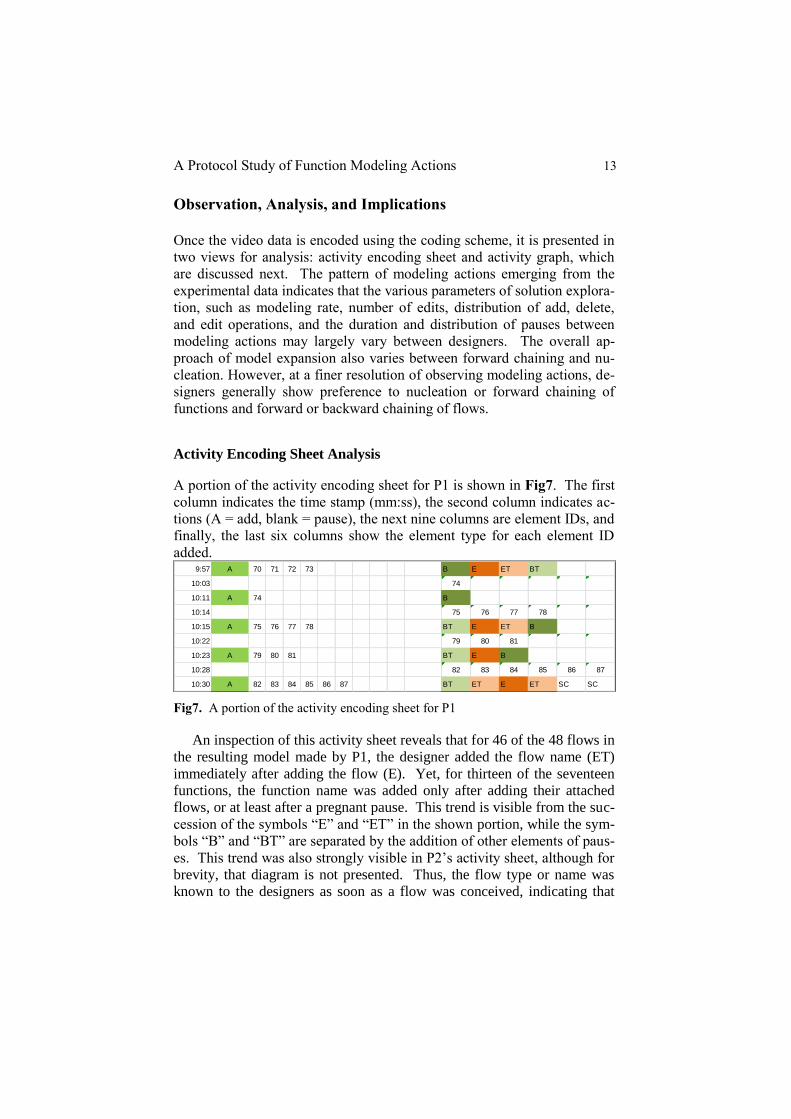
Activity Encoding Sheet Analysis
A portion of the activity encoding sheet for P1 is shown in Fig7. The first
column indicates the time stamp (mm:ss), the second column indicates ac-
tions (A = add, blank = pause), the next nine columns are element IDs, and
finally, the last six columns show the element type for each element ID
added.
Fig7. A portion of the activity encoding sheet for P1
An inspection of this activity sheet reveals that for 46 of the 48 flows in
the resulting model made by P1, the designer added the flow name (ET)
immediately after adding the flow (E). Yet, for thirteen of the seventeen
functions, the function name was added only after adding their attached
flows, or at least after a pregnant pause. This trend is visible from the suc-
cession of the symbols “E” and “ET” in the shown portion, while the sym-
bols “B” and “BT” are separated by the addition of other elements of paus-
es. This trend was also strongly visible in P2’s activity sheet, although for
brevity, that diagram is not presented. Thus, the flow type or name was
known to the designers as soon as a flow was conceived, indicating that
9:57 A 70 71 72 73 B E ET BT
10:03 74
10:11 A 74 B
10:14 75 76 77 78
10:15 A 75 76 77 78 BT E ET B
10:22 79 80 81
10:23 A 79 80 81 BT E B
10:28 82 83 84 85 86 87
10:30 A 82 83 84 85 86 87 BT ET E ET SC SC

C. Sen and J.D. Summers 14
these designers conceived the device in terms of the flows it would pro-
cess, rather than in terms of functions it would perform. The function
names were later retro-fitted to describe the resulting transformative ac-
tions indicated by the flows.
In terms of modeling sequence, P1’s overall approach was nucleation,
as he started the decomposed model with a few sub-functions on each end
of the board, indicating the clearly identified sub-actions involved in iron-
ing, and eventually finished the model by connecting those functions and
others through edges in the middle of the board. P2, however, followed a
generally forward chaining approach. The first function drawn was a sub-
function on the left end of the board and the last function was the final ac-
tion that produced folded pressed clothes.
However, when the modeling actions are observed at a finer time-
resolution, booth designers seem to use nucleation and forward chaining
when adding functions, and forward and backward chaining when adding
flows. For example, P2 added six functions by nucleation, seven functions
by forward chaining on the head of an existing flow, but only one function
by backward chaining, on the tail of a flow. However, for the flows, P2
added sixteen and eleven flows by forward and backward chaining, and
only two through nucleation, which were later appended with functions
through forward chaining. These data are collected by analyzing the to-
pology encoding. For example, in Fig5, edge 3 is added through backward
chaining, as it originates in the environment (zero in left column under to-
pology) and ends on a function (1). Edge 5 is added through forward
chaining, as it originates in block 2 and is not attached at head at creation-
time. Block 1 is added through nucleation, as it has no existing edges at
input or output at creation-time.
From the function structures produced, it was visible that both design-
ers started with defining the overall functionality in a black box function,
as seen in the top-left corner of Fig6. However, P1 finished drawing all
the flows attached to the black box, including the energy and water input
required for ironing and the emissions (Fig3), before starting the decom-
posed model. By contrast, P2 repeatedly returned to add the two H2O
flows to the black box (Fig6) after starting to decompose the model. This
could indicate that P2 was using the model to actually explore a solution
more than P1, who committed an idea to the drawing only after developing
it mentally. However, in the entire observed period, P1 read the problem
statement only during black box construction and decomposed the model
by referring back to the black box. By contrast, P2 repeatedly referred to
both the problem statement and the black box while constructing the de-
composed model. This indicates that P1 was more successful in translat-
ing the problem from natural language to the functional language before

A Protocol Study of Function Modeling Actions 15
beginnings to explore solutions for it. However, since the quality of the
model or the solution is not observed in this experiment, no conclusions
should be drawn to whether such translation is conducive for better design.
For the design of a future function-modeling tool, this observation shows
that the software should allow saving and viewing other models such as
the black box during constructing or decomposing a model.
Activity Graph Analysis
One other view of the data is the activity graph, which tracks the rate of
modeling activities against time. Fig8 and Fig9 show the activity graphs
for P1 and P2. The horizontal axis denotes time in hh:mm:ss format, while
the vertical axis denotes the count of model elements added, deleted, and
edited. The black bars above the axis are addition, the ones below the axis
are deletion, and the grey bars above the axis denote edition of model ele-
ments. These graphs are used to make the following observations.
Fig8. Activity graph for participant P1
P1 used function lists in form of notes (N) extensively at the beginning
of decomposition (observed in the activity encoding sheet), immediately
after developing the black-box model. During making these notes, P1 iter-
ated thrice before settling with a decomposition approach, indicated by the
frequent adding and deleting actions between the third and the sixth
minutes on P1’s activity graph (Fig8). However, once he settled with an
approach, his activity graph does not show any deletion until the later part
of the process, which again indicates that this designer develops an idea
mentally or using the list view, before including it to the model. For the
software design, this may indicate that function listing can be useful for
high-level architecture design, while for detailing each atomic action, a
graph-based model is more suitable.
By contrast, P2 edited the elements more uniformly through the design
session and frequently deleted large number of elements together, even on-
ly three minutes prior to finishing the design. The video, as well as the ac-
-10
-5
0
5
0:0
0:0
00:0
0:4
90:0
1:3
80:0
2:2
70:0
3:1
60:0
4:0
50:0
4:5
40:0
5:4
30:0
6:3
20:0
7:2
10:0
8:1
00:0
8:5
90:0
9:4
80:1
0:3
70:1
1:2
60:1
2:1
50:1
3:0
40:1
3:5
30:1
4:4
20:1
5:3
10:1
6:2
00:1
7:0
90:1
7:5
80:1
8:4
70:1
9:3
6
Add…
C. Sen and J.D. Summers 16
tivity encoding sheet reveals that many of P2’s edits were for renaming
functions or rerouting flows to and from the functions. For example, the
function “Add H2O to garment” was assigned four names, at steps no. 52,
61, 68, and 74, while four flows—wrinkled garment, H2O(L), ThE, and
ME—were rerouted multiple times through the model. This indicates that
the concept exploration approach may vary between designers largely and
for some designers the software should allow simultaneous viewing and
comparison of multiple model options.
The difference between the two designers’ thinking patterns also ap-
pears through a few other observations. First, with one exception, P1 be-
gins to edit the model only after significantly developing it up to the tenth
minute. From then until the end of modeling, edits were frequent, and of-
ten lumped between the pauses. This indicates that P1 prefers to first mod-
el raw ideas without concern for their compatibility, and considers that on-
ly later. By contrast, P2 edited the model more uniformly in time.
Fourteen out of the 22 edit operations by P2 are done on elements immedi-
ately after adding them, separated only by a pause. This indicates that P2
considered model options as they were being included and revised. Also,
the pauses, indicated by the blank spaces between the bars in Fig8 and
Fig9, are more uniformly distributed between the actions in the case of P1,
while P2 has displayed repeated long pauses.
Additionally, there is a significant difference between the modeling
rates of the designers. During black-box modeling and the beginning of
decomposition, P1’s modeling rate was marked by large lumps of addition
(up to six elements at a time without pause), large lumps of deletion (up to
nine elements without pause), and long pregnant pauses between them (up
to 27 seconds). These lumps and pauses became significantly smaller after
P1 identified the list of sub-functions. Thus, for this designer, the listing
indicates the point of commitment to design architecture. However, for
P2, the heights of the bar-clusters that indicate the number of elements
added together without pausing were shorter in the beginning and gradual-
ly increased. In fact, the tallest clusters for P1 are the first two, which
were drawn during drawing the black box model, while for P2, the tallest
clusters are close to the end of the design, in the eighteenth minute. This
once again indicates that P2 used the model to explore and develop the
ideas in the initial minutes and sped up when those ideas came together
toward the end. P1, by contrast, first developed an idea and its possible
decomposition mentally and using the lists, and then committed them to
the model.

A Protocol Study of Function Modeling Actions 17
Fig9. Activity graph for participant P2
Finally, the maximum number of items added at a time (between preg-
nant pauses) is six for both designers. This indicates that the number of el-
ements these designers could comfortably perceive is six and this may
have a relation with the typical human cognitive chunk count of seven es-
tablished in psychology research [31]. However, delete operations are
done on chunk sizes of up to nine elements at a time. Between the two de-
signers, P1 used more large chunks than P2. For example, P1 created five
chunks of six elements, four chunks of five elements, and twelve chunks of
four elements each, while P2 created one chunk of six elements and two
chunks of four elements each. This observation may indicate a trend that
more experienced designers can, perhaps, process larger cognitive chunks
than novice designers (P1 has more design experience than P2), as dis-
cussed in previous research [3]. However, since only one participant of
each experience level was used in this study, this could be a random per-
sonal trait that is not generalizable, yet suggests new avenues of investiga-
tion.
Discussion and Path Forward
This paper reports an initial experiment that is a first step to study how de-
signers construct and reason with function structure graphs when develop-
ing and exploring functional architectures for novel design problems.
However, since only two participants are used in this pilot version, some
observations cannot be generalized. A collaborative research effort is al-
ready underway between multiple design research labs to repeat this exper-
iment with more participants, thus giving the required replication of data.
Nevertheless, this pilot experiment produced some interesting observa-
tions and hypotheses. First, the study shows that modeling strategies may
widely vary between designers and identifies the experiment parameters,
such as modeling rate, duration and distribution of actions such as addi-
-10
-5
0
50:0
0:0
00:0
0:4
90:0
1:3
80:0
2:2
70:0
3:1
60:0
4:0
50:0
4:5
40:0
5:4
30:0
6:3
20:0
7:2
10:0
8:1
00:0
8:5
90:0
9:4
80:1
0:3
70:1
1:2
60:1
2:1
50:1
3:0
40:1
3:5
30:1
4:4
20:1
5:3
10:1
6:2
00:1
7:0
90:1
7:5
80:1
8:4
70:1
9:3
6
Add…
C. Sen and J.D. Summers 18
tion, deletion, and edition of model elements can be used in the future
studies to monitor them. It also produced a finite list of model elements
and modeling actions to be used in the future version of this experiment.
Further, the experiment shows that flows are more concrete concepts in
function modeling and functions are more abstract. Designers identify
flow names and types as soon as they add a flow, but function names are
often identified much later than their addition, typically constructing all the
flows attached to the block. This observation agrees with previous theoret-
ical research that demonstrated that in function structure graphs, the topol-
ogy (flow connectivity) of the model carries much more information than
the functions [32] and may guide the development of the user interface
features of future CAD tools fir function-based early design.
The experiment also demonstrates a means to monitor model expansion
sequences, such as nucleation, forward chaining, and backward chaining.
It shows that the one second resolution of time is adequately fine to cap-
ture these trends, which is a learning to be applied to the future experi-
ments. The experiment also shows that while the overall modeling se-
quence varies between designers, at a finer resolution of observation,
designers prefer to use only nucleation and forward chaining for functions
and only forward and backward chaining for flows. In terms of a future
software design for function-based automated reasoning, this observation
may guide the internal data structure of formal function representations
and also modeling options available through the graphic user interfaces.
Finally, this experiment shows evidences of the behavioral differences
between designers, in terms of modeling rate, decomposition strategies,
and the use of notes and plans. It has also shown evidences that the mod-
eling actions may be related to the cognitive chunk sizes of designers that
may vary with designer experience. While these trends could not be veri-
fied due to small replication size, these trends can be used as hypotheses
for extensions of this experiment in the future. As indicated earlier, more
detailed version of this experiment are already underway in a larger col-
laborative effort, the results of which will be published in due time.
References
1. Pahl, G., et al., Engineering Design: A Systematic Approach. 3rd. ed, ed. K.
Wallace and L. Blessing. 2007, London: Springer-Verlag London Lim-
ited.
2. Otto, K.N. and K.L. Wood, Product Design Techniques in Reverse Engineer-
ing and New Product Development. 2001, Upper Saddle River, NJ: Pren-
tice Hall.

A Protocol Study of Function Modeling Actions 19
3. Ullman, D.G., The Mechanical Design Process. 1992, New York: McGraw-
Hill.
4. Sridharan, P. and M.I. Campbell, A study on the grammatical construction of
function structures. Artificial Intelligence for Engineering Design, Anal-
ysis & Manufacturing, 2005. 19(3): p. 139-160.
5. Kurtoglu, T., A. Swantner, and M.I. Campbell, Automating the conceptual de-
sign process: From black box to component selection. Artificial Intelli-
gence for Engineering Design, Analysis & Manufacturing, 2010. 24(1):
p. 49-62.
6. Vucovich, J., et al., Concept Generation Algorithms for Repository-Based
Early Design, in ASME 2006 International Design Engineering Tech-
nical Conferences and Computers and Information in Engineering Con-
ference. 2006: Philadelphia, PA, USA.
7. Bohm, M.R., R.B. Stone, and S. Szykman, Enhancing virtual product repre-
sentations for advanced design repository systems. Journal of Computing
and Information Science in Engineering, 2005. 5(4): p. 360-72.
8. Gero, J.S. and U. Kannengiesser, The situated function-behaviour-structure
framework, in Artificial Intelligence in Design, J.S. Gero, Editor. 2002,
Kluwer Academic Publishers: Norwell, MA, USA. p. 89-104.
9. Goel, A.K. and S.R. Bhatta, Use of design patterns in analogy-based design.
Advanced Engineering Informatics, 2004. 18: p. 85-94.
10. Chandrasekaran, B. and J.R. Josephson, Function in Device Representation.
Engineering with Computers, 2000. 16(3-4): p. 162-177.
11. Umeda, Y., et al., Supporting Conceptual Design Based on the Function-
Behavior-State Modeler. Artificial Intelligence for Engineering Design,
Analysis & Manufacturing, 1996. 10(4): p. 275-288.
12. Vescovi, M., et al., CFRL: A Language for Specifying the Causal Functionali-
ty of Engineered Devices, in Eleventh National Conference on Artificial
Intelligence. 1993, American Association for Artificial Intelligence:
Washington, D.C.
13. McAdams, D.A. and K. Wood, A Quantitative Similarity Metric for Design-
by-Analogy. Journal of mechanical design, 2002. 124(2): p. 173-182.
14. Tumer, I.Y. and R.B. Stone, Analytical Methods to Evaluate Failure Potential
during High-Risk Component Development, in 2001 ASME Design Engi-
neering Technical Conferences. 2001: Pittsburgh, PA, USA.
15. Arunajadai, S.G., et al., Failure Mode Identification through Clustering Anal-
ysis. Quality and Reliability Engineering International, 2004. 20: p. 511-
526.
16. Kurtoglu, T. and I.Y. Tumer, A Graph-Based Fault Identification and Propa-
gation Framework for Functional Design of Complex Systems. ASME
Journal of Mechanical Design, 2008. 130: p. 051401-1 - 051401-8.
17. Sen, C., J.D. Summers, and G.M. Mocko, A Protocol to Formalize Function
Verbs to Support Conservation-Based Model Check Reasoning. Journal
of Engineering Design (In Press), 2011.
18. Gero, J.S., Design prototypes: a knowledge representation schema for design.
AI Magazine, 1990. 11(4): p. 26-36.

C. Sen and J.D. Summers 20
19. Bobrow, D.G., Qualitative reasoning about physical systems: an introduction.
Artificial Intelligence, 1984. 24(1-3): p. 1-5.
20. Umeda, Y., et al., Function, Behavior, and Structure, in Applications of Arti-
ficial Intelligence V, Vol 1: Design, J.S. Gero, Editor. 1990, Springer
Verlag, : Boston, MA. p. 177-193.
21. Bhatta, S.R. and A.K. Goel, A Functional Theory of Design Patterns, in 15th
International Joint Conference on Artificial Intelligence - Volume 1.
1997, Morgan Kaufmann Publishers Inc.: Nagoya, Japan.
22. Bhatta, S., A. Goel, and S. Prabhakar, Innovation in Analogical Design: A
Model-Based Approach, in Artificial Intelligence in Design. 1994,
Kluwer Academic Publishers: Dordrecht, The Netherlands.
23. Goel, A., S. Bhatta, and E. Stroulia, Kritik: An Early Case-Based Design Sys-
tem, in Issues and Applications of Case-Based Reasoning in Design,
M.L. Maher and P. Pu, Editors. 1997, Erlbaum: Mahwah, NJ. p. 87-132.
24. Chandrasekaran, B., Representing function: relating functional representation
and functional modeling research streams. Artificial Intelligence for En-
gineering Design, Analysis and Manufacturing, 2005. 19(2): p. 65-74.
25. Arunajadai, S.G., R.B. Stone, and I.Y. Tumer, A Framework for Creating a
Function-Based Design Tool for Failure Mode Identification, in ASME
2002 Design Engineering Technical Conferences and Computers and In-
formation in Engineering Conference. 2002: Montreal, Canada.
26. Bohm, M.R. and R.B. Stone, Representing Functionality to Support Reuse:
Conceptual and Supporting Functions, in ASME 2004 Design Engineer-
ing Technical Conferences and Computers and Information in Engineer-
ing Conference. 2004, American Society of Mechanical Engineers, New
York, NY 10016-5990, United States: Salt Lake City, UT, USA. p. 411-
419.
27. Collins, J.A., H.R. busby, and G.H. Staab, Mechanical Design of Machine El-
ements and Machines. Second ed. 2010, Hoboken, NJ: John Wiley &
Sons.
28. Szykman, S., J.W. Racz, and R.D. Sriram, The Representation of Function in
Computer-Based Design, in 1999 ASME Design Engineering Technical
Conferences. 1999: Las Vegas, NV, USA.
29. Kirschman, C.F. and G.M. Fadel, Classifying Functions for Mechanical De-
sign. Journal of mechanical design, 1998. 120(3): p. 475-482.
30. Hirtz, J., et al., A Functional Basis for Engineering Design: Reconciling and
Evolving Previous Efforts. Research in engineering design, 2002. 13(2):
p. 65-82.
31. Miller, G.A., The Magical Number Seven, Plus or Minus Two: Some Limits
on Our Capacity for Processing Information. The Psychological Review,
1956. 63: p. 81-97.
32. Sen, C., J.D. Summers, and G.M. Mocko, Topological Information Content
and Expressiveness of Function Models in Mechanical Design. Journal of
Computing and Information Science in Engineering, 2010. 10(3): p.
031003-1 – 031003-11.