a piconewton force transducer and its application to
TRANSCRIPT

Annals of Biomedical Engineering, Vol. 24, pp. 595-605, 1996 0090-6964/96 $10.50 + .00 Printed in the USA. All rights reserved. Copyright �9 1996 Biomedical Engineering Society
A Piconewton Force Transducer and Its Application to Measurement o f the Bending Stiffness of Phospholipid Membranes
VOLKMAR HEINRICH a n d RICHARD E . W A U G H
Department of Biophysics, University of Rochester School of Medicine and Dentistry, Rochester, NY
Abstract--The bending stiffness of a phospholipid bilayer (k~) was measured by forming thin bilayer cylinders (tethers) from giant phospholipid vesicles. Based on the balance of forces, the tether force was expected to be proportional to the square root of the membrane tension, with a constant of proportionality con- taining k c. The membrane tension was controlled via the aspira- tion pressure in a micropipette used to hold the vesicle. The force on the tether was generated by an electromagnet acting on a paramagnetic bead attached to the vesicle surface. The magni- tude of the force was determined from measurements of the magnet current, which was adjusted to maintain the position of the bead. Measurements were performed on vesicles composed of stearoyl-oleoyl-phosphatidylcholine plus 5% (by mole) bioti- nylated phosphatidylethanolaminc to mediate adhesion to streptavidin-coated beads. From each vesicle, tethers were formed repeatedly at different values of the membrane tension. The expected relationship between membrane tension and tether force was observed. The mean value of k~ for 10 different ves- icles was 1.17 x 10 1 9 j ( S D = 0.0g X 1 0 - 1 9 J). The preci- sion of these data demonstrates the reliability of this approach, which avoids uncertainties of interpretation and measurement that may be associated with other methods for determining k~.
Keywords--Magnetic particles, Bilayer membrane, Mechanics, Micromanipulation, Curvature elasticity
INTRODUCTION
To a large extent progress in the biomechanics of cells and subcellular structures such as biomembranes has been confined by the small number of experimental approaches that are available. The method that has accounted for our most detailed knowledge of mechanical properties of cells
Acknowledgment--The authors thank Richard G. Bauserman and James Butler for technical assistance, Dr. C. Jeffrey Wang of Sphero- tech, Inc., for his generosity with bead samples and technical advice, and Philippe M616ard for patiently supplying us with hints for the setup of the vesicle electroformation method. This work was supported in part by a postdoctoral fellowship of the Deutsche Forschungsgemeinschaft, and by the U.S. Public Health Service under NIH grants HL 18208 and HL 31524.
Address correspondence to Dr. Richard E. Waugh, Department of Biophysics, University of Rochester School of Medicine and Dentistry, 601 Elmwood Ave., Rochester, NY 14642.
(Received 22Dec95, Accepted 31Jan96)
and membranes is micropipette aspiration. In recent years, the need for alternative approaches to cellular microme- chanics has been mainly met by the "opt ica l tweezers" technique employing laser-generated optical traps (2). This technique has provided the possibi l i ty of imposing forces in the range of piconewtons, a task that arises in numerous physical and biological applications. Yet op- tions for applying well-known and well-control led small forces are rather limited (e.g., Ref. 9). In this paper we present an adaptation of a magnetic force transducer de- veloped by Guilford and Gore (14) to apply and measure small forces in a range down to piconewtons. For many experimental purposes, this force transducer provides a low-cost and flexible alternative to optical tweezers.
The main application of magnetic particles in biological research has been their use in magnetic separators. Guil- ford and coworkers (15) have introduced a technique in which single magnetic beads were attached to leukocytes, and forces generated during cell locomotion were mea- sured. Combining this original work with micromanipu- lation techniques has provided the basis for the develop- ment of our force transducer. Any objects like soft micro- particles, biological cells, or even small tissue samples are potentially suitable subjects of study with the apparatus.
A general overview of the experimental setup is the following. The object of investigation is held in a micropi- pette or otherwise fixed to a micromanipulator on the stage of a microscope. Using antibodies or other adhesive mol- ecules, a paramagnetic bead of spherical shape is attached to it. An electromagnet designed to fit on the microscope stage is posit ioned with its tip close to the optical path, i.e., the point of observation. In connection with an ap- propriate force calibration, well-defined forces can be ap- plied to the magnetic bead. The deformation of the spec- imen at known force is observed microscopical ly and provides the information needed to characterize the me- chanical properties of the material.
In the present paper, the operation of the force trans- ducer is demonstrated with giant phospholipid vesicles. These are artificial, closed bi layer membranes of given lipid composit ion that form spontaneously in aqueous so-
595

596 V. HEINRIC/-I and R. E. WAU6H
lution (1,19,23). They are a preferred model system for establishing the mechanical characteristics of lipid mem- branes (7). The bending stiffness (k c) of phospholipid bi- layers has raised the particular interest of many research groups (8,13,22,24,26). Its extremely small value is on the order of the thermal energy kbT, and therefore, it is difficult to measure. In fact, different experimental tech- niques have produced a rather broad range of k c values (cf, e.g., Ref. 18). Although our first data are primarily meant to demonstrate the application of the magnetic bead appa- ratus rather than to answer open questions, the consistency of the measured results indicates that the new method provides for an exceptionally accurate determination of k c, and so it should provide additional stimulation to the on- going discussion.
When the bead is pulled away from a vesicle held in a pipette it is typical that the vesicle forms a membrane tether (3). The tether is a thin cylindrical membrane tube that connects the remaining spherical vesicle body with the bead. The main deformation during tether formation bends the initially more or less flat membrane into a very narrow tube, and so tether formation is a good candidate for direct measurement of the membrane bending stiff- ness. A variety of tether experiments have been carried out and have provided new information about phospholipid bilayers. The earliest measurements based on tether lor- mation provided estimates of k c and demonstrated its de- pendence on the cholesterol content in I-stearoyl-2-ole- oyl-sn-phosphatidylcholine (SOPC) membranes (3,28). Subsequently, tether formation was used to make the first (and until now only) measurements of the nonlocal bend- ing modulus, which accounts for the relative stretching of the two monolayers with respect to each other (4,6,31). More recently, tether formation was used to obtain the friction coefficient for movements of the monolayers rel- ative to each other (11,12). With the exception of the work by Evans and Yeung (11), measurement uncertainties in the experimental data have resulted in an undesirably large scatter in the calculated membrane material constants. Re- finements in measurement protocols that allow for both variation in applied tethering force and precise measure- ment of the force represent important advantages of the present method. This has enabled us to determine the force necessary to maintain a tether at a given length as a func- tion of the aspiration pressure applied in the pipette. As will be shown below, this particular measurement pro- vides a very robust method of determining the bending stiffness of lipid bilayers.
MAGNETIC FORCE TRANSDUCER
Figure 1 presents a schematic overview of the basic components of the experimental apparatus. A typical ex-
perimental video micrograph is reproduced in Fig. 2. Its essential components are sketched in Fig. 3, where nota- tions used throughout this paper are also given. Figures 2 and 3 show a phospholipid vesicle that is partially aspi- rated into a glass micropipette. The pipette was mounted on a micromanipulator and could be moved relative to the chamber. A paramagnetic bead was attached to the vesi- cle. An electromagnet controlled the force that the bead exerted on the vesicle. The vesicle deformation caused by pulling the bead toward the magnet was observed in a light microscope and recorded on videotape.
Since the magnetic field strength depends on the dis- tance from the magnet, all measurements were performed at a fixed distance between the bead and the magnet tip. To keep this distance constant, a computer-controlled feedback system was designed. Video frames were digi- tized and analyzed at high speed to detect the bead posi- tion at any given moment. The current through the magnet was adjusted via a programmable power supply to keep the bead stationary at the desired position. A time average of the current was monitored and saved to disk upon a keystroke. As a backup, a small voltage proportional to the output current of the power supply was encoded into a video signal that was displayed and recorded together with the original image of the experiment.
The feedback system required a fast and reliable way to locate the bead in a video image. The bead-finding algo- rithm searched for the bead within a small box, the di- mensions and initial position of which were set in the beginning of every experiment. Appropriate box dimen- sions were three to five bead diameters horizontally, i.e., in the direction of the magnet core, and one and a half bead diameters vertically. During the experiment, the box position was constantly updated by placing its center au- tomatically in the most recently measured bead position. Then the next bead-searching cycle was carried out within the relocated box. Only the image framed by this box was read from the digitized video frame. The image was trans- formed into a binary image with a gray value threshold that was set to separate the bead from the background. The bead position was determined as the center of all bead pixels.
After the actual experiment an independent force cali- bration was carried out that gave the force acting on the bead as a function of the current through the magnet. It was based on Stokes' law, using the velocity at which the free bead moved in the magnetic field. The velocity was measured at the same position at which the bead had been kept stationary in the experiment.
Both experiment and calibration were done in the same aqueous solution at a sufficient height (at least 20 bead diameters) above the chamber bottom to minimize wall effects. There were no magnetic beads in the measurement chamber other than the one attached to the vesicle. The

Piconewton Forces and Membrane Bending Stiffness 597
FIGURE 1. Schematic overview of the experimental apparatus. A paramagnetic bead is attached to the surface of a phospholipid vesicle, the membrane tension of which is controlled via the aspiration pressure applied in a micropipette (cf. Fig. 3). The tethering force exerted by the bead is generated by an electromagnet mounted on the stage of a microscope. A fast computer algorithm identifies the bead in digitized video images (cf. Fig. 2) and adjusts the magnet current to maintain the bead position fixed. For more details see the text.
bead density was small enough that even at the lowest magnetic fields applied, the attached bead did not move out of the focal plane because of gravity. The current was not allowed to exceed a certain upper limit, which pre- vented the water-cooled magnet from heating.
Different magnets and experimental chambers have been designed and built in our laboratory for use in a variety of applications. Within a given experimental setup, the pulling force was varied over a wide range by changing the current through the magnet. Moreover, for different purposes this range can easily be broadened by varying the beads' magnetic properties or simply changing the distance between the magnet tip and the measurement position. Of course, such changes require a new force calibration.
EXPERIMENTAL PROCEDURE
All observations were made with a Nikon Diaphot in- verted light microscope. The experimental setup required an easily accessible microscope stage and long working distance optics. Pipette-aspirated vesicles are best ob- served using Hoffman modulation contrast. For a high success rate of the bead-finding algorithm, an even back- ground in the video image was essential. Background sub- traction and contrast enhancement were performed using an Argus image processor (Hamamatsu, Bridgewater, N J, USA) in combination with a sensitive Hamamatsu CCD camera to obtain images with low background and high clarity (Fig. 2). These images were digitized (EZ Vision frame board; Data Translation, Peabody, MA, USA) and

598 V. HEINRICH and R. E. WAUGH
FIGURE 2. Video micrograph of a typical experiment. Large-sized vesicles as well as background subtraction and contrast en- hancement provided the high-quality images needed for the bead-finding algorithm. The bead (lower left) and the projection of the vesicle membrane into the pipette (lower right) are indicated by vertical arrows. The membrane tether connecting bead and vesicle (location indicated by the diagonal arrow) is too small to be resolved by light microscopy. In addition to the vesicle pipette, a reference pipette holding a small particle (indicated by the uppermost vertical arrow) was used to monitor and correct for small drifts in zero pressure. Bar = 50.0 i~m.
analyzed by a computer program that also controlled the power supply for the magnet (Hewlett Packard, model 6655A) via an HPIB interface.
Phospholipid vesicles were made from a lipid mixture of SOPC (Avanti Polar Lipids, Birmingham, AL, USA) with 5% biotin-X-DHPE (N-((6-(biotinoyl)amino)hex- anoyl)- 1,2-dihexacanoyl-sn-glycero-3-phosphoethanol- amine; Molecular Probes, Eugene, OR, USA), which had been dissolved in chloroform/methanol (2:1) at a concen- tration of 0.25 mg/ml. Vesicles were prepared using a modified version of the electroformation method of An- gelova et al. (1). The lipid (~40 ixl) was laid down on a pair of cylindrical electrodes (thick platinum wire) and vacuum dried for 2 hours. The electrodes were placed in a chamber that was then cautiously filled with 80 mM su- crose solution. An alternating electric field of --1 kV/m was applied, starting at a frequency of 10 HZ. Vesicle growth could be observed directly under the microscope. After 1 hour, the frequency was reduced in several steps to
1 HZ. At the same time, the amplitude usually needed to be decreased stepwise to a final value of --0.2 kV/m to maintain smooth movements of the vesicles. When a sat- isfactory number of vesicles had formed, the chamber was gently flushed and the vesicles were harvested into a stor- age container. The vesicles prepared in this way were usually large, with diameters up to 150 l, zm, and the ma- jority of them appeared to be unilamellar.
In an experiment, the vesicle suspension was diluted -1 :1 in 85 mM glucose solution containing 1.15 mOsm phosphate-buffered saline and 0.3% bovine serum albu- min. Paramagnet ic beads coated with s treptavidin (Spherotech, Libertyville, IL, USA) were washed and sus- pended in the same 85 mM glucose solution in a separate chamber. A single vesicle was aspirated into a glass mi- cropipette and then transferred to the bead chamber. Transfers were carried out inside a separate pipette that had a U-shaped tip and a diameter big enough to accom- modate the vesicle held in the vesicle pipette. The transfer
Piconewton Forces and Membrane Bending Stiffness 599
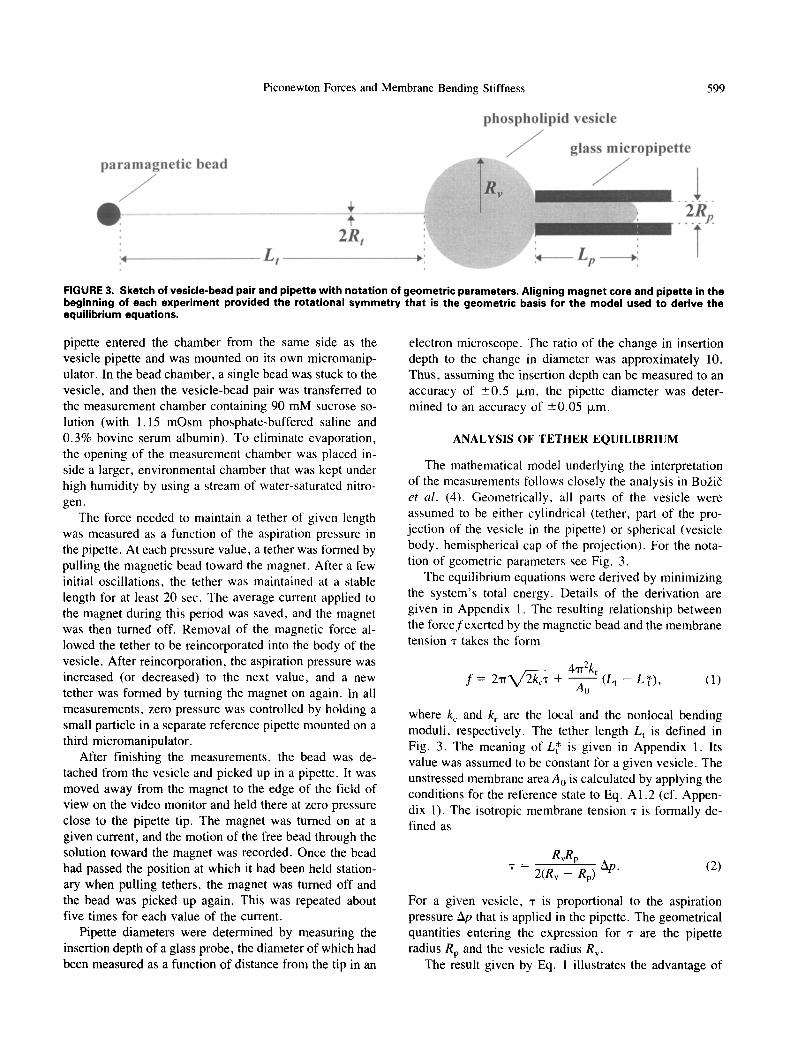
FIGURE 3. Sketch of vesicle-bead pair and pipette with notation of geometric parameters. Aligning magnet core and pipette in the beginning of each experiment provided the rotational symmetry that is the geometric basis for the model used to derive the equilibrium equations,
pipette entered the chamber from the same side as the vesicle pipette and was mounted on its own micromanip- ulator. In the bead chamber, a single bead was stuck to the vesicle, and then the vesicle-bead pair was transferred to the measurement chamber containing 90 mM sucrose so- lution (with 1.15 mOsm phosphate-buffered saline and 0.3% bovine serum albumin). To eliminate evaporation, the opening of the measurement chamber was placed in- side a larger, environmental chamber that was kept under high humidity by using a stream of water-saturated nitro- gen.
The force needed to maintain a tether of given length was measured as a function of the aspiration pressure in the pipette. At each pressure value, a tether was lormed by pulling the magnetic bead toward the magnet. After a few initial oscillations, the tether was maintained at a stable length for at least 20 sec. The average current applied to the magnet during this period was saved, and the magnet was then turned off. Removal of the magnetic force al- lowed the tether to be reincorporated into the body of the vesicle. After reincorporation, the aspiration pressure was increased (or decreased) to the next value, and a new tether was formed by turning the magnet on again. In all measurements, zero pressure was controlled by holding a small particle in a separate reference pipette mounted on a third micromanipulator.
After finishing the measurements, the bead was de- tached from the vesicle and picked up in a pipette. It was moved away from the magnet to the edge of the field of view on the video monitor and held there at zero pressure close to the pipette tip. The magnet was turned on at a given current, and the motion of the free bead through the solution toward the magnet was recorded. Once the bead had passed the position at which it had been held station- ary when pulling tethers, the magnet was turned off and the bead was picked up again. This was repeated about five times for each value of the current.
Pipette diameters were determined by measuring the insertion depth of a glass probe, the diameter of which had been measured as a function of distance from the tip in an
electron microscope. The ratio of the change in insertion depth to the change in diameter was approximately 10. Thus, assuming the insertion depth can be measured to an accuracy of • txm, the pipette diameter was deter- mined to an accuracy of • txm.
ANALYSIS OF TETHER EQUILIBRIUM
The mathematical model underlying the interpretation of the measurements follows closely the analysis in Bo2i6 et al. (4). Geometrically, all parts of the vesicle were assumed to be either cylindrical (tether, part of the pro- jection of the vesicle in the pipette) or spherical (vesicle body, hemispherical cap of the projection). For the nota- tion of geometric parameters see Fig. 3.
The equilibrium equations were derived by minimizing the system's total energy. Details of the derivation are given in Appendix I. The resulting relationship between the forcefexerted by the magnetic bead and the membrane tension "r takes the form
4,rr2kr f = 2 ~ ' V ' ~ x + - ~ o ( L , - L*), (1)
where k c and k r are the local and the nonlocal bending moduli, respectively. The tether length L t is defined in Fig. 3. The meaning of L* is given in Appendix 1. Its value was assumed to be constant for a given vesicle. The unstressed membrane area A o is calculated by applying the conditions for the reference state to Eq. A1.2 (cf. Appen- dix 1). The isotropic membrane tension "r is formally de- fined as
Rvgp 'r - 2(R~ - gp) Ap. (2)
For a given vesicle, "r is proportional to the aspiration pressure Ap that is applied in the pipette. The geometrical quantities entering the expression for "r are the pipette radius Rp and the vesicle radius R v.
The result given by Eq. 1 illustrates the advantage of

600 V. HEINRICH and R. E. WAUGH
the measurement o f f as a function of �9 (i.e., of Ap) for the determination of the bending stiffness k c. First of all, the area expansivity modulus K (cf. Appendix 1) does not enter Eq. 1 at all, i .e., this measurement is independent of the membrane expansivity. Furthermore, the slope of a linear fit to the representation of f as a function of the square root of "r contains exclusive information about k c. This information does not involve Lt, which means that the measurement is also independent of the tether length. As long as the vesicle geometry in the experiment is con- sistent with the model's geometry, Eq. 1 may be used to interpret the data. This also avoids the experimental in- conveniences that occur in the formation of very long tethers�9 Such long tethers are needed to measure resolv- able changes in the projection length Lp (see Fig. 3), which is the basis for an alternative method for calculating k c (31), or to establish the contribution of nonlocal bend- ing effects to the membrane properties. From the present measurement the nonlocal bending modulus k r is not ac- cessible, because the intercept of the fitted straight line also contains, besides 4 , the unknown quantity L*. The determination of kr requires measurements at significantly different tether lengths and (for technical reasons) is be- yond the scope of this work.
v
Figures 4 to 6 illustrate the main steps in obtaining the bending stiffness from the measurements. Original data of a typical experiment are shown in Fig. 4. In the depicted series, a tether was pulled from the same vesicle about 45 times, first at increasing and then at decreasing aspiration
500 -
400-
~ 300"
200-
100-
~, 6 8 1'0 1'2 1/2 X ( [l~N/m] 1/2)
0 ~ 0 @
0 @ 0 @
/ o~O00(Bo~O@O@O@
6 1 '0 2'0 3'0 4'0 5'0 6'0
Ap (Pa l
FIGURE 4. Example measurement of the magnet current I necessary to maintain a fixed bead position v e r s u s aspiration pressure ~o applied in the pipette. A new tether was formed for each data point, and it was reincorporated into the vesicle body after saving the current. For this case, the vesicle radius was 18.8 ixm and the pipette radius was 4.2 Ixm. Each value of the current is the average current of - 2 0 sec, during which the tether length was stable. Measurements of the current were done successively at increasing (�9 and then decreasing (+ l pressure steps to check for reversibility.
100
500 -
400 -
300 -
200 -
6 160 260 360 Vbead (~m/s)
460
FIGURE 5. Force calibration curve for the bead that was used in the measurements of Fig. 4. The motion of the free bead in the magnetic field had been monitored for different field strengths, and the bead velocity Vbe.d was plotted on the x axis of this graph with the magnet current I on the y axis. In this representation, the data points could be very well mod- eled by a third-order polynomial: I = 1.062 x 10 -s v 3 - 0.0031 v z + 0.9832v + 9.0255 (solid curve).
pressures. Naturally, while the automated feedback sys- tem maintained a tether at final length, the computer- controlled current through the magnet exhibited small fluctuations as a response to small movements of the bead. Bead displacements from the measurement position were usually no more than 2 pixels on the video monitor in either direction. However, the small current fluctuations made it necessary to take the time average of the current.
z Q.
S
40-
35-
30-
25-
20-
15-
10-
5-
0 0
RESULTS
1'4
FIGURE 6. Linear dependence of the tethering force f on the square root of the membrane tension r Data points corre- spond to those in Fig. 4. The tension ~ was obtained from the aspiration pressure ~Lp using Eq. 2. The values of the current I (Fig. 4) were first converted into bead velocities using the calibration curve (Fig. 5), and the force f was then calculated from the velocity by Stokes" law (Eq. 3l. Separate linear re- gressions were done for the f = f(C/2) data obtained at in- creasing and decreasing pressures. The resulting straight lines had slopes of 2.929 and 2.927, respectively. The slope of these straight lines contains the square root of the bending stiffness kc (cf. Eq. 1).

Piconewton Forces and Membrane Bending Stiffness 601
For this, bead position and current during the most recent 40 sec were displayed graphically on the computer screen. When both had been stable for 20 sec, the average current was calculated for this time interval and saved to disk. It is this average current that is shown in Fig. 4 as a function of the aspiration pressure. The measurements of this series took about 25 min. It can be seen from Fig. 4 that the data of the later measurements at decreasing pressure steps fol- low the same curve as the earlier ones obtained at increas- ing aspiration pressures. Thus, no observable long-term effects or hysteresis occurred during the experiment.
Figure 5 shows the force calibration curve for the bead that was used to obtain the data in Fig. 4. The bead ve- locity Vbead was determined by measuring frame by frame the position of the free bead moving in the magnetic field. Since the magnetic force increases slightly when the bead moves toward the magnet, the distance-time relation for the bead movement is not strictly linear. It could be well modeled, however, as homogeneously accelerated motion and fit by a second-order polynomial. The velocity was obtained as the derivative of this polynomial with respect to time, taken at the measurement position. At each cur- rent, between four and eight measurements of the velocity were carried out. The resulting average speed was plotted on the x axis of Fig. 5, with the current on the y axis. A third-order polynomial fit to the measured data for the current 1 as a function of the bead velocity Vb~ad yielded very satisfactory agreement in all calibrations.
As a first step toward replacing the recorded current by a force, the velocity VbeaO was calculated for each value of the current by solving the third-order equation obtained from the calibration. The force f that the bead exerted on the vesicle at a given current was then calculated from the velocity using the expression for the Stokes' drag on a spherical particle moving in a fluid:
f = 6Ti 'Rbead'qVbead, (3)
where Rbead is the radius of the bead and "q is the viscosity of the sucrose solution. (Measurements of the viscosity using a capillary viscometer showed ~l = 1.065 • 10 3 N �9 s/m2.) Using the data of Fig. 4 and the calibration of Fig. 5, the force f is shown in Fig. 6 as a function of the square root of the tension r defined in Eq. 2. The depen- dence is clearly linear, as predicted by Eq. 1. Linear re- gressions were done separately for the data at increasing and decreasing pressure, respectively, and yielded two practically identical straight lines. The calculation of the bending stiffness k c from the slope of the linear fit is straightforward (Eq. 1). For the example shown in Fig. 6 one obtains kc = 1 . 2 3 x 10-19 j.
Measurements were performed on 10 vesicles with ves- icle radii R v (cf. Fig. 3) ranging from 15 to 30 Ixm and tether lengths L t between 25 and 315 Ixm. Pipette radii were between 3.6 and 5.2 p,m. For every vesicle-bead
pair, the measurements consisted of at least two series to check repeatability, with the aspiration pressure first in- creasing and then decreasing in each series. The overall number of data points, i .e., of tethers pulled, was about 530. Forces applied covered an overall range from 3 to 43 piconewtons, with bead radii between 3 and 6.2 Ixm. The average value of the bending modulus obtained from these measurements was k~ = 1.17 • 10-19 j, with a standard deviation of 0.08 • 10 19 j.
DISCUSSION
A variety of bead sizes, different-sized vesicles, and different-sized pipettes were used in this study, yet the measurements have resulted in exceptionally consistent values of k c. It should be emphasized that both the original data, i .e., the current 1 measured as a function of the aspiration pressure Ap (cf. Fig. 4), as well as the force- calibration curve (cf. Fig. 5), were obtained from inde- pendent measurements. In both cases the measured data showed a nonlinear behavior. However, when they were combined to give the force f as a function of the square root of the membrane tension ,?/2, the resulting data points aligned to represent an almost ideal linear dependence (cf. Fig. 6). This dependence corresponds very well to the theoretically predicted behavior, giving a high level of confidence that the analysis of the problem properly ac- counts for the most important physical aspects of the pro- cess, and so provides an accurate determination of the bending stiffness.
The present method has several substantial advantages over previously published techniques of measuring the bending stiffness. First of all, the only essential deforma- tion is a change in the tether radius R t resulting from a pressure step in the pipette. Thus, the membrane is bent successively into tubes of different diameters. Since the force necessary for this deformation is known, this exper- iment provides a direct mechanical measurement of the work required to change the curvature of the circumfer- ence of the tether. Furthermore, the measurement of the pulling force f as a function of the membrane tension 'r is independent of the membrane expansivity K (see Appen- dix 1) as well as of the projection length Lp (cf. Fig. 3), which greatly reduces measurement uncertainties.
Despite the consistency of values obtained for k c with this new approach, there are some uncertainties that must be considered when evaluating the present results. First, there may be systematic errors in the kc values because of errors in the calibration. In particular, we note the depen- dence of the calibration on an accurate measure of the bead diameter, an accurate measure of the solution vis- cosity, and on the applicability of Stokes' law to the used beads, which have a rather rough surface and not always an ideal spherical shape. However, given the variety of

602 V. HEINRICH and R. E. WAUGH
beads used, each of these possible errors should affect the measurements to a different extent in different experi- ments. Taking into account the smallness of the standard deviation of the final result, we expect the overall error from these uncertainties not to be significantly larger than the standard deviation itself (see Appendix 2). Second, it should be noted that it is necessary to use some percentage of biotinylated lipid to effect adhesion between the bead and the vesicle during the experiment. The extent to which the presence of biotinylated lipid affects the properties of the membrane is unknown and should be the subject of future studies. Assuming that the effect of the biotin lipid on the mechanical properties of the membrane is small, the kc value of a pure SOPC bilayer should not signifi- cantly differ from the value presented here.
In addition to the relationship between force and mem- brane tension, for some vesicles, measurements were made of changes in the projection length L o during tether formation at different aspiration pressures. Such measure- ments provide another, independent way to determine k c. However, the measurements are technically more diffi- cult, because long tethers are necessary to obtain detect- able changes in Lp. But even at moderate tether lengths, Lp changes were only a few video pixels at higher aspiration pressures in the present experiments, and so this measure- ment had a much lower resolution than the measurement presented above. Indeed, when the same mathematical model (Appendix 1) was adapted to this experimental sit- uation, its predictions were in much worse agreement with the measured data than the tension-force data. Even so, the scatter of resulting k~. values (between 1.05 X 10⁻¹⁹ j and 1.79 x 10- 19 j) was larger than expected, taking into account the method's resolution. The scatter in the data can be attributed to larger-than-expected changes in pro- jection length during tether formation at increasing aspi- ration pressures. One possible explanation might be the existence of nonbilayer structures or very small membrane blebs that are not detectable in the light microscope. It is possible that these structures were "pulled out" during tether formation or at sufficiently high aspiration pres- sures, which could lead to additional changes in the pro- jection length without significantly affecting the force nec- essary to maintain a tether. The effect appeared to be irreversible within the relatively short measurement time, and so it could not be interpreted in terms of an "entropic tension" caused by micro-undulations of the bilayer (8). On the contrary, the observations seem to support the hypothesis of an "anomalous roughness" superstructure postulated by Helfrich (18). However, so far the few in- cidental observations allow at most speculation, and more experiments are needed to study this behavior systemati- cally.
Most of the published kc values are estimated from measurements of thermally driven fluctuations of the ves-
icle surface and are based on theoretical models that de- scribe the real physical fluctuation process to varying de- grees of accuracy (8,13,26,27). The values for the bend- ing stiffness of SOPC bilayers obtained from these experiments are generally smaller than our result. How- ever, these values could be in error for a number of rea- sons. An essential uncertainty is the theoretical model for the analysis of fluctuations. It is usually based on a sec- ond-order expansion of the model quantities in terms of the deviation from a sphere. It has been shown before that this expansion does not properly reproduce the diversity of equilibrium shapes of vesicles obtained from more general approaches (16). Furthermore, it can be shown that close to so-called symmetry breaking points in the phase dia- gram of equilibrium shapes (17,25), the vesicle surface exhibits critical fluctuations that cannot be interpreted in terms of the second-order model. Indeed, very recently observations of large vesicle shape fluctuations of this kind have been reported (5). In an experiment, a vesicle with an equilibrium shape that is in a critical region of the phase diagram will certainly show more pronounced shape fluctuations. The probability that such a vesicle will be picked by the observer is rather high. Naturally, the ap- parent bending stiffness of such a vesicle will be smaller if calculated on the basis of the traditional model. In addi- tion, in both the theory used to analyze fluctuations of free vesicles as well as in the fluctuation-based "effective ten- sion" interpretation of low-pressure aspiration experi- ments (8), the contribution of nonlocal bending effects and the proper inclusion of constraints are questions that do not yet appear to be completely answered.
Considering these uncertainties, a direct measurement of the relationship between deformation and imposed force seems to be a preferable way to determine the bend- ing stiffness of membranes. The magnetic force transducer has enabled us to perform this measurement with an ex- ceptional accuracy. The above results demonstrate the ca- pability of the force transducer to apply and measure ex- tremely small forces with a resolution of a fraction of a piconewton. First test experiments have shown that the force transducer can also be used in a similar way to establish the mechanical properties of red blood cell mem- branes. The apparatus presented in this paper can be adapted to a large variety of other tasks, and so it can certainly help to gain new insight in a number of problems in microbiomechanics. For example, there has been con- siderable discussion in the literature regarding relation- ships between the bending stiffness k c and the membrane area compressibility modulus K (10,29,30). Although the present data are not sufficient to provide a critical test of these predictions (because only one type of membrane is tested), we can begin to assess what models are consistent with the present findings. The value of K of SOPC mem- branes has been well determined by at least two different

Piconewton Forces and Membrane Bending Stiffness 603
groups to be between 190 and 200 mN/m (8,21). Mea- surements of this parameter in our laboratory (unpub- lished) also confirm this value. Using a value for K of 200 mN/m and a value for k~ of 1.2 • 10-19 j , and assuming that the elastic contributions arise equally from each o f the constituent monolayers of the bilayer, we find that the individual monolayers could be modeled as homogeneous layers, each monolayer having a thickness of 2.7 nm (30). Taking the sum of two monolayers , we get a value for the total membrane thickness of 5.4 nm, which is quite close to the membrane thickness determined from X-ray diffrac- tion measurements (20). Clearly, other models could also fit these values of K and k~, and further experimentation on membranes of different thickness and composit ion will be needed to crit ically test these relationships.
REFERENCES
1. Angelova, M. I., S. Sol6au, Ph. M616ard, J. F. Faucon, and P. Bothorel. Preparation of giant vesicles by external AC electric fields. Kinetics and applications. Prog. Colloid. Polym. Sci. 89:127-131, 1992.
2. Ashkin, A., and J. M. Dziedzic. Optical trapping and ma- nipulation of viruses and bacteria. Science 235:1517-1520, 1987.
3. Bo, L., and R. E. Waugh. Determination of bilayer mem- brane bending stiffness by tether formation from giant, thin- walled vesicles. Biophys. J. 55:509-517, 1989.
4. Bo~i~, B., S. Svetina, B. :2ekg, and R. E. Waugh. The role of lamellar membrane structure in tether formation from bilayer vesicles. Biophys. J. 61:963-973, 1992.
5. D6bereiner, H.-G., E. Evans, U. Seifert, and M. Wortis. Spinodal fluctuations of budding vesicles. Phys. Rev. Lett. 75:3360-3363, 1995.
6. Evans, E. A. Minimum energy analysis of membrane de- formation applied to pipet aspiration and surface adhesion of red blood cells. Biophys. J. 30:265-284, 1980.
7. Evans, E., and D. Needham. Physical properties of surfac- tant bilayer membranes: Thermal transitions, elasticity, ri- gidity, cohesion, and colloidal interactions. J. Phys. Chem. 91:4219-4228, 1987.
8. Evans, E., and W. Rawicz. Entropy-driven tension and bending elasticity in condensed-fluid membranes. Phys. Rev. Lett. 64:2094-2097, 1990.
9. Evans, E., K. Ritchie, and R. Merkel. Sensitive force tech- nique to probe molecular adhesion and structural linkages at biological interfaces. Biophys. J. 68:2580-2587, 1995.
10. Evans, E. A., and R. Skalak. Mechanics and thermodynam- ics of biomembranes. CRC Crit. Rev. Bioeng. 3:181-418, 1979.
11. Evans, E., and A. Yeung. Hidden dynamics in rapid changes of bilayer shape. Chem. Phys. Lipids 73:39-56, 1994.
12. Evans, E., A. Yeung, R. Waugh, and J. Song. Dynamic coupling and nonlocal curvature elasticity in bilayer mem- branes. In: The Structure and Conformation of Amphiphilic Membranes, edited by R. Lipowsky, D. Richter, and K. Kremer. Berlin, Heidelberg: Springer-Verlag, 1992, pp. 148-153.
13. Faucon, J. F., M. D. Mitov, P. Meleard, I. Bivas, and P. Bothorel. Bending elasticity and thermal fluctuations of
lipid membranes. Theoretical and experimental require- ments. J. Phys. France 50:2389-2414, 1989.
14. Guilford, W. H., and R. W. Gore. A novel remote-sensing isometric force transducer for micromechanics studies. Am. J. Physiol. 263:C700-C707, 1992.
15. Guilford, W. H., R. C. Lantz, and R. W. Gore. Locomo- tive forces produced by single leukocytes in vivo and in vitro. Am. J. Physiol. 268:C1308-C 1312, 1995.
16. Heinrich, V., M. Brumen, R. Heinrich, S. Svetina, and B. ~ek~. Nearly spherical vesicle shapes calculated by use of spherical harmonics: Axisymmetric and nonaxisymmetric shapes and their stability. J. Phys. France 2:1081- 1108, 1992.
17. Heinrich, V., S. Svetina, and B. ~ek~. Nonaxisymmetric vesicle shapes in a generalized bilayer-couple model and the transition between oblate and prolate axisymmetric shapes. Phys. Rev. E 48:3112-3123, 1993.
18. Helfrich, W. Tension-induced mutual adhesion and a con- jectured superstructure of lipid membranes. In: Handbook of Biological Physics, Vol. 1, edited by R. Lipowsky and E. Sackmann. Amsterdam: Elsevier Science B.V., 1995, pp. 691-721.
19. Lipowsky, R. The conformation of membranes. Nature 349: 475-481, 1991.
20. Mclntosh, T. J., and S. A. Simon. Hydration force and bilayer deformation: A reevaluation. Biochemistry 25:4048- 4066, 1986.
21. Needham, D., and R. S. Nunn. Elastic deformation and failure of lipid bilayer membranes containing cholesterol. Biophys. J. 58:997-1009, 1990.
22. Niggcmann, G., M. Kummrow, and W. Helfrich. The bending rigidity of phosphatidylcholine bilayers: Depen- dences on experimental method, sample cell sealing and temperature. J. Phys. France 5:413-425, 1995.
23. Reeves, J. P., and R. M. Dowben. Formation and proper- ties of thin-watled phospbolipid vesicles. J. Cell. Physiol. 73:49-60, 1969.
24. Sackmann, E. Physical basis of self-organization and func- tion of membranes: Physics of vesicles. In: Handbook of Biological Physics, Vol. 1, edited by R. Lipowsky and E. Sackmann. Amsterdam: Elsevier Science B.V., 1995, pp. 213-304.
25. Seifert, U., K. Berndl, and R. Lipowsky. Shape transfor- mation of vesicles: Phase diagram for spontaneous- curvature and bilayer-coupling models. Phys. Rev. A 44: 1182-1202, 1991.
26. Schneider, M. B., J. T. Jenkins, and W. W. Wcbb. Ther- mal fluctuations of large cylindrical phospholipid vesicles. Biophys. J. 45:891-899, 1984.
27. Servuss, R. M., W. Harbich, and W. Helfrich. Measure- ment of the curvature-elastic modulus of egg lecithin bilay- ers. Biochim. Biophys. Acta 436:900-903, 1976.
28. Song, J. B., and R. E. Waugh. Bending rigidity of SOPC membranes containing cholesterol--brief communication. Biophys. J. 64:1967-1970, 1993.
29. Svetina, S., and B. ~ekg. Elastic properties of closed bilayer membranes and the shapes of giant phospholipid vesicles. In: Handbook of Nonmedical Applications of Liposomes, Vol. 1, edited by D. D. Lasic, and Y. Barenholz. Boca Raton, New York, London, Tokyo: CRC Press, 1996, pp. 13-42.
30. Waugh, R. E., and R. M. Hochmuth. Mechanical equilib- rium of thick hollow liquid membrane cylinders. Biophys. J. 52:391-400, 1987.

604 V. HEINR1CH and R. E. WAUGH
31. Waugh, R. E., J. Song, S. Svetina, and B. ~ekg. Mono- layer coupling and curvature elasticity in bilayer membranes by tether formation from lecithin vesicles. Biophys. J. 61: 974-982, 1992.
APPENDIX 1
All geometric parameters are defined in Fig. 3. Assum- ing that the vesicle is composed exclusively of cylindrical and spherical parts, the vesicle volume V is approximat- ed by
4 V : ~ ,Tl'g3v + TrRI~L p - ~-Rp,7'1" 3 (AI.1)
where the small volume of the tether has been neglected (g t '~ Rv). The membrane area A is
a = 4~rR~v + 2~rRpL o + 2"rrRtLt - ~rRp ~. (A1.2)
Taking into account that the membrane consists of two monolayers, and assuming that these have a constant sep- aration distance h (h ~ Rv), the difference between mono- layer areas Zk4 is expressed as
AA = 2xrh(4Rv + Lp + L t + Rp). (A1.3)
As a reference state we will take a vesicle without a tether (no pulling force, L t = 0) that is aspirated at the smallest pressure that produces a stable projection and spherical vesicle body. Geometric quantities referring to this state are denoted by the subscript 0. As an exception, AA 0 is defined for isolated, unstretched monolayers and is unknown. Denoting ALp = Lp - Lp,,, one may write
4 3 qrR~ALp (A 1.4) v - Vo = ~ r - Rv,,) +
A - A0 = 4'rr(R 2 - R20) + 2'nRpALp + 2'rrRtLt. (A1.5)
The volume of the vesicle is assumed to be constant, i .e . , V = V o. This constraint is used to eliminate ALp from all following expressions, using Eq. A1.4 in the form
4 R3 3 V , , - Rv
(A1.6) 2 &Lp 3 Rp
Thus, Eq. A1.5 becomes
8 R3 3 v o - ev
A - A 0 = ~'rr Rp - - + 4"rr(R2v - R2vo) + 2"n'RtLt.
(A1.7)
To calculate the difference AA - ~A o, one has to take into account the observation that during tether formation, changes in the tether length L t a r e much larger than changes in the other variables entering Eq. A1.3. We may treat these variables as constants and collect them together
with AA o in a new constant L * that is defined in such a way that
AA - zXA 0 = 2,rrh(L t - L*). (A1.8)
It is assumed that the vesicle membrane is in equilib- rium when the tether is held at a stable length. At equi- librium the total energy of the system has a minimum. The total energy is the sum of two membrane bending ener- gies, the energy of the membrane expansion, the work done by the aspiration pressure, and the work done by the pulling force of the bead (4).
Neglecting small or constant energy contributions, we first obtain the local bending energy as
Lt Wb = rrkc ~ , (A1.9)
where k c is the local bending modulus. Using Eq. AI .8 , the nonlocal bending energy is calculated as
kr (AA - AAo) 2 2"rr2kr W r = 2 ~ o h : A - - - - ~ - ( L t - L * ) 2 '
(AI.10)
with the nonlocal bending modulus k r. Denoting the area expansivity modulus by K, the energy of membrane ex- pansion is
K Wt = - - ( A - A0) 2. ( A I . l l )
2A0
The work done by the aspiration pressure Ap is given by
Wp _ rrRZALpA p 4 = = -~ "rr(R~ - R~, )Ap, (AI. 12)
and, finally, the work of the axial force f exerted by the magnetic bead is calculated as
Wf = -JLt. (Al.13)
The equilibrium equations are derived by minimizing the total energy:
Wtot = Wb + Wr + Wt + Wp + Wf = Wtot(Rv, Lt, Rt). (A1.14)
At a minimum, the partial derivatives of Wto t with respect to the independent variables Rv, Lt, and R t have to vanish. The resulting three equations can be combined into the following pressure-force relation:
, / kcRvRp 4"rr2kr f : 2'rr ~ ~ ap + ~ (Lt - L*). (AI. 15)
Finally, Eq. 1 is obtained from Eq. A1.15 by introducing the tension "r defined in Eq. 2.

Piconewton Forces and Membrane Bending Stiffness 605
APPENDIX 2
In this appendix we consider the possible sources of error in our measurements as a guide to other investigators who might wish to use this technique. The most signifi- cant uncertainties come from relating the measured current to the actual force on the bead, and from the resolution limits of light microscopy. To consider the possible errors introduced into the calculated value of the bending stiff- ness, we write k~ in the form
kc = 9(Rbead)2Xl 2 /~p R- v k d V ~ / ] �9 (A2.1)
The error contribution of each measured quantity is ex- pected to be the product of the partial derivative of k~ with respect to this quantity times the uncertainty in the mea- surement of the quantity itself. For example, the expected error in k~ (Skc) resulting from a measurement error in the bead radius (SRbead) is given by
( ~kc) = 2~Rbead
kc /Rb~ad Rbead " (A2.2)
As expected, because Rbead enters Eq. A2.1 as the square, the contribution of uncertainties in the measurement of Rbead tO the relative error in k c is twice the relative error in
Rbead. Thus, the most significant errors are likely to come from errors in the value of the solution viscosity (which may vary significantly with temperature or solute concen- tration) and from measurements of the bead radius. (We note that although the slope also enters as the square, the uncertainty in the slope is relatively small (Fig. 6).) Errors in the vesicle radius (--2.5%) and errors in the pipette radius ( - 1%) enter only to first order and are significantly smaller than the uncertainty in the bead radius, which in theory could be as large as 10-15%. However, it should be noted that in two experiments, very accurate determi- nations of the bead radius were possible because, by good luck, the bead was larger than one pipette and smaller than the other, even though the pipettes themselves were quite close in size. The pipette radii were determined by inser- tion of calibrated probes, providing precise limits on pos- sible values of the bead radius in these cases. Inasmuch as the values for kc determined for these cases were in good agreement with values obtained when the bead radius was determined by direct measurement, we are confident that errors from this particular source were not more than the standard deviation in the calculated values of kc. Errors due to the use of the Stokes' drag equation for particles that were not spherical or not smooth are more difficult to assess. Nevertheless, the fact that the values of k~ did not vary appreciably when different beads were used suggests that such errors were not large.