a pension trust fund of the city of seattle · a pension trust fund of the city of seattle ......
TRANSCRIPT

SEATTLE CITY EMPLOYEES’ RETIREMENT SYSTEM
A Pension Trust Fund of the City of Seattle
ANNUAL REPORT
For The Year Ended December 31, 2007
Prepared by: Seattle City Employees’ Retirement System Staff
720 Third Avenue, Suite 1000Seattle, WA 98104-1652(206) 386-1293(206) 386-1506 faxwww.seattle.gov/retirement
i

TABLE OF CONTENTS
INTRODUCTORY SECTIONTitle Page............................................................................................................................................................. iTable of Contents................................................................................................................................................ iiBoard of Administration.................................................................................................................................... iiiRetirement System Staff..................................................................................................................................... ivOrganization Chart.............................................................................................................................................. vLetter of Transmittal........................................................................................................................................... vi
FINANCIAL SECTIONIndependent Auditor's Report.................................................................................. 2Management's Discussion and Analysis................................................................... 3Statements of Plan Net Assets.................................................................................. 8Statements of Changes in Plan Net Assets............................................................... 9Notes to the Financial Statements............................................................................. 10Required Supplemental Information - Schedule of Funding Progress........................................................ 14Required Supplemental Information - Schedule of Employer Contributions............................................. 14Additional Information - Schedule of Administrative Expenses.................................................................. 15Additional Information - Schedule of Investment Expenses........................................................................ 16Additional Information - Schedule of Investment Cash and Securities...................................................... 17
ACTUARIAL SECTIONActuary Certification Letter............................................................................................................................... 20Summary of Actuarial Assumptions and Methods....................................................................................... 22Schedule of Active Member Valuation Data................................................................................................... 26Schedule of Retirees and Beneficiaries............................................................................................................ 27GASB No. 27 Annual Pension Cost and Net Pension Obligation............................................................... 28Schedule of Funding Progress.......................................................................................................................... 29Fund Ratios......................................................................................................................................................... 30Schedule of Employer Contributions............................................................................................................... 31GASB No. 27 Five-year Trend Information.................................................................................................... 32GASB No. 27 Annual Development of Pension Cost.................................................................................... 33Analysis of Financial Experience..................................................................................................................... 34Analysis of Actuarial Gains or Losses............................................................................................................ 35Schedule of Retirees and Beneficiaries added to/removed from rolls......................................................... 36Summary of the Retirement Plan....................................................................................................................... 37
STATISTICAL SECTIONSchedule of Revenues by Source..................................................................................................................... 42Schedule of Expenses by Type......................................................................................................................... 42Schedule of Benefit Expense by Type.............................................................................................................. 43Schedule of Revenue Ratios by Source........................................................................................................... 43Schedule of Investments Results..................................................................................................................... 44Schedule of Investment Results by Manager................................................................................................. 45Age Distribution of Pensioners........................................................................................................................ 46Retirement Allowance Distribution.................................................................................................................. 47Active Membership Experience........................................................................................................................ 48Retiree Membership Experience........................................................................................................................ 49Miscellaneous Retired Information.................................................................................................................. 50Schedule of Average Benefit Payments........................................................................................................... 51New Active Members - by Department........................................................................................................... 52Members Again in 2007...................................................................................................................................... 52Service Retirements Granted in 2007................................................................................................................ 53Disability Retirements Granted in 2007............................................................................................................ 58Retired Members Deceased in 2007.................................................................................................................. 59Deaths in Active Service During 2007............................................................................................................. 62Death Benefit System......................................................................................................................................... 63Unused Sick Leave.............................................................................................................................................. 63Retirement Estimate Information....................................................................................................................... 64
ii
Seattle City Employees' Retirement System Introductory Section
Seattle City Employees' Retirement System Introductory Section
Board of Administration
Mark McDermott Dwight Dively
Rod Rich
Frank Mathews
iii
Jean Godden
Mary Norris Lou Walter

Introductory Section Seattle City Employees' Retirement System
iv
Administrative Staff
Ronda Iriate
Frankie GrazianiKatherine Bursett
Lindsey LeNguyen
Jean LeMasterHieu Le
Mel Robertson
Sheila Moss
Lindsay Reid
Jeannette Ocampo
Cecelia M. Carter
Selam Teklemariam

v
Admin Spec IVacant
Accounting Technician IJean LeMaster
Sheila MossVacant
ReceptionistFrankie Graziani
General Ledger AccountingAccountant
Selamawit Teklemariam
Active Accounts and InvestmentsAccountantLindsay Reid
RetirementsRetirement Specialists
Katherine BursettLindsey LeNguyen
Pension EstimatesAsst. Retirement Specialist
Ronda Iriarte
Accounting Technician IHieu Le
Retired Accounts and BenefitsAccountant
Jeannette Ocampo
Internal Data ManagementFinance Analyst
Vacant
Assistant Executive DirectorMel Robertson
Executive DirectorCecelia M. Carter
Board of Administration
Ms. Jean Godden, Chair Mr. Lou Walter, Employee Member . Mr. Dwight Dively, Treasurer Ms. Mary Norris, Retired Member . Mr. Mark McDermott, Secretary Mr. Rod Rich, Employee Member .
Mr. Frank Mathews, Member Selected From Community

vi
City of SeattleSeattle City Employees’ Retirement System720 Third Avenue, Suite 1000, Seattle, WA 98104, Phone: (206) 386-1293, Fax: (206) 386-1506
June 1, 2008
To the Honorable Mayor andSeattle City CouncilSeattle, Washington 98104This Annual Report consists of four sections: the Introductory Section contains the Executive Director's letter oftransmittal and the identification of the administrative organization of the System; the Financial StatementsSection contains the financial statements of the System as well as a letter from the System’s certified publicaccountants; the Actuarial Section contains the independent consulting actuary's opinion along with relatedactuarial data and statements; and the last section is the Statistical Section including tables of significant datapertaining to the operation of the System.The compilation of this report reflects the combined effort of the staff under the leadership of the RetirementBoard. The intention is to provide complete and reliable information to assist in management decisions, topresent evidence of compliance with legal provisions and to demonstrate responsible stewardship for the assetscontributed by the members and their employers.The Executive Director and staff have reviewed the internal accounting controls and the financial statements,supporting schedules and statistical tables, and we are of the opinion that they fairly present the condition of theRetirement System.The accuracy and completeness of the data contained in this report are the sole responsibility of the managementof the Seattle City Employees' Retirement System.The Retirement System was created and established by amendment to the Charter of the City of Seattle (ArticleXXII - Section 13) submitted to the voters at the municipal election of March 8, 1927. The System, knownthereafter as the Seattle City Employees' Retirement System, is to provide retirement income to help maintain thequality of life for its former employees. The retirement plan is a defined benefit plan, which means theemployee’s salary, years of service and age at the time of retirement are used to determine the amount ofretirement benefits.The Retirement System covers employees of the City of Seattle, and certain employees of King County, METROand the Seattle City Library. The year ended December 31, 2007, concludes our 79th year of operations. Thislongevity is a tribute to the hard work and conscientious efforts of the past and present Board members, staff,advisors and elected officials who have made the Retirement System the strong, exemplary system it is today.The report is being mailed to all departments of the City. They form the link between the Seattle City Employees'Retirement System and its membership. Their cooperation contributes significantly to the success of theRetirement System. We trust the employers and Retirement System members will find this report bothinformative and helpful.We would like to express our gratitude to the staff, the advisors, and to the many other people who have workedso diligently to assure the successful operation of the System.
Respectfully submitted,BOARD OF ADMINISTRATION,SEATTLE CITY EMPLOYEES'RETIREMENT SYSTEMAS OF DECEMBER 31, 2007
Mel Robertson, CPA then Acting Executive Director


INDEPENDENT AUDITOR’S REPORT To the Board of Administration Seattle City Employees’ Retirement System Seattle, Washington We have audited the accompanying statements of plan net assets of the Seattle City Employees’ Retirement System (the “System”), as of December 31, 2007 and 2006, and the related statements of changes in plan net assets for the years then ended. These financial statements are the responsibility of the System’s management. Our responsibility is to express an opinion on these financial statements based on our audits. We conducted our audits in accordance with auditing standards generally accepted in the United States of America. Those standards require that we plan and perform the audits to obtain reasonable assurance about whether the financial statements are free of material misstatement. An audit includes examining, on a test basis, evidence supporting the amounts and disclosures in the financial statements. An audit also includes assessing the accounting principles used and significant estimates made by management, as well as evaluating the overall financial statement presentation. We believe that our audits provide a reasonable basis for our opinion. In our opinion, the financial statements referred to above present fairly, in all material respects, the financial status of the System as of December 31, 2007 and 2006, and the changes in net assets for the years then ended, in conformity with accounting principles generally accepted in the United States of America. Management’s Discussion and Analysis and the Schedule of Funding Progress and Schedule of Employer Contributions, which are presented as Required Supplementary Information, are not a required part of the basic financial statements but are supplementary information required by the Governmental Accounting Standards Board. This supplementary information is the responsibility of the System’s management. We have applied certain limited procedures, which consisted principally of inquiries of management regarding the methods of measurement and presentation of the required supplementary information. However, we did not audit the information and express no opinion on it. Our audits were conducted for the purpose of forming an opinion on the basic financial statements taken as a whole. The schedules of administrative expenses, investment expenses, and cash and investments within the financial section, and the actuarial section and the statistical section are presented for purposes of additional analysis and are not a required part of the basic financial statements. This additional information is the responsibility of the System’s management. Such additional information has not been subjected to the auditing procedures applied in the audit of the basic financial statements, and accordingly, we express no opinion on it.
Seattle, Washington May 20, 2008

Financial Section Seattle City Employees' Retirement System
3
Management’s Discussion and Analysis
This section presents management’s discussion and analysis of the Seattle City Employees’ Retirement System’s(SCERS or the System) financial performance during the year ended December 31, 2007. Please read it inconjunction with the transmittal letter in the Introductory Section and the accompanying financial statements andthe related notes.
The City of Seattle is responsible for establishing and maintaining an internal control structure designed to ensurethe protection of assets from loss, theft, or misuse, and to ensure the accounting information generated isadequate to prepare financial statements in conformity with generally accepted accounting principles. Theinternal control structure is designed to provide reasonable, though not absolute, assurance of achievingthese objectives.
As a department of the City of Seattle, the Seattle City Employees’ Retirement System is subject to this internalcontrol structure. In addition, section 4.36.140.D of the Seattle Municipal Code requires the Board ofAdministration to annually transmit a report of the financial condition of the retirement system to the CityCouncil.
This report is prepared in accordance with the principles of governmental accounting and reporting promulgatedby the Governmental Accounting Standards Board (GASB). Investments are stated at fair market value, andrevenues include the recognition of unrealized gains or losses. The accrual basis of accounting is used to recordassets, liabilities, revenues and expenses. Revenue recognition occurs when earned without regard to the date ofcollection. Expense recognition occurs when the corresponding liabilities are incurred, regardless of paymentdate. The basis of contributions to the System follows the principles of level cost financing, with current servicefinanced on a current basis. Buck Consultants, the consulting actuary, evaluates the funding status of the System.
The Financial Section contains the following information:
1. Basic Financial Statements including:a. Statements of Plan Net Assetsb. Statements of Changes in Plan Net Assetsc. Notes to the Financial Statements
2. Required Supplementary Information including:a. Schedule of Funding Progressb. Schedule of Employer Contributions
3. Other Supplementary Schedules including:a. Schedule of Administrative Expensesb. Schedule of Investment Expensesc. Schedule of Cash and Investments
The basic financial statements are described as follows:
• The Statement of Plan Net Assets shows the account balances at year-end and includes the net assetsavailable for future benefit payments. The liabilities for future benefit payments are not included in thisstatement; however, they are shown in the Schedule of Funding Progress that is included in the RequiredSupplementary Information, as well as in the documentation provided by the actuary that is included in theActuarial Section of this annual report.
• The Statement of Changes in Plan Net Assets shows the sources and uses of funds during the year andillustrates the change in net assets from the previous year.
• The Notes to the Financial Statements are an integral part of the financial statements and include additionaldetailed information and schedules to provide a better understanding of the financial statements.

Seattle City Employees' Retirement System Financial Section
4
The required supplementary information provides historical trends that help to reflect the ongoing planperspective and the long-term nature of the defined benefit plan.
· The Schedule of Funding Progress contains actuarial information about the status of the plan from an ongoinglong-term perspective, in the accumulation of sufficient assets to pay future benefits when due. ActuarialLiabilities in excess of the Actuarial Value of Assets indicate that insufficient assets were accumulated as ofDecember 31, 2005 to fund the future benefits of current members and retirees.
· The Schedule of Employer Contributions contains historical trend information regarding the value ofthe total annual contributions the employer must pay and the actual contributions by employers inmeeting this requirement.
Financial Highlights
· SCERS assets that are held in trust for the payment of future benefits exceed its current amounts owed asof December 31, 2007 by $2.12 billion.
· Net assets increased by $108 million (5.4%) during 2007, primarily due to gains in the equity markets in theU.S. and abroad, also in hedge funds and in real estate. Net assets increased by $219 million (12.2%) during2006, primarily due to gains in the equity markets in the U.S. and abroad.
· Revenues (additions to net assets) for 2007 were $220 million, which includes member and employercontributions of $81 million and net gains from investment activities totaling $139 million. Revenues(additions to net assets) for 2006 were $319 million, which includes member and employer contributions of$76 million and net gains from investment activities totaling $243 million.
· Expenses (deductions from net assets) for 2007 increased by $11.8 million (11.8%) from 2006. Retireebenefits was the largest part of the increase. Expenses (deductions from net assets) for 2006 increased by$5.3 million (5.6%) from 2005.
Plan Net Assets
The table below provides a summary of assets and current liabilities:
Plan Net Assets As of December 31
2007 2006 2005Cash and Receivables $ 89,803,563 $ 99,782,484 $ 65,833,444Investments at Fair Value 2,039,406,451 1,920,085,235 1,733,929,772Securities Lending Collateral 103,323,467 145,097,240 122,862,720Equipment 2,963 3,308 3,654 Total Assets 2,232,536,444 2,164,968,267 1,922,629,590
Securities Lending Payable 103,323,467 145,097,240 122,862,720Other Payables 9,814,866 8,717,400 8,002,610 Total Liabilities 113,138,333 153,814,640 130,865,330
Total Net Assets $ 2,119,398,111 $ 2,011,153,627 $ 1,791,764,260
Financial Section Seattle City Employees' Retirement System
5
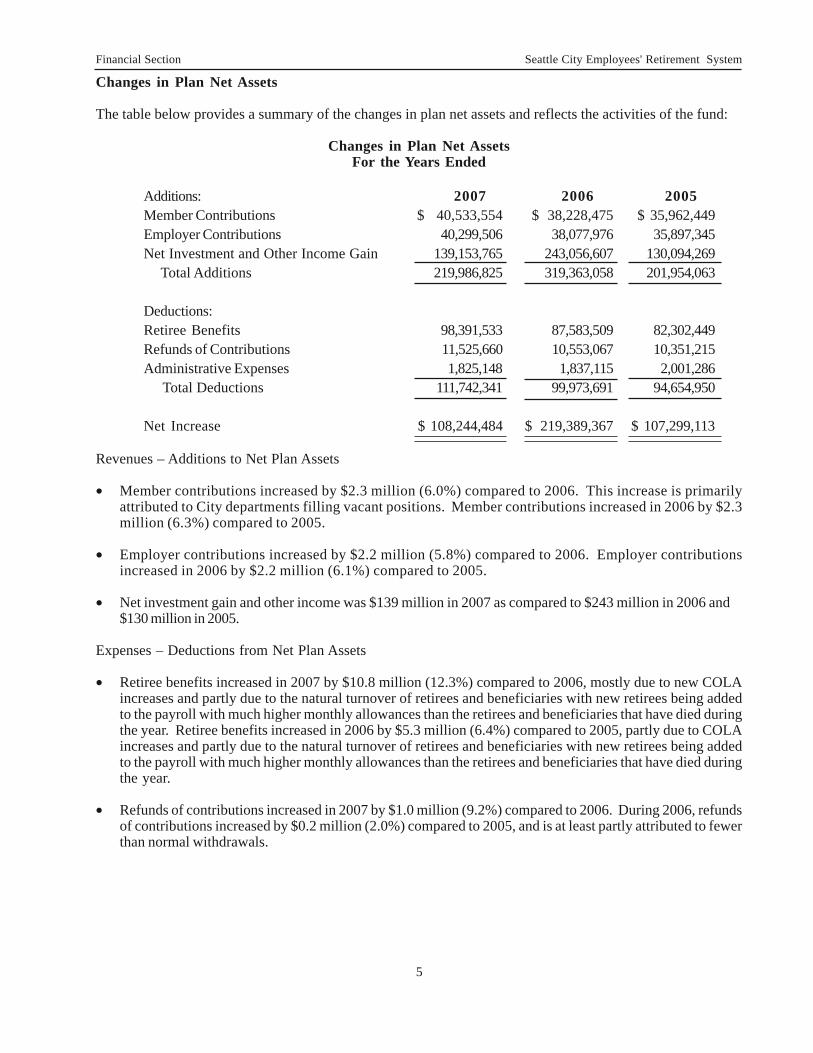
Changes in Plan Net Assets
The table below provides a summary of the changes in plan net assets and reflects the activities of the fund:
Changes in Plan Net AssetsFor the Years Ended
Additions: 2007 2006 2005Member Contributions $ 40,533,554 $ 38,228,475 $ 35,962,449Employer Contributions 40,299,506 38,077,976 35,897,345Net Investment and Other Income Gain 139,153,765 243,056,607 130,094,269 Total Additions 219,986,825 319,363,058 201,954,063
Deductions:Retiree Benefits 98,391,533 87,583,509 82,302,449Refunds of Contributions 11,525,660 10,553,067 10,351,215Administrative Expenses 1,825,148 1,837,115 2,001,286 Total Deductions 111,742,341 99,973,691 94,654,950
Net Increase $ 108,244,484 $ 219,389,367 $ 107,299,113
Revenues – Additions to Net Plan Assets
• Member contributions increased by $2.3 million (6.0%) compared to 2006. This increase is primarilyattributed to City departments filling vacant positions. Member contributions increased in 2006 by $2.3million (6.3%) compared to 2005.
• Employer contributions increased by $2.2 million (5.8%) compared to 2006. Employer contributionsincreased in 2006 by $2.2 million (6.1%) compared to 2005.
• Net investment gain and other income was $139 million in 2007 as compared to $243 million in 2006 and$130 million in 2005.
Expenses – Deductions from Net Plan Assets
• Retiree benefits increased in 2007 by $10.8 million (12.3%) compared to 2006, mostly due to new COLAincreases and partly due to the natural turnover of retirees and beneficiaries with new retirees being addedto the payroll with much higher monthly allowances than the retirees and beneficiaries that have died duringthe year. Retiree benefits increased in 2006 by $5.3 million (6.4%) compared to 2005, partly due to COLAincreases and partly due to the natural turnover of retirees and beneficiaries with new retirees being addedto the payroll with much higher monthly allowances than the retirees and beneficiaries that have died duringthe year.
• Refunds of contributions increased in 2007 by $1.0 million (9.2%) compared to 2006. During 2006, refundsof contributions increased by $0.2 million (2.0%) compared to 2005, and is at least partly attributed to fewerthan normal withdrawals.

Seattle City Employees' Retirement System Financial Section
6
Seattle City Employees' Retirement System Financial Section
Plan Membership
The table below reflects the active membership and retiree changes during 2006:
Changes in Plan MembershipFor the Years Ended December 31, 2007 and 2006
2007 2006 % ChangeRetirees and Beneficiaries Receiving Benefits 5,200 5,093 2.1
Current and Terminated Employees Entitled to, But Not Yet Receiving Benefits:Current Employee Members 8,842 8,587 3.0Vested Employee Members 1,776 1,648 7.8Vested Employee Members with Portability 274 258 6.2 Total 10,892 10,493 3.8
Funding Status
Schedule of Funding ProgressFunding Ratio
As of January 1st Valuation Date
Funds are accumulated from employer and employee contributions, and investment earnings, and are used topay present and future benefit obligations and administrative expenses. The better the level of funding, thelarger the ratio of assets accumulated and investment income potential. We continue to make a constant effortto achieve a fully funded status, thereby assuring the participants of a financially sound retirement system. Thefunding ratio as of January 1, 2006 was 88.8%. Most active members contribute 8.03% of their salaries to theretirement fund and the City contributes 8.03%. For a detailed breakdown of the funding progress, please seethe “Actuarial Section”.
50%
60%
70%
80%
90%
100%
110%
120%
1998 1999 2000 2002 2004 2006
Financial Section Seattle City Employees' Retirement System
7
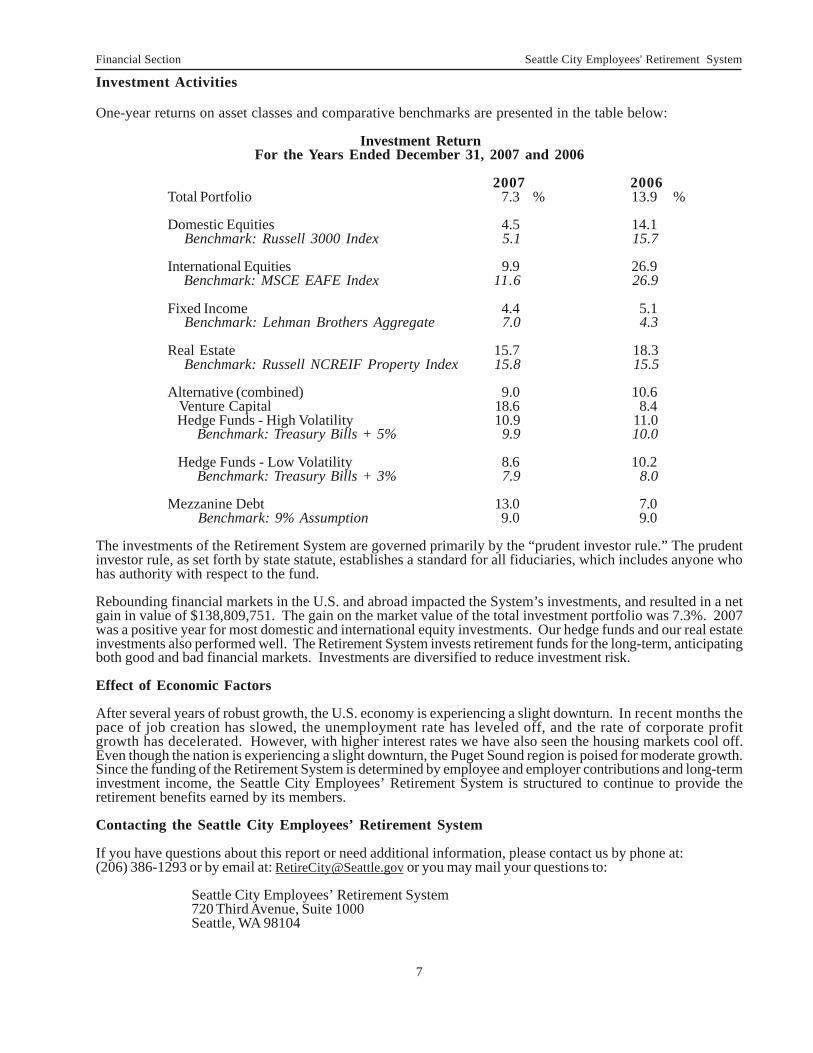
Investment Activities
One-year returns on asset classes and comparative benchmarks are presented in the table below:
Investment ReturnFor the Years Ended December 31, 2007 and 2006
2007 2006Total Portfolio 7.3 % 13.9 %
Domestic Equities 4.5 14.1 Benchmark: Russell 3000 Index 5.1 15.7
International Equities 9.9 26.9 Benchmark: MSCE EAFE Index 11.6 26.9
Fixed Income 4.4 5.1 Benchmark: Lehman Brothers Aggregate 7.0 4.3
Real Estate 15.7 18.3 Benchmark: Russell NCREIF Property Index 15.8 15.5
Alternative (combined) 9.0 10.6 Venture Capital 18.6 8.4 Hedge Funds - High Volatility 10.9 11.0 Benchmark: Treasury Bills + 5% 9.9 10.0
Hedge Funds - Low Volatility 8.6 10.2 Benchmark: Treasury Bills + 3% 7.9 8.0
Mezzanine Debt 13.0 7.0 Benchmark: 9% Assumption 9.0 9.0
The investments of the Retirement System are governed primarily by the “prudent investor rule.” The prudentinvestor rule, as set forth by state statute, establishes a standard for all fiduciaries, which includes anyone whohas authority with respect to the fund.
Rebounding financial markets in the U.S. and abroad impacted the System’s investments, and resulted in a netgain in value of $138,809,751. The gain on the market value of the total investment portfolio was 7.3%. 2007was a positive year for most domestic and international equity investments. Our hedge funds and our real estateinvestments also performed well. The Retirement System invests retirement funds for the long-term, anticipatingboth good and bad financial markets. Investments are diversified to reduce investment risk.
Effect of Economic Factors
After several years of robust growth, the U.S. economy is experiencing a slight downturn. In recent months thepace of job creation has slowed, the unemployment rate has leveled off, and the rate of corporate profitgrowth has decelerated. However, with higher interest rates we have also seen the housing markets cool off.Even though the nation is experiencing a slight downturn, the Puget Sound region is poised for moderate growth.Since the funding of the Retirement System is determined by employee and employer contributions and long-terminvestment income, the Seattle City Employees’ Retirement System is structured to continue to provide theretirement benefits earned by its members.
Contacting the Seattle City Employees’ Retirement System
If you have questions about this report or need additional information, please contact us by phone at:(206) 386-1293 or by email at: [email protected] or you may mail your questions to:
Seattle City Employees’ Retirement System720 Third Avenue, Suite 1000Seattle, WA 98104

Seattle City Employees' Retirement System Financial Section
8
Seattle City Employees’ Retirement System .A Pension Trust Fund of the City of Seattle .
Statements of Plan Net Assets .As of December 31, 2007 and 2006 .
2007 2006Assets:Cash and equity in pooled investments $ 14,831,195 $ 25,713,012 Short-term investment funds 66,939,531 66,629,483 Securities lending collateral 103,323,467 145,097,240
Receivables:Plan members 1,029,194 1,181,695Employer 4,387,860 3,929,995Interest and dividends 2,615,783 2,328,299
Total Receivables 8,032,837 7,439,989
Investments, at fair value:U.S. Government obligations 134,906,565 139,700,403Domestic corporate bonds 102,791,739 71,833,915Domestic stocks 763,843,752 970,965,137International stocks 402,965,990 212,328,995Real estate 286,646,176 237,796,406Alternative / Venture capital 233,789,609 199,070,322Mezzanine debt 114,462,620 88,390,057
Total Investments 2,039,406,451 1,920,085,235
Equipment and fixtures, at cost, net of accumulateddepreciation of $198,867 and $198,522, respectively 2,963 3,308
Total Assets 2,232,536,444 2,164,968,267
Liabilities:Pensions payable 7,586,549 6,398,172Other payables 2,228,317 2,319,228 Securities lending collateral 103,323,467 145,097,240
Total Liabilities 113,138,333 153,814,640
Net assets held in trust for pension benefits $ 2,119,398,111 $ 2,011,153,627 (A schedule of funding progress for the plan is presented on page 14.)
See notes to financial statements.

Financial Section Seattle City Employees' Retirement System
9
Seattle City Employees’ Retirement SystemA Pension Trust Fund of the City of Seattle .
Statements of Changes in Plan Net AssetsFor the Years Ended December 31, 2007 and 2006
Additions: 2007 2006Contributions:
Employer $ 40,299,506 $ 38,077,976Plan members 40,533,554 38,228,475
Total Contributions 80,833,060 76,306,451
Investment Income:Net appreciation in fair value of investments 109,428,521 221,628,976Interest 18,665,137 15,769,647Dividends 14,921,020 9,062,536
Total Investment Gain 143,014,678 246,461,159
Investment Activity Expenses:Investment management fees (3,949,336) (3,553,770)Performance measurement and asset allocation fees (155,750) (104,000)Investment custodial fees (99,841) (76,026)
Total Investment Activity Expenses (4,204,927) (3,733,796)
Net Gain From Investment Activities 138,809,751 242,727,363
Securities Lending Activities:Securities lending income 6,694,062 5,473,758
Securities lending expenses: Borrower rebates (6,236,253) (5,035,154) Management fees (113,795) (109,360)
Total Securities Lending Activities Expenses (6,350,048) (5,144,514)
Net Income from securities lending activities 344,014 329,244
Total Net Investment Gain 139,153,765 243,056,607
Total Additions 219,986,825 319,363,058
Deductions:Benefits 98,391,533 87,583,509Refunds of contributions 11,525,660 10,553,067Administrative expense 1,825,148 1,837,115
Total Deductions 111,742,341 99,973,691
Net Increase 108,244,484 219,389,367
Net assets held in trust for pension benefits:Beginning of Year 2,011,153,627 1,791,764,260End of Year $ 2,119,398,111 $ 2,011,153,627
See notes to financial statements.

Seattle City Employees' Retirement System Financial Section
SEATTLE CITY EMPLOYEES’ RETIREMENT SYSTEMNOTES TO THE FINANCIAL STATEMENTS
Note 1: Plan DescriptionThe Seattle City Employees’ Retirement System (the System) is a single-employer defined benefit public employee retirementsystem,xcovering employees of the City of Seattle and administered in accordance with Chapter 4.36 of the Seattle MunicipalCode. The System is a pension trust fund of the City of Seattle.All employees of the City of Seattle are eligible for membership in the System with the exception of uniformed police and firepersonnel who are covered under a retirement system administered by the state of Washington. Employees of METRO andthe King County Health Department who established membership in the System when these organizations were City ofSeattle Departments were allowed to continue their System membership. There are currently 5,200 retirees and beneficiariesreceiving benefits; and 8,842 active members of the System. There are 1,776 vested terminated employees entitled tofuture benefits. There are 274 additional terminated employees who have restored their contributions due to theprovisions of the portability statutes and may be eligible for future benefits.The System provides retirement, death, and disability benefits. Retirement benefits vest after five years of creditedservice, while death and disability benefits vest after 10 years of service. Retirement benefits are calculated as 2%multiplied by years of creditable service, multiplied by average salary, based on the highest 24 consecutive months.The benefit is actuarially reduced for early retirement.
Note 2: Summary of Significant Accounting Policies and Plan Asset MattersBasis of accounting: The financial statements were prepared using the accrual basis of accounting.New accounting standard: As of January 1, 2007, the City of Seattle adopted the provisions of GASB Statement No. 45,Accounting and Financial Reporting by Employers for Postemployment Benefits Other Than Pensions. This statementestablishes and modifies disclosure and reporting requirements related to postemployment benefits. Due to immaterialityof benefit amounts relative to the System’s employees, there is no impact to the System’s financial statements as a resultof the City’s adoption of the standard.Cash and equity in pooled investments: The System classifies as cash and equity in pooled investments cash on depositin financial institutions and cash on deposit in the City's internal cash management pool. The System also classifiescertain short-term highly liquid securities with an original maturity of three months or less as cash equivalents.Method used to value investments: Common stock, international equities, fixed income, international fixed income,and short-term investments are reported at fair market value which is based on the quoted market price. Venturecapital and real estate equities are reported at fair market value which has been determined by independentappraisers. Investment income consists of realized and unrealized appreciation (depreciation) in the fair value ofinvestments, interest income earned, less investment expense, plus income from securities lending activities, lessdeductions for security lending expenses. Securities and securities transactions are reflected in the financialstatements on a trade-date basis. Investments are made in accordance with the Prudent Person Rule as defined bythe State of Washington RCW 35.39.060. Under the authority of State of Washington RCW 41.28.005 and SeattleMunicipal Code 4.36.130, the System's Board of Administration adopted investment policies that define eligibleinvestments.Contributions: Employee and employer contributions are reported in the period in which the contributions aredue.Equipment and fixtures: Equipment and fixtures are stated at actual cost less accumulated depreciation. Estimateduseful lives by major class include: three years for computer equipment and 15 years for office furniture and equipment.The straight-line method of depreciation method is used.Reclassifications: Certain reclassifications of prior years' balances have been made to conform with the current yearpresentations.
Note 3: Contributions
Member and employer contribution rates are established by the Seattle Municipal Code Chapter 4.36.The employer contribution rate is determined by the actuarial formula identified as the Entry Age Cost Method. Theformula determines the amount of contributions necessary to fund the current service cost, representing the estimatedamount necessary to pay for benefits earned by the employees during the current service year and the amount ofcontributions necessary to pay for prior service costs. Total necessary contributions, including amounts necessaryto pay administrative costs, are determined through biannual actuarial valuations.Actuarially determined contribution rates are currently 8.03% for members and 8.03% for the employer. There are nolong-term contracts for contributions outstanding and no legally required reserves.
10
Financial Section Seattle City Employees' Retirement System
11
Note 4: Cash and Equity in Pooled InvestmentsThe Federal Deposit Insurance Corporation (FDIC) insures the cash deposits up to $100,000 per member of the System. Asprovided by State of Washington RCW 43.84, the Washington Public Deposit Protection Commission (PDPC) collateralizesdeposits in excess of $100,000. The bank balances of deposits as of the balance sheet date are entirely insured.
Note 5: Investments
The System's investments include investments that are insured or registered or securities held by the System or itsagent in the System's name.
No investment in any one corporation exceeds 5% of net assets available for benefits. Less than 5% of plan assetswere invested in derivative securities. All derivatives were nonleveraged securities consisting of collateralizedmortgage obligations (CMOs), Treasury strips, convertible bonds, futures, etc.
Short-term Investment Funds is a collective trust that may include certificates of deposit, Treasury bills, and mutualfunds. The Alternative / Venture category currently includes venture capital and hedge funds.
Custodial Credit RiskCustodial credit risk is the risk that in the event of the failure of a financial institution or a bank, the System will not be ableto recover the value of its deposits or investments that are in the possession of an outside party. The System mitigatescustodial credit risk by having its investment securities held by the System’s custodian and registered in the System’sname. The System’s short-term investments are created through daily sweeps of excess cash by the System’s custodian,and invested in a vehicle managed by the custodian. Approximately 1% of the System’s assets are held in cash. This cashis managed by the City’s Department of Executive Administration in a pool that operates like a demand deposit account, inthat these funds are available at any time and may be withdrawn from the pool without prior notice or penalty. These cashdeposits are insured.
Credit RiskCredit risk is the risk that an issuer, or other counterparty, to an investment will not fulfill its obligations. In accordance withthe System’s Investment Policy, the Retirement Board provides each of the System’s investment managers with a set ofinvestment guidelines. These guidelines specify eligible investments, minimum diversification standards, and applicableinvestment restrictions necessary for diversification and risk control. Managers do not have authority to depart from theirguidelines.
Concentration of Credit RiskConcentration of credit risk is the risk of loss attributed to the magnitude of a government’s investment in a single issuer.The System’s operational guidelines for investments in any corporate entity are stated in each individual manager’s specificportfolio guideline. In line with policy, the System does not have any investments from a single issuer (excluding explicitlyguaranteed governments) that represent more than 5% of the System’s net assets.
Interest Rate RiskInterest rate risk is the risk, that changes in interest rates over time, will adversely affect the fair value of an investment.Market or interest rate risk is the greatest risk faced by an investor in the debt securities market. The price of a debt securitytypically moves in the opposite direction of the change in interest rates. In accordance with the System’s InvestmentPolicy, the Retirement Board provides each of the System’s investment managers with a set of investment guidelines.These guidelines specify eligible investments, minimum diversification standards, and applicable investment restrictionsnecessary for diversification and risk control. Managers do not have authority to depart from their guidelines.
Foreign Currency RiskForeign currency risk is the risk that changes in exchange rates will adversely impact the fair value of an investment. TheSystem’s currency risk exposures, or exchange rate risk, primarily reside within the international equity investment holdings.The System expects these managers to maintain adequately diversified portfolios to limit foreign currency and security risk.Per the System’s policy, individual manager guidelines include the ranges of acceptable exposure.

Seattle City Em
ployees' Retirem
ent System Financial Section
12
Investment Type Fair Value Treasury Agency AAA AA A BBB BB B CCC Not
< 1 1 - 5 6 - 10 > 10 years & Below Rated
Fixed Income
U.S. Government
Treasuries 6,136,525 430,754 986,228 3,482,600 1,236,943 6,136,525
TIPS 5,887,893 546,552 5,341,341 5,887,893
Agencies 14,769,952 130,658 5,042,663 1,827,642 7,768,989 14,769,952
Mortgage Backed
Gov’t Pass Through 33,280,992 53,042 1,455,915 2,346,258 29,425,777 33,280,992
Corp Pass Through 25,868,213 1,250,063 170,293 24,447,857 24,486,908 27,461 284,421 59,897 432,129 76,135 501,262
CMO’s
Government CMO’s 5,217,959 7,284 203,045 1,905,262 3,102,368 5,217,959 - - - - - - - -
CDO’s & CLO’s
Corporate 21,602,237 7,665,341 13,936,896 1,671,647 878,737 7,111,515 11,940,338
Corporate
Bonds 55,097,187 1,549,205 18,239,085 16,765,862 18,543,035 1,738,590 6,078,694 9,804,319 17,062,685 7,441,158 6,574,939 2,639,057 3,757,745
Asset Backed 16,015,702 1,268,017 6,954,958 871,999 6,920,728 8,256,451 340,268 904,250 678,521 430,896 542,727 4,862,589
Private Placements 29,617,204 6,037,475 6,994,473 4,597,432 11,987,824 787,157 531,823 798,565 4,572,412 1,597,765 954,327 287,627 20,087,528
Developed Markets
Gov’t/Sovereign 228,109 149,256 78,853 78,853 149,256
Emerging Markets
Gov’t/Sovereign 519,544 519,544 - - - 519,544 - - 499,250 -
Convertible Bonds 3,359,059 3,359,059 3,359,059
Convertible Preferred 1,997,623 1,997,623 1,997,623
Derivatives -275,502 -275,502 -275,502
Index Funds 20,062,074 20,062,074 20,062,074
Mutual Funds 66,917 66,917 66,917
Short Term
Certificates of Deposit 334,404 334,404 334,404
Pooled Funds 55,125,281 55,125,281 55,125,281
294,911,373 90,146,291 41,275,686 40,258,094 123,231,302 12,024,418 53,268,903 36,940,753 6,978,246 11,870,408 23,921,052 17,013,463 8,148,128 3,427,946 121,318,056
Investment Maturities (in years)
The fixed income portfolio is primarily managed by three external money management firms, hired through an RFP process, to manage a diversified portfolio of fixed incomesecurities. Managers have agreed to a set of guidelines that provide ranges and limits for varying types of securities that may be held within the portfolio. A consultant ishired to measure performance and monitor the investment style. The Investment Committee reviews the consultants results quarterly.This schedule includes Short-term Investment Funds (STIF) and accrued income.Fixed Income $ 237,698,304STIF 55,231,479Accrued Income 1,981,590 (Fixed Income = $ 1,753,384 STIF = $ 228,206)Total $ 294,911,373
As of December 31, 2007, the fixed income portfolio of the Seattle City Employees' Retirement System had the following investments and maturities. Theportfolio is presented as rated by Standard & Poor's.

Financial Section Seattle City Employees' Retirement System
13
Note 6: Securities Lending Transactions
Gross income from securities lending transactions are recorded in the operating statements as well as the various fees paidto the institution that oversees the lending activity. The value of the collateral that is being held is represented as an assetand a liability on the Statement of Plan Net Assets.
Under the authority of State of Washington RCW 41.28.005 and Seattle Municipal Code 4.36.130, the System's Board ofAdministration adopted investment policies that define eligible investments, which include securities lending transactions.Through a custodial agent, the System participates in a securities lending program whereby securities are loaned for thepurpose of generating additional income to the System. The System lends securities from its investment portfolio on acollateralized basis to third parties, primarily financial institutions. The market value of the required collateral must meet orexceed 102% of the market value of the securities loaned, providing a margin against a decline in the market value of thecollateral. There are no restrictions on the amount of securities that may be loaned. The contractual agreement with theSystem's custodian provides indemnification in the event the borrower fails to return the securities lent or fails to pay theSystem income distribution by the securities' issuers while the securities are on loan. Cash and U.S. government securitieswere received as collateral for these loans. The System cannot pledge or sell collateral securities without a borrowerdefault. The System invests cash collateral received; accordingly, investments made with cash collateral appear as anasset. A corresponding liability is recorded as the System must return the cash collateral to the borrower upon theexpiration of the loan. There have been no losses resulting from a default, and the System did not have negative creditexposure at December 31, 2007.
2007 2007 2006 2006Fair Value of Fair Value of
Types Of Securities Lent: Securities Lent Collateral Securities Lent CollateralU.S. Government and Agencies $ 19,437,100 $ 19,634,375 $ 33,327,238 $ 34,050,525U.S. Corporate Fixed Income 11,004,460 11,362,855 14,308,619 14,662,532U.S. Equities 69,873,839 72,326,237 93,375,699 96,384,183 Totals $ 100,315,399 $ 103,323,467 $141,011,556 $145,097,240
Collateral Report: 2007 2006U.S. Corporate Obligations $ 27,500,852 $ 17,499,928Bank Obligations 17,998,543 16,000,000Repurchase Agreements 470,401 84,852,821Asset Backed Securities 14,358,869 18,741,771Certificates of Deposits 42,994,802Euro Clear Floater 8,002,720 Total Collateral $ 103,323,467 $ 145,097,240

Seattle City Employees' Retirement System Financial Section
REQUIRED SUPPLEMENTARY INFORMATION
SCHEDULE OF FUNDING PROGRESS(Dollar amounts in millions)
Actuarial Actuarial Actuarial Accrued Unfunded UAAL as aValuation Value Liabilities (AAL) AAL Funded Covered Percentage of
Date of Assets - Entry Age (1) (UAAL) (2) Ratio Payroll (3) Covered Payroll .January 1, (a) (b) (b - a) (a / b) (c) ((b - a) / c)
1999 $ 1,375.0 $ 1,326.6 $ (48.4) 103.6 $ 370.4 (13.1)2000 1,582.7 1,403.1 (179.6) 112.8 383.6 (46.8)2001 (4) 1,493.1 1,490.3 (2.8) 100.2 405.0 (0.7)2002 1,383.7 1,581.4 197.7 87.5 405.1 48.82004 1,527.5 1,778.9 251.4 85.9 424.7 59.22006 1,791.8 2,017.5 225.7 88.8 447.0 50.5
(1) Actuarial present value of benefits less actuarial present value of future normal costs based on Entry Age ActuarialCost Method.
(2) Actuarial accrued liabilities less actuarial value of assets.(3) Covered Payroll includes compensation paid to all active employees on which contributions are calculated.(4) These numbers were provided by an actuarial study, rather than a full valuation.
SCHEDULE OF EMPLOYER CONTRIBUTIONS(Dollar amounts in millions)
Year Ended Actual Employer PercentageDecember 31 Contributions Contributed
2002 $ 36.6 1002003 34.2 1002004 36.8 1002005 35.8 1002006 38.0 1002007 40.2 100
(For additional information regarding employer contributions, please see the notes to the financial statements.)
Additional information as of the latest actuarial valuation follows:
Valuation date 1/1/2006Actuarial cost method Entry ageAmortization method Level percentRemaining amortization period 30.2 yearsAmortization period OpenAsset valuation method Market
Actuarial assumptions:Investment rate of return * 7.75 %Projected salary increases * 4.00 %Post-retirement benefit increases 0.67 % - 1.50 %
* Includes inflation at 3.50 %
14

Financial Section Seattle City Employees' Retirement System
SEATTLE CITY EMPLOYEES’ RETIREMENT SYSTEM SCHEDULE OF ADMINISTRATIVE EXPENSES For the Years Ended December 31, 2007 and 2006
Budget Actual Expenses2007 2007 2006
Personnel ServicesSalaries $ 841,598 $ 637,399 $ 589,816Benefits 288,200 193,842 205,847
Total Personnel Services 1,129,798 831,241 795,663
Maintenance and OperationsInvestment Services 6,163,284 4,204,927 3,733,796Actuarial Services 74,458 70,000 11,588Audit Services 52,000 52,000 43,391Legal Services 85,847 77,781 90,625Miscellaneous Services 15,589 41,392 18,137Office Rent 138,267 42,884 119,819Intra Gov't & Data Processing 596,486 557,481 602,727Office Supplies and Expenses 143,458 58,150 59,411Postage 51,270 46,379 60,285Telephone 13,311 15,480 13,733Travel 33,000 19,770 12,092Training 30,464 12,245 9,299Depreciation 345 345
Total Maintenance and Operations 7,397,434 5,198,834 4,775,248
Securities Lending Fees (Investment Expense) 6,350,048 5,144,514
Total Administrative Expenses $ 8,527,232 $12,380,123 $ 10,715,425
(This schedule includes investment services and securities lending as part of administrative expenses.)
15

Seattle City Employees' Retirement System Financial Section
SEATTLE CITY EMPLOYEES’ RETIREMENT SYSTEM SCHEDULE OF INVESTMENT EXPENSES For the Year Ended December 31, 2007
Investment Services
Advent Captial $ 94,163Barclays 184,631Bear Stearns 178,543Boston Company 261,156Calamos 232,572Capital Management Associates 181,950Dimensional Fund Advisors 732,116Earnest 256,765Evergreen 171,115ING 80,916Maxam 594,772Pugh Capital 59,518Reams 116,412Snow Capital 236,372Washington Capital 121,697Western Asset 355,394Wellington 91,244
3,949,336
Performance Measurement
Pension Consulting Alliance 96,250Wurts & Associates 59,500
Custodial Services
Bank of New York 99,841
Securities Lending Services
Bank of New York 6,350,048
Total Investment Expenses $ 10,554,975
16

Financial Section Seattle City Employees' Retirement System
Market
Short-term Investments $ 66,939,531
Domestic stocks:Transition Account - 785 47,620,597Dimensional Fund Advisors 184,331,945Calamos 24,325,728Capital Management Associates 31,977,787Evergreen 36,910,594In-house Portable Alpha Test Program 29,559,919Snow Capital 56,703,605Earnest 34,285,643ING 19,810,063Maxam 109,450,307NCM -72Blackrock - Alpha Transport 9,668,435Barclays - Russell 3000 Fund 129,476,902Barclays - S&P 500 Fund 49,722,299
763,843,752
International stocks:Lazard 68,796MFS 1,921,126Boston Company 193,669Dimensional Fund Advisors - small cap 106,076,861Dimensional Fund Advisors - large cap 62,425,917Barclays - EAFE Fund 232,279,621
402,965,990
Fixed Income:Transition Account 3,860,744Advent Capital 10,259,716Pugh Capital 28,282,334Reams 53,787,260Western Asset 93,139,730Barclays - Intermediate Gov't/Corp Fund 20,062,074In-house - BONY 28,306,446
237,698,304
17
SEATTLE CITY EMPLOYEES’ RETIREMENT SYSTEMSCHEDULE OF CASH AND INVESTMENTS
December 31, 2007
Market
Real estate:J.P. Morgan - commingled funds 175,641,488J.P. Morgan Alternative Property Fund 16,314,924American Realty 11,906,830Washington Capital 13,152,846Carlyle Realty IV 13,980,482TA Associates VI 10,822,056TA Associates VII 15,678,640TA Associates VIII 13,873,357Hearthstone III 926,772RREEF - West VI 38,046RREEF - REIT II 14,310,735
286,646,176
Alternative / Venture capital:Advent Capital 12,146,571Aetos 17,073,062Attalus 18,763,289Coast Diversified Fund 14,067,860Epsilon Global Value II 22,652,443Tremont Diversified 26,465,503Phoenix Partners - IV 4,059,023Imperium Renewables 10,000,000Quellos Global Restructuring 18,455,354Quellos Co-Investment 8,973,068Quellos Strategic Partners 81,133,436
233,789,609
Mezzanine debt:Babson Tower Square II 11,862,565Bison Capital 5,807,573Carlyle Mezzanine Partners 14,363,960Capri Select Income II 9,775,980Capital Point Partners 2,599,973Carbon Capital II 14,366,895Lehman Brothers Real Estate Partners 11,624,335MKA 16,292,364Nogales Investment Partners 51,352Oaktree Mezzanine II 11,706,405Smith Whiley Pelham Fund III 4,580,224TCW 11,430,994
114,462,620 Market
Short-term Investments $ 66,939,531Domestic stocks 763,843,752International stocks 402,965,990Fixed income 237,698,304Real estate 286,646,176Alternative / venture capital 233,789,609Mezzanine debt 114,462,620Total Investment Holdings 2,106,345,982
Total Cash and Cash Equivalents 14,831,195Total Securities Lending Collateral 103,323,467
Total Investments and Cash $ 2,224,500,644

[Blank]


Seattle City Employees' Retirement System Actuarial Section
sera0217e.doc - 1 17 0003 SER 7 / 17.003.SER.10.2007 / KIS/NJC/nlo
1301 Fifth Avenue, Suite 3800
Seattle, WA 98101-2605
Tel +1 206 624.7940
Fax +1 206 623.3485
www.milliman.com
June 11, 2007
Board of Administration Seattle City Employees' Retirement System 801 Third Avenue, Suite 300 Seattle, Washington 98104
Re: Actuarial Valuation Data
Dear Members of the Board:
The actuarial valuation of the Seattle City Employees’ Retirement System as of January 1, 2006 was performed by your prior retained actuary, Buck Consultants, and is presented in a separate report issued May 24, 2006. The next scheduled actuarial valuation will be as of January 1, 2008.
The financing objective of the System is to establish contribution rates that tend to remain level as a percentage of payroll. Since January 1, 1984, the recommended total contribution rates were 16.94% of covered salaries: 8.91% of salary for the City and 8.03% of salary for employees. Effective January 1, 1999, the employer rate was reduced to 8.03% and the total contribution rate is now 16.06%. The January 1, 2006 valuation shows the current contribution rates are sufficient to pay the normal cost and amortize the Unfunded Actuarial Accrued Liability over 18.0 years.
The Unfunded Actuarial Accrued Liability will be redetermined as of January 1, 2008, after the completion of the next actuarial valuation. The actuarial assumptions used in the most recent actuarial valuation are summarized in Exhibit 1. Exhibit 1 also discusses the method used to value assets.
The results for the 2004 and 2006 valuations were determined by Buck and are being reported by us without adjustment. Although we did not perform these valuations, we have completed an independent review and believe they are reasonable.
The assumptions and methods used for funding purposes meet the parameters set for the disclosures presented in the financial section by Government Accounting Standards Board (GASB) Statement No. 25, Financial Reporting for Defined Benefit Pension Plans and Note Disclosures for Defined Contribution Plans. The assumptions used in the valuation were determined by Buck based on the past experience of the System. Nevertheless, the emerging costs of the System will vary from those presented in this report to the extent that actual experience differs from that projected by the actuarial assumptions.
Exhibits 1-10 are enclosed. Milliman is responsible for these exhibits, except where previously noted.
20

Actuarial Section Seattle City Employees' Retirement System
Members of the Board June 11, 2007 Page 2
sera0217e.doc - 2 17 0003 SER 7 / 17.003.SER.10.2007 / KIS/NJC/nlo
Specifically, they are:
Exhibit 1 Summary of Actuarial Assumptions and Methods
Exhibit 2 Schedule of Active Member Valuation Data
Exhibit 3 Schedule of Retirees and Beneficiaries
Exhibit 4 GASB Statement No. 27 Annual Pension Cost and Net Pension Obligation
Exhibit 5 Schedule of Funding Progress Exhibit 6 Solvency Test
Exhibit 7 Schedule of Employer Contributions
Exhibit 8 GASB Statement No. 27 Five-Year Trend Information
Exhibit 9 GASB Statement No. 27 Annual Development of Pension Cost Exhibit 10 Analysis of Financial Experience
Sincerely,
Nick J. Collier, ASA, EA, MAAA Consulting Actuary
Karen I. Steffen, FSA, EA, MAAA Consulting Actuary
KIS/NJC/nlo
Enclosures
cc: Mr. Mel Robertson
21

Seattle City Employees' Retirement System Actuarial Section
Exhibit 1
This work product was prepared solely for the City of Seattle. It may not be appropriate to use for other purposes. Milliman does not intend to benefit and assumes no duty or liability to other parties who receive this work.
1
sera0217e.doc 17 0003 SER 7 / 17.003.SER.10.2007 / KIS/NJC/nlo
SEATTLE CITY EMPLOYEES' RETIREMENT SYSTEM
Summary Of Actuarial Assumptions And Methods
1. Investment return
The annual rate of investment earnings of the assets of the System is assumed to be 7.75%. This rate is compounded annually and is net of investment expenses (adopted 1/1/2004).
2. Actuarial value of assets All assets are valued at market as of the valuation date (adopted 1/1/1996). 3. Actuarial Assumptions
The actuarial assumptions and methods were adopted by the Board based upon recommendations from the retained actuary. The actuarial assumptions are based on periodic studies of the System’s actual experience.
4. Mortality
a. Among contributing members (adopted 1/1/1997)
Men: 50% of rates from the 1994 Group Annuity Mortality (GAM) Table for Males, with ages set forward one year.
Women: 75% of the rates from the 1994 GAM Table for Females, with
ages set forward one year.
b. Among service retired members and beneficiaries
Men: 1994 GAM Table for Males, with ages set forward one year (adopted 1/1/1997)
Women: 1994 GAM Table for Females, with no age adjustment
(adopted 1/1/2006)
c. Among disabled members (adopted 1/1/1997)
1992 Railroad Retirement Board Disabled Annuitants Ultimate Mortality Table, with ages set back four years (minimum rate of 2%).
22

Actuarial Section Seattle City Employees' Retirement System
Exhibit 1 (continued)
This work product was prepared solely for the City of Seattle. It may not be appropriate to use for other purposes. Milliman does not intend to benefit and assumes no duty or liability to other parties who receive this work.
2
sera0217e.doc 17 0003 SER 7 / 17.003.SER.10.2007 / KIS/NJC/nlo
5. Retirement
Annual rates among persons eligible for a service retirement are illustrated in the following table (adopted 1/1/1999).
Rate of Retirement
Men Women
Age
Eligible for Reduced Benefits
First Year Eligible for
Full Benefits
Thereafter
Eligible for Reduced Benefits
First Year Eligible for
Full Benefits
Thereafter
50 6.0% 15.0% 12.0% 5.0% 10.0% 10.0% 55 6.0 15.0 12.0 5.0 12.0 12.0 60 10.0 20.0 15.0 10.0 18.0 20.0 65 N/A 50.0 50.0 N/A 60.0 60.0
Immediate retirement is assumed for members who have attained age 70.
6. Disability retirement
Annual rates are illustrated below:
Age Rate of Disability Retirement
Men Women 22 -% -% 32 0.05 0.05 42 0.07 0.07 52 0.10 0.10
(Adopted 1/1/1999)
7. Other terminations of employment
The annual rates of termination based on five years of service are illustrated below.
Rate of Termination
Duration Men Women
1 10.0% 10.5% 3 8.0 8.5 5 6.0 7.1 10 4.0 4.7 15 2.7 2.4 20 1.5 1.8
(Adopted 1/1/1999)
23

Seattle City Employees' Retirement System Actuarial Section
Exhibit 1 (continued)
This work product was prepared solely for the City of Seattle. It may not be appropriate to use for other purposes. Milliman does not intend to benefit and assumes no duty or liability to other parties who receive this work.
3
sera0217e.doc 17 0003 SER 7 / 17.003.SER.10.2007 / KIS/NJC/nlo
8. Vesting
The following table illustrates the probability that vested terminating members will elect to receive deferred benefits instead of withdrawing accumulated contributions.
Probability of Retirement among
Vested Terminating Members
Age Men Women
22 2.0% 2.0% 32 20.0 20.0 42 35.0 35.0 52 42.0 42.0
(Adopted 1/1/1999)
9. Future salaries
In general, the total annual rates of salary increase include an assumed 4.5% per annum wage inflation rate in the active member payroll, plus increases due to promotions and longevity. The total rates assumed for salary increases for individual members are illustrated below.
Annual Rate of Increase
Years of Service Male Female
1 9.77% 9.77% 2 8.73 9.73 3 7.68 7.68 4 6.64 6.64 5 6.11 6.11
10 4.86 4.86 15 4.39 4.39 20 4.13 4.29 25 4.13 4.29 30 4.13 4.29
35 or more 4.13 4.29
(Adopted 1/1/1999)
24
Actuarial Section Seattle City Employees' Retirement System
Exhibit 1 (continued)
This work product was prepared solely for the City of Seattle. It may not be appropriate to use for other purposes. Milliman does not intend to benefit and assumes no duty or liability to other parties who receive this work.
4
sera0217e.doc 17 0003 SER 7 / 17.003.SER.10.2007 / KIS/NJC/nlo
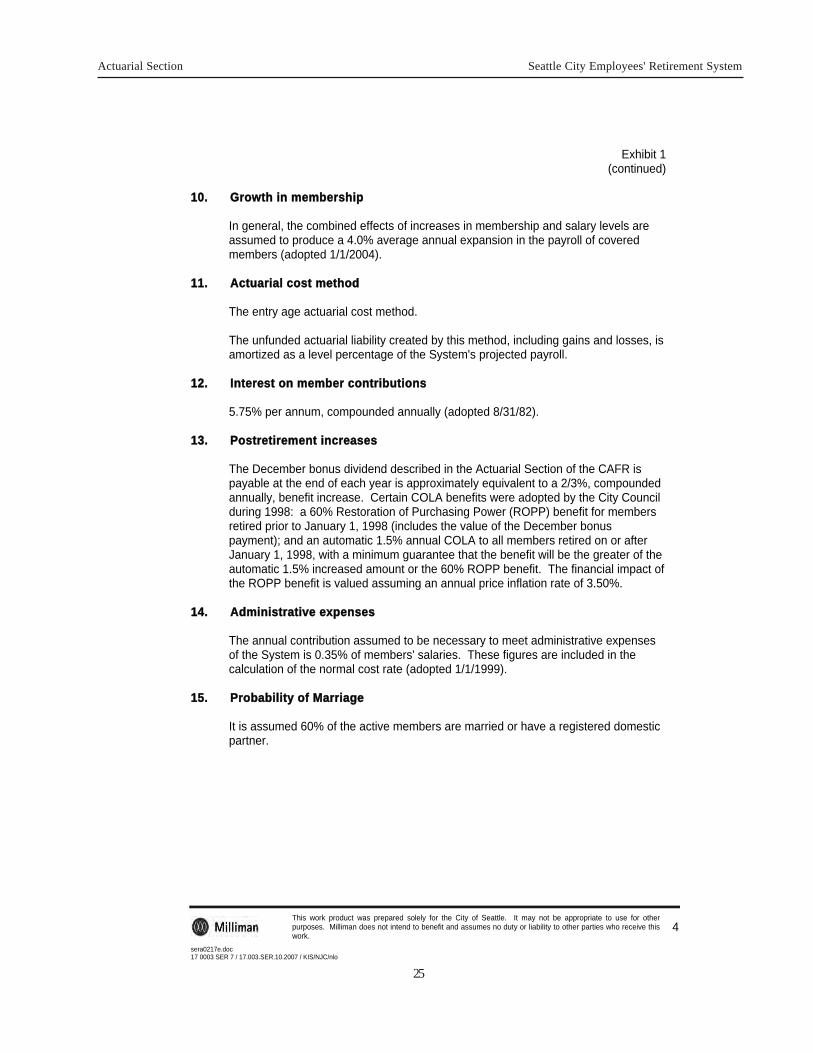
10. Growth in membership
In general, the combined effects of increases in membership and salary levels are assumed to produce a 4.0% average annual expansion in the payroll of covered members (adopted 1/1/2004).
11. Actuarial cost method
The entry age actuarial cost method.
The unfunded actuarial liability created by this method, including gains and losses, is amortized as a level percentage of the System's projected payroll.
12. Interest on member contributions
5.75% per annum, compounded annually (adopted 8/31/82). 13. Postretirement increases
The December bonus dividend described in the Actuarial Section of the CAFR is payable at the end of each year is approximately equivalent to a 2/3%, compounded annually, benefit increase. Certain COLA benefits were adopted by the City Council during 1998: a 60% Restoration of Purchasing Power (ROPP) benefit for members retired prior to January 1, 1998 (includes the value of the December bonus payment); and an automatic 1.5% annual COLA to all members retired on or after January 1, 1998, with a minimum guarantee that the benefit will be the greater of the automatic 1.5% increased amount or the 60% ROPP benefit. The financial impact of the ROPP benefit is valued assuming an annual price inflation rate of 3.50%.
14. Administrative expenses
The annual contribution assumed to be necessary to meet administrative expenses of the System is 0.35% of members' salaries. These figures are included in the calculation of the normal cost rate (adopted 1/1/1999).
15. Probability of Marriage
It is assumed 60% of the active members are married or have a registered domestic partner.
25

Seattle City Employees' Retirement System Actuarial Section
Exhibit 2
This work product was prepared solely for the City of Seattle. It may not be appropriate to use for other purposes. Milliman does not intend to benefit and assumes no duty or liability to other parties who receive this work.
5
sera0217e.doc 17 0003 SER 7 / 17.003.SER.10.2007 / KIS/NJC/nlo
SEATTLE CITY EMPLOYEES' RETIREMENT SYSTEM
Schedule Of Active Member Valuation Data
Valuation
Date
Number Annual Valuation
Payroll* Average
Annual Pay Annualized % of
Increase in Average Pay
8/31/1982 6,839 $170,737,000 $24,965 - % 1/1/1984 6,702 176,414,000 26,322 4.0 1/1/1986 6,797 187,435,000 27,576 2.4 1/1/1988 7,049 203,230,000 28,831 2.3 1/1/1990 7,225 230,364,000 31,884 5.2
1/1/1992 7,942 264,564,000 33,312 2.2 1/1/1994 8,025 287,316,000 35,803 3.7 1/1/1996 8,078 314,448,000 38,926 4.3 1/1/1997 7,909 312,744,000 39,543 1.6 1/1/1998 7,926 329,028,000 41,512 5.0
1/1/1999 7,779 333,984,000 42,934 3.4 1/1/2000 8,669 382,620,000 44,137 2.8 1/1/2002 8,758 418,908,000 47,831 8.4 1/1/2004 8,382 441,562,000 52,680 10.1 1/1/2006 8,521 468,096,000 54,934 4.3
*Actuarial Valuation payroll is computed as the sum of the annualized salaries for all active members
and differs from the actual payroll shown in the financial section of the annual report.
26

Actuarial Section Seattle City Employees' Retirement System
Exhibit 3
This work product was prepared solely for the City of Seattle. It may not be appropriate to use for other purposes. Milliman does not intend to benefit and assumes no duty or liability to other parties who receive this work.
6
sera0217e.doc 17 0003 SER 7 / 17.003.SER.10.2007 / KIS/NJC/nlo
Schedule Of Retirees And Beneficiaries**
Valuation Date
Number
Annual
Allowances
Average Annual
Allowances
Annualized % of Increase in Average
Allowances
8/31/1982 4,058 $19,942,000 $4,914 - % 1/1/1984 4,276 24,060,000 5,627 10.7 1/1/1986 4,424 26,329,000 5,951 2.8 1/1/1988 4,524 30,926,000 6,836 7.2 1/1/1990 4,809 35,541,000 7,391 4.0
1/1/1992 4,663 37,595,000 8,062 4.4 1/1/1994 4,615 40,233,000 8,718 4.0 1/1/1996 4,619 44,271,000 9,585 4.9 1/1/1997 4,661 47,594,000 10,211 6.5 1/1/1998 4,649 50,310,000 10,822 6.0
1/1/1999 4,644 52,481,000 11,301 4.4 1/1/2000 4,681 55,542,000 11,865 8.0 1/1/2002 4,733 61,801,000 13,058 10.1 1/1/2004 4,876 74,341,000 15,246 16.8 1/1/2006 5,011 83,988,000 16,761 9.9
** Information regarding the number of retirees and beneficiaries added to and removed from the roll was not used in the actuarial valuations.
27

Seattle City Employees' Retirement System Actuarial Section
Exhibit 4
This work product was prepared solely for the City of Seattle. It may not be appropriate to use for other purposes. Milliman does not intend to benefit and assumes no duty or liability to other parties who receive this work.
7
sera0217e.doc 17 0003 SER 7 / 17.003.SER.10.2007 / KIS/NJC/nlo
SEATTLE CITY EMPLOYEES' RETIREMENT SYSTEM
GASB Statement No. 27 Annual Pension Cost And Net Pension Obligation
Fiscal Year Ended December 31
2005 2006
1a Total Normal Cost Rate 13.05% 12.50%
1b Employee Contribution Rate 8.03% 8.03%
1c Employer Normal Cost Rate (1a – 1 b) 5.02% 4.47%
2a Total Employer Contribution Rate 8.03% 8.03%
2b Amortization Payment Rate (2a – 1 c) 3.01% 3.56%
2c Amortization Period 30.2 18.0
2d GASB 27 Amortization Rate 3.01% 3.56%
3 Total Annual Required Contribution (ARC) Rate (1c + 2d) 8.03% 8.03%
4 Covered Employee Payroll* $447,040,411 $472,470,212
5a ARC (3 x 4) $35,897,345 $37,939,358
5b Interest on Net Pension Obligation (NPO) (5,910,271) (6,049,964)
5c ARC Adjustment 4,107,791 5,865,455
5d Annual Pension Cost (APC) (5a + 5b + 5c) $34,094,865 $37,754,849
6 Employer Contribution** $35,897,345 $37,939,358
7a Change in NPO (5d - 6) $(1,802,480) $(184,509)
7b NPO at Beginning of Year (76,261,567) (78,064,047)
7c NPO at End of Year (7a + 7b) $(78,064,047) $(78,248,556) * Covered payroll includes compensation paid to all active employees on which contributions were made in
the year preceding the valuation date.
** Includes contributions to the Death Benefit System for 2001.
28

Actuarial Section Seattle City Employees' Retirement System
Exh
ibit 5
Th
is w
ork
pro
du
ct
was p
rep
are
d s
ole
ly f
or
the
City o
f S
ea
ttle
. I
t m
ay n
ot
be
ap
pro
pria
teto
use f
or
oth
er
pu
rposes.
Mill
ima
n d
oe
s n
ot
inte
nd
to
be
nefit
an
d a
ssu
mes n
o d
uty
or
liab
ility
to o
the
r p
art
ies w
ho
rece
ive
th
is w
ork
. 8
se
ra0
21
7e.d
oc
17
00
03
SE
R 7
/ 1
7.0
03
.SE
R.1
0.2
007
/ K
IS/N
JC
/nlo
SE
AT
TL
E C
ITY
EM
PL
OY
EE
S'
RE
TIR
EM
EN
T S
YS
TE
M
Sc
he
du
le O
f F
un
din
g P
rog
res
s
(Dolla
r A
mounts
in M
illio
ns)
Actu
aria
l V
alu
ation D
ate
Ja
nu
ary
1
A
ctu
arial V
alu
e o
f A
sse
ts
A
ctu
aria
l A
ccru
ed
Lia
bili
tie
s (
AA
L)
(1)
Un
fund
ed
A
ctu
aria
l A
ccru
ed
Lia
bili
tie
s (
UA
AL
) (2
)
F
un
ded
R
atio
C
overe
d
Payro
ll (3
)
UA
AL a
s
a P
erc
enta
ge o
f C
overe
d P
ayro
ll
1986
$ 395.7
$ 561.3
$ 165.6
70.5
%
$ 182.0
91.0
%
19
88
4
45
.4
59
5.3
1
49
.9
74
.8
19
9.0
7
5.3
19
90
5
58
.8
73
7.9
1
79
.1
75
.7
21
2.3
8
4.4
19
92
6
60
.0
81
0.5
1
50
.5
81
.4
23
9.4
6
2.9
19
94
7
81
.8
92
6.2
1
44
.4
84
.4
29
1.8
4
9.5
19
96
9
80
.2
1,0
19
.7
39
.5
96
.1
31
0.6
1
2.7
19
97
1
,09
4.8
1
,08
7.3
(7
.5)
10
0.7
3
16
.9
(2.4
)
19
98
(4)
1,2
24.6
1,2
66.7
42.1
96.7
341.5
12.3
19
99
1
,37
5.0
1
,32
6.6
(4
8.4
) 1
03
.6
37
0.4
(1
3.1
)
20
00
1
,58
2.7
1
,40
3.1
(1
79
.6)
11
2.8
3
83
.6
(46
.5)
20
02
1
,38
3.7
1
,58
1.4
1
97
.7
87
.5
40
5.1
4
8.8
20
04
1
,52
7.5
1
,77
8.9
2
51
.4
85
.9
42
4.7
5
9.2
20
06
1
,79
1.8
2
,01
7.5
2
25
.8
88
.8
44
7.0
5
0.5
(1)
Actu
arial pre
sent
valu
e o
f benefits
less a
ctu
arial pre
sent
valu
e o
f fu
ture
norm
al costs
based o
n E
ntr
y A
ge A
ctu
arial C
ost
Meth
od.
(2)
Actu
aria
l accru
ed lia
bili
ties less a
ctu
aria
l valu
e o
f assets
, F
undin
g E
xcess if
negative.
(3)
Covere
d P
ayro
ll in
clu
des c
om
pensatio
n p
aid
to a
ll active e
mplo
yees o
n w
hic
h c
ontr
ibutions a
re c
alc
ula
ted.
(4)
Reflects
incre
ased C
OLA
benefits
adopte
d b
y t
he C
ity C
ou
ncil
after
the v
alu
ation w
as c
om
ple
ted
.
29
Seattle City Employees' Retirement System Actuarial Section
Exh
ibit 6
Th
is w
ork
pro
du
ct
was p
rep
are
d s
ole
ly f
or
the
City o
f S
ea
ttle
. I
t m
ay n
ot
be
ap
pro
pria
teto
use f
or
oth
er
pu
rposes.
Mill
ima
n d
oe
s n
ot
inte
nd
to
be
nefit
an
d a
ssu
mes n
o d
uty
or
liab
ility
to o
the
r p
art
ies w
ho
rece
ive
th
is w
ork
. 9
se
ra0
21
7e.d
oc
17
00
03
SE
R 7
/ 1
7.0
03
.SE
R.1
0.2
007
/ K
IS/N
JC
/nlo
SE
AT
TL
E C
ITY
EM
PL
OY
EE
S’
RE
TIR
EM
EN
T S
YS
TE
M
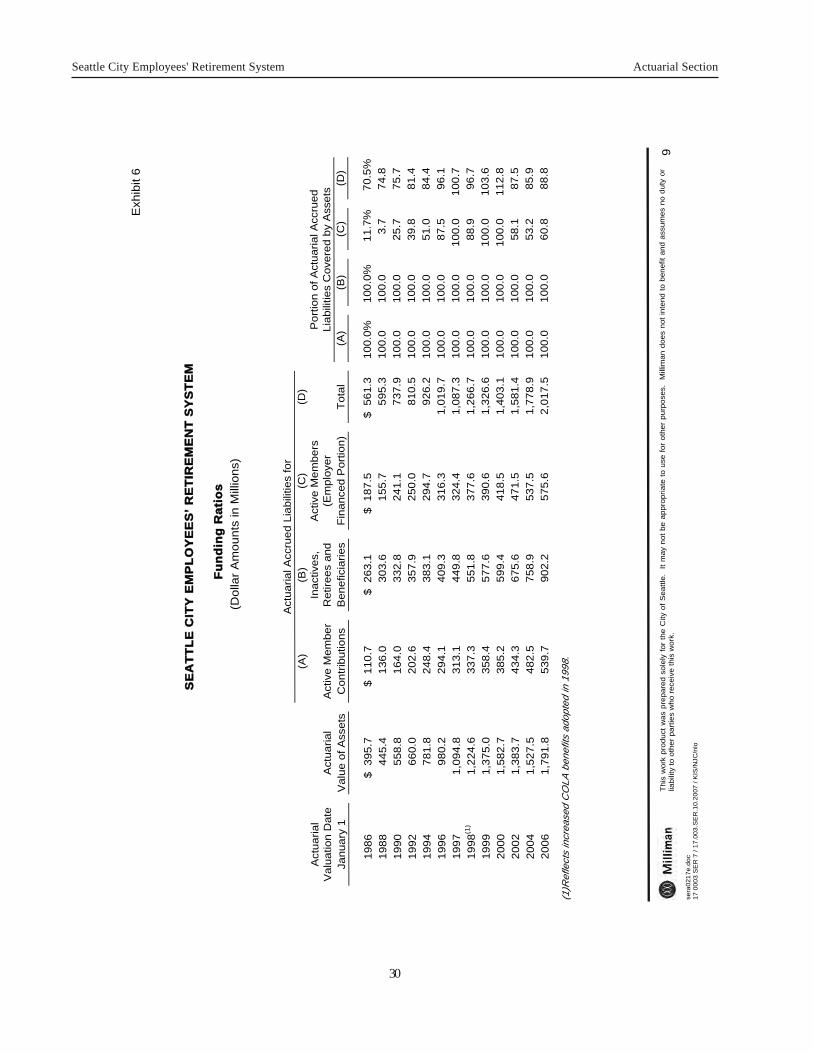
Fu
nd
ing
Ra
tio
s
(Do
llar
Am
ou
nts
in
Mill
ion
s)
A
ctu
aria
l A
ccru
ed
Lia
bili
ties fo
r
(A)
(B)
(C)
(D)
Actu
arial
Inactives,
Active M
em
be
rs
P
ort
ion
of A
ctu
aria
l A
ccru
ed
Valu
ation D
ate
A
ctu
arial
Active M
em
be
r R
etire
es a
nd
(Em
plo
yer
Lia
bili
ties C
overe
d b
y A
ssets
Ja
nu
ary
1
Valu
e o
f A
ssets
C
ontr
ibutions
Beneficia
ries
Fin
anced P
ort
ion)
Tota
l (A
) (B
) (C
) (D
)
1986
$ 395.7
$ 110.7
$ 263.1
$ 187.5
$ 561.3
100.0
%
100.0
%
11.7
%70.5
%
19
88
4
45
.4
13
6.0
3
03
.6
15
5.7
5
95
.3
10
0.0
1
00
.0
3.7
7
4.8
19
90
5
58
.8
16
4.0
3
32
.8
24
1.1
7
37
.9
10
0.0
1
00
.0
25
.7
75
.7
19
92
6
60
.0
20
2.6
3
57
.9
25
0.0
8
10
.5
10
0.0
1
00
.0
39
.8
81
.4
19
94
7
81
.8
24
8.4
3
83
.1
29
4.7
9
26
.2
10
0.0
1
00
.0
51
.0
84
.4
19
96
9
80
.2
29
4.1
4
09
.3
31
6.3
1
,01
9.7
1
00
.0
10
0.0
8
7.5
9
6.1
19
97
1
,09
4.8
3
13
.1
44
9.8
3
24
.4
1,0
87
.3
10
0.0
1
00
.0
10
0.0
1
00
.7
19
98
(1)
1,2
24
.6
33
7.3
5
51
.8
37
7.6
1
,26
6.7
1
00
.0
10
0.0
8
8.9
9
6.7
19
99
1
,37
5.0
3
58
.4
57
7.6
3
90
.6
1,3
26
.6
10
0.0
1
00
.0
10
0.0
1
03
.6
20
00
1
,58
2.7
3
85
.2
59
9.4
4
18
.5
1,4
03
.1
10
0.0
1
00
.0
10
0.0
1
12
.8
20
02
1
,38
3.7
4
34
.3
67
5.6
4
71
.5
1,5
81
.4
10
0.0
1
00
.0
58
.1
87
.5
20
04
1
,52
7.5
4
82
.5
75
8.9
5
37
.5
1,7
78
.9
10
0.0
1
00
.0
53
.2
85
.9
20
06
1
,79
1.8
5
39
.7
90
2.2
5
75
.6
2,0
17
.5
10
0.0
1
00
.0
60
.8
88
.8
(1)R
eflects
incre
ased C
OLA
benefits
adopte
d in 1
998.
30

Actuarial Section Seattle City Employees' Retirement System
Exh
ibit 7
Th
is w
ork
pro
du
ct
was p
rep
are
d s
ole
ly f
or
the
City o
f S
ea
ttle
. I
t m
ay n
ot
be
ap
pro
pria
te t
o u
se f
or
oth
er
pu
rpo
ses.
Mill
ima
n d
oe
s n
ot
inte
nd
to
be
nefit
an
d a
ssu
mes
no
duty
or
liab
ility
to o
the
r p
art
ies w
ho
rece
ive
th
is w
ork
. 1
0
se
ra0
21
7e.d
oc
17
00
03
SE
R 7
/ 1
7.0
03
.SE
R.1
0.2
007
/ K
IS/N
JC
/nlo
SE
AT
TL
E C
ITY
EM
PL
OY
EE
S’
RE
TIR
EM
EN
T S
YS
TE
M
Sc
he
du
le O
f E
mp
loy
er
Co
ntr
ibu
tio
ns
(Do
llar
Am
ou
nts
in
Mill
ion
s)
F
iscal Y
ear
Endin
g
Dece
mber
31
C
overe
d E
mplo
yee
Payro
ll (1
)
A
ctu
al E
mplo
yer
Contr
ibutions (
2)
A
ctu
al E
mplo
yer
Contr
ibution %
(2
)
A
nn
ua
l R
eq
uire
d
Contr
ibution (
AR
C)
% (
3)
P
erc
enta
ge o
f A
RC
Contr
ibute
d
1992
$280.4
$25.1
8.9
1%
8.9
1%
100%
1
99
3
29
1.8
2
6.1
8
.91
8
.91
1
00
1
99
4
29
8.0
2
6.7
8
.91
8
.91
1
00
1
99
5
31
0.6
2
7.8
8
.91
8
.91
1
00
1
99
6
31
6.9
2
8.4
8
.91
8
.91
1
00
1
99
7
31
6.3
2
8.3
8
.91
8
.91
1
00
1
99
8(4
) 3
41
.5
30
.6
8.9
1
8.9
1
10
0
19
99
3
70
.4
29
.7
8.0
3
4.5
0
17
8
20
00
3
83
.6
30
.8
8.0
3
4.5
0
17
8
20
01
4
05
.1
32
.7
8.0
3
3.0
4
26
4
20
02
4
54
.5
36
.6
8.0
3
3.0
4
26
4
20
03
4
24
.7
34
.2
8.0
3
8.0
3
10
0
20
04
4
56
.8
36
.7
8.0
3
8.0
3
10
0
20
05
4
47
.0
35
.9
8.0
3
8.0
3
10
0
20
06
4
72
.5
37
.9
8.0
3
8.0
3
10
0
(1)
Co
mp
ute
d a
s t
he d
olla
r a
mou
nt
of
the a
ctu
al em
plo
yer
contr
ibution m
ad
e a
s a
perc
enta
ge o
f payro
ll div
ided b
y t
he c
on
trib
utio
n r
ate
, expre
ssed a
s a
perc
enta
ge o
f payro
ll.
(2)
The a
ctu
al and r
equir
ed e
mplo
yer
contr
ibutions a
re e
xpre
ssed a
s a
perc
enta
ge o
f p
ayro
ll, a
fter
firs
t re
cogniz
ing t
he $
12 p
er
em
plo
ye
e a
ssessm
ent
ma
de f
or
the d
eath
ben
efits
. T
his
asse
ssm
ent
per
em
plo
yee is inclu
ded in the a
ctu
al em
plo
yer
contr
ibutions r
ep
ort
ed a
nd h
as b
ee
n p
revio
usly
recogniz
ed b
y t
he
actu
ary
in d
ete
rmin
ing t
he A
RC
.
(3)
The C
ity m
ake
s e
mp
loyer
con
trib
utio
ns a
s a
perc
enta
ge o
f actu
al payro
ll as s
et
in t
he C
ity O
rdin
ance.
Thus,
as long a
s t
he p
erc
enta
ge e
qu
als
the
perc
enta
ge
required b
y t
he m
ost
recent
actu
aria
l valu
ation,
the d
olla
r a
mo
unt
of
the A
nnual R
equired C
ontr
ibutions (
AR
C)
is e
qual to
the a
ctu
al dolla
r am
ount
of
the
em
plo
yer
contr
ibutions.
S
ince t
he C
ity h
ad a
lways c
ontr
ibute
d o
n a
basis
equa
l to
the A
RC
prior
to 1
99
9,
the A
nnu
al P
ensio
n C
ost
(AP
C)
was e
qual to
the
Annu
al R
equ
ired C
ontr
ibution
s (
AR
C)
and t
he N
et
Pensio
n O
blig
ation (
NP
O)
was z
ero
. T
he C
ity O
rdin
ance d
oes n
ot
perm
it a
reduction in t
he e
mp
loyer
contr
ibution r
ate
less t
han t
he e
mplo
yee c
ontr
ibution r
ate
. T
hus,
the C
ity’s
contr
ibutions e
xceed
ed t
he A
RC
for
199
9-2
001 a
nd r
esulted in a
negative N
PO
am
ount.
(4)
AR
C r
eflects
the incre
ased C
OLA
be
ne
fits
ad
op
ted
in
19
98
.
31

Seattle City Employees' Retirement System Actuarial Section
Exhibit 8
This work product was prepared solely for the City of Seattle. It may not be appropriate to use for other purposes. Milliman does not intend to benefit and assumes no duty or liability to other parties who receive this work.
11
sera0217e.doc 17 0003 SER 7 / 17.003.SER.10.2007 / KIS/NJC/nlo
SEATTLE CITY EMPLOYEES' RETIREMENT SYSTEM
GASB Statement No. 27 Five-Year Trend Information
Fiscal Year Ending
Annual
Pension Cost (APC)
Contribution as a
Percentage of APC
Net Pension Obligation
(NPO)
December 31, 2002 $ 12,495,606 293 $ (72,182,540)
December 31, 2003 31,882,527 107 (74,500,706)
December 31, 2004 34,920,836 105 (76,261,567)
December 31, 2005 34,094,865 105 (78,064,047)
December 31, 2006 37,754,849 100 (78,248,556)
32

Actuarial Section Seattle City Employees' Retirement System
Exh
ibit 9
Th
is w
ork
pro
du
ct
was p
rep
are
d s
ole
ly f
or
the
City o
f S
ea
ttle
. I
t m
ay n
ot
be
ap
pro
pria
te t
o u
se f
or
oth
er
pu
rpo
ses.
Mill
ima
n d
oe
s n
ot
inte
nd
to
be
nefit
an
d a
ssu
mes n
o d
uty
or
liab
ility
to o
the
r p
art
ies w
ho
rece
ive
th
is w
ork
. 1
2
se
ra0
21
7e.d
oc
17
00
03
SE
R 7
/ 1
7.0
03
.SE
R.1
0.2
007
/ K
IS/N
JC
/nlo
SE
AT
TL
E C
ITY
EM
PL
OY
EE
S'
RE
TIR
EM
EN
T S
YS
TE
M
GA
SB
Sta
tem
en
t N
o.
27
An
nu
al
De
ve
lop
me
nt
Of
Pe
ns
ion
Co
st
Fis
ca
l Y
ea
r E
nd
ing
A
RC
at
EO
Y
In
tere
st
on
N
PO
A
RC
A
dju
stm
en
t
An
nu
al
Pe
nsio
n C
ost
(AP
C)
To
tal
Em
plo
ye
r C
on
trib
utio
ns
C
ha
ng
e in
N
PO
N
PO
B
ala
nce
*
G
ain
/Lo
ss
A
mo
rt.
Facto
r
A
mo
rt.
of
Gain
/Lo
ss
E
nd
ing
B
ala
nce
De
ce
mb
er
31
, 1
99
9
16
,66
9,6
72
0
0
1
6,6
69
,67
2
2
9,7
46
,10
4
(13
,07
6,4
32
) (1
3,0
76
,43
2)
(13
,07
6,4
32
)
19.0
5650
- (1
3,0
76,4
32)
De
ce
mb
er
31
, 2
00
0
17
,26
8,1
46
(1
,04
6,1
15
) 6
86
,19
3
16
,90
8,2
24
30
,81
4,0
48
(1
3,9
05
,82
4)
(26
,98
2,2
56
) (1
3,5
45
,90
2)
1
9.0
56
50
(6
86
,19
3)
(26
,98
2,2
56
)
De
ce
mb
er
31
, 2
00
1
12
,31
3,9
93
(2
,15
8,5
80
) 1
,41
5,9
08
1
1,5
71
,32
13
2,6
67
,38
1
(21
,09
6,0
60
) (4
8,0
78
,31
6)
(20
,35
3,3
88
)
19
.05
65
0
(1,4
15
,90
8)
(48,0
78,3
16)
De
ce
mb
er
31
, 2
00
2
13
,81
6,1
88
(3
,84
6,2
65
)2
,52
5,6
83
1
2,4
95
,60
63
6,5
99
,83
0
(24
,10
4,2
24
) (7
2,1
82
,54
0)
(22
,78
3,6
42
)
19
.05
65
0
(2,5
25
,68
3)
(72,1
82,5
40)
De
ce
mb
er
31
, 2
00
3
34
,10
0,4
57
(5
,77
4,6
03
) 3
,55
6,6
73
3
1,8
82
,52
73
4,2
00
,69
3
(2,3
18
,16
6)
(74
,50
0,7
06
(1
00
,23
6)
1
9.0
5650
(3,5
56,6
73)
(74,5
00,7
06)
De
ce
mb
er
31
, 2
00
4
36
,68
1,6
97
(5
,77
3,8
05
) 4
,01
2,9
44
3
4,9
20
,83
63
6,6
81
,69
7
(1,7
60
,86
1)
(76
,26
1,5
67
) 0
18
.49
78
0
(4,0
12
,94
4)
(76
,26
1,5
67)
De
ce
mb
er
31
, 2
00
5
35
,89
7,3
45
(5
,91
0,2
71
) 4
,10
7,7
91
3
4,0
94
,86
53
5,8
97
,34
5
(1,8
02
,48
0)
(78
,06
4,0
47
) 0
18
.49
78
0
(4,1
07
,79
1)
(78
,06
4,0
47)
De
ce
mb
er
31
, 2
00
6
37
,93
9,3
58
(6
,04
9,9
64
) 5
,86
5,4
55
3
7,7
54
,84
93
7,9
39
,35
8
(18
4,5
09
) (7
8,2
48
,55
6)
0
1
3.3
09
12
(5
,86
5,4
55
)(7
8,2
48
,556)
*
NP
O a
t tr
an
sitio
n is z
ero
.
Am
ort
ization P
eriod:
30 y
ears
, O
pen, unle
ss f
ixe
d r
ate
am
ort
izes in
le
ss tha
n 3
0 y
ea
rs
Am
ort
ization M
eth
od:
Level P
erc
enta
ge o
f P
roje
cte
d P
ayro
ll
33

Seattle City Employees' Retirement System Actuarial Section
This work product was prepared solely for the City of Seattle. It may not be appropriate to use for other purposes. Milliman does not intend to benefit and assumes no duty or liability to other parties who receive this work.
13
sera0217e.doc 17 0003 SER 7 / 17.003.SER.10.2007 / KIS/NJC/nlo
SEATTLE CITY EMPLOYEES' RETIREMENT SYSTEM
Analysis Of Financial Experience
An analysis of actuarial gains or losses was performed in conjunction with the January 1, 2000, January 1, 2002, January 1, 2004, and January 1, 2006 actuarial valuations. The results of our analysis of the financial experience of the System in the four most recent actuarial valuations are presented in Exhibit 10. Each gain or loss shown represents our estimate of how much the given type of experience caused the UAL to change in the two-year period since the previous actuarial valuation. Gains and losses due to demographic sources are approximate. Demographic experience is analyzed in greater detail in our periodic assumption studies.
34
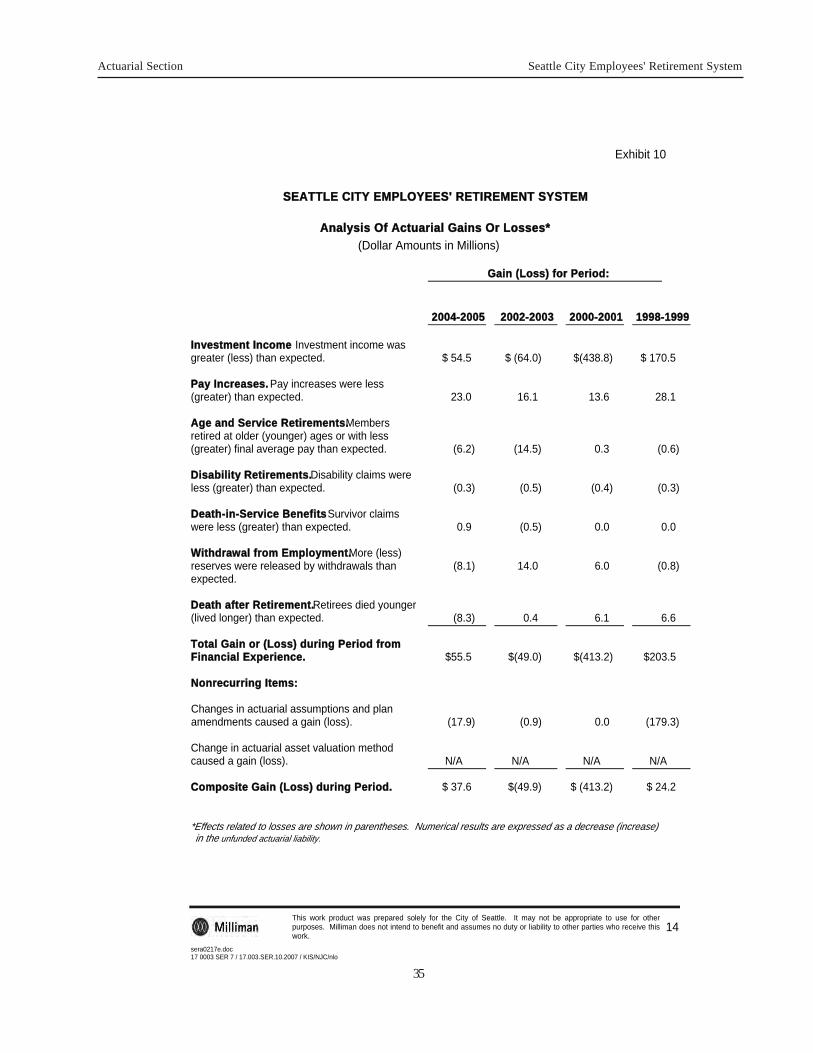
Actuarial Section Seattle City Employees' Retirement System
Exhibit 10
This work product was prepared solely for the City of Seattle. It may not be appropriate to use for other purposes. Milliman does not intend to benefit and assumes no duty or liability to other parties who receive this work.
14
sera0217e.doc 17 0003 SER 7 / 17.003.SER.10.2007 / KIS/NJC/nlo
SEATTLE CITY EMPLOYEES' RETIREMENT SYSTEM
Analysis Of Actuarial Gains Or Losses*
(Dollar Amounts in Millions) Gain (Loss) for Period:
2004-2005 2002-2003 2000-2001 1998-1999
Investment Income. Investment income was greater (less) than expected.
$ 54.5
$ (64.0)
$(438.8)
$ 170.5
Pay Increases. Pay increases were less (greater) than expected.
23.0
16.1
13.6
28.1
Age and Service Retirements. Members retired at older (younger) ages or with less (greater) final average pay than expected.
(6.2)
(14.5)
0.3
(0.6)
Disability Retirements. Disability claims were less (greater) than expected.
(0.3)
(0.5)
(0.4)
(0.3)
Death-in-Service Benefits. Survivor claims were less (greater) than expected.
0.9
(0.5)
0.0
0.0
Withdrawal from Employment. More (less) reserves were released by withdrawals than expected.
(8.1)
14.0
6.0
(0.8)
Death after Retirement. Retirees died younger (lived longer) than expected.
(8.3)
0.4
6.1
6.6
Total Gain or (Loss) during Period from Financial Experience.
$55.5
$(49.0)
$(413.2)
$203.5
Nonrecurring Items:
Changes in actuarial assumptions and plan amendments caused a gain (loss).
(17.9)
(0.9)
0.0
(179.3)
Change in actuarial asset valuation method caused a gain (loss).
N/A
N/A
N/A
N/A
Composite Gain (Loss) during Period.
$ 37.6 $(49.9) $ (413.2) $ 24.2
*Effects related to losses are shown in parentheses. Numerical results are expressed as a decrease (increase) in the unfunded actuarial liability.
35

Seattle City Em
ployees' Retirem
ent System A
ctuarial SectionSCHEDULE OF RETIREES AND BENEFICIARIES
ADDED TO AND REMOVED FROM ROLLS
Added to Rolls Removed from Rolls Rolls End of Year Average % IncreaseYear Annual Annual Annual Annual in Annual
Ended No. Allowances No. Allowances No. Allowances Allowances Allowances
1980 242 * 98 * 3819 $ 17,584,611 $ 4,604.51 11.101981 237 * 101 * 3955 $ 19,114,992 $ 4,833.12 4.971982 271 * 140 * 4086 $ 21,358,214 $ 5,227.17 8.151983 265 * 121 * 4230 $ 22,854,611 $ 5,402.98 3.361984 219 * 126 * 4323 $ 24,996,469 $ 5,782.20 7.021985 213 $ 2,294,142 105 $ 347,996 4431 $ 26,942,615 $ 6,080.48 5.161986 188 $ 2,010,634 141 $ 349,405 4478 $ 28,603,844 $ 6,387.64 5.051987 199 $ 2,273,426 140 $ 958,243 4537 $ 29,919,027 $ 6,594.45 3.241988 160 $ 2,032,669 117 $ 419,794 4580 $ 31,531,902 $ 6,884.69 4.401989 186 $ 2,500,814 125 $ 132,799 4641 $ 33,899,917 $ 7,304.44 6.101990 173 $ 2,579,540 135 $ 345,194 4679 $ 36,134,263 $ 7,722.65 5.731991 165 $ 1,805,490 181 $ 434,743 4663 $ 37,505,010 $ 8,043.11 4.151992 124 $ 1,740,286 197 $ 1,025,016 4640 $ 36,434,571 $ 7,852.28 (2.37)1993 142 $ 1,992,189 160 $ 887,397 4622 $ 37,539,363 $ 8,121.89 3.431994 192 $ 3,040,184 167 $ 1,192,660 4647 $ 39,573,882 $ 8,494.49 4.591995 155 $ 2,449,131 183 $ 759,377 4619 $ 41,284,341 $ 8,937.94 5.221996 227 $ 4,314,773 174 $ 908,271 4672 $ 44,648,305 $ 9,556.57 6.921997 171 $ 3,359,535 192 $ 1,065,687 4651 $ 47,014,360 $ 10,108.44 5.771998 170 $ 2,944,870 148 $ 946,560 4647 $ 52,878,274 $ 11,379.01 12.571999 215 $ 4,103,949 181 $ 1,125,621 4681 $ 55,909,111 $ 11,943.84 4.962000 227 $ 4,615,996 192 $ 1,543,534 4,716 $ 59,931,665 $ 12,708.16 6.402001 197 $ 3,959,357 180 $ 1,489,915 4,733 $ 62,802,652 $ 13,269.10 4.412002 301 $ 6,637,431 176 $ 1,615,743 4,858 $ 67,296,290 $ 13,852.67 4.402003 190 $ 4,106,890 172 $ 1,616,306 4,876 $ 70,113,547 $ 14,379.32 3.802004 251 $ 5,823,016 200 $ 2,530,999 4,927 $ 74,534,773 $ 15,127.82 5.202005 247 $ 6,060,629 173 $ 1,805,297 5,011 $ 79,598,120 $ 15,884.68 5.002006 319 $ 7,147,402 237 $ 2,447,919 5,093 $ 85,473,334 $ 16,795.68 5.742007 342 $ 7,591,671 235 $ 2,547,567 5,200 $ 100,877,547 $ 19,399.53 15.50 *
36
* 2007 included COLA improvements expanding the Floor COLA to 65% from 60%, and increased the monthly allowance of those members who retired before1998 to begin providing a monthly benefit to approximate what each would have been receiving had the 1.5% COLA been in effect at the time of retirement.

Actuarial Section Seattle City Employees' Retirement System
REVISED SUMMARY OF THE MAIN PROVISIONS OF THESEATTLE CITY EMPLOYEES’ RETIREMENT SYSTEM
We offer this current summary of the main provisions of the Retirement System in an attempt to give as brieflyas possible, a general idea of the benefits to members and the obligations of the City. Members who wantspecific information should write or telephone the office of the Retirement System, 720 3rd Avenue, Suite1000, Seattle, Washington 98104-1652, telephone (206) 386-1293, fax (206) 386-1506.
All officers and employees are eligible for membership in the Retirement system upon employment with theCity, except uniformed members of the Police and Fire Fighters System. Federal Social Security covers allofficers and employees, except Policemen and Firemen.
Terminating employees who have been members of the Retirement System for at least five years may leavetheir contributions in the Retirement Fund and may later apply for a retirement allowance when their age andyears of service qualify them for such a benefit.
Members may retire after 30 years of retirement credit, regardless of age; after age 52 with 20 years service,after age 57 with 10 or more years of service, and after age 62 with 5 or more years of service. Disabilityretirement is available after 10 years of service. (The ten years service requirement on disability retirementis waived if the member becomes totally incapacitated for further employment as a result of an accidentthat occurred in the actual performance of duty as an employee of the City.)
On January 1, 1975, the Seattle System adopted a “2% formula” method of determining the amount of aretirement allowance. On the last page you will find the scale of “guaranteed percentages” used in the “2%formula”. See the sample retirement allowance calculation below.
We have selected an employee working in the classification of a Lineworker to show as a typical January 1,1994, retirement situation. Assuming the Lineworker was a male employee age 65 with 30 years of service,having a wife also age 65. We would determine the amount of his accumulated contributions and his averagesalary for the 24 consecutive months of highest salary. These were found to be:
Accumulated contributions $90,000
Average salary $ 4,014
Per Month
Each $1,000 he has will buy $8.7787 per month for life (8.7787 x 90) is $ 790.08
His 30 years of service would indicate a maximum of 60% of averageSalary — 30 x 2% x $4,014 equals $2,408.40 maximum. Since theannuity produces only $790.08 per month, the City must add $1,618.32 to meet the guarantee. 1,618.32
Total “unmodified” and/or “straight allowance” $2,408.40
If this employee selects one of the options listed on the following page, his retirement will be reduced to allowfor the cost of the option selected.
(continued)
37

Seattle City Employees' Retirement System Actuarial Section
THE OPTIONS
A member may elect any one of six different ways in which to receive his retirement pension. Using theexample shown on the preceding page:
1. The maximum amount with no benefit to any beneficiary at time of death, generally spoken of as“straight” retirement, $2,408.40.
2. OPTION A. The “cash refund” plan. The annuity (amount purchased by a member’s contri-butions) only is reduced. As in the retirement sample shown, the annuity would be $707.84instead of $790.08 and the total monthly pension would be $2,326.16 instead of $2,408.40. Ifthere is a balance of the member’s contributions, $90,000, that has not been paid out at the rateof $707.84 per month, the beneficiary will receive a lump sum payment of the balance.
3. OPTION B. Also a “cash refund” plan except the beneficiary gets monthly payments of the balanceinstead of a lump sum payment. As in the retirement sample shown, the annuity would be $721.21instead of $790.08 and the monthly pension would be $2,339.53 instead of $2,408.40.
4. OPTION C. “Guaranteed period plan”. If the pensioner fails to live the length of the period selected,(in this example 5 years) the pension of $2,355.42 per month is paid to the beneficiary for the remain-der of the guaranteed period. If the period selected was 10 years, the pension would be $2,191.64per month.
5. OPTION D. One-half of discounted allowance to surviving spouse for life. The reduction is deter-mined in accordance with the ages of the retiring member and the spouse at the time of retirement.Again, using the sample retirement, under Option D, the plan would pay the wife, age 65, $1,076.55(one-half of $2,153.11) per month for life. If you retired on or after March 24, 1997 and yourspouse predeceases you, your monthly allowance will be raised to the original unmodified amount.
6. OPTION E. Full amount of discounted allowance to surviving spouse for life. The discount orreduction is determined in accordance with the ages of the retiring member and his spouse at the timeof retirement. Using the example again, member 65, wife 65, the amount would be $1,943.58, to becontinued as long as either were alive. If you retired on or after March 24, 1997 and your spousepredeceases you, your monthly allowance will be raised to the original unmodified amount.
7. OPTION F. This option allows a member who retires prior to the normal Social Security Age toreceive retirement benefits that are modified so that the combined income from the Retirement Systemand Social Security is level throughout the member's lifetime. This means the System's payments arehigher before the Social Security payments begin and then lower after they begin. Although the theoryis that the member's income stream will be level, often it is not. This is because Social Security, andoften the System as well, makes post retirement adjustments that upset the original "leveling out"feature of this option.
8. OPTION G. This option allows members a partial lump sum payment at retirement which is equivalentto either the member's accumulated contributions with interest, or one-half of this amount. The member'snormal monthly pension will be reduced by an amount to actuarially compensate for the funds with-drawn.
BASIS RATES OF CONTRIBUTION
The City contributes 8.03% of covered payroll and employees contribute 8.03% unless they qualified for alower rate prior to January 1, 1974.
(continued)38

Actuarial Section Seattle City Employees' Retirement System
DISABILITY RETIREMENT
Disability retirement is available to members with at least ten years of City Service with the ten year require-ment waived when disability arose out of and in the course of their employment as an employee of the City.Members may be retired because of “permanent, total disability” or “temporary, total disability”. The first typementioned occurs when there is grave doubt that the employee will ever return to active service. The secondtype is used when the retiree is expected to return within a short time. Both pay the same benefits, 1 1/2% ofaverage salary (24 highest consecutive months) for each year of service, with a maximum of 60% of averagesalary, and minimum monthly allowance of $140. The employee with less than 22 years of service is protectedby the provision allowing credit to the age of 62, in the calculation for years of service, with 33-1/3% ofaverage salary maximum. Federal Social Security also provides for disability benefits.If the disability retiree dies and has named a surviving spouse as beneficiary, the spouse is eligible to receive asettlement similar to that shown in the explanation that follows for the spouse of a member who dies prior toretirement.
LIFE INCOMES FOR SPOUSES OF MEMBERS WHO DIE BEFORE RETIREMENT
This is one of the most important provisions of the Retirement System. If an employee has at least ten years ofservice, the surviving spouse is eligible for a life income and/or a reduced life income and a cash refund. Thedeceased employee must have designated the spouse as beneficiary, and the beneficiary may choose any oneof the three types of settlement:
1. Take the discounted value of the retirement allowance indicated for the deceased employee. Thismeans a straight life income for the life of the survivor, with no benefit for anyone upon the death of thesurvivor.
2. Take up to one-half of the employee’s contributions and a reduced life income (using all of the City’smoney including the formula guarantee if applicable).
3. Withdraw all of the accumulated contributions made by the employee. In this instance, all of the City’smoney would remain in the Retirement System.
In calculating the benefit for the survivor, the schedule of “guaranteed percentage” would be used.
To present an example — let us suppose the employee was 51 years of age at the time of death, had anaverage salary of $2,188 (24 highest consecutive month), has 27 years of service and $36,800 of accu-mulated contributions. Suppose the survivor (widow) was 57 years of age. The maximum amount theemployee is entitled to was $1,170.70 per month.
1. If the widow took a life income, she could receive $896.80 per month.2. If she took $18,400 cash, she could still receive a life income of $784 per month.3. She could draw the $36,800 as a final settlement.
If there is no surviving spouse, minor children can elect to receive similar benefits payable until they reacheighteen years of age.
POST RETIREMENT COST OF LIVING INCREASEEach November the monthly retirement allowance will increased to provide the highest benefit calculated under eitherone of the following cost of living adjustments:
1. A 1.5% annual compounding COLA
2. A COLA which would provide 65% of the purchasing power which the members original retirement allowance couldpurchase.
39

[Blank]
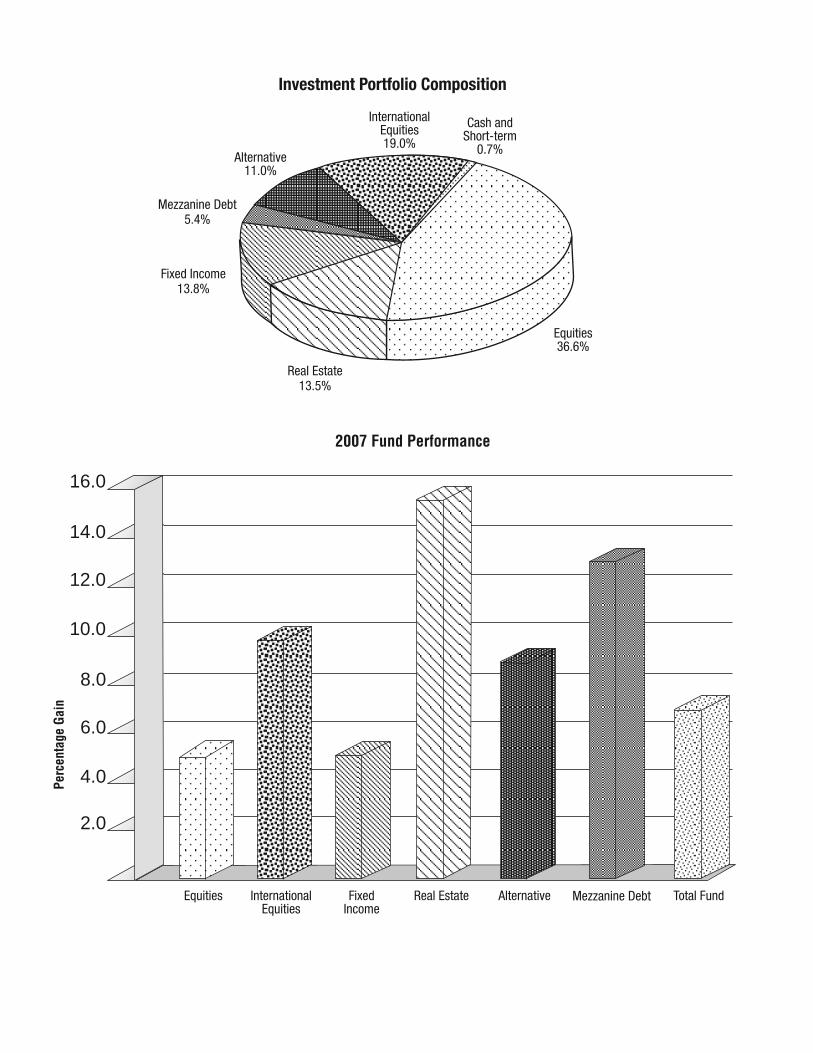
2.0
4.0
6.0
8.0
10.0
12.0
14.0
16.0

Seattle City Employees' Retirement System Statistical Section
42
SEATTLE CITY EMPLOYEES' RETIREMENT SYSTEMSCHEDULE OF REVENUES BY SOURCE
Employer Fiscal Member Employer . Investment Miscellaneous Contrib.* Year Contributions Contributions ** Income Income Total
7.91 % 1980 $ 9,166,162 $ 10,470,335 $ 16,284,473 $ 846 $ 35,921,8168.54 1981 11,845,089 13,309,388 18,488,195 2,311 43,644,9838.54 1982 12,465,220 14,790,039 21,106,414 48,361,6738.54 1983 12,926,545 14,265,554 27,224,215 5,050 54,421,3648.91 1984 14,076,607 15,961,211 30,543,443 67 60,581,3288.91 1985 14,399,465 16,280,464 25,317,826 55,997,7558.91 1986 15,164,105 16,758,439 33,081,706 65,004,2508.91 1987 16,088,280 17,799,789 46,029,652 410 79,918,1318.91 1988 16,701,142 18,521,365 36,397,481 71,619,9888.91 1989 17,246,117 18,983,634 41,803,863 545 78,034,1598.91 1990 20,405,149 21,810,612 27,725,284 69,941,0458.91 1991 21,111,940 21,458,952 37,758,671 80,329,5638.91 1992 21,564,881 25,117,924 41,792,730 88,475,5358.91 1993 23,473,485 26,139,925 100,705,007 *** 150,318,4178.91 1994 24,764,862 26,704,211 3,670,356 *** 55,139,4298.91 1995 26,069,124 27,816,819 181,470,912 235,356,8558.91 1996 25,835,147 28,372,760 118,399,056 172,606,9638.91 1997 25,571,634 28,310,353 143,719,597 197,601,5848.91 1998 27,311,815 30,554,650 168,477,507 226,343,9728.03 1999 29,201,844 29,898,474 240,904,299 300,004,6178.03 2000 30,962,052 30,956,217 (79,832,672) (17,914,403)8.03 2001 32,602,859 32,667,381 (93,021,798) (27,751,558)8.03 2002 39,388,249 36,599,830 (116,907,340) (40,919,261)8.03 2003 36,243,490 34,200,693 296,239,050 366,683,2338.03 2004 37,192,591 36,819,271 177,211,711 251,223,5738.03 2005 35,962,449 35,897,345 139,866,897 211,726,6918.03 2006 38,228,475 38,077,976 251,934,917 328,241,3688.03 2007 40,533,554 40,299,506 149,708,740 230,541,800* Employer Contributions reflected as a percentage of covered payroll.
** The employer contributions has been made in accordance with actuarial requirements.*** Beginning with 1993, the investment income reflects unrealized gains (losses) required by GASB 25.
SEATTLE CITY EMPLOYEES' RETIREMENT SYSTEMSCHEDULE OF EXPENSES BY TYPE
Year Benefits Refunds Administrative Total1980 $ 17,584,611 $ 1,786,654 $ 331,600 $ 19,702,8651981 19,114,992 2,074,078 419,568 21,608,6381982 21,358,214 2,151,528 458,261 23,968,0031983 23,029,611 2,086,102 538,059 25,653,7721984 25,175,469 3,366,999 737,445 29,279,9131985 27,090,615 2,753,418 1,076,324 30,920,3571986 28,777,844 3,212,415 1,340,874 33,331,1331987 30,499,027 3,141,868 1,494,189 35,135,0841988 32,093,902 3,293,088 1,408,946 36,795,9361989 34,121,917 3,257,432 1,538,544 38,917,8931990 36,431,265 3,592,483 1,636,911 41,660,6591991 37,862,028 3,731,762 1,870,922 43,464,7121992 38,884,790 3,585,672 2,109,340 44,579,8021993 40,131,325 2,944,003 2,525,620 45,600,9481994 42,420,358 3,412,882 2,639,538 48,472,7781995 44,352,180 3,874,980 7,217,337 55,444,4971996 46,257,605 3,888,043 7,989,200 58,134,8481997 50,349,474 5,463,464 11,875,158 67,688,0961998 56,247,811 7,502,444 12,145,939 75,896,1941999 58,704,086 9,730,803 10,447,151 78,882,0402000 62,844,355 11,641,902 10,634,557 85,120,8142001 65,553,605 8,785,879 7,293,821 81,633,3052002 68,825,558 12,019,852 7,250,214 88,095,6242003 73,559,728 13,218,137 7,081,030 93,858,8952004 77,289,288 9,791,692 7,188,848 94,269,8282005 82,268,449 10,385,215 11,773,914 104,427,5782006 87,583,509 10,553,067 10,715,425 108,852,0012007 98,391,533 11,525,660 12,380,123 122,297,316

Statistical Section Seattle City Employees' Retirement System
SEATTLE CITY EMPLOYEES’ RETIREMENT SYSTEMBENEFIT EXPENSE BY TYPE
Ten Years Ending December 31, 2007
DisabilityAge & Service Benefits Retirants Death
Year Retirants Survivors Benefits Benefit Refunds Total1998 $ 48,684,577 $ 6,500,622 $ 714,624 $ 347,988 $ 7,502,444 $ 63,750,2551999 $ 50,902,672 $ 6,821,887 $ 698,527 $ 281,000 $ 9,730,803 $ 68,434,8892000 $ 54,518,311 $ 7,260,855 $ 714,799 $ 350,390 $ 11,641,902 $ 74,486,2572001 $ 57,122,024 $ 7,486,988 $ 672,593 $ 272,000 $ 8,785,879 $ 74,339,4842002 $ 59,991,882 $ 7,821,555 $ 686,121 $ 326,000 $ 12,019,852 $ 80,845,4102003 $ 64,301,813 $ 8,215,109 $ 714,806 $ 328,000 $ 13,218,137 $ 86,777,8652004 $ 67,794,624 $ 8,486,860 $ 711,804 $ 296,000 $ 9,791,692 $ 87,080,9802005 $ 72,390,702 $ 8,754,471 $ 785,276 $ 338,000 $ 10,351,215 $ 92,653,6642006 $ 77,320,260 $ 9,180,292 $ 814,957 $ 268,000 $ 10,553,067 $ 98,136,5762007 $ 87,019,040 $ 10,230,265 $ 864,228 $ 278,000 $ 11,525,660 $ 109,917,193
REVENUE RATIOS BY SOURCE1973 Through 2007
Member Employer Investment TotalYear Contributions Contributions Income Revenue1973 26 % 32 % 42 % 100 %1974 26 31 43 1001975 26 31 43 1001976 26 31 43 1001977 25 29 46 1001978 25 29 46 1001979 27 30 43 1001980 26 29 45 1001981 27 31 42 1001982 25 31 44 1001983 24 26 50 1001984 23 26 51 1001985 26 29 45 1001986 24 26 50 1001987 20 22 58 1001988 23 26 51 1001989 22 24 54 1001990 29 31 40 1001991 26 27 47 1001992 25 28 47 100
1993 * 16 17 67 100 1994 * 45 48 7 100
1995 ** 11 12 77 100 1996 ** 15 16 69 100
1997 . 13 14 73 100 1998 . 12 14 74 1001999 10 10 80 1002000 Net Loss2001 Net Loss2002 Net Loss2003 10 9 81 1002004 15 15 70 1002005 17 17 66 1002006 12 12 76 1002007 18 18 64 100
* Beginning with 1993, the investment income reflects unrealized gains (losses) required by GASB 25.** Beginning with 1996 (and 1995 has been restated) investment income includes the gross income from Securities Lending as required by GASB 28.
43

Seattle City Employees' Retirement System Statistical Section
SEATTLE CITY EMPLOYEES’ RETIREMENT SYSTEMSCHEDULE OF INVESTMENT RESULTS
Ten Years Ending December 31, 2007
Investment Investments Securities Lending Return onYear Income * Market Value Collateral Market Value
1998 $ 168,477,507 $ 1,357,958,488 $ 138,843,536 15.1%
1999 $ 240,904,299 $ 1,596,015,278 $ 80,540,810 15.3%
2000 $ (79,832,672) $ 1,484,124,485 $ 80,511,612 (3.7)%
2001 $ (93,021,798) $ 1,366,651,234 $ 120,215,604 (6.0)%
2002 $ (116,907,340) $ 1,245,668,385 $ 133,817,297 (8.4)%
2003 $ 296,239,050 $ 1,517,907,621 $ 148,226,605 23.6%
2004 $ 177,211,711 $ 1,664,178,577 $ 239,087,447 11.5%
2005 $ 139,866,897 $ 1,777,219,827 $ 122,862,720 8.1%
2006 $ 251,934,917 $ 1,986,714,717 $ 145,097,240 13.9%
2007 $ 149,708,740 $ 2,106,345,982 $ 103,323,467 7.3%
44
* Investment Income includes market gains and losses, and gross income from Securities Lending.
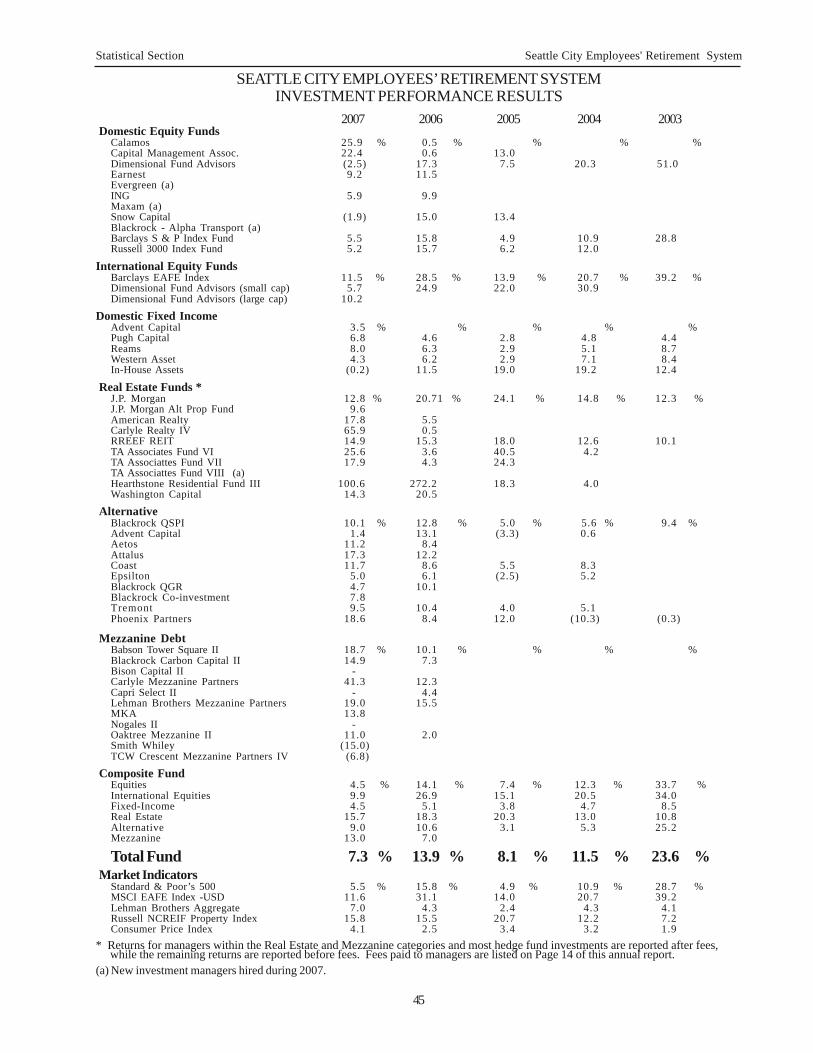
Statistical Section Seattle City Employees' Retirement System
45
SEATTLE CITY EMPLOYEES’ RETIREMENT SYSTEMINVESTMENT PERFORMANCE RESULTS
2007 2006 2005 2004 2003Domestic Equity Funds
Calamos 25.9 % 0.5 % % % %Capital Management Assoc. 22.4 0.6 13.0Dimensional Fund Advisors (2.5) 17.3 7.5 20.3 51.0Earnest 9.2 11.5Evergreen (a)ING 5.9 9.9Maxam (a)Snow Capital (1.9) 15.0 13.4Blackrock - Alpha Transport (a)Barclays S & P Index Fund 5.5 15.8 4.9 10.9 28.8Russell 3000 Index Fund 5.2 15.7 6.2 12.0
International Equity FundsBarclays EAFE Index 11.5 % 28.5 % 13.9 % 20.7 % 39.2 %Dimensional Fund Advisors (small cap) 5.7 24.9 22.0 30.9Dimensional Fund Advisors (large cap) 10.2
Domestic Fixed IncomeAdvent Capital 3.5 % % % % %Pugh Capital 6.8 4.6 2.8 4.8 4.4Reams 8.0 6.3 2.9 5.1 8.7Western Asset 4.3 6.2 2.9 7.1 8.4In-House Assets (0.2) 11.5 19.0 19.2 12.4
Real Estate Funds *J.P. Morgan 12.8 % 20.71 % 24.1 % 14.8 % 12.3 %J.P. Morgan Alt Prop Fund 9.6American Realty 17.8 5.5Carlyle Realty IV 65.9 0.5RREEF REIT 14.9 15.3 18.0 12.6 10.1TA Associates Fund VI 25.6 3.6 40.5 4.2TA Associattes Fund VII 17.9 4.3 24.3TA Associattes Fund VIII (a)Hearthstone Residential Fund III 100.6 272.2 18.3 4.0Washington Capital 14.3 20.5
AlternativeBlackrock QSPI 10.1 % 12.8 % 5.0 % 5.6 % 9.4 %Advent Capital 1.4 13.1 (3.3) 0.6Aetos 11.2 8.4Attalus 17.3 12.2Coast 11.7 8.6 5.5 8.3Epsilton 5.0 6.1 (2.5) 5.2Blackrock QGR 4.7 10.1Blackrock Co-investment 7.8Tremont 9.5 10.4 4.0 5.1Phoenix Partners 18.6 8.4 12.0 (10.3) (0.3)
Mezzanine DebtBabson Tower Square II 18.7 % 10.1 % % % %Blackrock Carbon Capital II 14.9 7.3Bison Capital II -Carlyle Mezzanine Partners 41.3 12.3Capri Select II - 4.4Lehman Brothers Mezzanine Partners 19.0 15.5MKA 13.8Nogales II -Oaktree Mezzanine II 11.0 2.0Smith Whiley (15.0)TCW Crescent Mezzanine Partners IV (6.8)
Composite FundEquities 4.5 % 14.1 % 7.4 % 12.3 % 33.7 %International Equities 9.9 26.9 15.1 20.5 34.0Fixed-Income 4.5 5.1 3.8 4.7 8.5Real Estate 15.7 18.3 20.3 13.0 10.8Alternative 9.0 10.6 3.1 5.3 25.2Mezzanine 13.0 7.0
Total Fund 7.3 % 13.9 % 8.1 % 11.5 % 23.6 %Market Indicators
Standard & Poor’s 500 5.5 % 15.8 % 4.9 % 10.9 % 28.7 %MSCI EAFE Index -USD 11.6 31.1 14.0 20.7 39.2Lehman Brothers Aggregate 7.0 4.3 2.4 4.3 4.1Russell NCREIF Property Index 15.8 15.5 20.7 12.2 7.2Consumer Price Index 4.1 2.5 3.4 3.2 1.9
* Returns for managers within the Real Estate and Mezzanine categories and most hedge fund investments are reported after fees,while the remaining returns are reported before fees. Fees paid to managers are listed on Page 14 of this annual report.
(a) New investment managers hired during 2007.
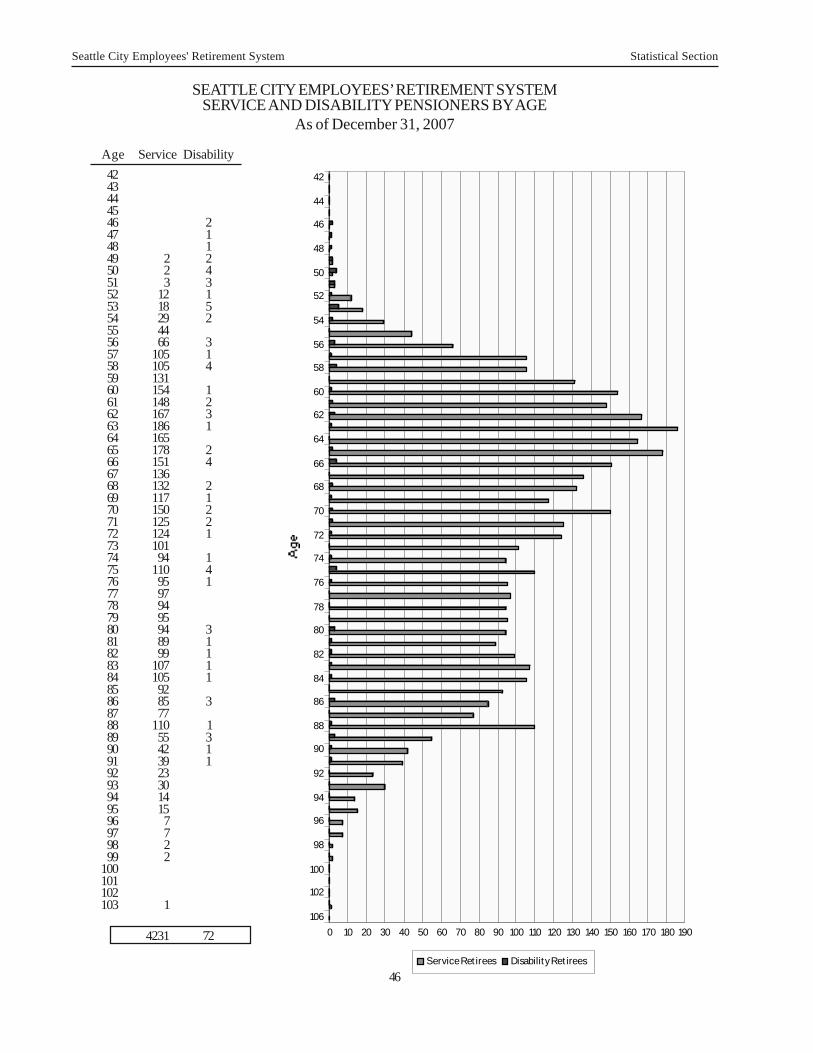
Seattle City Employees' Retirement System Statistical Section
0 10 20 30 40 50 60 70 80 90 100 110 120 130 140 150 160 170 180 190
42
44
46
48
50
52
54
56
58
60
62
64
66
68
70
72
74
76
78
80
82
84
86
88
90
92
94
96
98
100
102
106
Service Ret irees Disability Ret irees
Age Service Disability4243444546 247 148 149 2 250 2 451 3 352 12 153 18 554 29 255 4456 66 357 105 158 105 459 13160 154 161 148 262 167 363 186 164 16565 178 266 151 467 13668 132 269 117 170 150 271 125 272 124 173 10174 94 175 110 476 95 177 9778 9479 9580 94 381 89 182 99 183 107 184 105 185 9286 85 387 7788 110 189 55 390 42 191 39 192 2393 3094 1495 1596 797 798 299 2
100101102103 1
4231 72
46
SEATTLE CITY EMPLOYEES’ RETIREMENT SYSTEMSERVICE AND DISABILITY PENSIONERS BY AGE
As of December 31, 2007

Statistical Section Seattle City Employees' Retirement System
0 50 100 150 200 250 300 350
Service Ret irees Disabilit y Ret irees
Service Disability$ 200 or less 58
201 - 400 224 2401 - 600 299 5601 - 800 282 10801 - 1000 292 22
1001 - 1200 287 161201 - 1400 299 91401 - 1600 310 31601 - 1800 301 31801 - 2000 297 12001 - 2200 264 12201 - 2400 2252401 - 2600 2142601 - 2800 1892801 - 3000 1333001 - 3200 1353201 - 3400 1203401 - 3600 753601 - 3800 533801 - 4000 484001 - 4200 424201 - 4400 274401 - 4600 204601 - 4800 74801 - 5000 95001 - 5200 75201 - 5400 45401 - 5600 6
over 5600 4
4231 72
47
SEATTLE CITY EMPLOYEES’ RETIREMENT SYSTEMRETIREMENT ALLOWANCE DISTRIBUTION
As of December 31, 2007

Seattle City Em
ployees' Retirem
ent System Statistical Section
SEATTLE CITY EMPLOYEES’ RETIREMENT SYSTEMACTIVE MEMBERSHIP EXPERIENCE
For the Last Thirty Years
Members at New Members Withdrawals Re-entering & Deaths Pensions GrantedEnd of Period During Period During Period Redepositing During Period During Period
1978 6,600 896 592 71 22 2591979 6,797 934 536 57 11 2471980 6,894 901 631 67 12 2281981 7,037 776 467 77 13 2301982 6,972 555 439 73 14 2401983 6,870 471 363 50 13 2471984 6,710 531 522 57 16 2101985 6,946 628 244 72 11 2091986 7,020 570 382 77 11 1801987 7,196 622 312 72 16 1901988 7,252 542 361 45 10 1601989 7,544 672 251 51 12 1681990 7,813 872 454 45 12 1821991 8,037 681 354 43 13 1331992 8,171 463 220 32 17 1241993 8,317 537 279 39 15 1361994 8,553 512 201 133 16 1921995 8,741 477 284 136 12 1531996 8,584 339 270 13 12 2271997 8,572 435 287 36 18 1781998 8,743 557 236 29 9 1701999 9,576 1,289 238 14 17 2152000 9,836 876 393 17 13 2272001 10,111 706 241 25 18 1972002 9,737 426 503 16 12 3012003 9,964 628 202 5 14 1902004 10,222 636 123 4 8 2512005 10,387 635 212 3 11 2472006 10,493 710 325 15 16 2782007 10,892 948 292 37 8 286
48

Statistical Section Seattle City Em
ployees' Retirem
ent SystemSEATTLE CITY EMPLOYEES’ RETIREMENT SYSTEM
COMPARATIVE STATEMENT OF EXPERIENCE OF SERVICE AND DISABILITY RETIREMENT PAYROLLSFrom Inception in 1929, Through 2007
Figures Quoted as of the End of Each Fiscal Period
Number Deceased Benefit Cont’dNumber Retired During Period During Period Pensions Discontinued to Beneficiary Number on Payroll at End of PeriodService Sec. 19-b Disability Service - Disability Service -Beneficiary - Disability Service Service - Beneficiary - Disability
1929 - 1972 Inclusive 4,003 295 793 2,315 486 3 166 84 273 1,732 405 223December 31, 1973 198 28 32 77 22 19 26 1,853 440 233December 31, 1974 161 25 19 82 10 13 23 1,932 475 242December 31, 1975 324 12 18 90 12 35 32 2,166 484 248December 31, 1976 328 7 23 110 15 10 37 2,384 518 256December 31, 1977 292 15 10 109 20 19 28 2,567 542 246December 31, 1978 246 9 13 87 14 24 29 2,726 556 245December 31, 1979 237 7 10 112 17 12 35 2,851 586 238December 31, 1980 220 14 8 101 13 19 35 2,970 616 233December 31, 1981 223 7 7 94 15 25 33 3,099 631 225December 31, 1982 254 12 5 120 23 38 41 3,233 646 207December 31, 1983 248 12 5 137 10 29 55 3,344 684 202December 31, 1984 206 9 4 135 14 28 51 3,415 716 192December 31, 1985 202 4 7 115 18 19 1 48 3,505 743 183December 31, 1986 175 10 4 140 9 13 20 3,540 760 178December 31, 1987 184 6 7 132 16 6 16 3,592 776 169December 31, 1988 158 2 3 120 9 25 37 3,627 790 163December 31, 1989 163 8 5 141 12 5 43 3,660 780 154December 31, 1990 181 10 1 128 16 7 44 3,695 827 140December 31, 1991 129 4 158 12 31 70 3,665 866 132December 31, 1992 121 3 161 4 32 50 3,625 884 131December 31, 1993 133 6 3 157 6 42 45 3,601 894 127December 31, 1994 181 10 1 159 10 53 55 3,608 922 117December 31, 1995 148 5 2 162 5 54 38 3,591 914 114December 31, 1996 225 3 1 173 8 44 49 3,659 907 106December 31, 1997 170 9 1 186 9 75 69 3,622 931 98December 31, 1998 166 2 2 170 9 1 45 51 3,614 942 91December 31, 1999 208 5 2 167 5 67 51 3,662 931 88December 31, 2000 222 4 1 142 4 46 43 3,699 933 84December 31, 2001 192 4 1 152 8 53 33 3,733 924 76December 31, 2002 290 5 6 170 5 49 48 3,836 945 77December 31, 2003 189 6 1 163 5 67 57 3,858 945 73December 31, 2004 243 2 6 172 6 61 39 3,924 930 73December 31, 2005 235 6 6 164 3 66 70 3,993 942 76December 31, 2006 270 6 2 151 6 72 33 4,113 908 72December 31, 2007 277 6 2 155 2 70 59 4,231 897 72
Grand Total 5,200
49

Seattle City Em
ployees' Retirem
ent System Statistical Section
SEATTLE CITY EMPLOYEES’ RETIREMENT SYSTEMEXPERIENCE IN MISCELLANEOUS AVERAGES
For the Last Thirty Years
AVERAGE SERVICE AVERAGE AGE OFRETIREMENT AVERAGE AGE OF AVERAGE DISABILITY DISABILITY ACTIVE MEMBERS DECEASEDALLOWANCE SERVICE PENSIONERS RETIREMENT ALLOWED PENSIONERS # OF DEATHS AVERAGE AGE
1978 $ 374.03 69.69 $ 254.82 64.42 22 54.411979 394.91 69.59 260.89 64.96 11 49.041980 418.84 69.69 261.76 65.05 12 55.541981 441.69 69.86 267.88 65.12 13 49.311982 468.28 70.07 269.71 65.64 14 48.541983 501.76 70.18 272.98 66.55 13 52.541984 530.44 69.97 281.36 66.29 16 51.281985 556.72 70.26 290.71 66.22 11 53.661986 582.18 70.57 296.27 66.70 11 48.181987 608.43 70.80 314.43 66.60 16 49.131988 655.62 70.02 357.61 66.40 14 49.931989 664.36 71.45 343.74 66.53 12 49.171990 697.54 71.72 352.75 65.88 12 47.671991 757.07 72.19 378.41 66.61 13 57.771992 749.31 72.44 366.23 66.30 17 50.941993 775.72 73.42 394.13 67.80 15 53.001994 811.55 73.28 407.60 67.52 16 55.001995 850.50 73.45 431.19 67.78 12 53.671996 904.11 73.43 423.86 68.88 12 44.921997 961.30 73.29 448.15 68.12 18 54.721998 * 1,063.66 73.30 594.09 68.13 9 56.111999 1,114.34 73.10 609.19 68.25 17 55.242000 1,167.60 72.88 622.66 68.69 13 50.772001 1,222.42 72.70 654.53 67.84 18 51.392002 1,289.77 72.16 703.83 67.25 12 54.332003 1,338.49 72.14 734.85 66.78 14 53.142004 1,404.86 71.93 788.94 65.40 8 50.622005 1,477.58 71.78 827.46 65.15 11 53.182006 1,552.57 71.53 877.96 64.75 16 51.942007 1,768.13 71.42 1,010.15 65.53 8 53.13
* Beginning in 1998 the average retirement allowance numbers include the monthly COLA amounts.
50

Statistical Section Seattle City Employees' Retirement System
51
SEATTLE CITY EMPLOYEES’ RETIREMENT SYSTEMSCHEDULE OF AVERAGE BENEFIT PAYMENTS
Retirement Effective DatesYears Credited Service
Jan. 1, 1998 to Dec. 31, 2007 0-10 11-15 16-20 21-25 26-30 31 +Period 1/1/98 to 12/31/98 Average Monthly Benefit $ 451.94 799.97 1,171.57 1,434.59 2,111.63 2,296.32 Average Final Salary $ 3,717.39 3,725.11 3,423.29 3,800.98 4,100.82 4,222.49
Number of Active Retirants 32 23 19 26 42 28
Period 1/1/99 to 12/31/99 Average Monthly Benefit $ 416.73 881.13 1,320.71 1,493.61 2,236.30 2,173.93 Average Final Salary $ 3,856.75 3,712.60 4,043.07 3,594.45 4,251.65 4,115.63
Number of Active Retirants 34 19 36 23 70 33
Period 1/1/00 to 12/31/00 Average Monthly Benefit $ 482.19 880.93 1,190.87 1,720.94 2,346.89 2,383.68 Average Final Salary $ 4,659.08 3,519.82 3,833.71 4,508.72 4,473.41 4,602.86
Number of Active Retirants 33 28 21 36 70 39
Period 1/1/01 to 12/31/01 Average Monthly Benefit $ 478.66 837.60 1,349.54 1,719.53 2,369.43 2,374.36 Average Final Salary $ 4,756.88 3,715.90 4,241.27 4,121.40 4,654.58 4,544.36
Number of Active Retirants 30 23 25 30 65 24
Period 1/1/02 to 12/31/02 Average Monthly Benefit $ 503.66 1,054.23 1,254.66 1,925.74 2,458.67 2,616.86 Average Final Salary $ 4,404.61 4,203.54 3,773.37 4,571.61 4,653.62 4,919.14
Number of Active Retirants 40 31 34 58 96 42
Period 1/1/03 to 12/31/03 Average Monthly Benefit $ 496.91 1,034.44 1,432.09 1,744.45 2,579.91 2,628.56 Average Final Salary $ 3,782.43 4,261.52 4,669.55 4,653.31 4,901.87 4,953.21
Number of Active Retirants 32 23 22 41 39 39
Period 1/1/04 to 12/31/04 Average Monthly Benefit $ 613.97 1,056.92 1,449.54 1,773.54 2,480.00 2,812.38 Average Final Salary $ 4,393.80 4,349.56 4,737.24 4,405.97 5,210.92 5,259.10
Number of Active Retirants 27 21 39 46 76 42
Period 1/1/05 to 12/31/05 Average Monthly Benefit $ 674.26 1,137.59 1,706.94 2,270.53 2,653.34 2,807.79 Average Final Salary $ 4,928.96 4,733.59 4,915.39 5,423.36 5,164.89 4,973.41
Number of Active Retirants 30 27 33 55 65 37
Period 1/1/06 to 12/31/06 Average Monthly Benefit $ 656.56 1,124.37 1,662.58 2,196.45 2,831.74 3,053.19 Average Final Salary $ 4,902.33 4,671.23 4,823.60 5,170.19 5,313.48 5,472.54
Number of Active Retirants 37 42 38 50 55 56
Period 1/1/07 to 12/31/07 Average Monthly Benefit $ 658.92 1,406.25 1,650.87 2,132.89 2,814.90 3,129.50 Average Final Salary $ 5,017.90 5,992.08 4,865.08 5,096.68 5,414.43 5,412.96
Number of Active Retirants 53 36 37 54 61 44
Period 1/1/98 to 12/31/07 Average Monthly Benefit $ 543.38 1,021.34 1,418.94 1,841.23 2,488.28 2,627.66 Average Final Salary $ 4,442.01 4,288.50 4,332.56 4,534.67 4,813.97 4,847.57
Average Number of Active Retirants 35 27 30 42 64 38

Seattle City Employees' Retirement System Statistical Section
52
NEW MEMBERS IN THE RETIREMENT SYSTEM IN 2007BY DEPARTMENT
Arts Commission 3DoIT 16Executive Administration 17Executive Departments 19Fire 4Fire Pension 3Fleets 29Hearing Examiner 1Human Services 41Law 14Legislative 9Library 68Light 174Municipal Courts 37Neighborhoods 12Parks 113Personnel 31Planning and Development 35Police 51Retirement 1SDOT 114Seattle Center 43SPU 113
Total 948
MEMBERS AGAIN IN THE RETIREMENT SYSTEM IN 2007BY DEPARTMENT
REDEPOSITINGExecutive Administration 1Library 2Light 2Parks 1Personnel 2Police 1Seattle Center 1 10
RE-ENTERINGExecutive Administration 1Fire 1Human Services 1Library 1Light 5Parks 6Municipal Courts 1Personnel 2Police 1SDOT 1Seattle Center 1SPU 6 27
Total 37

Statistical Section Seattle City Employees' Retirement System
53(continued) .
SEATTLE CITY EMPLOYEES’ RETIREMENT SYSTEMSERVICE RETIREMENTS GRANTED IN 2007
Name Department Position Years of Service AgeAgor-Matsuno, Bernadette C Neighborhoods Executive 2 27 yrs 278 days 55Aguilar, Lilly J. Vested Vested 14 yrs 43 days 60Allen, Barbara J. Muni Courts Court Clerk Supervisor 17 yrs 69 days 63Allen,Jini A Vested Vested 14 yrs 279 days 59Anderson, Dennis L. City Light Real Property Agent Sr 23 yrs 185 days 57Anderson, Leslie K. SPU Maintenance Laborer 33 yrs 142 days 56Angedal, Darleen H. SDOT Bridge Operator 30 yrs 3 days 68Angelou, Anne F. Vested/Dual Vested 4 yrs 107 days 63Anshutz,Jim R. DEA Planning & Dev Spec Sr 5 yrs 171 days 63Anstett, Dorothy C. Parks Planning & Dev Spec II 13 yrs 272 days 59Auge,Mary Elizabeth Muni Courts Administrative Specialist I 16 yrs 3 days 64Austin, Joan D K.C. Health Public Health Nurse 21 yrs 362 days 57Baer, Pamela D. Library/Dual Payroll & Benefits Specialist 14 yrs 179 days 49Ballew, Gary W. Parks Naturalist 32 yrs 364 days 62Barbieri, Joseph A. City Light Electrician Constructor 35 yrs 34 days 62Barron,Ruben D SPU Laborer 18 yrs 72 days 63Baxley, Lavon SPU Utility Service Representative 27 yrs 88 days 61Beach, David G. Vested/Dual Vested 1 yrs 97 days 65Beaver, Jaybe Parks Utility Laborer 28 yrs 208 days 67Belikiewicz, Gail SPU Utility Account Representative II 17 yrs 152 days 60Bell, Sandi S. Parks Grounds Maintenance CC 29 yrs 106 days 57Benito, Miguel C. DEA Info Technology Prof 29 yrs 22 days 60Benner, Susan C. SPU Civil Engineering Specialist Sr 21 yrs 274 days 55Bernal, Jenny SDOT Utility Laborer 21 yrs 248 days 58Berube, Frederick Alton Library Janitor 7 yrs 206 days 62Binns,Gloria J. SPU Utility Account Rep I 29 yrs 205 days 58Blair, William G. Parks Planning & Dev Spec II 10 yrs 270 days 68Boring Pamela D. Vested Vested 15 yrs 271 days 61Bounds, Kenneth R. Parks Executive 3 31 yrs 13 days 56Bovee,Rita E Library Administrative Specialist 23 yrs 145 days 56Bradley, Patricia S. Parks Heavy Truck Driver 25 yrs 22 days 61Braggs,Richard J Jr DPD Permit Process Leader 36 yrs 131 days 64Brander, William P. Police Dispatcher 11 yrs 335 days 57Brittenham, Alan E. Fleets Manager 1 26 yrs 196 days 54Bruton, Patricia A K.C. Health Application Worker 29 yrs 94 days 60Burr, Raleigh E. SDOT Civil Engineering Specialist Assoc 15 yrs 203 days 69Busbice, Susan A. Vested Vested 5 yrs 8 days 62Bynum,Charles r. Metro Transit Service Quality Supv 40 yrs 332 days 68Cahall, John Human Services Counselor 7 yrs 236 days 66Cain, Pamela S. Police Info Technology Prof 16 yrs 15 days 57Carlson, Patrick T. City Light Lineworker 20 yrs 121 days 65Casler, Paul L. Parks Pool Maint Worker 18 yrs 266 days 69Cassidy,Martin E Fleets Info Technology Prof 19 yrs 318 days 57Castaneda, Cesar Q. Vested Vested 20 yrs 24 days 52Chung,Voui C. City Light/Dual Electrical Service Rep Sr 3 yrs 322 days 64Claus, Carmen S Vested Vested 11 yrs 50 days 57Cohen,Sandra Lynn Law/Dual Assistant City Attorney 14 yrs 6 days 55Collings,Terry R. Library Executive 2 17 yrs 202 days 64Compton, Jacque Lynn Vested Vested 20 yrs 119 days 55

Seattle City Employees' Retirement System Statistical Section
54(continued) .
SEATTLE CITY EMPLOYEES’ RETIREMENT SYSTEMSERVICE RETIREMENTS GRANTED IN 2007
Name Department Position Years of Service AgeConrad, Donald J. SPU Water Pipe Wkr Sr 34 yrs 354 days 64Covington, Germaine W. Civil Rights Executive 2 29 yrs 54 days 62Cruz, Lorenza L. DEA Principal Accountant 27 yrs 92 days 66Darden, Thomas R. Vested Vested 5 yrs 28 days 65Das,Deb K Vested Vested 20 yrs 36 days 71Davis, Billy H City Light Electrical Const & Maint. Superv 12 yrs 6 days 57Davis, Donald F. City Light Communicatios Electrician II 27 yrs 235 days 57DeDesrochers, Sylvia R. DPD Permit Process Leader 20 yrs 8 days 60Dennis, Robert M. DPD Elevator Inspector Sr 20 yrs 329 days 66Depew, Maureen F. Vested Vested 10 yrs 227 days 57Derr,Malcolm D SPU Civil Engineering Specialist Sr 37 yrs 180 days 59Disend, Claudia Jean Library Executive 2 5 yrs 2 days 62Dizon,Ester A. City Light Customer Service Rep 27 yrs 219 days 61Dodge, Russell K. SPU Surveyor Chief 19 yrs 295 days 62Donner, Richard G. SPU Water Quality Engr Sr 26 yrs 2 days 60Downs, John E. City Light Line Crew Chief 37 yrs 293 days 62Drury, Kim E. ESD Strategic Advisor 2 17 yrs 45 days 56Duggan,John Francis Vested Vested 12 yrs 203 days 59Duris , Robert Vested Vested 15 yrs 57 days 62Dy,Dolores Yu Fleets Accounting Technician II 16 yrs 169 days 68Emerson, Beth C. K.C. Health Administrative Supp Asst 30 yrs 352 days 52Erdman, Marlin Robert SPU Utility Account Representative 31 yrs 158 days 64Evans,Mary Lynne Vested/Dual Vested 2 yrs 121 days 64Felty, Diane SDOT Administrative Specialist I 10 yrs 118 days 69Ferrari, Paul J. City Light Info Technology Prof 27 yrs 22 days 63Ferrero, Ernest J. Parks Capital Projects Coord Sr 37 yrs 139 days 66Finkley, Dolores V. City Light Administrative Specialist II 29 yrs 9 days 60Finney, Earl L. SDOT Truck Driver 40 yrs 36 days 65Fischer, Christie A. Vested/Dual Vested 1 yr 361 days 56Fleissner, Dan W. Vested Vested 9 yrs 74 days 62Foote Jr.,Donald Perrie City Light Electrical Service Rep Sr 20 yrs 60 days 61Fox, Howard A. Library Managing Librarian II 31 yrs 276 days 58Franklin , John Marvin ESD Executive 4 13 yrs 98 days 61Frederickson, Patricia M. Vested Vested 9 yrs 363 days 63Frost, Barbara S. Law City Attorney Sr 13 yrs 330 days 58Fulton, Barbara J Vested Vested 5 yrs 331 days 62Fulwider, Lois M. City Light Energy Conserv Rep Sr 30 yrs 19 days 58Gardiner, Judith F Muni Courts Administrative Specialist I 5 yrs 246 days 65Garland, Teresa L Vested Vested 17 yrs 14 days 57Gaston, Nancy Jean City Light Administrative Specialist I 7 yrs 19 days 71Gayotin,Wilfredo C City Light Janitor 17 yrs 9 days 62Geist, Arlene M. City Light Economist 14 yrs 57 days 64Gentleman,Jimmy D. Vested/Dual Vested 4 yrs 118 days 62Gertig, Joann Glass Library Library Associate II 17 yrs 263 days 58Gibbs, Margaret L. SDOT Cement Finisher 22 yrs 74 days 59Goett,Douglas F. SPU Capital Projects Coord Sr 42 yrs 304 days 64Goode, Mona Vested Vested 7 yrs 116 days 62Goode, Robert J. Parks Maintenance Laborer 26 yrs 42 days 56Gorton, Linda Vested Vested 14 yrs 244 days 60
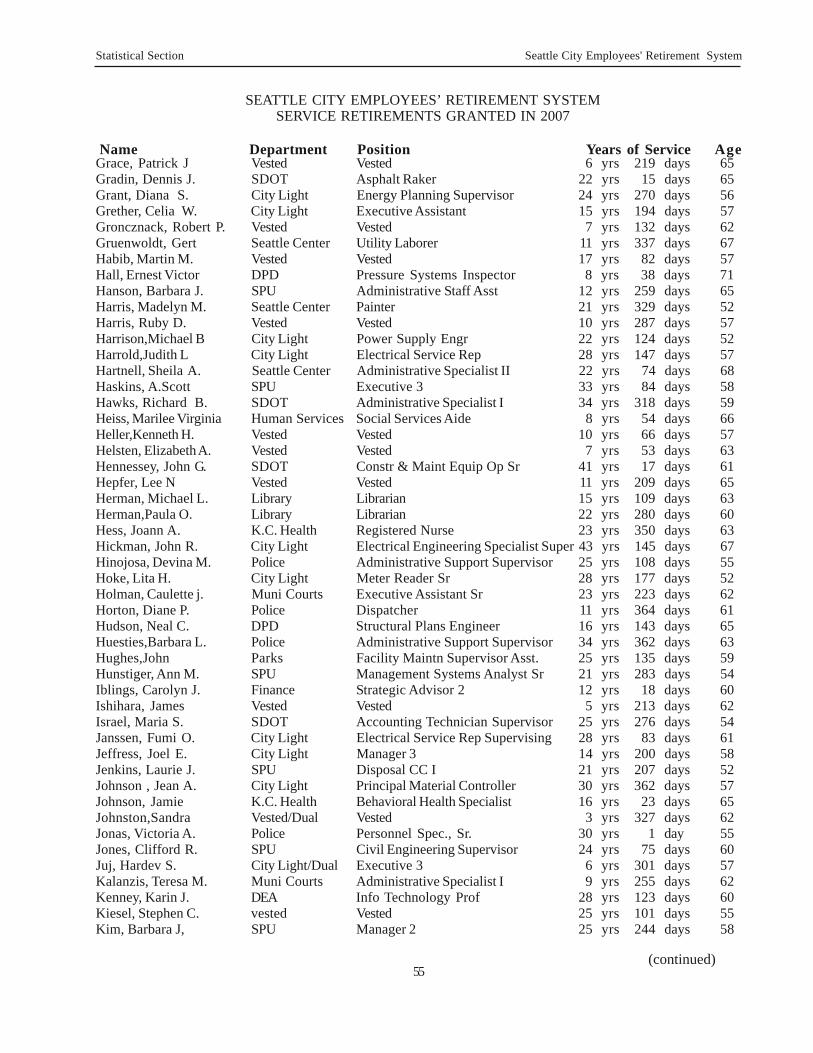
Statistical Section Seattle City Employees' Retirement System
SEATTLE CITY EMPLOYEES’ RETIREMENT SYSTEMSERVICE RETIREMENTS GRANTED IN 2007
Name Department Position Years of Service Age
(continued) .(continued) .55
Grace, Patrick J Vested Vested 6 yrs 219 days 65Gradin, Dennis J. SDOT Asphalt Raker 22 yrs 15 days 65Grant, Diana S. City Light Energy Planning Supervisor 24 yrs 270 days 56Grether, Celia W. City Light Executive Assistant 15 yrs 194 days 57Groncznack, Robert P. Vested Vested 7 yrs 132 days 62Gruenwoldt, Gert Seattle Center Utility Laborer 11 yrs 337 days 67Habib, Martin M. Vested Vested 17 yrs 82 days 57Hall, Ernest Victor DPD Pressure Systems Inspector 8 yrs 38 days 71Hanson, Barbara J. SPU Administrative Staff Asst 12 yrs 259 days 65Harris, Madelyn M. Seattle Center Painter 21 yrs 329 days 52Harris, Ruby D. Vested Vested 10 yrs 287 days 57Harrison,Michael B City Light Power Supply Engr 22 yrs 124 days 52Harrold,Judith L City Light Electrical Service Rep 28 yrs 147 days 57Hartnell, Sheila A. Seattle Center Administrative Specialist II 22 yrs 74 days 68Haskins, A.Scott SPU Executive 3 33 yrs 84 days 58Hawks, Richard B. SDOT Administrative Specialist I 34 yrs 318 days 59Heiss, Marilee Virginia Human Services Social Services Aide 8 yrs 54 days 66Heller,Kenneth H. Vested Vested 10 yrs 66 days 57Helsten, Elizabeth A. Vested Vested 7 yrs 53 days 63Hennessey, John G. SDOT Constr & Maint Equip Op Sr 41 yrs 17 days 61Hepfer, Lee N Vested Vested 11 yrs 209 days 65Herman, Michael L. Library Librarian 15 yrs 109 days 63Herman,Paula O. Library Librarian 22 yrs 280 days 60Hess, Joann A. K.C. Health Registered Nurse 23 yrs 350 days 63Hickman, John R. City Light Electrical Engineering Specialist Super 43 yrs 145 days 67Hinojosa, Devina M. Police Administrative Support Supervisor 25 yrs 108 days 55Hoke, Lita H. City Light Meter Reader Sr 28 yrs 177 days 52Holman, Caulette j. Muni Courts Executive Assistant Sr 23 yrs 223 days 62Horton, Diane P. Police Dispatcher 11 yrs 364 days 61Hudson, Neal C. DPD Structural Plans Engineer 16 yrs 143 days 65Huesties,Barbara L. Police Administrative Support Supervisor 34 yrs 362 days 63Hughes,John Parks Facility Maintn Supervisor Asst. 25 yrs 135 days 59Hunstiger, Ann M. SPU Management Systems Analyst Sr 21 yrs 283 days 54Iblings, Carolyn J. Finance Strategic Advisor 2 12 yrs 18 days 60Ishihara, James Vested Vested 5 yrs 213 days 62Israel, Maria S. SDOT Accounting Technician Supervisor 25 yrs 276 days 54Janssen, Fumi O. City Light Electrical Service Rep Supervising 28 yrs 83 days 61Jeffress, Joel E. City Light Manager 3 14 yrs 200 days 58Jenkins, Laurie J. SPU Disposal CC I 21 yrs 207 days 52Johnson , Jean A. City Light Principal Material Controller 30 yrs 362 days 57Johnson, Jamie K.C. Health Behavioral Health Specialist 16 yrs 23 days 65Johnston,Sandra Vested/Dual Vested 3 yrs 327 days 62Jonas, Victoria A. Police Personnel Spec., Sr. 30 yrs 1 day 55Jones, Clifford R. SPU Civil Engineering Supervisor 24 yrs 75 days 60Juj, Hardev S. City Light/Dual Executive 3 6 yrs 301 days 57Kalanzis, Teresa M. Muni Courts Administrative Specialist I 9 yrs 255 days 62Kenney, Karin J. DEA Info Technology Prof 28 yrs 123 days 60Kiesel, Stephen C. vested Vested 25 yrs 101 days 55Kim, Barbara J, SPU Manager 2 25 yrs 244 days 58

Seattle City Employees' Retirement System Statistical Section
56
SEATTLE CITY EMPLOYEES’ RETIREMENT SYSTEMSERVICE RETIREMENTS GRANTED IN 2007
Name Department Position Years of Service Age
(continued) .
Kipp, Gregory M. Vested Vested 11 yrs 76 days 60Knutson,Michael W. City Light Elec-Con-WkgCC-Asg-Ccoord 32 yrs 260 days 61Kojima, Norris N. Fleets Auto Mechanic 27 yrs 212 days 63Konkler,Claudette E Muni Courts Probation Counsler I 21 yrs 28 days 64Kosbab, Delyn F City Light Electrical Service Rep 25 yrs 76 days 52Kravchuk, William SDOT Parking Meter Repairer Sr 35 yrs 78 days 65Krogh,Janet L. Finance Administrative Specialist III 32 yrs 339 days 60Kurlo, Wilhelm City Light Hydroelectric Operator II 30 yrs 69 days 56Lam, Wilfred K. Vested Vested 27 yrs 3 days 52Large, Jeanne M. Vested/Dual Vested 2 yrs 360 days 65Larsen, Christine A. City Light Manager 3 31 yrs 277 days 54Laurich, Carol A. Vested Vested 15 yrs 102 days 57Le, Jimmy Seattle Center Security Officer Sr 25 yrs 119 days 64Lewis III, Joseph W. Parks Administrative Staff Analyst 36 yrs 95 days 62Lewis, Bardow M. Parks Grounds Maintenance CC 30 yrs 2 days 49Leyva, Erlando Santos Fleets Manager I 13 yrs 215 days 65Li,Zoya V. Vested Vested 7 yrs 208 days 70Lighter, Frederick J. Vested Vested 8 yrs 283 days 65Lombardi, Teresa M SPU Manager 3 30 yrs 182 days 53Lomont,Jane F Library Administrative Secretary 16 yrs 106 days 67Look, Estelita S. City Light Customer Service Rep 29 yrs 92 days 70Makasini, Ilaisa SPU Drainage & Wstwtr Coll Lead Wkr 26 yrs 142 days 65Marsh, jonathan G. SPU Civil Engineer Sr 20 yrs 2 days 60Martinez,Ronald E Executive Construction Mgmt Specialist 22 yrs 260 days 57Mash,Victoria R. Library Page 37 yrs 150 days 60Mathers,Sharon L. Parks Public Ed Prog Spec 14 yrs 209 days 59Matsui, Jerry H. Vested Vested 19 yrs 114 days 63McCoy, Larry SDOT Maintenance Laborer 10 yrs 342 days 62McLendon, Larry E. City Light Auto Mechanic Sr 25 yrs 5 days 58Melnyk, Michael S. City Light Manager 3 39 yrs 107 days 61Mendenhall, Clay A. Parks Golf Course Tech 30 yrs 15 days 50Mercer,Michael G SPU Planning & Dev Spec II 25 yrs 339 days 57Mercure Jr.,Delbert V. Finance Executive 2 29 yrs 283 days 62Metcalf, Carol J. DEA Executive 2 25 yrs 213 days 57Mickelson, Michael A. City Light Warehouser 29 yrs 16 days 66Miller, Alan K. DPD Permit Process Leader 6 yrs 37 days 62Miller, Richard P. SDOT Executive 2 28 yrs 104 days 54Million, Noell SDOT Civil Engineering Specialist Asst III 26 yrs 79 days 60Mithoug, Laura L. SDOT Street Maintenance Supervisor 30 yrs 15 days 52Morrison, Willie C. City Light Meter Reader 31 yrs 307 days 62Mostow,Kenneth L. SPU Planning Associate 12 yrs 296 days 65Nelson, David B. DPD Bilding Inspector Structural 25 yrs 156 days 65Norberg,Teresa L. Police Administrative Support Supv 24 yrs 347 days 64Oki, Arthur M. SPU/Dual Executive Assistant 16 yrs 91 days 54Oliver,Edwin D SPU Water Quality Analyst 15 yrs 290 days 57Olsen, Sharon K. SPU Forest Maint Crew Chief 26 yrs 93 days 60Omoth, Robert N. SDOT Maintenance Laborer 10 yrs 58 days 62Orr,Barbara C. SPU Administrative Specialist II 5 yrs 176 days 63O’Shea, Mary K. K.C. Health PH Nurse 23 yrs 337 days 65

Statistical Section Seattle City Employees' Retirement System
SEATTLE CITY EMPLOYEES’ RETIREMENT SYSTEMSERVICE RETIREMENTS GRANTED IN 2007
Name Department Position Years of Service Age
57(continued) .
Panchenko, Anatoly DEA Principal Accountant 42 yrs 325 days 70Parker, Lorie C. Vested Vested 6 yrs 320 days 62Payne, Dana A. Vested Vested 24 yrs 52 days 52Penttila,Richard D Parks Manager 3 27 yrs 139 days 57Petersen,John W. SDOT Arboriculturist 26 yrs 223 days 62Peterson, Donna L. Vested/Dual Vested 0 yrs 307 days 60Peterson, Kristina A. City Light Meter Elctn 28 yrs 12 days 54Philips, Gordon M. Fleets Painter Crew Chief 25 yrs 264 days 52Pieratt,Erle B Muni Courts Probation Counsler I 21 yrs 223 days 59Pontius, Brenda Lee Vested Vested 8 yrs 196 days 62Post, Ernestine L. DEA Info Technology Prof 28 yrs 139 days 64Putnam, Theodore Southwick Seattle Center Events Services Rep Sr 17 yrs 105 days 66Rechterman, Alan E. Vested Vested 22 yrs 145 days 52Reed, Christina C. OED Strategic Advisor 1 16 yrs 91 days 63Ricafort, Lito P City Light Structural Painter 27 yrs 297 days 60Richards, Garry D SDOT Manager 3 8 yrs 126 days 59Richey, Lloyd H Library Janitor 15 yrs 305 days 60Richter, Sonja A. Police Crime Prev Coord 17 yrs 259 days 62Richter,George I. Metro Transit Bus Driver 40 yrs 64 days 64Rivera, Geraldine M Neighborhoods Customer Service Rep 6 yrs 207 days 69Rose, Paula A. City Light Stat Const & Maint Supv II 27 yrs 0 days 59Ross,Mary B. Library Training & Dev Managing Librn 25 yrs 11 days 58Ross,Michael C. Parks Utility Laborer 27 yrs 82 days 62Ruiz, Santiago City Light Electrician 21 yrs 124 days 65Rumery,Susan S Fleets Title Examiner 22 yrs 52 days 65Russell, Douglas G. SDOT Bridge Operator 32 yrs 257 days 78Sampson, Jim A. SPU Senior Accountant 28 yrs 174 days 58Sanchez, Cornelio C. SPU Construction & Maint Equip Oper 22 yrs 51 days 59Scannell, John R, Vested Vested 15 yrs 70 days 59Scheideman, Leroy Harry Police Administrative Specialist II 20 yrs 211 days 62Schneider, Karl A. Fleets Auto Mechanic Sr 25 yrs 26 days 52Schweinfurth, Karla G. City Light Meter Elctn CC Asg C Coord 28 yrs 276 days 53Senger, Alfred J SDOT Street Maintenance 30 yrs 298 days 55Sheldon, Cathy Rae Library Librarian 21 yrs 1 day 59Simpson, Eddie Parks Maintenance Laborer 18 yrs 9 days 65Sjodin, Deborah E. Library Librarian 35 yrs 53 days 59Smith, Norman Vested Vested 5 yrs 191 days 65Smith, Steven Richard SPU Water Systems Operator 31 yrs 119 days 62Smith, Todd R. DoIT Accounting Technician II 25 yrs 38 days 58Songco,Esperanza P DPD Accounting Technician II 15 yrs 159 days 74Soper,R.Craig Vested Vested 8 yrs 276 days 56Soreng, Don D. City Light Crew Chief 23 yrs 326 days 63Southard, John E. Police Dispatcher 3 21 yrs 47 days 56Sparkman, Jerry R. SDOT Street Paving Crew Chief 31 yrs 73 days 55Sperlin, Donald W. SPU Utility Account Representative 30 yrs 123 days 57Sprinkle, Robert M K.C. Health Corrections Officer 36 yrs 207 days 59Stanek Jr, Joe J SPU Civil Engineering Specialist Asst I 30 yrs 300 days 58Stepp, William P. City Light Material Supplier 32 yrs 251 days 65Stevens, Madeline J. City Light Customer Service Rep Sr 31 yrs 260 days 61

Seattle City Employees' Retirement System Statistical Section
SEATTLE CITY EMPLOYEES’ RETIREMENT SYSTEMSERVICE RETIREMENTS GRANTED IN 2007
Name Department Position Years of Service Age
58
Total Service Retirements 284
DISABILITY RETIREMENTS
Nichols, Rosemarie City Light Principal Controller 22 yrs 178 days 49
Total Disability Retirements 1
Stevenson,Richard L. SDOT Engineering & Plans Rev Mgr I 38 yrs 289 days 58Strand , Edwin W. City Light Tree Trimming Rep 40 yrs 283 days 65Sullivan, Marty L. Police Manager 2 35 yrs 278 days 61Sundvall, Mitsu A. Seattle Center Administrative Specialist II 18 yrs 214 days 70Sussex , Alan H. City Light Journeyworker in Charge 28 yrs 18 days 65Swan, Mardelle SPU Utility Account Rep I 33 yrs 360 days 60Tando, Karen A. Police Latent Print Examiner 30 yrs 0 days 52Tang, Lai-Yee Human Services Grants & Contracts Spec Sr 26 yrs 236 days 65Tanner, Thomas John SPU Executive 3 7 yrs 340 days 62Tarr,Dick Erwyn Human Services Grants & Contracts Specialist 6 yrs 278 days 63Thompson , Florease City Light Training & Dev Coord 23 yrs 98 days 61Torrence, Sandra L. Muni Courts Accounting Technician III 30 yrs 20 days 57Treadwell, Fred C. Police Executive 1 27 yrs 134 days 59Trieu,Hoa SPU Civil Engineering Specialist Asst I 23 yrs 84 days 56Trowler, Jo Ann Library Library Technician 16 yrs 109 days 51Trujillo,Michael J Vested Vested 23 yrs 6 days 59Tsang, Helen Kung SDOT Finance Analyst Sr 15 yrs 260 days 63Tulip, Michael Douglas Police Communication Dispatcher I 11 yrs 131 days 61Tuttle, John C. Vested/Dual Vested 0 yrs 333 days 57Varden, Robert C. Police Dispatcher 20 yrs 23 days 65Vaughn, Christine Vested Vested 6 yrs 117 days 62Veach,Ronald L. Muni Courts Probation Counsler I 17 yrs 183 days 66Voss, Lonnie L. City Light Hydroelectric Maint Mech 22 yrs 321 days 62Wallace, Dave E. Parks Maintenance Laborer 23 yrs 194 days 56Warren, Walter D. City Light Manager 3 30 yrs 159 days 52Washington, Anthony L. City Light Cablesplicer Net Area 27 yrs 277 days 56Weber, Susan J. Library Library Associate II 39 yrs 169 days 59Wells,Karen V K.C. Health Nutritional Asst 28 yrs 264 days 59Westerman, William A City Light Electrical Engineering Specialist Sr 35 yrs 174 days 64Whalley, Douglas B. Vested Vested 5 yrs 261 days 62Wilkinson, Robert W. , Jr. Parks Executive 2 11 yrs 57 days 68Willey, Gundl S. K.C. Health Administrative Specialist II 24 yrs 104 days 66Williams, Daniel DPD Electrical Inspector 7 yrs 103 days 64Winge, William H SPU Watershed Inspector 26 yrs 324 days 57Wirachowsky, Paula E. Vested Vested 25 yrs 19 days 53Wood, Teresa G. Vested Vested 7 yrs 355 days 62Wright, Lewis W. City Light Meter Reader 40 yrs 287 days 70Yamasaki, Valorie Y. SDOT Street Maintenance Supervisor 34 yrs 139 days 62Young, Billie L. Human Services Executive 1 26 yrs 7 days 56

Statistical Section Seattle City Employees' Retirement System
59
SEATTLE CITY EMPLOYEES’ RETIREMENT SYSTEMRETIRED MEMBERS DECEASED IN 2007
Retired Date Date of Age atName For Department Retired Death Death
(continued) .
Ackley-Bell,Pamela S Service Dual Member 06/29/2004 08/05/2007 61Aho,Alan E Service City Light 01/01/1990 08/18/2007 72Alfrey,Douglas W Service Comptrollers 08/01/1978 02/22/2007 85Anthony,Bruce C Service Parks 07/01/1992 03/06/2007 92Ashford,Walter S Service City Light 05/23/1980 04/08/2007 89Bannister,Robert W Service City Light 01/01/1976 11/30/2007 88Bartelson,Grace M Service Engineering 10/01/1975 11/27/2007 91Benadom,Walter E Service Building 08/01/1978 09/09/2007 87Bergum,Eva F Service Health 06/01/1980 06/01/2007 92Bishop,Guy R Service City Light 04/04/1981 07/15/2007 83Blackburn,Faye L Service City Light 09/01/1974 08/16/2007 97Brehan,Sue Y Service Water 02/01/1979 03/05/2007 91Brenna,Howard N Service Fire 10/01/1987 05/10/2007 83Brewer,Lawrence W Service Engineering 05/01/1974 05/18/2007 86Champlin, Norman H Service DCLU 09/10/2003 10/13/2007 71Clark,Richard Service Parks 09/10/1996 12/02/2007 80Compton,Karen Disability Muni Courts 05/06/1999 03/12/2007 64Corliss,Robert T Service City Light 04/01/1978 06/24/2007 87Coston,Edna Service Comptrollers 09/01/1966 03/05/2007 99Crandall,Lyle Service City Light 06/01/1979 07/01/2007 93Crosby,Raymond Service City Light 08/01/1987 08/22/2007 80Cuendet,Marie Service Dual Member 10/01/1999 07/17/2007 70Dahl, Wayne L. Service Metro-Transit 09/02/2003 07/16/2007 65Dahl,Halvor E Service City Light 05/01/1984 10/14/2007 83Dailey,John J Service City Light 04/01/1985 07/17/2007 79Dempsey,Betty J Service Health 01/01/1985 04/07/2007 84Dickey,Alfred Service Police 01/31/1996 12/18/2007 77Dinovi,George J Service SPU 11/15/2006 09/21/2007 59Drake,Arnold Service City Light 06/01/1977 07/02/2007 91Drobnack,Edward J Service City Light 06/18/1976 01/13/2007 89Dunlap,Thomas J Service City Light 04/03/1979 10/28/2007 89Dunscomb,John H Service Water 05/01/1990 08/20/2007 80Egan,Donald J Service City Light 05/01/1975 08/26/2007 93Emerson, Beth C. Service K.C. Health 02/03/2007 06/07/2007 53Eng,Patricia W Service City Light 05/03/2006 01/25/2007 59Evans Jr,Charles A Service City Light 04/26/1983 01/16/2007 86Fearey,John W Service Seattle Center 01/01/1983 07/21/2007 84Fisher,Earlena C Service City Light 07/01/1995 07/22/2007 76Fox,Sally W Service Personnel 11/02/2005 10/26/2007 62Freeman,Helen E Service Parks 03/01/1989 09/20/2007 75Gates, Alice P. Service Dual Member 05/23/2002 02/14/2007 69George,Virginia S Service Library 12/01/1988 09/16/2007 80Gillen,Wesley N Service Engineering 04/01/1986 07/21/2007 75Good,Vivian J Service DCLU 09/01/1988 05/22/2007 83Gordon,Harry H Service Metro-Transit 09/02/1981 01/20/2007 89Gray,M Dean Service City Light 01/09/1988 09/20/2007 70

Seattle City Employees' Retirement System Statistical Section
60
SEATTLE CITY EMPLOYEES’ RETIREMENT SYSTEMRETIRED MEMBERS DECEASED IN 2007
Retired Date Date of Age atName For Department Retired Death Death
(continued) .
Gray,Wayne P Service Water 03/31/1990 01/16/2007 84Griffin,William W Service Parks 09/01/1980 08/19/2007 88Gualtier,Bernadette E Service Library 02/01/1982 03/27/2007 91Haala,James Service Metro-Transit 04/09/1996 09/03/2007 73Halter,Thomas E Service City Light 06/01/1981 03/06/2007 81Hanada,Pete I Service DAS 05/01/1986 04/16/2007 85Hanley,Thomas F Service City Light 01/01/1974 11/15/2007 90Hanseling,Parthine A Service DAS 04/01/1982 08/12/2007 87Hanson,Elen Service Health 05/01/1994 08/10/2007 82Haster,John S Service K.C. Jail 07/01/1986 02/28/2007 83Hatch,A Lloyd Service K.C. Health 10/16/2005 05/29/2007 83Haverly,Kathryn Service K.C. Health 04/01/1980 03/13/2007 90Healey,Ellis L Service General Services 11/01/1976 12/18/2007 91Helmuth,William Service City Light 09/07/1989 06/21/2007 71Hirai,Masashi Service Fleets & Facilities 08/02/2005 03/02/2007 78Holt,Harold R. Service City Light 07/02/1997 06/04/2007 78Hooks,Norma P Service Muni Courts 11/01/1989 03/12/2007 88Hoover,Charlotte M Service Personnel 05/01/1989 01/14/2007 79Howell,Douglas J Service Engineering 06/02/1998 03/17/2007 70Huff,Warren R Service City Light 05/01/1990 12/13/2007 81Jacobs,Maetreon Service Parks 03/30/1985 12/11/2007 86Jensen,Ernest L Service City Light 02/01/1979 09/01/2007 91Kamada,Diane L Service Fire 09/01/1995 04/01/2007 63Kamihara,George Service DAS 01/04/1992 09/30/2007 79Keith,Robert E Service City Light 10/02/1981 03/25/2007 77Kennebrew,John Service Engineering 01/01/1985 01/28/2007 80Kennell,James E Service SPU 03/17/2006 04/12/2007 86Kenyon,Larry Service Seattle Center 02/01/2001 07/16/2007 71Kivimaki,Lauri E Service City Light 06/13/1987 07/08/2007 83Knapp,Dorothy M Service Library 03/01/1978 01/11/2007 93Kroener,E G Service DAS 09/01/1985 02/09/2007 86Kunnap, Betty L Service ESD 08/02/2002 06/03/2007 67Laney,Robert R Service City Light 09/20/2006 06/01/2007 58London,Louis Service Seattle Center 06/01/1983 01/01/2007 81Longanecker,Bernice M Service Engineering 04/01/1984 02/18/2007 88Luchau, Leonard Service Seattle Center 01/01/2004 05/30/2007 70Lynd, Francella D Service Vested 03/07/2003 10/02/2007 68Lyons,Eleanor J Service City Light 09/01/1977 07/28/2007 93Macdonald,Donald Service Seattle Center 08/01/1988 12/29/2007 79Mackay,Mildred H Service Engineering 05/01/1972 01/14/2007 96Madden,Eloise H Service Library 03/01/1978 12/05/2007 88Madsen,Arnold T Service Engineering 02/03/1976 01/10/2007 91Malmanger,Carol M Service City Light 10/01/1991 06/01/2007 72Matthews,Stanley L. Service Fleets & Facilities 02/08/2006 07/05/2007 66McConnell,Zeke Service Seattle Center 12/02/1981 02/04/2007 88McMillan,William S Service Parks 07/01/1987 04/04/2007 83

Statistical Section Seattle City Employees' Retirement System
SEATTLE CITY EMPLOYEES’ RETIREMENT SYSTEMRETIRED MEMBERS DECEASED IN 2007
Retired Date Date of Age atName For Department Retired Death Death
(continued) .61
McNeill,Donald T Service SPU 03/22/1995 10/01/2007 74Merlino,Mary R Service Health 12/01/1974 09/07/2007 98Morgan, Rosalie Service ESD 11/05/2003 05/17/2007 60Morris,Jessie E Service Engineering 07/01/1980 12/27/2007 87Myers,Harvey R Service Seattle Center 02/01/1986 11/23/2007 83Myers,Mae F Service Health 06/01/1977 07/29/2007 89Myhre,John K Service DCLU 04/01/1983 03/16/2007 85Nagaishi,Chiseko Service Enginerring 02/01/1976 09/12/2007 95Nairn,Elsie E Service Muni Courts 03/01/1995 08/07/2007 77Nelson,Vivian M Service Metro-Transit 07/01/1976 07/15/2007 92Noah,Edna J Service Engineering 07/01/1981 05/04/2007 90Nyland,Charlotte M Service Health 08/01/1985 06/07/2007 86O’connor,John Service City Light 04/01/1993 07/06/2007 83Okeefe,Clyde F Service Metro-Transit 03/01/1974 08/28/2007 92Onsager,Richard N Service Treasury 10/01/1983 02/27/2007 77Oswick,Sigurd M Service Parks 09/01/1975 02/06/2007 96Ottele,Alfred M Service City Light 06/01/1977 01/04/2007 92Parsons,Robert C Service City Light 01/07/1998 02/26/2007 59Paschke,Edward C Service Muni Courts 01/01/1986 02/06/2007 90Pattison,Dennis P. Service SPU 08/15/1997 09/17/2007 66Perry,D’annette S Service Health 08/01/1985 07/22/2007 87Petek,Richard D Service Engineering 05/01/1995 10/14/2007 74Peterson,Chalmer H Service Metro-Transit 06/01/1979 08/14/2007 87Pierce,Arlene E Service Fleets & Facilities 01/14/2005 02/19/2007 62Purdy,Betty B Service Health 03/01/1980 09/04/2007 90Purvine,Helen L Service Library 02/01/1990 05/11/2007 90Rankin, Joyce A. Service SEATRAN 08/03/2004 05/11/2007 61Rice,James T Service Water 09/15/1977 01/15/2007 91Rippee,Stuart C. Service City Light 12/05/2001 08/03/2007 59Robb,Harriet A Service Building 07/01/1980 05/21/2007 92Roppo,Lois M Service Fire 08/01/1984 03/15/2007 87Rosen,Helen E Service City Light 08/01/1988 12/16/2007 75Rounds,Esther A Service City Light 04/01/1976 09/09/2007 92Rowe,Clark W Service City Light 11/01/1975 04/09/2007 93Russell,Erleen A R Service Police 09/01/1989 05/23/2007 82Saetrevik,Sigvard Service Parks 05/01/1976 08/09/2007 86Schlaht,Arthur R Service Parks 03/01/1978 08/05/2007 89Sekor,David Service DCLU 04/03/1999 05/20/2007 74Singleton, Susan E. Service Parks 10/01/2002 09/11/2007 61Smiley,Eileen K Service Engineering 04/01/1982 11/20/2007 90Smith,June G Service Parks 04/01/1977 07/30/2007 82Smith,Katherine P Service Health 07/01/1975 03/26/2007 90Sneatlum,Maria Service Parks 12/01/1988 04/25/2007 78Stevens,Frank J Service SPU 05/01/1995 09/29/2007 67Stevenson,Jane Service Seattle Center 01/01/1983 08/20/2007 90Story,Gary Service Seattle Center 04/02/1997 12/11/2007 68Tanaka,Nobuichi Service City Light 02/01/1986 03/21/2007 82

Seattle City Employees' Retirement System Statistical Section
62
SEATTLE CITY EMPLOYEES’ RETIREMENT SYSTEMRETIRED MEMBERS DECEASED IN 2007
Retired Date Date of Age atName For Department Retired Death Death
Average Age of Deceased Pensioner 81.66Average Age of Deceased Disability Pensioner 74.50
Number of Service Pensioners Deceased 155Number of Disability Pensioners Deceased 2
Death Benefits for Deceased Retirees $ 266,000.00Refund Under Option "A" $ 52,732.13Refund Under Disability $ 0.00
SEATTLE CITY EMPLOYEES’ RETIREMENT SYSTEMDEATHS IN ACTIVE SERVICE DURING 2007
Name Position Department Age
Total 8
Average Age 53.13
Braggs Sr,Richard J Permit Process Leader DPD 64Penttila,Richard D Manager 3 Parks 57Wong,Yim S Accountant SPU 57Mercer,Michael G Planning & Dev Spec II SPU 57Trieu,Hoa Civil Eng Spec Asst l SPU 56Trower,Jo Ann Library Technician Library 51Wong-Meserve,Doreen Y Administrative Specialist I Police 53Reynolds,Christopher M Golf Course Technician Parks 30
Taylor,Vernon J Service Water 05/15/1980 10/09/2007 90Thomas,Robert D Service City Light 03/01/1989 06/24/2007 74Thompson,Russell Service City Light 07/01/1974 03/10/2007 94Towne,Vernon W Service Law 10/01/1977 02/27/2007 96Tuffs,Lawrence W Service City Light 03/01/1984 01/02/2007 83Tuffs,Maria M Service Muni Courts 12/01/1985 06/07/2007 83Turner,June Service Muni Courts 05/01/1987 01/12/2007 81Van Amburgh,Mb Service Health 06/01/1973 11/18/2007 96Van Brunt,Nicholas Service Health 01/06/1996 01/23/2007 88Vance,Ernst M Service City Light 06/02/1977 04/21/2007 85Vibber,John Service Parks 05/29/1980 10/30/2007 92Vorris,Beatrice J Service Police 07/01/1982 04/04/2007 86Ware,Martha D Service Library 09/01/1982 07/12/2007 81Washington,Clarence Service Metro-Transit 07/18/1992 10/28/2007 77Welch,Margaret O Service City Light 09/01/1972 02/06/2007 95Wertz,Lee H Service Metro-Transit 09/01/1990 11/13/2007 79Westerman, William A Service City Light 01/10/2007 12/27/2007 65Wills,W H Disability City Light 02/01/1956 03/20/2007 85

Statistical Section Seattle City Employees' Retirement System
DEATH BENEFIT SYSTEMFor The Year Ended December 31, 2007
All active members and those retired members who so elect are covered by the Death Benefit System. The Death BenefitSystem is similiar to a life insurance policy and pays $2,000 to the beneficiary of an active or retired member.
The annual premium for each member is $12, with the City matching this amount. Any additional funds needed to fund theDeath Benefit System come from the undistributed earnings of the Retirement System.
There were 6 (1 vested) deaths in active service and 133 claims from retired employees - a total of 139 claims. This compareswith 16 deaths in active service in 2006, and 118 claims from retired employees - a total of 134. The claims totaled $278,000in 2007, and $268,000 in 2006.
Income from the 16,093 active and retired employees was $ 144,348
Income from Employers:Seattle City Light $ 30,078General Fund 33,192SEATRAN 12,096Seattle Parks Department 15,816Seattle Public Utilities 20,904Finance 5,274Library 9,198Seattle Center 5,652Construction and Land Use 5,934Metro Transit Fund 2,172Employees’ Retirement System 228King County Health & Custodial 3,660
Total from Employer Funds $ 144,204
Total paid into Death Benefit Reserve $ 288,552
Transfer from Undistributed Investment Earnings $ 10,552
$ 278,000
Less: Death Benefit Claims - 2007 $ (278,000)
Death Benefit Reserve Balance December 31, 2007 $ 0.00
UNUSED SICK LEAVE
At the time of retirement, members may elect to receive a cash payment equal to 25% of the monetary value of their “unusedsick leave”. The monetary value is developed by multiplying the number of hours of unused sick leave by the hourly rate,and is calculated and paid to the employee by the employing department when the person retires immediately followingemployment. Vested members retiring at a future date do not receive a sick leave payout.
The member may elect to write a check payable to the City, and deliver it to the Retirement System, for the amount of the sickleave payout, and this amount will be placed in an account to be used to pay health care premiums for self and spouse. Sincethe health care premiums are paid from the Health Care Fund, these funds do not accrue interest. If the retiree dies before thecredit is exhausted, the surviving spouse may use the remaining credit to pay for health care coverage.
In the event of the death of an active employee eligible for sick leave benefits, the employing department will pay thebeneficiary an amount equal to 25% of said employees’ accumulated unused sick leave.
Of the 284 service retirements during 2007, there were no retirees that deposited the value of their sick leave payout to anaccount that will be used to pay their medical premiums.
63

Seattle City Employees' Retirement System Statistical Section
64
Percentage of Average SalaryYears of Years ofRetirement RetirementCredit Credit
AgeAny 52 53 54 55 56 57 58 59 60 61 62 63 64 65
30 60 60 60 60 60 60 60 60 60 60 60 60 60 60 60 3029 58 58 58 58 58 58 58 58 58 58 58 58 58 58 2928 56 56 56 56 56 56 56 56 56 56 56 56 56 56 2827 51.3 54 54 54 54 54 54 54 54 54 54 54 54 54 2726 46.8 49.4 52 52 52 52 52 52 52 52 52 52 52 52 2625 42.5 45 47.5 50 50 50 50 50 50 50 50 50 50 50 2524 38.4 40.8 43.2 45.6 48 48 48 48 48 48 48 48 48 48 2423 34.5 36.8 39.1 41.4 43.7 46 46 46 46 46 46 46 46 46 2322 30.8 33 35.2 37.4 39.6 41.8 44 44 44 44 44 44 44 44 2221 27.3 29.4 31.5 33.6 35.7 37.8 39.9 42 42 42 42 42 42 42 2120 24 26 28 30 32 34 36 38 40 40 40 40 40 40 2019 28.88 30.02 31.16 32.3 33.44 34.58 35.72 36.86 38 1918 27.36 28.44 29.52 30.6 31.68 32.76 33.84 34.92 36 1817 25.84 26.86 27.88 28.9 29.92 30.94 31.96 32.98 34 1716 24.32 25.28 26.24 27.2 28.16 29.12 30.08 31.04 32 1615 22.8 23.7 24.6 25.5 26.4 27.3 28.2 29.1 30 1514 21.28 22.12 22.96 23.8 24.64 25.48 26.32 27.16 28 1413 19.76 20.54 21.32 22.1 22.88 23.66 24.44 25.22 26 1312 18.24 18.96 19.68 20.4 21.12 21.84 22.56 23.28 24 1211 16.72 17.38 18.04 18.7 19.36 20.02 20.68 21.34 22 1110 15.2 15.8 16.4 17 17.6 18.2 18.8 19.4 20 109 16.38 16.92 17.46 18 98 Not Eligible to Retire 14.56 15.04 15.52 16 87 12.74 13.16 13.58 14 76 10.92 11.28 11.64 12 65 9.1 9.4 9.7 10 5
Identify percentage factor above that applies to your age and years of service. .
Percentages increase with each day of service.Maximum percentage factor = 60% with 30 years of retirement credit.
Average Salary = Average of Highest Consecutive 24 months.
If Expected retirement date is 2 years or more from now, use todays salary as estimated Final Average Salary.
Eligibility for Retirement 5 to 9 years of service - and are age 62 or older10 to 19 years of service - and are age 57 or older20 to 29 years of service - and are age 52 or older
30 years of service - any age .
Example: 22 years of credit, age 56, and final average salary is $2,500
$ 2,500 39. 6 % $ 990Final Average Salary x percentage factor from table = Estimated Pension Amount
based on age and years of credit .
This form is only intended to provide a general profile of how an estimated pension amount is calculated.
Any unpaid leave during your career is not counted towards retirement credit.