a patient-specific framework for the analysis of the haemodynamics in patients with ventricular...
DESCRIPTION
cardiologiaTRANSCRIPT

7/17/2019 A Patient-Specific Framework for the Analysis of the Haemodynamics in Patients With Ventricular Assist Device
http://slidepdf.com/reader/full/a-patient-specific-framework-for-the-analysis-of-the-haemodynamics-in-patients 1/24
MOX–Report No. 11/2012
A Patient-Specific Framework for the Analysis of theHaemodynamics in Patients with Ventricular Assist
Device
Bonnemain, J.; Faggiano, E.; Quarteroni A.;Deparis S.
MOX, Dipartimento di Matematica “F. Brioschi”
Politecnico di Milano, Via Bonardi 9 - 20133 Milano (Italy)
[email protected] http://mox.polimi.it

7/17/2019 A Patient-Specific Framework for the Analysis of the Haemodynamics in Patients With Ventricular Assist Device
http://slidepdf.com/reader/full/a-patient-specific-framework-for-the-analysis-of-the-haemodynamics-in-patients 2/24

7/17/2019 A Patient-Specific Framework for the Analysis of the Haemodynamics in Patients With Ventricular Assist Device
http://slidepdf.com/reader/full/a-patient-specific-framework-for-the-analysis-of-the-haemodynamics-in-patients 3/24
A Patient-Specific Framework for the Analysis of the
Haemodynamics in Patients with Ventricular Assist
Device∗
Jean Bonnemain†, Elena Faggiano♯, Alfio Quarteroni♯ † and Simone Deparis†
February 9, 2012
† CMCS– Modeling and Scientific ComputingMATHICSE – Mathematics Institute of Computational Science and Engineering
EPFL – Ecole Polytechnique Federale de LausanneStation 8, CH-1015 Lausanne, Switzerland.
<jean.bonnemain,alfio.quarteroni,simone.deparis>@epfl.ch
♯ MOX– Modellistica e Calcolo ScientificoDipartimento di Matematica “F. Brioschi”
Politecnico di Milanovia Bonardi 9, I-20133 Milano, Italy
[email protected], [email protected]
Keywords: Image segmentation, mesh generation, fluid-structure interaction,patient-specific, ventricular assist device.
Abstract
Nowadays ventricular assist devices play an important role in the treat-ment of terminal heart failure. While the devices themselves have beenwidely studied there are no studies of patient-specific numerical simulationin this context. This could be explained by the fact that the presence of
the device induces metallic artifacts and noise in the acquired images sothat conventional segmentation techniques fail. The aim of our work is topropose a robust framework for the segmentation of medical images of poorquality, the generation of high quality meshes and for the patient-specificanalysis of the collected data via fluid-structure interaction (FSI) numer-ical simulations. First images are processed using histogram adjustment,histogram equalization, and gradient anisotropic diffusion filter. The wa-tershed algorithm is then applied and the result is refined by the use of
∗This work has been supported by the European Research Council Advanced Grant Math-
card, Mathematical Modelling and Simulation of the Cardiovascular System Project ERC-2008-
AdG 227058, and by the Swiss National Fund grant 323630-133898.
1
7/17/2019 A Patient-Specific Framework for the Analysis of the Haemodynamics in Patients With Ventricular Assist Device
http://slidepdf.com/reader/full/a-patient-specific-framework-for-the-analysis-of-the-haemodynamics-in-patients 4/24
morphological operators. Then our framework allows the generation of two
conforming meshes, one for the arterial lumen and the other for the arterialwall, ready for FSI simulations. We also describe the numerical model andmethods used to perform FSI simulations. Final results performed on twopatients demonstrate the ability of our methods: the whole strategy resultssuitable, robust, and accurate for patient-specific data.
1 Introduction
Mechanical circulatory support, especially ventricular assist devices (VAD), playan important role nowadays in the treatment of terminal heart failure. Initiallyproposed for patients who are on the transplantation waiting list (bridge to trans-
plantation ) [1] in the context of chronic lack of donors and raising number of patients with terminal heart failure [2] and also for patients who need a tem-porary support (bridge to recovery ) [3], the indication was extended to patientswho are not eligible for transplantation (destination therapy ) [4].
While the devices themselves have been widely studied, little is known aboutthe interaction of the machines with the cardiovascular system, especially aboutthe geometric configuration (size, type, location) of the anastomosis betweenoutflow cannula of the device and the aorta. It has already been shown thatit plays an important role in the generation of abnormal haemodynamic pat-tern, both in vivo [5], in vitro [6], and in silico [7], [8], [9], or [10]. To furtherimprove the knowledge about the influence of cannula configuration in the aor-
tic haemodynamic one should consider patient-specific models of the aorta withthe cannula. However, nowadays, in the VAD context there are no studies of patient-specific numerical simulations. In fact, in all the previously cited stud-ies computational simulations are performed on a representative geometry of the human aortic arch, generated either from medical images (e.g. computedthomograpy (CT)) of healthy people [9], [8], [7] or from clinical measurements[10], on which the cannula is artificially added. These assumptions can be madein the case of testing different configurations for generic results, but not in thecontext of patient-specific numerical simulations, that are designed to model dif-ferent kind of clinical situations, and also to validate the numerical results withclinical data [11]. Moreover, exception made for [8], the arterial wall is always
considered rigid instead of deforming under the action of blood pressure pulse.The lack of patient-specific simulations is mainly explained by the fact that
the presence of the device induces metallic artifacts and noise in the acquiredimages (usually CT-scan [12], [13]) so that conventional segmentation techniquesfail, generating aberrant geometries.
Besides, the whole process from medical images acquisition to numerical sim-ulations is characterized by the following steps: (1) segmentation, (2) generationof suitable surfacic and volumic meshes, and (3) perform meaningful and rele-vant CFD simulations, remains a challenge and is time consuming, even morewith images of poor quality as in VAD case. Whereas already existing frame-
2

7/17/2019 A Patient-Specific Framework for the Analysis of the Haemodynamics in Patients With Ventricular Assist Device
http://slidepdf.com/reader/full/a-patient-specific-framework-for-the-analysis-of-the-haemodynamics-in-patients 5/24
work are available [14], [15] they do not provide automatic tools to deal with
noisy images, and are not suitable to generate meshes that are appropriate forsimulate fluid-structure interaction (FSI) in case like the present one, in whichthe different thickness and physical properties of the arterial and the cannulawall require special treatment.
The aim of this work is to develop a general framework that provides semi-automatic and robust tools to perform all the steps required for numerical simu-lations, starting from CT images of patients having VAD to generation of suitablemeshes for FSI simulations. We also present the numerical methods and toolswe use to perform such simulations and a few preliminary results of the entireprocess.
2 Methods
Radiological assessment of patient under mechanical circulatory support is usu-ally performed by computed tomography [12], [13]. The same images can beused to perform patient-specific numerical simulations and deeply explore thefluid dynamic in these patients. In this study we consider two patients, Patient1 who received a continuous flow left ventricular assist device (LVAD), and Pa-tient 2 holding a pulsatile biventricular assistance. A CT scanner of each patientwas acquired with the LightSpeed VCT model (from GE Medical Systems) forpostoperative control and pulmonary embolism suspicion respectively. The ac-quisition protocol generates a stack of axial images with a slice thickness of 1.25mm.
To perform patient-specific simulations the first necessary step is to obtaina good reconstruction of the patient aorta and cannula geometry. In the nextsession we present a semi-automatic procedure to reach this goal and correctlysegment VAD patient CT images. After segmentation, a mesh generation step isrequired; this is very important because mesh quality could influence numericalsimulation results. Moreover, for FSI simulations, conforming meshes for fluidand structure are needed with the appropriate boundary flags for the assignmentof the material physical properties and the correct boundary conditions. In asecond section we present our automatic tool to generate these type of highquality meshes with a maximum freedom in flags generation. As last we alsopresent our framework to perform such FSI simulations.
The segmentation and mesh generation procedure is mainly implementedbased on the libraries The Insight Segmentation and Registration Toolkit (itk)[16] [17], The Visualization Toolkit (VTK) [18] and The Vascular ModelingToolkit (vmtk) [19]. The numerical simulations are performed using the libraryLifeV [20]. All the used libraries are open-source libraries implemented in C++,and cross-platform (Windows, except for LifeV, Unix, and MacOS X).
3

7/17/2019 A Patient-Specific Framework for the Analysis of the Haemodynamics in Patients With Ventricular Assist Device
http://slidepdf.com/reader/full/a-patient-specific-framework-for-the-analysis-of-the-haemodynamics-in-patients 6/24
Figure 1: A slice of a CT image of Patient 1.
2.1 Segmentation
Starting from the volume of voxels containing tissue attenuation values expressedin Hounsfield Units (HU), the goal of our segmentation method is the extractionof the surface individuating the interface between blood and wall of the aortaand the VAD outflow cannula with a particular attention to the anastomosisarea; on CT-scan data the arterial and cannula wall are usually not visible.Unfortunately, segmentation of these images is not trivial because of the metallicnoise due to the device and the non-aortic contrast phase. An example of thistype of images can be seen in figure 1 in which the noise effect due to the metallicmachine and the bad and non-uniform contrast of the aorta are evident. In
these situations image segmentation with standard and automatic tools is notfeasible, therefore we propose an original procedure to overcome this problemand correctly segment this kind of images.
The whole procedure can be divided in three steps: pre-processing, segmen-tation step, and refinement.
2.1.1 Pre-processing
The first step aims at enhancing the image intensity contrast and at filteringthe image noise. First of all we perform a combination of histogram adjustmentand histogram equalization. The adjustment is performed trimming the imageintensity values between -1000 HU and +1000 HU and performing a linear ad-
justment of the dynamic range for the remaining intensities. In this way wecompress the metallic range in one single value (1000 HU) and we stretch thedynamic range of the tissues. Secondly the contrast-limited adaptive histogramequalization method [21] is applied. This method applies the classical conceptof histogram equalization to small local areas of the image and interpolates thelocal result to produce a homogeneous result. The method allows the regionsof the image to be enhanced differentially, i.e., we are able to enhance the con-trast in the aorta excluding in the equalization the metal region; the result isan acceptable compromise between contrast enhancement and noise enhance-
4

7/17/2019 A Patient-Specific Framework for the Analysis of the Haemodynamics in Patients With Ventricular Assist Device
http://slidepdf.com/reader/full/a-patient-specific-framework-for-the-analysis-of-the-haemodynamics-in-patients 7/24
Figure 2: A screenshot of one slice of the result of watershed algorithm. Dif-ferent grey levels represent different regions individuated by the algorithm. Ca:cannula, AscAo: ascending aorta, DescAo: descending aorta.
ment. The method is applied slice-by-slice with a window size of 64 × 64 pixelsand a clipping level of 57 pixel per bin. In the following we call the histogramadjustment plus histogram equalization the histogram enhancement filter.
We then apply a gradient anisotropic diffusion filter, which allows to removethe noise from homogeneous regions while keeping clear and sharp edges [22].In fact this filter performs a smoothing which is less pronounced at edges mea-sured as high gradient magnitude. The parameters controlling this filter are the
conductance and the iteration [17]. The lower the conductance parameter, themore strongly the diffusion equation preserves image features; the higher theiteration value, the more blurred the image will become. Typical values we usefor conductance and iteration values are 1 and 5 respectively.
2.1.2 Segmentation
The core of the segmentation procedure is the segmentation itself. To segmentthe pre-processed image we use the watershed segmentation [23], [24], as imple-mented in itk [17] [25].
The watershed segmentation treats the image to segment as a height function,
i.e., the pixel gray level corresponds to the altitude of a point on a surface. Firsta gradient filter is applied so that feature edges can be seen as ridges and uniformintensity areas as basins. The idea is to see the result of the segmentation asthis virtual topography flooded by water: increasing the level of water the size of the basins grow because they merge with adjacent basins. The remaining ridgesafter the flooding are the image boundaries. The parameters controlling thisprocedure are the threshold and the level [17]. Both are set as a fraction of themaximum depth of the input image. The threshold indicates the backgroundnoise to remove before segmentation. We fixed this parameter for this study ata low value of 0.005. The level parameter allows to minimize over-segmentation
5

7/17/2019 A Patient-Specific Framework for the Analysis of the Haemodynamics in Patients With Ventricular Assist Device
http://slidepdf.com/reader/full/a-patient-specific-framework-for-the-analysis-of-the-haemodynamics-in-patients 8/24
Figure 3: One slice of the segmented image after the morphological enhancementfilter. In gray the final segmentation and in white the regions corrected by thefilter.
controlling the level of flooding, i.e., by establishing a minimum watershed depth.Adjacent regions are merged if their combined depth falls below the minimum.Higher values of level parameter result in lower segmentations. We choose thisparameter in the range 0.15 – 0.25. Last, as watershed algorithm produces asegmentation of the entire image (see figure 2) we have implemented a graphicinterface which allows to select at the end of the process the regions (basin)which represent the region of interest (i.e., the aortic arch and cannula). The
image produced by this segmentation step is a binary image with value 1 insidethe region of interest and zero outside.
2.1.3 Refinement
This last step relies on morphological operators [26] [27]: in particular we per-form on the segmentation output image a “morphological enhancement” opera-tion which consists in the sum of the image with the result of a “top hat” op-eration and the negative of the result of a “bottom hat” operation, where both“top hat” and “bottom hat” operations are performed with the same spherestructuring element with a radius chosen by the user. In our study we choosethe radius in the range 1 – 3. This procedure eliminates small holes and smallfeatures in the generated segmentation as can be seen in figure 3, where in grayis represented the final segmentation and in white the regions corrected by themorphological enhancement filter. The output image is then rescaled between 0and 255 and then processed with a last smoothing which penalizes high curva-tures and which transforms the resulting image in a level set function, i.e., animage whose zero level is the searched surface.
6

7/17/2019 A Patient-Specific Framework for the Analysis of the Haemodynamics in Patients With Ventricular Assist Device
http://slidepdf.com/reader/full/a-patient-specific-framework-for-the-analysis-of-the-haemodynamics-in-patients 9/24
2.2 Mesh generation
In this section we describe the tools and methods to generate suitable grids forour finite element library LifeV [20]. Although the output of our procedure isa LifeV mesh, there is an easy way to export the mesh in different commonlyused formats. This step is critical since the mesh can change the accuracy of thenumerical results and the efficiency of numerical methods, e.g. the computationaltime or convergence. It is worthwhile to precise that in our case, the FSI modeluses two conforming meshes: one for the fluid domain, i.e., the lumen, and onefor the solid domain, i.e., the arterial wall and the cannula; the two meshesare conforming at the interface. As explained in Section 2.1, the segmentationprocedure only allows to recover the interface between the blood and the arterialwall, the arterial wall itself being usually not seen on CT-scan data. Fluid andsolid domain meshes must be created starting from the recovered interface. Thefluid domain mesh is easy to generate since it is the space inside the interfacesurface. The arterial wall instead needs to be synthetically reconstructed; lateron we describe this procedure. Our mesh generation procedure consists in threesteps: creation of a surface mesh, smoothing of the initial surface mesh, andcreation of the final fluid and solid meshes.
2.2.1 Creation of a surface mesh
As described in section 2.1, the last data obtained by the segmentation procedureis a set of images of which the zero level is the surface of interest. To recover
the polygonal surface mesh (i.e., a triangulation of the zero level image) we usethe marching cubes algorithm [28] as implemented in vmtk; this step does notrequire user interaction and is therefore completely automatic.
2.2.2 Smoothing the surfaces
A known drawback of the marching cubes method is the resulting staircase effecton the surface related to the discrete nature of the data [29]. To remove thissurface aliasing we first apply Gaussian filters using Freeyams [30] [31], [32]. Theresidual artifacts on the surface are then removed using the Taubin algorithm[33] implemented in VTK. These two steps are semi-automatic since they only
need few parameters: the number of iterations for the Taubin algorithm andthe Gaussian filters and the pass band for the Taubin algorithm. For our testswe used a number of iterations equal to 1000 and 40 for Gaussian and Taubinfilters, respectively, and a pass band of 0.001 for the Taubin filter.
2.2.3 Final meshes
For the generation of the final tetrahedral meshes we implemented a semi-automatic Python code based on the VTK and vmtk libraries. The input isthe surface mesh and the output is the fluid and the solid tetrahedral meshes.
7

7/17/2019 A Patient-Specific Framework for the Analysis of the Haemodynamics in Patients With Ventricular Assist Device
http://slidepdf.com/reader/full/a-patient-specific-framework-for-the-analysis-of-the-haemodynamics-in-patients 10/24
Figure 4: Centerlines.
During execution only relevant parameters are interactively asked to the user,making it easy to use and understand.
The principle is to further improve the quality of the surface mesh and thenuse it as a basis for the fluid mesh, which is generated filling the volume withtetrahedra, and for the solid mesh, which is generated extruding the surface meshalong surface normals. As preliminary remark, it is important to underline thatthis framework mainly relies on the centerlines computation [34] available invmtk, which in turn gives the possibility to calculate the distance between cen-
terlines and surface mesh, which corresponds to local vessel size. Mesh elementsarea (triangles or tetrahedra) is eventually computed in function of the localdiameter, avoiding over refinement of large structure (e.g. the aorta) and pro-viding a mesh fine enough for small vessels (e.g. coronary artery). Fig. 4 showsthe result of centerlines computation on the surface mesh obtained after theapplication of the Taubin filter. The description of the different steps follows.
(a) Surface remeshing: First centerlines are computed on the initial surfacemesh obtained in section 2.2.2. Then it is remeshed in function of a givenconstant factor making the triangle area proportional to the local size of thevessel [34].
(b) Fluid meshing: The newly optimized surface mesh is filled with tetrahedra.The volume size of the elements is set proportionally to the length of edgesof the surface triangles. The user also has the possibility to add a boundarylayer, specifying various parameters as the number of sublayers and thethickness of each sublayer. Finally the mesh can be scaled to the convenientunits, in our case centimeters, and the flags are automatically added to theboundaries.
(c) Solid meshing: The solid mesh is created by extruding the surface meshtoward the normal direction, the thickness given by a proportionality factor
8

7/17/2019 A Patient-Specific Framework for the Analysis of the Haemodynamics in Patients With Ventricular Assist Device
http://slidepdf.com/reader/full/a-patient-specific-framework-for-the-analysis-of-the-haemodynamics-in-patients 11/24
of the local vessel size or by a constant factor. The user can interactively de-
fine multiple regions on the surface mesh and apply the previously describedmethod. Therefore for each of these areas it is possible (i) to give a specificthickness to the solid mesh, constant or vessel radius dependent, and (ii) toautomatically give different surface flags to the external surface (triangles)of the solid mesh and also different volumetric flags to the tetrahedra of thisarea.
Points (a) and (b) are available commands in vmtk, whereas point (c) was specif-ically developed.
2.3 Numerical simulations
We are interested in simulating blood flow in vascular districts. The arteriesare compliant vessels that react to mechanical and chemical signals. Theseaspects can be partially taken care by defining appropriate constitutive laws.Which one is the most appropriate, is still an open question. In most of thecases, we can not avoid to consider the mechanical interaction and we have toconsider the fully coupled blood-flow / vessel wall system. Our model thereforeincludes two media, the fluid and the structure, and interaction at the mechanicallevel, which is governed by coupling conditions expressing the continuity of thevelocities and the equilibrium of the structure. The model expresses Fluid-Structure Interaction (FSI), whose solution needs specific coupling algorithms.
We start by identifying a fluid and a structure computational domains, Ωf and Ωs respectively, thanks to the segmentation and mesh generation previouslydescribed. We define a fluid-structure interface ΓFSI as ∂ Ωf ∩ ∂ Ωs, which is theregion where the mechanical coupling takes place. The equations governing thestructure are described in a Lagrangian frame of reference, meaning that we onlyneed a fixed computational domain. The blood flow is described by the Navier–Stokes equations in a moving domain and we are interested in a specific region,the segmented piece of artery. In this situation it is appropriate to describethe equations in an Arbitrary Lagrangian-Eulerian (ALE) frame of reference.This means that the fluid computational domain Ωf (t) is time dependent andits movement is described by an ALE mapping
At : Ωf → Ωf (t)
x → At(x) = x + df (x),
where df is the displacement of the fluid domain. In particular Ωf (t) = At(Ωf , t).This choice generates an additional coupling condition, called geometry adher-ence, that garantees that the fluid and structure domains adhere to each other.In other words, df = Ext(ds|ΓFSI
), where ds is the solid displacement and theextension Ext(·) operator, e.g. an harmonic lifting (or extension), from ΓFSI toΩf (see [35]).
9
7/17/2019 A Patient-Specific Framework for the Analysis of the Haemodynamics in Patients With Ventricular Assist Device
http://slidepdf.com/reader/full/a-patient-specific-framework-for-the-analysis-of-the-haemodynamics-in-patients 12/24
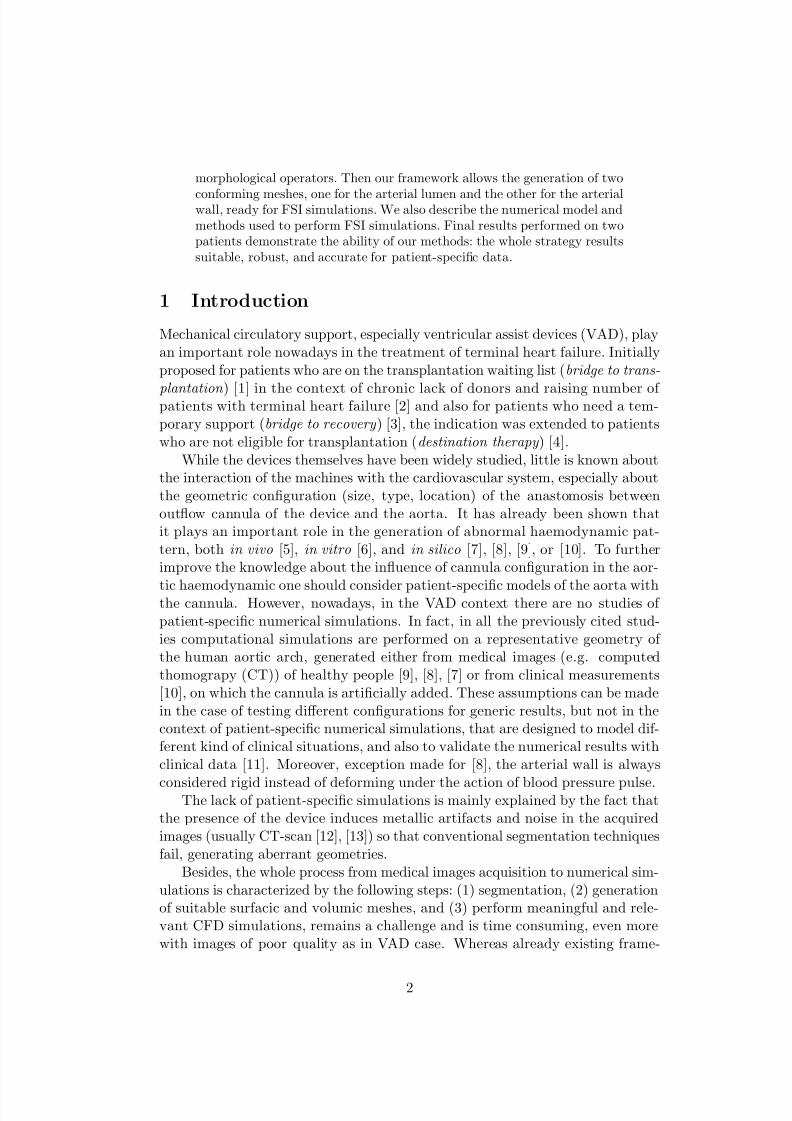
With the definition of a particular structural constitutive law through its
first Piola-Kirchoff stress tensor Π = Π(ds) — here we use linear elasticity —the structure equation with uknown ds reads
ρs∂ ttds − ∇ · Π = 0 in Ωs,
where ∂ tt is the second partial derivative with respect to time. Thanks to theALE mapping and the definition of the fluid domain velocity w = w(x, t) = ∂ tdf
we can formulate the Navier–Stokes equations in the ALE form as ρf ∂ tu + ρf (u − w) · ∇ u − ∇ · σf = 0 in Ωf (t)
∇ · u = 0 in Ωf (t).
Here u = u(x, t) is the fluid velocity, p = p(x, t) the pressure, ∂ t the partialderivative with respect to the time, ρf and ρs the fluid and solid densities,σf = σf (u, p) = − pI +µǫ(u) the fluid Cauchy stress tensor, µ the fluid dynamicviscosity, and ǫ(u) = (∇u + ∇uT )/2 the strain rate tensor. Ff = ∇At is thefluid domain gradient of deformation, J f = det Ff the Jacobian, nf and ns theoutward unit normals to the fluid and solid domains.
The coupling conditions at the fluid-structure interface, the continuity of the velocity, the equilibrium of the stresses, and the geometric adherence, aresummarized as follow:
u At = ∂ tds on ΓFSI (t),
Πns = −J f σf At(Ff )−T nf At on ΓFSI ,
df = ds on ΓFSI .
Additional conditions on the external boundary are necessary to close thesystem. The tissue surrounding the artery can be mimicked by Robin boundaryconditions (e.g. [36]). It is more difficult to assign the correct flow conditionsupstream and downstream of the fluid domain. If the data on the flowrates isavailable, e.g. [37], then it is possible to assign these values by ad-hoc Lagrangemultipliers [38]. Otherwise it is necessary to have a rough description of thewhole cardiovascular system, e.g., by a network of one-dimensional models [39,
40, 41, 42]. We use this multiscale description in our simulations.The equations are first written in a weak form, discretized in time and finally
in space, cf. [43]. To discretize the problem in time we use a geometry-convectiveexplicit (GCE) time advancing scheme. This scheme, besides being stable, hasthe main advantage to reduce the spatial discrete problem to a linear problem.The other terms are treated using a first order backward Euler scheme. Weconsider all the state variables of the coupled problem — structure displacement,fluid velocity, pressure, and domain displacement — as a single unknown. Weuse P1 finite elements for each state variable and we stabilize the saddle-pointproblem by interior penalty [44]. The linear system is solved in parallel using
10
7/17/2019 A Patient-Specific Framework for the Analysis of the Haemodynamics in Patients With Ventricular Assist Device
http://slidepdf.com/reader/full/a-patient-specific-framework-for-the-analysis-of-the-haemodynamics-in-patients 13/24
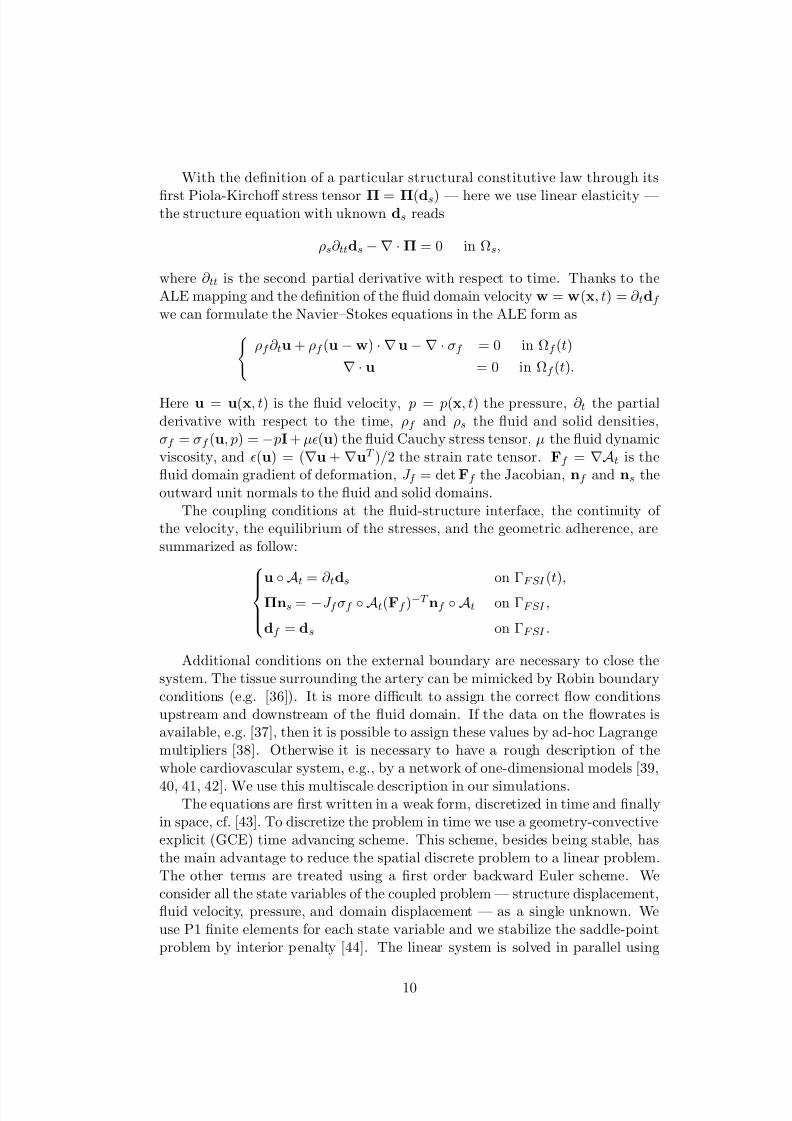
Figure 5: Left: A slice of CT-scan of Patient 1. AscAo: ascending aorta, DescAo:descending aorta, Ca: cannula. Right: after the pre-processing step i.e. gradientanisotropic diffusion filter added to the histogram enhancement filter.
GMRES iterations and overlapping algebraic Schwarz preconditioners based onan inexact block factorization of the system (see [36]). The software used in thesimulations is based on LifeV [20].
3 Results and Discussion
In this section we present the results of our investigations for the two set of images of the patients mentioned before. For reason of convenience we displaythe pictures for each step for Patient 1 whereas we show only a few images forPatient 2.
3.1 Segmentation
A significant slice of the CT of Patient 1 is shown in fig. 5 (left): in this slice theaortic arch with the anastomosis and the VAD outflow cannula are evident.
The image is characterized by the VAD device noise and the aorta and can-nula are not well contrasted.
Fig. 5 (right) represents the same slice after the pre-processing step i.e. afterthe histogram enhancement filter plus the gradient anisotropic diffusion filter.At the end of the pre-processing step the contrast of the aorta and cannula isclearly improved and the noise due to the device decreased.
To numerically verify this improvement we calculated the contrast-to-noiseratio (CNR) on the original image (CT), on the image treated with the his-togram enhancement filter (CT-HEF) and on the result of the previous stepplus the gradient anisotropic diffusion filter (CT-GADF). A representative re-gion of interest (ROI) was taken including a portion of both the aortic arch andthe cannula; the same region was considered in the three compared images (CT,CT-HEF and CT-GADF) for each patient. A second region representative of thebackground (bkg) was chosen near the aorta to evaluate the contrast between
11

7/17/2019 A Patient-Specific Framework for the Analysis of the Haemodynamics in Patients With Ventricular Assist Device
http://slidepdf.com/reader/full/a-patient-specific-framework-for-the-analysis-of-the-haemodynamics-in-patients 14/24
Figure 6: Polygonal surface mesh: result of the marching cube method (left),same mesh after the smoothing by Gaussian and Taubin filters (right). Posteriorviews.
aorta and adjacent structures. CNR was then calculated as:
CNR =
contrast
noise =
(µROI − µbkg) (σ2ROI + σ
2
bkg)/2
where µROI is the mean of the image intensity values in the ROI and µbkg is themean of the intensity values in the bkg; σROI and σbkg are the standard devi-ations of image intensities in the ROI and bkg respectively. CNR is a measureused to determine image quality and is higher for better quality images.
Table 1: Contrast-to-noise ratio (CNR) of the original image (CT-original), afterthe application of the histogram enhancement filter (CT-HEF) and after theapplication of the gradient anisotropic diffusion filter (CT-GADF), for patients
1 and 2. CT-original CT-HEF CT-GADFPatient 1 3.4503 4.5574 12.3662Patient 2 7.7783 8.7904 16.2073
In table 1 are reported the CNR values calculated for patients 1 and 2:in both cases the CNR value increase with the application of the histogramenhancement filter and increase even more with the addition of the second filter.
For both patients after the pre-processing step the watershed algorithm suc-ceeded in the segmentation of the aortic arch and cannula. The refinement stephas always proved necessary to remove the noise captured by the watershedalgorithm i.e. holes and small isolated features.
3.2 Mesh generation
In this section we show the results obtained using the framework presented insection 2.2. Fig. 6 (left) shows the result of the marching cubes algorithm appliedto data obtained by segmentation. One can clearly see the staircase effect, beingremoved by applying the Gaussian filters and Taubin algorithm (fig. 6 (right)).
In particular in Fig. 7 we show a detail of the three meshes (marching cubes,Gaussian and Taubin): the Gaussian filters implemented in Freeyams well suc-ceed in the correction of the staircase effect but introduce some artifacts (evident
12

7/17/2019 A Patient-Specific Framework for the Analysis of the Haemodynamics in Patients With Ventricular Assist Device
http://slidepdf.com/reader/full/a-patient-specific-framework-for-the-analysis-of-the-haemodynamics-in-patients 15/24
Figure 7: Polygonal surface mesh: result of the marching cube method (left),Gaussian filters (center), and Taubin algorithm (right). Posterior views.
Figure 8: Final surface mesh of Patient 2. Anterior view.
in fig. 7, center). All these artifacts are completely removed by the Taubin filter.The generated surface is sufficiently smooth without being shrunk and the finalmeshes can be generated. In fig. 8 we report the final mesh also for Patient 2.
Thanks to our implemented framework we create the mesh of the cannula
with a constant thickness (given by manufacturer), and generate the arterial wallwith a thickness proportional to the local vessel size [45]. Also we choose twodifferent flag values for both the surface and volume of these two regions, givingthe opportunity to provide different sets of boundary conditions and to applydifferent Young moduli, respectively. Moreover we separately define multipleareas for all the different vascular branches (e.g. ascending aorta, carotid artery,subclavian artery) in order to apply different set of Robin boundary conditionson the external surface of the arterial wall. This allows to model in a moreaccurate way the physical properties of the arterial tree [36], [46].
Fig. 9 shows the final surface mesh for Patient 1 with the selection of aspecific area (the outflow cannula of VAD) and the multiple regions to which
different physical properties can be applied thanks to the flags attribution.Finally fig. 10 displays the fluid mesh. One can remark the refinement of
tetrahedra in function of the diameter of the local radius. Fig. 11 depicts thesolid mesh. The thickness of the structure is proportional to the local radius forthe aorta and its branches, and constant for the outflow cannula of the device.
3.3 Simulations
The methodological infrastructure described before allows to consider many dif-ferent specific situations. The mesh of the cannula has a special flag, allowing
13

7/17/2019 A Patient-Specific Framework for the Analysis of the Haemodynamics in Patients With Ventricular Assist Device
http://slidepdf.com/reader/full/a-patient-specific-framework-for-the-analysis-of-the-haemodynamics-in-patients 16/24
Figure 9: Left: Selection of specific areas. Right: Result of the surface flagsattribution. Postero-lateral and posterior views.
Figure 10: Fluid mesh, Patient 1. Anterior view.
Figure 11: Solid mesh, Patient 1. Anterior view.
for a different Young modulus in the simulation settings. The model has beencoupled to a geometry multiscale network that takes into account mean flowquantities of the whole arterial tree [46]. The total flow rate at the aortic root isset equal to zero; note on Fig. 12 the velocity is not equal to zero there. The flowrate at the cannula is imposed to be equal to the usual flow-rate of a healthyleft ventricle. Future work includes the development of more accurate inflowconditions, e.g. including both pulsatile and continuous flow rates or the casewhere the left ventricle is also contributing to the flow.
We present preliminary results obtained with the case of Patient 1 showingthe possible applications of the presented workflow. The fluid and structuremeshes have 194’095 and 197’412 tetrahedra respectively. The total degrees of freedom is 291’527, i.e., 4 times the number of vertices in the fluid mesh, 3 timesthose in the structure mesh, and 3 times those on the fluid-structure interface.The time step chosen is 0.001 second. The simulation of one heart beat took22 hours using 64 cores on an IBM Intel Nehalem cluster composed by bladescontaining two quad-core (Intel Nehalem 2.66 GHz) nodes each.
14

7/17/2019 A Patient-Specific Framework for the Analysis of the Haemodynamics in Patients With Ventricular Assist Device
http://slidepdf.com/reader/full/a-patient-specific-framework-for-the-analysis-of-the-haemodynamics-in-patients 17/24
Figure 12: Vorticity patterns [s−1] in the ascending aorta during systole. Ante-
rior and inferior views.
Figure 13: Vorticity patterns [s−1] in the ascending aorta during systole. Ante-rior and inferior views.
The fluid density is set to 1.04 g/cm3, the fluid viscosity 0.035 g/cm/s, thePoisson coefficient 0.48, the Young modulus of the cannula 1.0784 · 107 g/cm/s2,the one of the arterial wall 3.0784 · 106 g/cm/s2. The flow near the anastomosisshows a complex behavior, we see that during the systolic phase there are vor-ticity patterns forming in the ascending aorta, cf. Fig. 12, while they disappearduring diastole, cf. Fig. 13. The displacement of the vessel wall is not uniformlydistributed (Fig. 14). Fig. 15 show the wall shear stress (WSS) on the aortaduring systole. WSS is very important since its distribution on the arterial wallcan have short term negative effects (e.g. thrombus formation) while in thelong-term has an impact on arterial remodeling and atherosclerosis. For thisspecific case, WSS is particularly interesting near the anastomosis and in theaortic wall, in front of the outflow tract of the VAD: WSS is high and couldlead to short and long term dysfunctions. The high WSS on the right commoncarotid is not correct due to the inaccurate imposition of the Robin boundaryconditions accounting for the surrounding tissue.
15

7/17/2019 A Patient-Specific Framework for the Analysis of the Haemodynamics in Patients With Ventricular Assist Device
http://slidepdf.com/reader/full/a-patient-specific-framework-for-the-analysis-of-the-haemodynamics-in-patients 18/24
Figure 14: Displacement [cm] of the vessel wall during systole. Anterior view.
Figure 15: WSS patterns [dyn/cm2] during systole. Anterior and posteriorviews.
4 Conclusion
In this work we have presented a framework for the segmentation of medicalimages of poor quality, the generation of high quality meshes and for the patient-
specific analysis of the collected data via FSI numerical simulations. We havedeveloped these methods specifically for the case of the anastomosis of outflowcannula of VAD to the aorta, but the method could be applied to the case of rightventricle assistance, or in a more general context. In this precise field medicalimages are unfortunately most of the time of poor quality due to the nature of the devices and the imaging modality, i.e. computed tomography. In spite of this difficulty, we believe that making patient-specific analysis in this contextis nowadays important for the determination of individualised treatments. Todate only few works studied numerically the region of anastomosis, even less with
16
7/17/2019 A Patient-Specific Framework for the Analysis of the Haemodynamics in Patients With Ventricular Assist Device
http://slidepdf.com/reader/full/a-patient-specific-framework-for-the-analysis-of-the-haemodynamics-in-patients 19/24
patient-specific data. However the raising number of patients with mechanical
circulatory support emphasizes the need of such studies.Our new proposed strategy overcomes the low quality problem succeeding
in geometry extraction and high quality mesh generation; moreover our FSIframework seems able to produce reliable results on the fluid-dynamics of thesepatients. The whole strategy marks therefore a first step towards a suitable,robust and accurate treatment of patient-specific data. Moreover the code wepropose is semi-automatic, reduces the time needed to perform the entire pro-cedure, and also minimizes the parameters asked to the user. It makes thisframework usable by a larger public and also reduces the errors due to usermanipulation.
We tested our methods successfully on CT-scan data of two patients under
mechanical circulatory support.As future work we plan to apply our framework to a large number of cases
in order to provide a deep insight of flow dynamics in the region of anastomosisof the outflow cannula of ventricular assist devices and the aorta. We are alsoworking on the boundary conditions we provide to our numerical model, moreprecisely by developing a lumped model of the entire cardiovascular system fea-turing the presence of an assist device. Finally an in vitro validation of thenumerical simulations is ongoing in order to compare the numerical results withthe experimental ones.
AcknowledgementsThe authors acknowledge Professor L.K. von Segesser for his valuable help, es-pecially in the clinical field. They also thank the entire LifeV community.
References
[1] L. W. Miller et al., “Use of a continuous-flow device in patients awaitingheart transplantation,” The New England journal of medicine , vol. 357,no. 9, pp. 885–896, Aug. 2007.
[2] V. L. Roger et al., “Heart disease and stroke statistics – 2011 update: Areport from the american heart assiciation,” Circulation , vol. 123, no. 4, pp.e18–e209, 2011.
[3] E. J. Birks, P. D. Tansley, J. Hardy, R. S. George, C. T. Bowles, M. Burke,N. R. Banner, A. Khaghani, and M. H. Yacoub, “Left ventricular assistdevice and drug therapy for the reversal of heart failure.” The New England
journal of medicine , vol. 355, no. 18, pp. 1873–1884, Nov. 2006.
17

7/17/2019 A Patient-Specific Framework for the Analysis of the Haemodynamics in Patients With Ventricular Assist Device
http://slidepdf.com/reader/full/a-patient-specific-framework-for-the-analysis-of-the-haemodynamics-in-patients 20/24
[4] E. A. Rose et al., “Long-term mechanical left ventricular assistance for end-
stage heart failure,” The New England journal of medicine , vol. 345, no. 20,pp. 1435–1443, Nov. 2001.
[5] K. N. Litwak, S. C. Koenig, H. Tsukui, S. I. Kihara, Z. Wu, and G. M.Pantalos, “Effects of Left Ventricular Assist Device Support and OutflowGraft Location Upon Aortic Blood Flow,” ASAIO journal , vol. 50, no. 5,pp. 432–437, Sep. 2004.
[6] K. N. Litwak, S. C. Koenig, R. C. Cheng, G. A. Giridharan, K. J. Gillars,and G. M. Pantalos, “Ascending aorta outflow graft location and pulsatileventricular assist provide optimal hemodynamic support in an adult mockcirculation.” Artificial organs , vol. 29, no. 8, pp. 629–635, Aug. 2005.
[7] T. A. S. Kaufmann, M. Hormes, M. Laumen, D. L. Timms, T. Linde,T. Schmitz-Rode, A. Moritz, O. Dzemali, and U. Steinseifer, “The impactof aortic/subclavian outflow cannulation for cardiopulmonary bypass andcardiac support: a computational fluid dynamics study.” Artificial organs ,vol. 33, no. 9, pp. 727–732, Sep. 2009.
[8] Y. Bazilevs, J. R. Gohean, T. J. R. Hughes, R. D. Moser, and Y. Zhang,“Patient-specific isogeometric fluid–structure interaction analysis of tho-racic aortic blood flow due to implantation of the Jarvik 2000 left ventricularassist device,” Computer Methods in Applied Mechanics and Engineering ,vol. 198, no. 45-46, pp. 3534–3550, Sep. 2009.
[9] A. G. Brown, Y. Shi, A. Arndt, J. Muller, P. Lawford, and D. R. Hose,“Importance of realistic LVAD profiles for assisted aortic simulations: eval-uation of optimal outflow anastomosis locations,” Computer Methods in
Biomechanics and Biomedical Engineering , Mar. 2011, first published on-line.
[10] A. F. Osorio, R. Osorio, A. Ceballos, R. Tran, W. Clark, E. A. Divo, I. R.Argueta-Morales, A. J. Kassab, and W. M. DeCampli, “Computational fluiddynamics analysis of surgical adjustment of left ventricular assist deviceimplantation to minimise stroke risk,” Computer Methods in Biomechanics
and Biomedical Engineering , pp. 1–17, Dec. 2011.
[11] J. Oden, T. Belytschko, I. Babuska, and T. Hughes, “Research directions incomputational mechanics,” Computer Methods in Applied Mechanics and
Engineering , vol. 192, no. 7-8, pp. 913–922, 2003.
[12] S. V. Raman, A. Sahu, A. Z. Merchant, L. B. Louis, M. S. Firstenberg,and B. Sun, “Noninvasive assessment of left ventricular assist devices withcardiovascular computed tomography and impact on management,” The
Journal of heart and lung transplantation , vol. 29, no. 1, pp. 79–85, Jan.2010.
18

7/17/2019 A Patient-Specific Framework for the Analysis of the Haemodynamics in Patients With Ventricular Assist Device
http://slidepdf.com/reader/full/a-patient-specific-framework-for-the-analysis-of-the-haemodynamics-in-patients 21/24
[13] D. Acharya, S. Singh, J. A. Tallaj, W. L. Holman, J. F. George, J. K.
Kirklin, and S. V. Pamboukian, “Use of Gated Cardiac Computed Tomog-raphy Angiography in the Assessment of Left Ventricular Assist DeviceDysfunction,” ASAIO journal , vol. 57, no. 1, pp. 32–37, Jan. 2011.
[14] J. Peir, S. J. Sherwin, and S. Giordana, “Automatic reconstruction of a patient-specific high-order surface representation and its application tomesh generation for cfd calculations.” Med Biol Eng Comput , vol. 46, no. 11,pp. 1069–83, 2008.
[15] R. Torii and M. Oshima, “An integrated geometric modelling framework forpatient-specific computational haemodynamic study on wide-ranged vascu-lar network,” Computer Methods in Biomechanics and Biomedical Engi-
neering , pp. 1–11, 2011.
[16] (2012) The insight segmentation and registration toolkit website. [Online].Available: http://www.itk.org
[17] L. Ibanez, W. Schroeder, L. Ng, and J. Cates, “The ITK software guide: theinsight segmentation and registration toolkit,” Kitware Inc , vol. 5, 2003.
[18] (2012) The visualization toolkit website. [Online]. Available:http://www.vtk.org
[19] (2012) The vascular modeling toolkit website. [Online]. Available:
http://www.vmtk.org[20] (2012) Lifev website. [Online]. Available: http://www.lifev.org
[21] K. Zuiderveld, “Contrast limited adaptive histogram equalization,” inGraphics gems IV . Academic Press Professional, Inc., 1994, pp. 474–485.
[22] P. Perona and J. Malik, “Scale-space and edge detection using anisotropicdiffusion,” Pattern Analysis and Machine Intelligence, IEEE Transactions
on , vol. 12, no. 7, pp. 629–639, 1990.
[23] L. Vincent and P. Soille, “Watersheds in digital spaces: An efficient al-gorithm based on immersion simulations,” IEEE Transactions on Pattern
Analysis and Machine Intelligence , vol. 13, pp. 583–598, 1991.
[24] S. Beucher and F. Meyer, The morphological approach to segmentation: the
watershed transformation . CRC Press, 1993, pp. 433–481.
[25] A. Mangan and R. Whitaker, “Partitioning 3d surface meshes using water-shed segmentation,” Visualization and Computer Graphics, IEEE Transac-
tions on , vol. 5, no. 4, pp. 308–321, 1999.
[26] H. Heijmans, “Morphological image operators,” Advances in Electronics
and Electron Physics Suppl., Boston: Academic Press , vol. 1, 1994.
19

7/17/2019 A Patient-Specific Framework for the Analysis of the Haemodynamics in Patients With Ventricular Assist Device
http://slidepdf.com/reader/full/a-patient-specific-framework-for-the-analysis-of-the-haemodynamics-in-patients 22/24
[27] T. Kong and A. Rosenfeld, Topological algorithms for digital image process-
ing . North Holland, 1996, vol. 19.
[28] W. E. Lorensen and H. E. Cline, “Marching cubes: A high resolution 3dsurface construction algorithm,” Computer Graphics , vol. 21, pp. 163–169,August 1987.
[29] H. Theisel, “Exact isosurfaces for marching cubes,” in Computer Graphics
Forum , vol. 21, no. 1. Wiley Online Library, 2002, pp. 19–32.
[30] P. J. Frey, “Generation and adaptation of computational surface meshesfrom discrete anatomical data,” International Journal for Numerical Meth-
ods in Engineering , vol. 60, no. 6, pp. 1049–1074, 2004.
[31] ——, “Yams a fully automatic adaptive isotropic surface remeshing proce-dure,” GAMMA - INRIA Rocquencourt, Tech. Rep. RT-0252, Nov. 2001.
[32] (2012) Freeyams. [Online]. Available:http://www.ann.jussieu.fr/ frey/software.html
[33] G. Taubin, “A signal processing approach to fair surface design,” in Proceed-
ings of the 22nd annual conference on Computer graphics and interactive
techniques , ser. SIGGRAPH ’95. New York, NY, USA: ACM, 1995, pp.351–358.
[34] L. Antiga, M. Piccinelli, L. Botti, B. Ene-Iordache, A. Remuzzi, andD. Steinman, “An image-based modeling framework for patient-specificcomputational hemodynamics,” Medical and Biological Engineering and
Computing , vol. 46, pp. 1097–1112, 2008.
[35] L. Formaggia, A. Quarteroni, and A. Veneziani, Eds., Cardiovascular Math-
ematics: Modeling and Simulation of the Circulatory System , ser. Modeling,Simulation and Applications. Milan: Springer, 2009, vol. 1.
[36] P. Crosetto, P. Reymond, S. Deparis, D. Kontaxakis, N. Stergiopulos, andA. Quarteroni, “Fluid-structure interaction simulation of aortic blood flow,”Computers & Fluids , vol. 43, no. 1, pp. 46 – 57, 2011.
[37] E. Marchandise, P. Crosetto, C. Geuzaine, J.-F. Remacle, and E. Sauvage,“Quality open source mesh generation for cardiovascular flow simulations,”in Modelling Physiological Flow , ser. Springer Series on Modeling, Simu-lation and Applications, D. Ambrosi, A. Quarteroni, and G. Rozza, Eds.Springer-Verlag, 2011.
[38] L. Formaggia, J.-F. Gerbeau, F. Nobile, and A. Quarteroni, “Numericaltreatment of defective boundary conditions for the navier-stokes equations,”SIAM J. Numer. Anal., vol. 40, no. 1, pp. 376–401, 2002.
20

7/17/2019 A Patient-Specific Framework for the Analysis of the Haemodynamics in Patients With Ventricular Assist Device
http://slidepdf.com/reader/full/a-patient-specific-framework-for-the-analysis-of-the-haemodynamics-in-patients 23/24
[39] ——, “On the coupling of 3D and 1D Navier–Stokes equations for flow
problems in compliant vessels,” vol. 191, no. 6–7, pp. 561–582, 2001.
[40] A. Veneziani and C. Vergara, “An approximate method for solving incom-pressible Navier–Stokes problems with flow rate conditions,” vol. 196, no.9–12, pp. 1685–1700, 2007.
[41] P. J. Blanco, R. A. Feijoo, and S. A. Urquiza, “A unified variational ap-proach for coupling 3D–1D models and its blood flow applications,” vol.196, no. 41–44, pp. 4391–4410, 2007.
[42] A. C. I. Malossi, P. J. Blanco, S. Deparis, and A. Quarteroni, “Algorithmsfor the partitioned solution of weakly coupled fluid models for cardiovascular
flows,” vol. 27, no. 12, pp. 2035–2057, 2011.
[43] P. Crosetto, S. Deparis, G. Fourestey, and A. Quarteroni, “Parallel algo-rithms for fluid-structure interaction problems in haemodynamics,” SIAM
Journal of Scientific Computing , vol. 33, no. 4, pp. 1598–1622, 2011.
[44] E. Burman, M. A. Fernandez, and P. Hansbo, “Continuous interior penaltyfinite element method for Oseen’s equations,” vol. 44, no. 3, pp. 1248–1274,2006.
[45] G. Langewouters, “Visco-elasticity of the human aorta in vitro in relation topressure and age,” Ph.D. dissertation, Free University, Amsterdam, 1982.
[46] A. C. I. Malossi, P. J. Blanco, P. Crosetto, S. Deparis, and A. Quar-teroni, “Implicit coupling of one-dimensional and three-dimensional blood-flow models with compliant vessels,” 2012, submitted.
21

7/17/2019 A Patient-Specific Framework for the Analysis of the Haemodynamics in Patients With Ventricular Assist Device
http://slidepdf.com/reader/full/a-patient-specific-framework-for-the-analysis-of-the-haemodynamics-in-patients 24/24
MOX Technical Reports, last issuesDipartimento di Matematica “F. Brioschi”,
Politecnico di Milano, Via Bonardi 9 - 20133 Milano (Italy)
11/2012 Bonnemain, J.; Faggiano, E.; Quarteroni A.; Deparis S.A Patient-Specific Framework for the Analysis of the Haemodynamics
in Patients with Ventricular Assist Device
10/2012 Lassila, T.; Manzoni, A.; Quarteroni, A.; Rozza, G.
Boundary control and shape optimization for the robust design of bypass
anastomoses under uncertainty
09/2012 Mauri, L.; Perotto, S.; Veneziani, A.
Adaptive geometrical multiscale modeling for hydrodynamic problems
08/2012 Sangalli, L.M.; Ramsay, J.O.; Ramsay, T.O.
Spatial Spline Regression Models
07/2012 Perotto, S; Zilio, A.
Hierarchical model reduction: three different approaches
06/2012 Micheletti, S.; Perotto, S.
Anisotropic recovery-based a posteriori error estimators for advection-
diffusion-reaction problems
05/2012 Ambrosi, D; Arioli, G; Koch, H.
A homoclinic solution for excitation waves on a contractile substratum
04/2012 Tumolo, G.; Bonaventura, L.; Restelli, M.
A semi-implicit, semi-Lagrangian, p-adaptive Discontinuous Galerkin
method for the shallow water equations
03/2012 Fumagalli, A.; Scotti, A.
A reduced model for flow and transport in fractured porous media with
non-matching grids
02/2012 Arioli, G.
Optimization of the forcing term for the solution of two point boundary
value problems