a novel mechanical analogy based battery model … · a novel mechanical analogy based battery...
TRANSCRIPT
arX
iv:1
601.
0455
4v1
[cs.
SY
] 14
Jan
201
61
A novel mechanical analogy based battery modelfor SoC estimation using a multi-cell EKF
Maurizio Paschero, Gian Luca Storti, Antonello Rizzi, Fabio Massimo Frattale Mascioliand Giorgio Rizzoni,IEEE Fellow
Abstract—The future evolution of technological systems dedi-cated to improve energy efficiency will strongly depend on effec-tive and reliable Energy Storage Systems, as key componentsforSmart Grids, microgrids and electric mobility. Besides possibleimprovements in chemical materials and cells design, the BatteryManagement System is the most important electronic device thatimproves the reliability of a battery pack. In fact, a precise Stateof Charge (SoC) estimation allows the energy flows controllerto exploit better the full capacity of each cell. In this paper,we propose an alternative definition for the SoC, explainingtherationales by a mechanical analogy. We introduce a novel cellmodel, conceived as a series of three electric dipoles, togetherwith a procedure for parameters estimation relying only onvoltage measures and a given current profile. The three dipolesrepresent the quasi-stationary, the dynamics and the istantaneouscomponents of voltage measures. An Extended Kalman Filer(EKF) is adopted as a nonlinear state estimator. Moreover,we propose a multi-cell EKF system based on a round-robinapproach to allow the same processing block to keep track ofmany cells at the same time. Performance tests with a prototypebattery pack composed by 18 A123 cells connected in series showencouraging results.
Index Terms—Nonlinear circuits, Mechanical Analogy, Batterymodeling, Parameter identification, State of Charge estimation,Extended Kalman Filter.
I. I NTRODUCTION
M ODERN engineering is already facing the fundamentalchallenge of improving energetic, environmental and
social sustainability in the way energy is produced, distributed,delivered and even consumed by the final users. Many systemsand technical components are on the verge of a disruptivetransformation, driven by a complex multidisciplinary co-evolution process, where many vital subsystems are closelyre-lated one another. This revolution must be faced and performedtaking into account a systemic point of view, able to drivetechnical advancements as sequences of systematic and coher-ent transformations. Urban areas planning and development,buildings design, electric generation and distribution systems,advanced telecommunication systems, intelligent multimodaltransportation systems, cloud computing systems and intel-ligent processing systems (just to cite some instances) willbenefit each other of advances and technical improvements.Sustainability is the key term to drive and define precise
M. Paschero, A. Rizzi and F.M. Frattale Mascioli are with theInformation,Electronic and Telecommunication Department (DIET) - POMOS Labs of theUniversity of Rome ‘Sapienza’, Italy.
G.L. Storti and G. Rizzoni are with the Center for AutomotiveRe-search (CAR), Ohio State University, Columbus, OH, 43211 USA e-mail:[email protected].
Manuscript received Dec 15, 2015; revised June XX, 2015.
definitions for any objective function acting as the fitness ofeach technological subsystem in this evolving scenario. Fromthis point of view, just to cite an example, the revolution intransportation systems due to the introduction of plug-in elec-tric vehicles (EVs) will contribute in driving the design ofnextgeneration of Smart Grids [1], [2], [3], since electric mobilitywill be a huge additional load for both energy generation anddistribution systems. At the same time, the massive introduc-tion of EVs will yield a true reduction ofCO2 emissionsonly if supported by a model of distributed energy generationfrom renewable sources. In turn, the stochastic nature of somepromising renewable sources (photovoltaics plants and windgenerators, for example) demands the presence of stationaryenergy storage systems (ESSs) to exploit fully the available en-ergy, allowing the spread of Micro Grids. A Micro Grid can infact be defined as a sub-network characterized by the presenceof autonomous (often renewable) energy sources buffered bysome type of ESS and locally controlled in order to achievesmart energy flows management [4]. In this scenario, the SmartGrid will evolve into a System of Systems (SoS), where mostof the loads and energy sources will be localized into MicroGrids, organized as a hierarchical territorial granulation, andacting as cooperative/competitive agents in a complex energytrading network. The key components for the full deploymentof this future technological setting are ESSs. Nowadays themost promising technology is represented by Li-Ion (LithiumIon) and Li-Po (Lithium Polymer) battery systems, controlledby suited BMSs (Battery Management Systems). The BMSrepresents the key component of every chemical ESS, sincethis electronic device is conceived and designed to manage,protect, monitor, balance and estimate the State of Charge(SoC) of rechargeable batteries. An accurate SoC determi-nation in Li-Ion batteries is the most important aspect formaximizing the battery pack usage and to evaluate and monitorcorrectly its State of Health (SoH). Determining the exactamount of energy available in a battery is an extremely difficultendeavor, due to the lack of deep knowledge of the electro-chemical behavior of a cell. The only available option isto perform an estimation of the SoC based on an externalcharacterization of the cell, i.e. based on current and voltagemeasurements. In the literature there exits several techniquesto perform this estimation: open circuit voltage (OCV) calcula-tion, coulomb counting, and/or more sophisticated techniquesthat employ state estimators such as the Extended KalmanFilter (EKF). In the paper, we propose a new battery modeland a procedure to characterize a cell, by estimating modelsparameters, finalized to enhance SoC estimation. We explain
2
the procedure relying on a mechanical (hydraulics) analogy.Once performed the parameters estimation, by a suited datadriven external characterization, an EKF is employed to lockand track the status of the system. Moreover, we propose around-robin approach to keep track of the states of multiplecells, by relying on a single implementation of the EKFblock. The system is designed to fully exploit all the availablecomputational power of the embedded system running theSoC procedure, and it is based on the fact that in practicalapplications currents are band-limited signals, characterizedby very low maximum frequencies, and thus allowing lowsampling rates. This paper is organized as follows. In Sect.IIwe describe a novel way to define the SoC of a rechargeablecell, while in Sect. III we explain the proposed cell model,defined as a series of three dipoles, each one defined tomodel contributions affecting the cell behavior at differenttime scales. Sect. IV depicts the parameters identificationprocedure, conceived to isolate and compute the quasi-static,dynamical and istantaneou contributions, by feeding the cellwith a suited current profile. The Muli-cell EKF is presentedin Sect. V. Test setups and results for both the model andthe Multi-cell EKF are reported in Sect. VI. Finally, ourconclusions are drown in Sect. VII.
II. CONSDERATIONS ON THE STATE OF CHARGE
A. Introduction
The SoC is a time dependent quantity representing thepercentage of the total storable charge still drainable from acell at a given instant of time [5]. Assuming for conveniencean unitary efficiency, it is usually defined as
SoC(t) = SoC(t0) +1
Cn
∫ t
t0
Iin(τ)dτ (1)
whereIin is the input current andCn is the nominal capacityof the cell, i.e. the amount of charge drainable, in an hour,from a fully charged cell at a given current rate. A cell is saidto be fully charged if a given maximum reference voltage ispermanently measured between its terminals in open circuitcondition. Even though (1) is quite clear from a theoreticalpoint of view, it is difficult to apply it in actual practice. Infact there are at least three problems with it:
1) we do not know the SoC valueSoC(t0) at time t02) we do not know exactly how the nominal capacityCn,
which could be different cell to cell, is related to themaximum and the minimum voltage of the cell.
3) it is very hard to measure the input currentIin accurately
It should be noted that most of the problems listed aboveare due to the insufficient semantic correlation of (1) withthe physical parameters of the cell. In fact the only cellparameter involved in (1) isCn and all the differences amongcells are flatten in the initial conditionSoC(t0). In order tooverpass these limits, the SoC definition should be tailoredcell by cell. An alternative SoC definition, capable to solvethe problems related to (1) will be introduced based on amechanical analogy.
B. A mechanical analogy
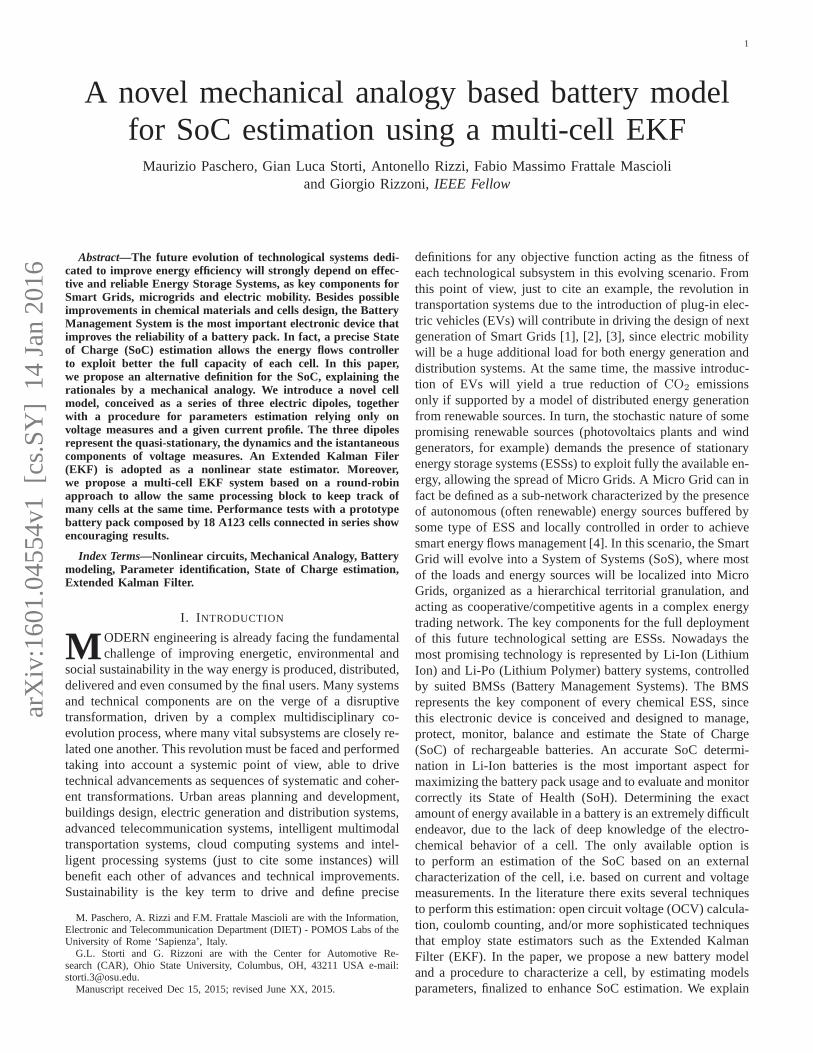
The problem of estimating the amount of charge stored in acell based on voltage and current measurements is quite similarto the problem of estimating the volume of the water storedin a reservoir based on pressure and flow rate measurements.As well known, the pressure at a given point is proportional
Figure 1: Mechanical analogy of a cell.
to the height of the column of fluid between this point and thewater surface; for this reason from now on we will use theterm pressure instead of height.
It should be noted that different amounts of water stored intwo reservoirs having different internal shape can providethesame pressure at the measurement point, as shown in Figure 1parts (a) and (b). In other words, when the internal shapeof the reservoir is unknown, it is not possible to determinethe amount of water contained in the tank based on pressuremeasures only.
In fact, the infinitesimal increment in the water volumedV and the consequent pressure variationdp are related oneanother through the reservoir cross section areaC(p) by therelation
C(p) =dV
dp(2)
Unfortunately, we don’t know the reservoir internal shape,i.e.the variation of the internal cross section areaC(p) with thepressure measured at the gauge (see Figure 1), but we can tryto estimate it experimentally.
C. Internal shape estimation procedure
In order to develop a procedure capable to estimate thereservoir internal shape, first of all we need to clarify whichactions we can perform on the reservoir. Referring to Figure1,there are only three actions we can carry out
• open or close the replenishment control• open or close the emptying control• read and acquire the pressurePout at the gauge
Moreover, we should realize that when we act on the re-plenishment and the emptying control, the water movementproduces the formation of waves on the stationary water level.Consequently, the pressurePout read at the gauge will be
3
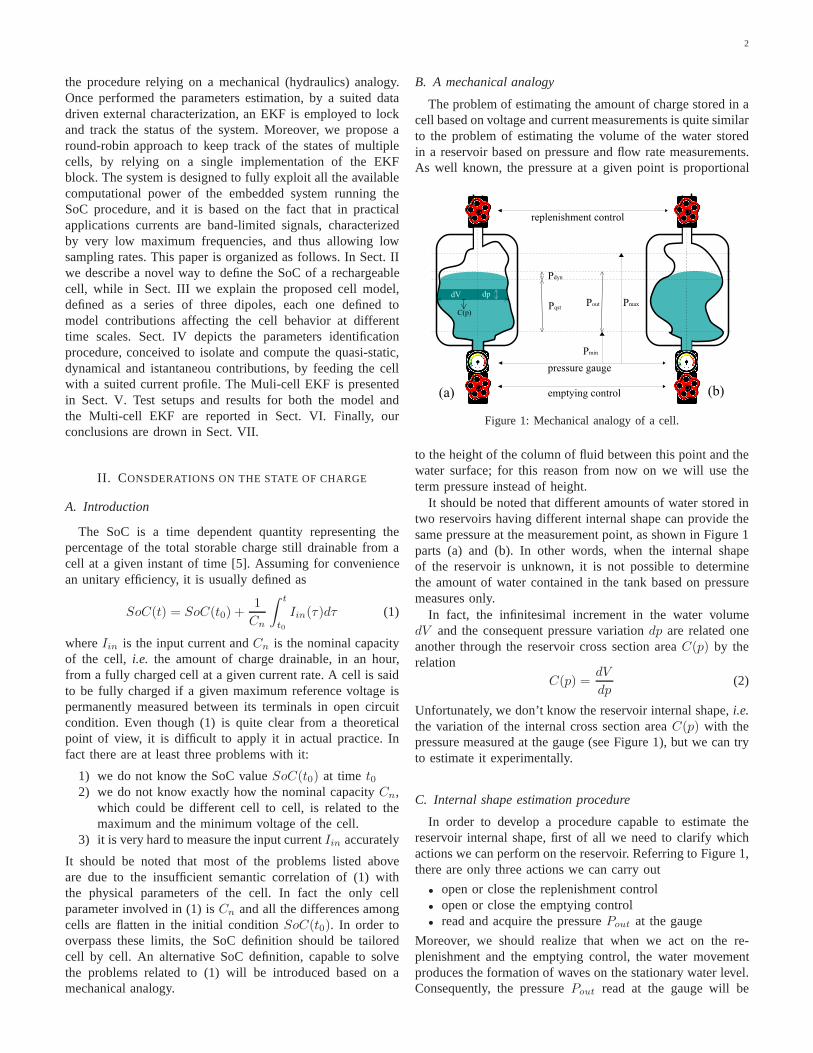
the summation of a quasi-statical contributionPqst and adynamical contributionPdyn.
The proposed procedure is composed of two macro phases:an initialization phase and an acquisition phase (see Figure 2).Each macro phase is composed of three steps, detailed in the
Figure 2: Internal shape extimation procedure.
following list.
step 1 fill the tank until the pressure at the gauge reachs adesired value
step 2 wait for the waves produced by the water injection havebeen damped
step 3 record the stationary value of pressurePmax at the gaugestep 4 empty the reservoir of a known amount of water∆V
for a specified period of timeTempty at a constant flowrate equalt to∆V/Tempty
step 5 wait for the waves produced by the water bleeding havebeen damped
step 6 record the stationary value of pressurePmin at the gauge
It should be noted that the values ofPmax, ∆V andTempty cannot be chosen in a completely arbitrary way, but they must beset accordingly with a previsional knowledge of the reservoir,whereas the value ofPmin is defined by the procedure itself.Furthermore, the procedure can be repeated cyclically,i.e., step1 can be consistently applied after step 6, even if in this casesteps 1 to 3 also will be acquisition steps.
It is important to realize that, during step 5, the emptyingcontrol is closed and, consequently, the stationary level of thewater does not change and the pressure variation acquired atthe gauge during this step is due to the damping of the dynamiccontribution only. This portion of the acquired pressure canbe used to model the waves dynamics. For this reason thetime periodTempty must be set large enough to ensure thatthe waves have spanned all their dynamic during the step4. Afterward, the waves model can be used to clean theoutput pressurePout acquired during step 4 from the dynamiccontribution, allowing us to derive the relationship between thevolumeV (Pqst) and the quasi-stationary pressurePqst. Oncethis relationship is available, the internal shapeC(p) can beestimeted accordig with (2).
D. An alternative SoC definition
Now we are ready to come back to the electrical domain.Replacing pressure with voltage and volume with charge wecan express the percentage of the total charge∆Q availablein the voltage range[Vmin, Vmax] still stored in the cell at the
time t by
SoC(Vqst(t)) =1
∆Q
∫ Vqst(t)
Vmin
C(ν)dν, Vqst(t) ∈ [Vmin, Vmax]
(3)Equation (3) offers an alternative definition of SoC whichovercomes most of the limits of (1). In fact,
• it does not require the knowledge of the previous historyof the cell (i.e. the initial conditions)
• The amount of charge∆Q is well related toVmax andVmin.
• it does not need an accurate current measurement becauseit is based on voltage only.
Moreover, (3) is based on the functionC(Vqst) which is aphysical property of the cell allowing a cell to cell tailoringof SoC definition.
Unfortunately the successful application of (3) requires theknowledge of the quasi-statical voltageVqst whereas we areable to measure the output voltageVout only. For this reasonwe are forced to develop a cell model well suited to employ astate observer in order to isolate the quasi-statical contributionfrom the dynamical one.
III. PROPOSED CELLMODEL
A Thevenin equivalent circuit model (ECM) is said to berealistic if it is able to reproduce within a given error thevoltages or the currents measured at the real component whenit is driven by any current or voltage waveform. The ECMaccuracy depends strongly on the choice of the foundationalcircuit elements [6]. In fact, trying to model a nonlineardevice through linear components implies the introductionofmathematical artifices, as SoC dependent resistors [7], [8], [9],that do not reflect any physical component.
In this paper, each cell has been modeled as a nonlineartwo terminal device. According with the arguments discussedin section II-B, the voltage measured at the cell terminalshas been modeled as the summation of contributions affectingthe cell behavior at different time scales. In order to includein the model a direct dependence between input currentIin and output voltageVout, an instantaneous contributionVist = Vist(Iin) has been added to the quasi-stationaryVqst
and the dynamicVdyn contributions described in section II-B.According with the previous arguments it can be stated that:
Vout(t) = Vqst(t) + Vdyn(t) + Vist(Iin(t)) (4)
Relation (4) can be considered as the output equation ofthe state form representation of the cell model. In order tocomplete the state form representation of the cell model weneed to chose appropriate state variables. According with themechanical analogy description given in section II-B, it seemsreasonable to selectVqst and Vdyn to represent the internalstate of the cell.
In order to derive the time evolution ofVqst(t), we canconsider (2) in the electric domain. Solving for the voltagevariation and taking the time derivative, we obtain
dVqst(t)
dt=
1
Cqst(Vqst(t))
dQ(t)
dt=
Iin(t)
Cqst(Vqst(t))(5)
4
It should be noted thatCqst(Vqst(t)) in (5) represents thenonlinear stationary capacity of the cell (i.e. its ‘internalshape’).
In order to keep the model as simple as possible at thisstage, the dynamic componentVdyn(t) will be considered asthe summation ofN linear first order filters.
Vdyn(t) =
N∑
i=1
Vi(t),dVi(t)
dt=
1
τi(RiIin(t)− Vi(t)) (6)
The value assumed by the dynamic component after theexhaustion of the transient can be evaluated to be
V ∞dyn =
(
N∑
i=1
Ri
)
Iin(t) (7)
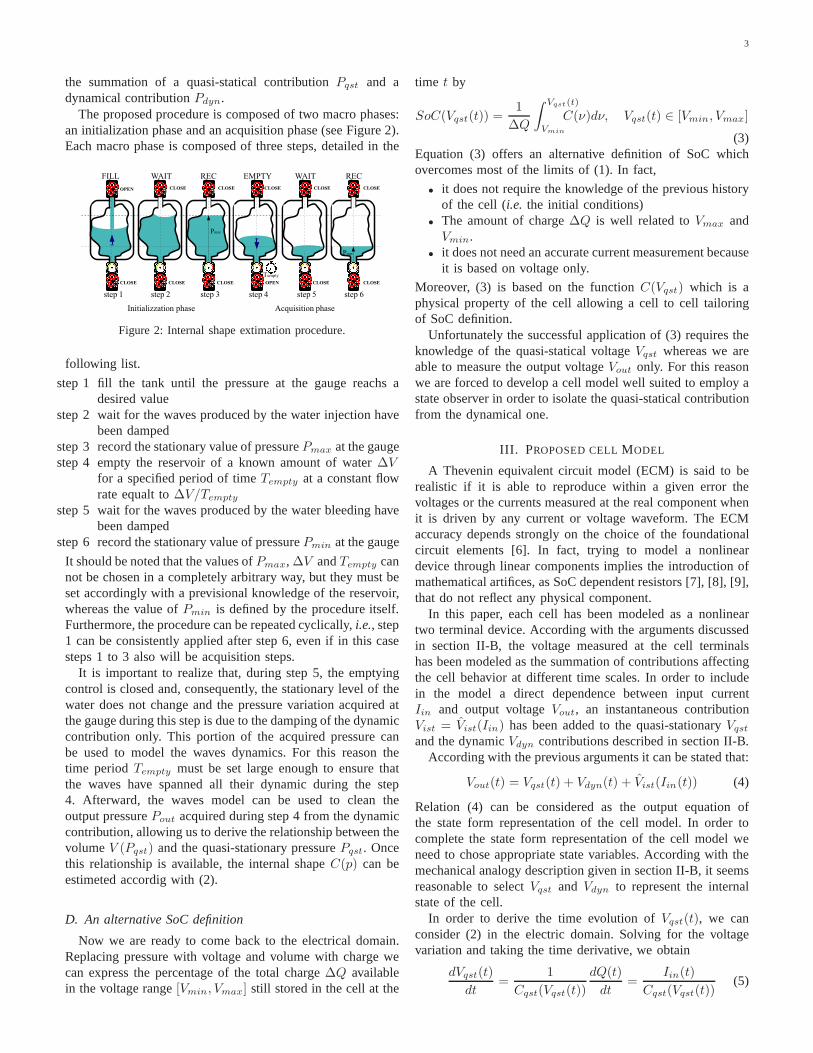
Equation (4), (5) and (6) can be interpreted, as shown inFigure 3, as the series connection of a nonlinear capacitor,a non linear resistor and a cascade of a certain number of RCgroups.
Vout(t)
Iin(t)
Vdyn(t) Vist(t)Vqst(t)
Figure 3: Equivalent circuit of the cell
IV. PARAMETER IDENTIFICATION
In order to determine the model parameters introduced insection III, we should apply the characterization proceduredescribed in section II-B to determine the reservoir’s shapeto a specific cell. The cell taken into consideration in thispaper is the A123 Nanophosphate AHR32113M1Ultra-B. Themain characteristics of this cell are given in Table I. The
Variable Setting
Cell Dimensions (mm) 32x113Cell Weight (g) 205
Cell Capacity (nominal/minimum, Ah) 4.4Energy Content (nominal, Wh) 14.6Discharge Power (nominal, W) 550
Voltage (nominal, V) 3.3Specific Power (nominal, W/kg) 2700
Specific Energy (nominal, Wh/kg) 71Energy Density (nominal, Wh/L) 161
Operating Temperature(C) -30 to 55Storage Temperature (C) -40 to 60
Table I: A123 Nanophosphate AHR32113M1Ultra-B specifications.
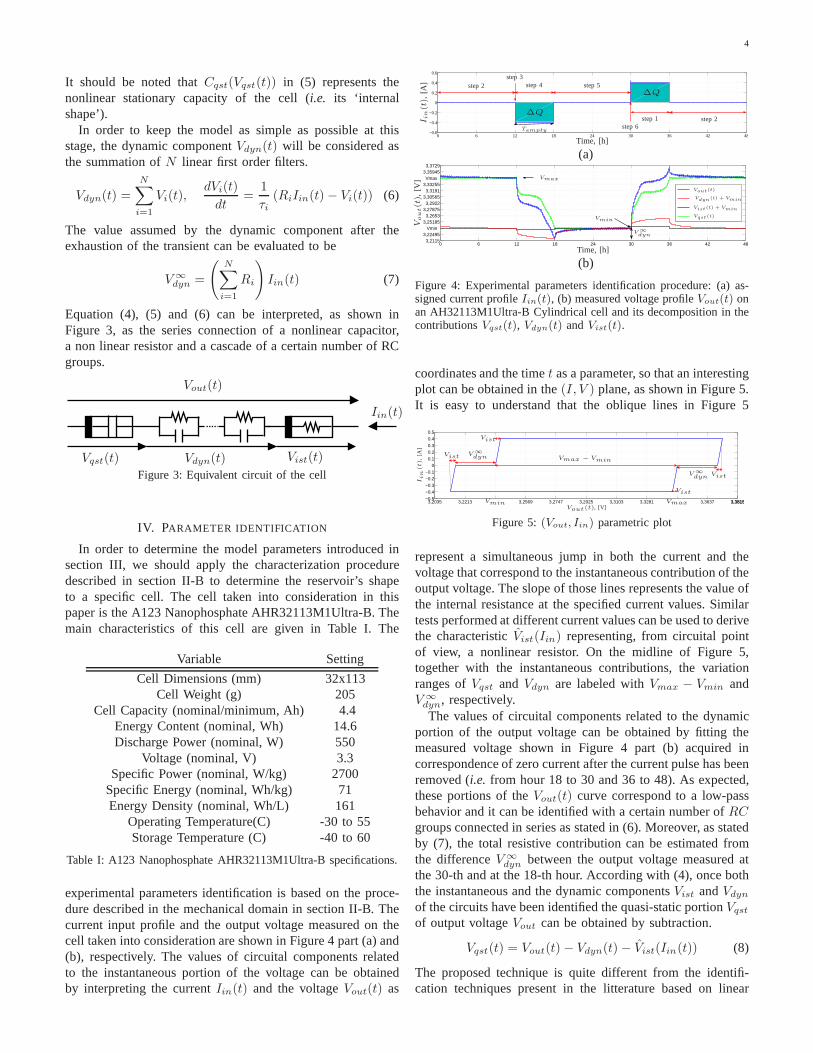
experimental parameters identification is based on the proce-dure described in the mechanical domain in section II-B. Thecurrent input profile and the output voltage measured on thecell taken into consideration are shown in Figure 4 part (a) and(b), respectively. The values of circuital components relatedto the instantaneous portion of the voltage can be obtainedby interpreting the currentIin(t) and the voltageVout(t) as
0 6 12 18 24 30 36 42 48−0.6
−0.4
−0.2
0
0.2
0.4
0.6
Time, [h]
I in(t),
[A]
Tempty
step 1
step 2
step 2
step 3step 4 step 5
step 6
∆Q
∆Q
(a)
0 6 12 18 24 30 36 42 483,2115
3,22495Vmin
3,251853,2653
3,278753,2922
3,305653,3191
3,33255Vmax
3,359453,3729
Time, [h]
Vout(t),
[V] Vmax
Vmin
V ∞
dyn
Vout(t)
Vdyn(t) + Vmin
Vist(t) + Vmin
Vqst(t)
(b)
Figure 4: Experimental parameters identification procedure: (a) as-signed current profileIin(t), (b) measured voltage profileVout(t) onan AH32113M1Ultra-B Cylindrical cell and its decomposition in thecontributionsVqst(t), Vdyn(t) andVist(t).
coordinates and the timet as a parameter, so that an interestingplot can be obtained in the(I, V ) plane, as shown in Figure 5.It is easy to understand that the oblique lines in Figure 5
3,2035 3,2213 3,2569 3,2747 3,2925 3,3103 3,3281 3,3637 3,38153,3816−0.5
−0.4
−0.3
−0.2
−0.1
0
0.1
0.2
0.3
0.4
0.5
Iin(t),
[A]
Vout(t), [V]
Vmax − Vmin
V ∞
dyn
V ∞
dyn
Vist
Vist
Vist
Vist
Vmin Vmax
Figure 5:(Vout, Iin) parametric plot
represent a simultaneous jump in both the current and thevoltage that correspond to the instantaneous contributionof theoutput voltage. The slope of those lines represents the value ofthe internal resistance at the specified current values. Similartests performed at different current values can be used to derivethe characteristicVist(Iin) representing, from circuital pointof view, a nonlinear resistor. On the midline of Figure 5,together with the instantaneous contributions, the variationranges ofVqst and Vdyn are labeled withVmax − Vmin andV ∞dyn, respectively.The values of circuital components related to the dynamic
portion of the output voltage can be obtained by fitting themeasured voltage shown in Figure 4 part (b) acquired incorrespondence of zero current after the current pulse has beenremoved (i.e. from hour 18 to 30 and 36 to 48). As expected,these portions of theVout(t) curve correspond to a low-passbehavior and it can be identified with a certain number ofRCgroups connected in series as stated in (6). Moreover, as statedby (7), the total resistive contribution can be estimated fromthe differenceV ∞
dyn between the output voltage measured atthe 30-th and at the 18-th hour. According with (4), once boththe instantaneous and the dynamic componentsVist andVdyn
of the circuits have been identified the quasi-static portion Vqst
of output voltageVout can be obtained by subtraction.
Vqst(t) = Vout(t)− Vdyn(t)− Vist(Iin(t)) (8)
The proposed technique is quite different from the identifi-cation techniques present in the litterature based on linear

5
combinations of nonlinear functions [10], [11], point by point[12] or on averaging charge and discharge curves [13], [14].
The three components ofVout(t) have been plotted togetheron Figure 5 part (b). In order to improve the readabilityof the plot bothVist(t) and Vdyn(t) have been added toVmin. From Figure 5, it is possible to realize that the onlyvoltage contribution for zero current is the dynamical onei.e.Vout(t) = Vdyn(t) for Iin(t) = 0. This property is reallyuseful to identifyVdyn (i.e. the wave dynamics). Moreover, itshould be noted that when subject to positive and to negativecurrent pulses,Vdyn exhibits a non symmetrical behaviorresulting in an error in the open circuit voltage estimationwhen the mean value between the charge and the dischargebranches is considered [13], [14].
According with the literature, the estimatedVqst(t) exhibitsdifferent behaviour during charge and discharge. In fact,plotting the current integralQ(t) versus this portion of theoutput voltage, the characteristicQ(Vqst) shown in Figure 6 isobtained. According with the arguments given in section II-B,
3,252 3,264 3,276 3,288 3,312 3,324 3.336−0.1
00.10.20.30.40.50.60.70.80.9
11.1
Q(V
qst)/
∆Q
Vqst , [V] VmaxVmin Vn
Figure 6:Q(Vqst) characteristic. Mean value in red.
for applying (3) we need to estimate the statical capacitance ofthe cell. The hysteretic behavior of the cell produces differentcapacitances (shapes) for the charge and the discharge process.In order to simplify the model, we are forced to consideran average between the charge and the discharge behaviors.Consequently, the static capacitance of the cellCqst(Vqst)can be estimated applying (2) to the mean curve shown inred in Figure 6. The curve obtained forCqst(Vqst) is plottedin Figure 7. From the plot it is evident that most of the
3.252 3.264 3.276 3.288 3.312 3.324 3.3360
50
100
150
200
Vqst , [V]Vmin VmaxVn
∆Vn
Cqst(V
qst),
[F]
Figure 7: Estimated nonlinear statical capacity
charge is accumulated around a single statical voltage valuecorresponding to the maximum value of the capacitance. Thisargument can be used as a constructive definition of thenominal voltageVn and it strengthens the choice made inthis paper to useVmin and Vmax values closer toVn withrespect to the values given by the constructor. Moreover, itisinteresting to note that following the proposed procedure thereis just a small shift∆Vn between the nominal voltage givenby the cell constructor and the peak of the estimated staticalcapacitance.
V. M ULTI -CELL EXTENDED KALMAN FILTER
A. Framework
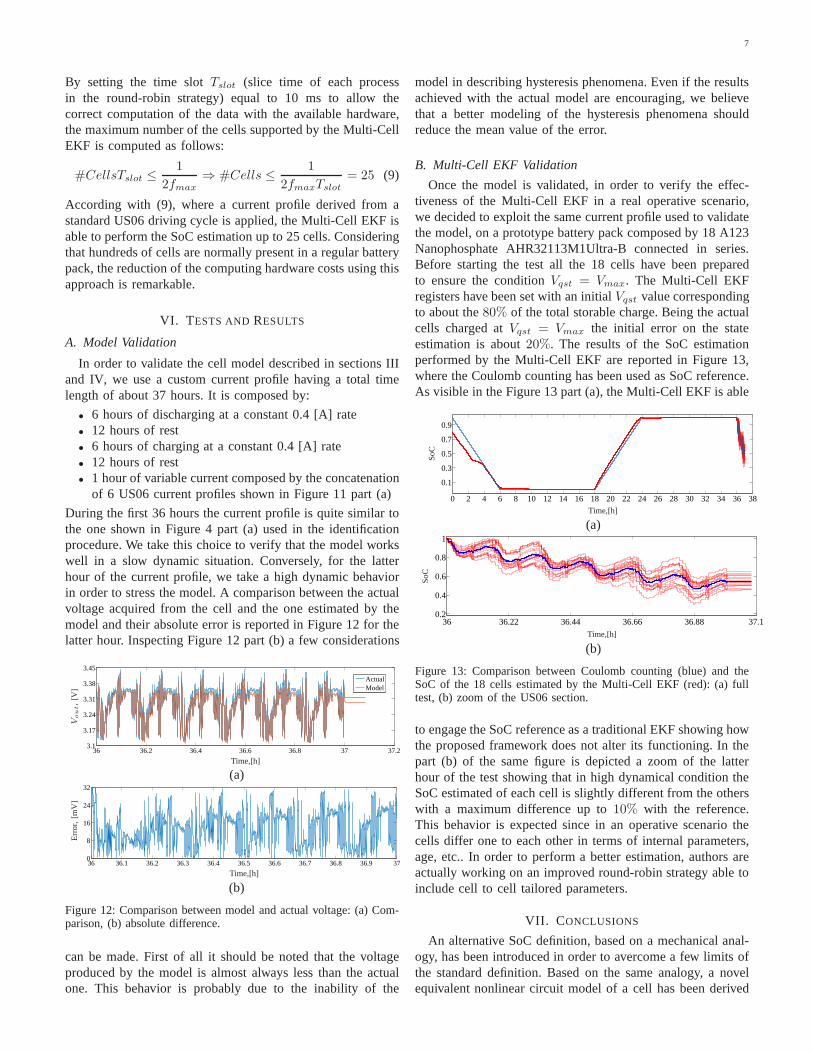
As well known in the literature, the EKF is a powerfulmethod to estimate the states of a nonlinear system suchas internal parameters and SoC of a battery. However, thisapproach presents several weak points: (i) the precision ofthemodel implemented into the observer can heavily influence theestimation precision; (ii) depending on the application the timeconvergence to reach a reasonable estimation can be too long;(iii) the initialization of the auto-covariance Q matrix can bedifficult; (iv) the EKF is able to estimate the states of only onesystem (i.e. a single cell). In order to improve the robustnessand the reliability of this methodology, regarding points (i),(ii) and (iii), it is possible to increase the complexity of thebattery model, perform a better initial condition estimationand empirically find the best Q matrix values, respectively.Considering point (iv), to our best knowledge, to date has notbeen proposed any approach allowing the estimation of thestates of multiple cells using only one observer (i.e. EKF).Thus, in a real system composed by dozens of cells, as manyEKFs have to be implemented, exacerbating the complexityof the system and the used memory space. For these reasons,in the last year the University of Rome Sapienza and theOhio State University have worked together in order to find away to develop a novel methodology defined Multi-Cell EKF.The idea is quite simple and it is based on the well knownround-robin strategy, where time slices are assigned to eachprocess in equal portions and in circular order, handling allprocesses without priority. Starting from this idea, it hasbeenimplemented a framework that allows a single EKF to performthe states estimation of different batteries. Indeed, consideringthe “slow” evolution of voltage and current during normalapplications, it is reasonable to expect similarly slow changesof battery conditions. The block diagram explaining the round-robin approach is reported in Figure 8. Even though the round-robin strategy is well known, some relevant comment can bemade. Using this novel approach, the estimation of cells eitherwith the same chemistry or not residing either in the samebattery pack or in different ones is possible. Indeed, as shownin Figure 8, the EKF receives only voltage and current valuesignoring any other information of the cells (i.e. chemistryand position in the battery pack). In order to simplify thedescription of this novel Multi-Cell EKF, we consider a batterypack constituted by the connection in series of cells all havingthe same chemistry.
Figure 8: General block diagram of the Multi-Cell EKF framework.
6
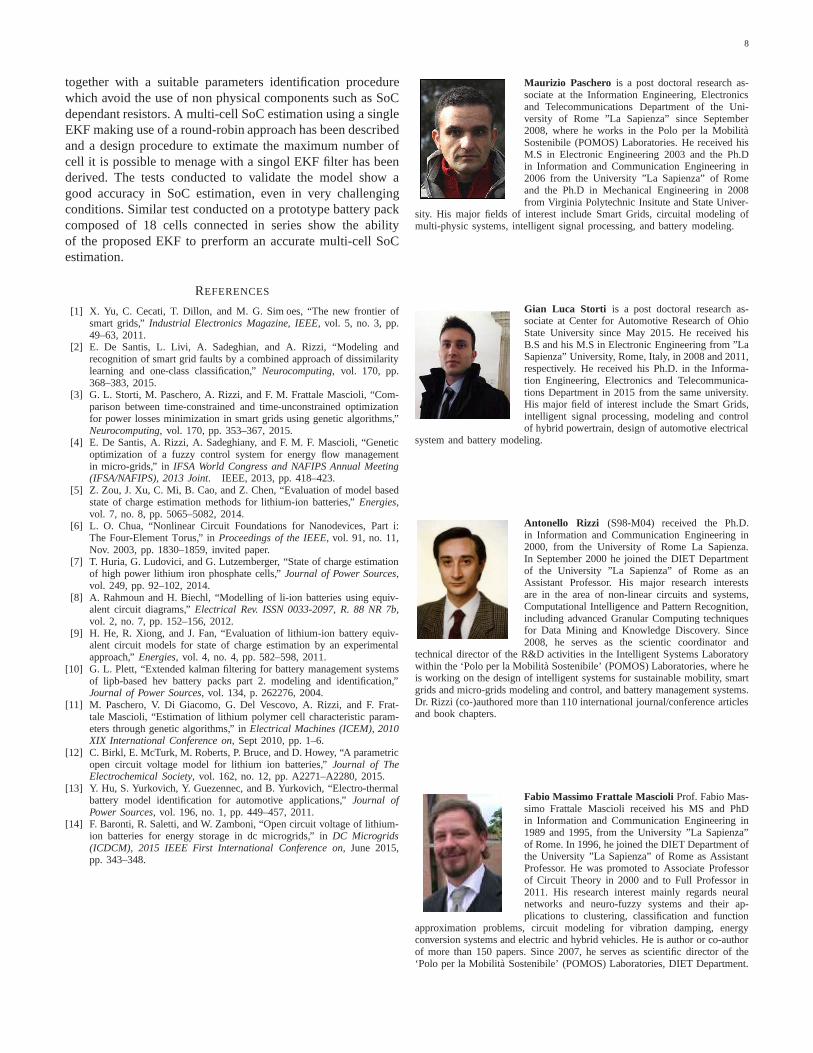
Even though the round-robin concept shown in Figure 8 canappear quite simple, its correct implementation is not trivialdue to the recursive structure of the observer. In fact the EKFalgorithm is composed by two steps definedPrediction andCorrection. The first step involves projecting both the mostrecent states estimation and an estimate of the error covariance(from the previous time period) forwards in time to computea predicted (or a-priori) estimate of the states at the currenttime. The second step involves correcting the predicted statescalculated in the first step by incorporating the most recentprocess measurement to generate an updated (or a-posteriori)state estimation. Thus, applying the round-robin strategy, foreach time slice thePrediction step has to be fed by suitabledata from theCorrection step at the previous time period.Along this line, the general framework block diagram shownin Figure 8 has been modified as shown in Figure 9, where theactual EKF has been used as an engine to perform calculations,whereas the framework has been used to change the cell undertest every time slice.
Figure 9: Block diagram of the developed Multi-Cell EKF framework.
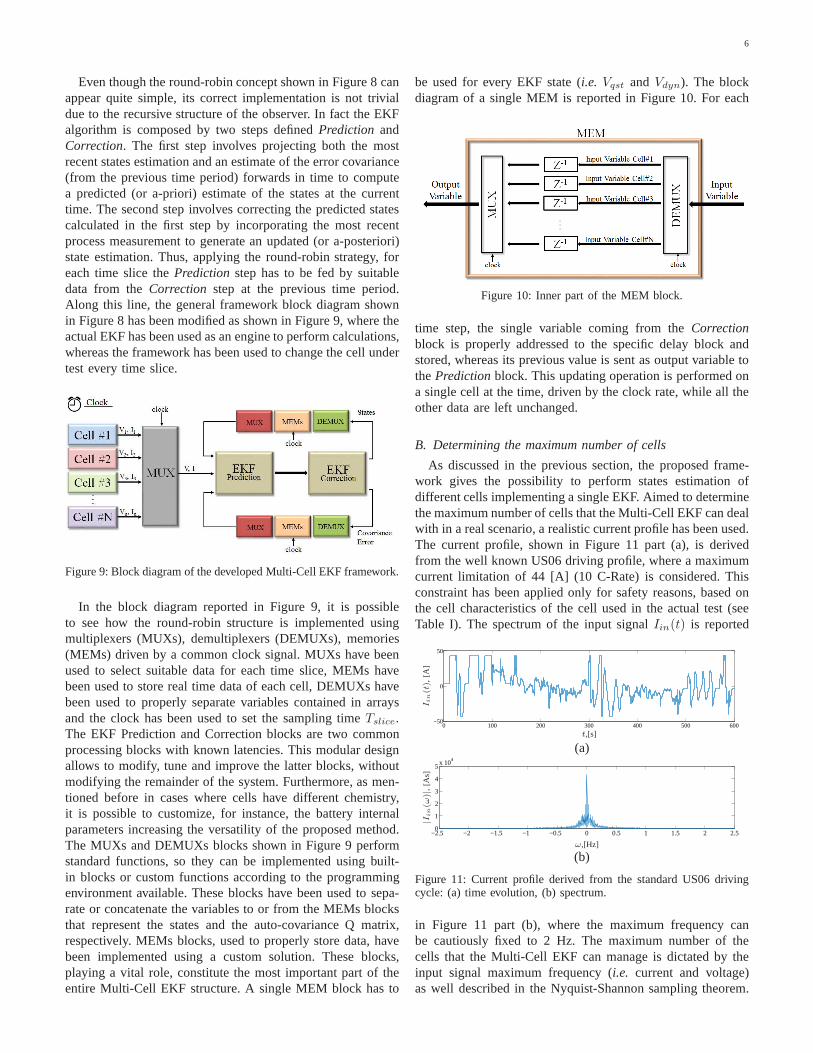
In the block diagram reported in Figure 9, it is possibleto see how the round-robin structure is implemented usingmultiplexers (MUXs), demultiplexers (DEMUXs), memories(MEMs) driven by a common clock signal. MUXs have beenused to select suitable data for each time slice, MEMs havebeen used to store real time data of each cell, DEMUXs havebeen used to properly separate variables contained in arraysand the clock has been used to set the sampling timeTslice.The EKF Prediction and Correction blocks are two commonprocessing blocks with known latencies. This modular designallows to modify, tune and improve the latter blocks, withoutmodifying the remainder of the system. Furthermore, as men-tioned before in cases where cells have different chemistry,it is possible to customize, for instance, the battery internalparameters increasing the versatility of the proposed method.The MUXs and DEMUXs blocks shown in Figure 9 performstandard functions, so they can be implemented using built-in blocks or custom functions according to the programmingenvironment available. These blocks have been used to sepa-rate or concatenate the variables to or from the MEMs blocksthat represent the states and the auto-covariance Q matrix,respectively. MEMs blocks, used to properly store data, havebeen implemented using a custom solution. These blocks,playing a vital role, constitute the most important part of theentire Multi-Cell EKF structure. A single MEM block has to
be used for every EKF state (i.e. Vqst andVdyn). The blockdiagram of a single MEM is reported in Figure 10. For each
Figure 10: Inner part of the MEM block.
time step, the single variable coming from theCorrectionblock is properly addressed to the specific delay block andstored, whereas its previous value is sent as output variable tothePredictionblock. This updating operation is performed ona single cell at the time, driven by the clock rate, while all theother data are left unchanged.
B. Determining the maximum number of cells
As discussed in the previous section, the proposed frame-work gives the possibility to perform states estimation ofdifferent cells implementing a single EKF. Aimed to determinethe maximum number of cells that the Multi-Cell EKF can dealwith in a real scenario, a realistic current profile has been used.The current profile, shown in Figure 11 part (a), is derivedfrom the well known US06 driving profile, where a maximumcurrent limitation of 44 [A] (10 C-Rate) is considered. Thisconstraint has been applied only for safety reasons, based onthe cell characteristics of the cell used in the actual test (seeTable I). The spectrum of the input signalIin(t) is reported
0 100 200 300 400 500 600−50
0
50
I in(t),
[A]
t,[s]
(a)
−2.5 −2 −1.5 −1 −0.5 0 0.5 1 1.5 2 2.50
1
2
3
4
5x 10
4
|Iin(ω
)|,
[As]
ω,[Hz]
(b)
Figure 11: Current profile derived from the standard US06 drivingcycle: (a) time evolution, (b) spectrum.
in Figure 11 part (b), where the maximum frequency canbe cautiously fixed to 2 Hz. The maximum number of thecells that the Multi-Cell EKF can manage is dictated by theinput signal maximum frequency (i.e. current and voltage)as well described in the Nyquist-Shannon sampling theorem.
7
By setting the time slotTslot (slice time of each processin the round-robin strategy) equal to 10 ms to allow thecorrect computation of the data with the available hardware,the maximum number of the cells supported by the Multi-CellEKF is computed as follows:
#CellsTslot ≤1
2fmax⇒ #Cells ≤
1
2fmaxTslot= 25 (9)
According with (9), where a current profile derived from astandard US06 driving cycle is applied, the Multi-Cell EKF isable to perform the SoC estimation up to 25 cells. Consideringthat hundreds of cells are normally present in a regular batterypack, the reduction of the computing hardware costs using thisapproach is remarkable.
VI. T ESTS ANDRESULTS
A. Model Validation
In order to validate the cell model described in sections IIIand IV, we use a custom current profile having a total timelength of about 37 hours. It is composed by:
• 6 hours of discharging at a constant 0.4 [A] rate• 12 hours of rest• 6 hours of charging at a constant 0.4 [A] rate• 12 hours of rest• 1 hour of variable current composed by the concatenation
of 6 US06 current profiles shown in Figure 11 part (a)
During the first 36 hours the current profile is quite similar tothe one shown in Figure 4 part (a) used in the identificationprocedure. We take this choice to verify that the model workswell in a slow dynamic situation. Conversely, for the latterhour of the current profile, we take a high dynamic behaviorin order to stress the model. A comparison between the actualvoltage acquired from the cell and the one estimated by themodel and their absolute error is reported in Figure 12 for thelatter hour. Inspecting Figure 12 part (b) a few considerations
36 36.2 36.4 36.6 36.8 37 37.23.1
3.17
3.24
3.31
3.38
3.45
ActualModel
Vout,
[V]
Time,[h]
(a)
36 36.1 36.2 36.3 36.4 36.5 36.6 36.7 36.8 36.9 370
8
16
24
32
Err
or,
[mV
]
Time,[h]
(b)
Figure 12: Comparison between model and actual voltage: (a)Com-parison, (b) absolute difference.
can be made. First of all it should be noted that the voltageproduced by the model is almost always less than the actualone. This behavior is probably due to the inability of the
model in describing hysteresis phenomena. Even if the resultsachieved with the actual model are encouraging, we believethat a better modeling of the hysteresis phenomena shouldreduce the mean value of the error.
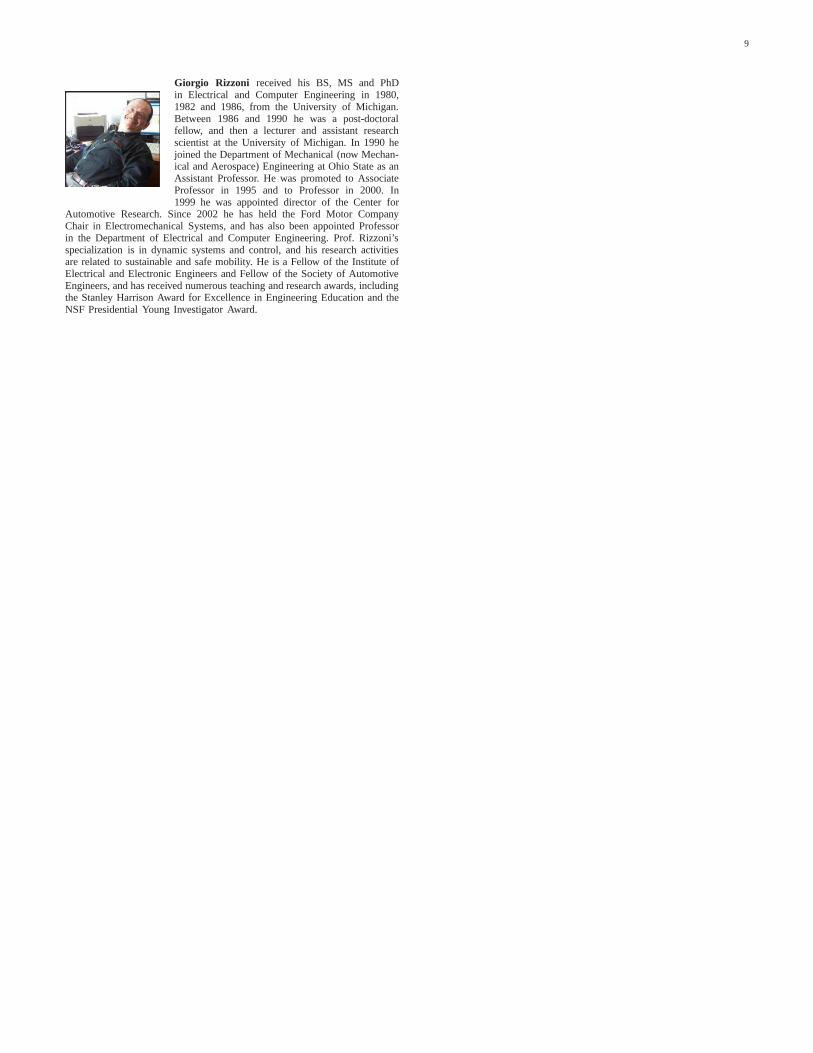
B. Multi-Cell EKF Validation
Once the model is validated, in order to verify the effec-tiveness of the Multi-Cell EKF in a real operative scenario,we decided to exploit the same current profile used to validatethe model, on a prototype battery pack composed by 18 A123Nanophosphate AHR32113M1Ultra-B connected in series.Before starting the test all the 18 cells have been preparedto ensure the conditionVqst = Vmax. The Multi-Cell EKFregisters have been set with an initialVqst value correspondingto about the80% of the total storable charge. Being the actualcells charged atVqst = Vmax the initial error on the stateestimation is about20%. The results of the SoC estimationperformed by the Multi-Cell EKF are reported in Figure 13,where the Coulomb counting has been used as SoC reference.As visible in the Figure 13 part (a), the Multi-Cell EKF is able
0 2 4 6 8 10 12 14 16 18 20 22 24 26 28 30 32 34 36 38
0.1
0.3
0.5
0.7
0.9
SoC
Time,[h]
(a)
36 36.22 36.44 36.66 36.88 37.10.2
0.4
0.6
0.8
1
SoC
Time,[h]
(b)
Figure 13: Comparison between Coulomb counting (blue) and theSoC of the 18 cells estimated by the Multi-Cell EKF (red): (a)fulltest, (b) zoom of the US06 section.
to engage the SoC reference as a traditional EKF showing howthe proposed framework does not alter its functioning. In thepart (b) of the same figure is depicted a zoom of the latterhour of the test showing that in high dynamical condition theSoC estimated of each cell is slightly different from the otherswith a maximum difference up to10% with the reference.This behavior is expected since in an operative scenario thecells differ one to each other in terms of internal parameters,age, etc.. In order to perform a better estimation, authors areactually working on an improved round-robin strategy able toinclude cell to cell tailored parameters.
VII. C ONCLUSIONS
An alternative SoC definition, based on a mechanical anal-ogy, has been introduced in order to avercome a few limits ofthe standard definition. Based on the same analogy, a novelequivalent nonlinear circuit model of a cell has been derived
8
together with a suitable parameters identification procedurewhich avoid the use of non physical components such as SoCdependant resistors. A multi-cell SoC estimation using a singleEKF making use of a round-robin approach has been describedand a design procedure to extimate the maximum number ofcell it is possible to menage with a singol EKF filter has beenderived. The tests conducted to validate the model show agood accuracy in SoC estimation, even in very challengingconditions. Similar test conducted on a prototype battery packcomposed of 18 cells connected in series show the abilityof the proposed EKF to prerform an accurate multi-cell SoCestimation.
REFERENCES
[1] X. Yu, C. Cecati, T. Dillon, and M. G. Sim oes, “The new frontier ofsmart grids,”Industrial Electronics Magazine, IEEE, vol. 5, no. 3, pp.49–63, 2011.
[2] E. De Santis, L. Livi, A. Sadeghian, and A. Rizzi, “Modeling andrecognition of smart grid faults by a combined approach of dissimilaritylearning and one-class classification,”Neurocomputing, vol. 170, pp.368–383, 2015.
[3] G. L. Storti, M. Paschero, A. Rizzi, and F. M. Frattale Mascioli, “Com-parison between time-constrained and time-unconstrainedoptimizationfor power losses minimization in smart grids using genetic algorithms,”Neurocomputing, vol. 170, pp. 353–367, 2015.
[4] E. De Santis, A. Rizzi, A. Sadeghiany, and F. M. F. Mascioli, “Geneticoptimization of a fuzzy control system for energy flow managementin micro-grids,” in IFSA World Congress and NAFIPS Annual Meeting(IFSA/NAFIPS), 2013 Joint. IEEE, 2013, pp. 418–423.
[5] Z. Zou, J. Xu, C. Mi, B. Cao, and Z. Chen, “Evaluation of model basedstate of charge estimation methods for lithium-ion batteries,” Energies,vol. 7, no. 8, pp. 5065–5082, 2014.
[6] L. O. Chua, “Nonlinear Circuit Foundations for Nanodevices, Part i:The Four-Element Torus,” inProceedings of the IEEE, vol. 91, no. 11,Nov. 2003, pp. 1830–1859, invited paper.
[7] T. Huria, G. Ludovici, and G. Lutzemberger, “State of charge estimationof high power lithium iron phosphate cells,”Journal of Power Sources,vol. 249, pp. 92–102, 2014.
[8] A. Rahmoun and H. Biechl, “Modelling of li-ion batteriesusing equiv-alent circuit diagrams,”Electrical Rev. ISSN 0033-2097, R. 88 NR 7b,vol. 2, no. 7, pp. 152–156, 2012.
[9] H. He, R. Xiong, and J. Fan, “Evaluation of lithium-ion battery equiv-alent circuit models for state of charge estimation by an experimentalapproach,”Energies, vol. 4, no. 4, pp. 582–598, 2011.
[10] G. L. Plett, “Extended kalman filtering for battery management systemsof lipb-based hev battery packs part 2. modeling and identification,”Journal of Power Sources, vol. 134, p. 262276, 2004.
[11] M. Paschero, V. Di Giacomo, G. Del Vescovo, A. Rizzi, andF. Frat-tale Mascioli, “Estimation of lithium polymer cell characteristic param-eters through genetic algorithms,” inElectrical Machines (ICEM), 2010XIX International Conference on, Sept 2010, pp. 1–6.
[12] C. Birkl, E. McTurk, M. Roberts, P. Bruce, and D. Howey, “A parametricopen circuit voltage model for lithium ion batteries,”Journal of TheElectrochemical Society, vol. 162, no. 12, pp. A2271–A2280, 2015.
[13] Y. Hu, S. Yurkovich, Y. Guezennec, and B. Yurkovich, “Electro-thermalbattery model identification for automotive applications,” Journal ofPower Sources, vol. 196, no. 1, pp. 449–457, 2011.
[14] F. Baronti, R. Saletti, and W. Zamboni, “Open circuit voltage of lithium-ion batteries for energy storage in dc microgrids,” inDC Microgrids(ICDCM), 2015 IEEE First International Conference on, June 2015,pp. 343–348.
Maurizio Paschero is a post doctoral research as-sociate at the Information Engineering, Electronicsand Telecommunications Department of the Uni-versity of Rome ”La Sapienza” since September2008, where he works in the Polo per la MobilitaSostenibile (POMOS) Laboratories. He received hisM.S in Electronic Engineering 2003 and the Ph.Din Information and Communication Engineering in2006 from the University ”La Sapienza” of Romeand the Ph.D in Mechanical Engineering in 2008from Virginia Polytechnic Insitute and State Univer-
sity. His major fields of interest include Smart Grids, circuital modeling ofmulti-physic systems, intelligent signal processing, andbattery modeling.
Gian Luca Storti is a post doctoral research as-sociate at Center for Automotive Research of OhioState University since May 2015. He received hisB.S and his M.S in Electronic Engineering from ”LaSapienza” University, Rome, Italy, in 2008 and 2011,respectively. He received his Ph.D. in the Informa-tion Engineering, Electronics and Telecommunica-tions Department in 2015 from the same university.His major field of interest include the Smart Grids,intelligent signal processing, modeling and controlof hybrid powertrain, design of automotive electrical
system and battery modeling.
Antonello Rizzi (S98-M04) received the Ph.D.in Information and Communication Engineering in2000, from the University of Rome La Sapienza.In September 2000 he joined the DIET Departmentof the University ”La Sapienza” of Rome as anAssistant Professor. His major research interestsare in the area of non-linear circuits and systems,Computational Intelligence and Pattern Recognition,including advanced Granular Computing techniquesfor Data Mining and Knowledge Discovery. Since2008, he serves as the scientic coordinator and
technical director of the R&D activities in the IntelligentSystems Laboratorywithin the ‘Polo per la Mobilita Sostenibile’ (POMOS) Laboratories, where heis working on the design of intelligent systems for sustainable mobility, smartgrids and micro-grids modeling and control, and battery management systems.Dr. Rizzi (co-)authored more than 110 international journal/conference articlesand book chapters.
Fabio Massimo Frattale MascioliProf. Fabio Mas-simo Frattale Mascioli received his MS and PhDin Information and Communication Engineering in1989 and 1995, from the University ”La Sapienza”of Rome. In 1996, he joined the DIET Department ofthe University ”La Sapienza” of Rome as AssistantProfessor. He was promoted to Associate Professorof Circuit Theory in 2000 and to Full Professor in2011. His research interest mainly regards neuralnetworks and neuro-fuzzy systems and their ap-plications to clustering, classification and function
approximation problems, circuit modeling for vibration damping, energyconversion systems and electric and hybrid vehicles. He is author or co-authorof more than 150 papers. Since 2007, he serves as scientific director of the‘Polo per la Mobilita Sostenibile’ (POMOS) Laboratories,DIET Department.
9
Giorgio Rizzoni received his BS, MS and PhDin Electrical and Computer Engineering in 1980,1982 and 1986, from the University of Michigan.Between 1986 and 1990 he was a post-doctoralfellow, and then a lecturer and assistant researchscientist at the University of Michigan. In 1990 hejoined the Department of Mechanical (now Mechan-ical and Aerospace) Engineering at Ohio State as anAssistant Professor. He was promoted to AssociateProfessor in 1995 and to Professor in 2000. In1999 he was appointed director of the Center for
Automotive Research. Since 2002 he has held the Ford Motor CompanyChair in Electromechanical Systems, and has also been appointed Professorin the Department of Electrical and Computer Engineering. Prof. Rizzoni’sspecialization is in dynamic systems and control, and his research activitiesare related to sustainable and safe mobility. He is a Fellow of the Institute ofElectrical and Electronic Engineers and Fellow of the Society of AutomotiveEngineers, and has received numerous teaching and researchawards, includingthe Stanley Harrison Award for Excellence in Engineering Education and theNSF Presidential Young Investigator Award.