a novel gene expression mechanism by npm1 (npm1 による新た …
TRANSCRIPT

A novel gene expression mechanism by NPM1
(NPM1による新たな遺伝子発現制御機構)
2017
Ph.D. Program in Human Biology,
School of the Integrative and Global Majors,
University of Tsukuba
Mayumi Abe

1
Preface
My scientific interest is how gene expression is regulated in the cells. Since
chromatin structure affects the binding of trans-acting factors to DNA thereby
regulates gene expression, it is important to understand the regulation
mechanism of chromatin dynamics. Histones, which are main components of
chromatin, have been implicated in the regulator of its dynamics. Histone
modifications and histone variants can change the interaction between DNA and
histones. In addition, chromatin remodeling factors such as histone chaperones
also participate in assembly and disassembly of histones. My laboratory
previously identified NPM1/nucleophosmin/B23 as a factor stimulating adenovirus
chromatin remodeling and studied its functions and characteristics by biochemical
analysis. Recently, we also showed that NPM1 is involved in the regulation of
various genes. However, the function of NPM1 in the transcription is not well
understood. The transcriptional regulatory functions of NPM1 are suggested to be
distinct from the chromatin regulatory functions of NPM1. Therefore, I am
interested in the mechanism by which NPM1 participates in the regulation of gene
expression. Importantly, NPM1 is closely related to cancer development.
Abnormal NPM1 gene expression pattern was often found in cancer cells. About
30% of acute myeloid leukemia has a mutation in NPM1. In addition, it is known
that NPM1 is overexpressed in human solid tumors. It is interesting how
deregulated NPM1 gene expression leads to cancer development. In this
dissertation, I focused on the function of NPM1 in the transcriptional regulation of

2
the genes, especially the IFN-γ induced genes. These data are described in the
Chapters 1 and 2. I also discussed the connection between the role of NPM1 in
transcription and cancer development. In parallel, I also engaged in studying
about linker histone H1 variants. As I mentioned above, chromatin dynamics is
quite important for the regulation of gene expression. Linker histone H1 is one of
the major components of chromatin and involved in the formation of higher order
chromatin structure. Linker histone H1 has seven variants expressed in somatic
cells. However, the function of individual H1 variants remains poorly understood.
To understand the functional difference of H1 variants, I biochemically
characterized the individual H1 variants. This data is described in Chapter 3.
Additionally, I also focused on the regulation mechanism maintaining the amount
of H1. Interestingly, knockout of one H1 variant gene did not affect the total
amount of H1 that is compensated by the other H1 variants. It is probably because
of the backup system to maintain the chromatin structure. To understand this
backup system, I tried to examine the mechanism by which the amount of H1 is
sensed and regulated. To learn the techniques to analyze the level of individual
H1 variants, I visited Florida State University. All these achievements about linker
histone H1 are described in Chapter 4.

3
Table of contents Preface________________________________________________________1 Table of contents______________________________________________3 Chapter 1: Nucleophosmin1/B23_______________________________5 Chapter 2: Selective regulation of the type II IFN-inducible genes by NPM1/nucleophosmin_____________________________________10 2-1. Abstract________________________________________________10 2-2. Introduction_____________________________________________11 2-3. Materials and Methods____________________________________14
2-3-1. Plasmid construction_____________________________________14 2-3-2. Cell culture, transfection and reagents_______________________15
2-3-3. Purification of recombinant proteins_________________________16 2-3-4. Immunoprecipitation and GST-pull down_____________________17 2-3-5. Reporter assay_________________________________________17
2-3-6. RT-qPCR______________________________________________18 2-3-7. Immunofluorescence_____________________________________18
2-4. Results__________________________________________________20 2-4-1. NPM1 regulates the transcription of IFN-γ-induced genes_________20 2-4-2. NPM1 affects the STAT1-mediated transcription________________23 2-4-3. NPM1 regulates the CIITA gene expression____________________24
2-4-4. NPM1 binds to IRF1 through the oligomerization domain__________26 2-5. Discussion______________________________________________27 2-6. Figures and legends______________________________________30 2-7. Table for primers_________________________________________42 Chapter 3: Characterization of linker histone H1 variants______43 3-1. Introduction______________________________________________43 3-2. Materials and Methods_____________________________________46 3-2-1. Plasmid construction______________________________________46 3-2-2. Cell culture, transfection and reagents________________________46
3-2-3. Purification of recombinant proteins __________________________47 3-2-4. Reconstitution and purification of nucleosome core particles_______48 3-2-5. DNA/NCP and histone chaperone binding assays_______________48

4
3-2-6. Immunoprecipitation and GST-pull down______________________49 3-2-7. FRAP assay___________________________________________50 3-2-8. Antibodies_____________________________________________50
3-3. Results__________________________________________________52 3-3-1. Cellular behaviors of individual H1 variants____________________52 3-3-2. DNA and nucleosome binding of H1 variants in vitro__________52
3-3-3. Interaction between H1 and chaperones____________________53 3-3-4. Histone chaperone activity for H1 variants___________________54 3-4. Discussion_______________________________________________56 3-5. Figures and legends_______________________________________59 3-6. Table for primers___________________________________________67 Chapter 4: A mechanism maintaining the amount of H1___________________________________________________68 4-1. Introduction_______________________________________________68 4-2. Materials and methods_____________________________________70 4-2-1. Cell culture, transfection and reagents________________________70 4-2-2. Isolation of histone proteins________________________________70 4-2-3. Triton acid urea gel_______________________________________71
4-2-4. Reversed-phase HPLC separation of histones__________________71 4-2-5. RT-qPCR_______________________________________________72 4-3. Results___________________________________________________73 4-3-1. The effect of H1.4 or H1.0 depletion on the expression of the other H1 variant genes___________________________________________73 4-3-2. Separation of H1 variant proteins____________________________74
4-3-3. The effect of H1.4 depletion on the expression of the other H1 variant proteins________________________________________________75 4-4. Discussion_________________________________________________76 4-5. Figures and legends_______________________________________ 78 4-6. Table for primers______________________________________________83 Chapter 5: Summary__________________________________________84 Chapter 6: Significance and perspective______________________87 References__________________________________________________89 Acknowledgement___________________________________________ 97

5
Chapter 1: Nucleophosmin1/B23 Nucleophosmin (NPM)/B23 that is also called numatrin [1] or NO38 [2], was
originally identified as a nucleolar phosphoprotein expressed at higher levels in
Novikoff-Hepatoma cells compared to normal Rat lever cells [3,4]. The name of
B23 is derived from a spot number of two dimensional gel electrophoresis. NPM1
is a member of Nucleophosmin/nucleoplasmin (NPM) family, which is also known
as histone chaperones family. There are three NPM family proteins termed NPM1,
NPM2 and NPM3 in mammals (Figure 1). NPM family has a conserved N-terminal
oligomerization domain and acidic domains that are required for histone
chaperone activity. The C-terminal domain of NPM1 is essential for RNA binding
and nucleolar localization [5]. It is also reported that this domain interacts with
G-rich quadruplex forming DNA [6,7]. The N-terminal core domain contains two
nuclear export signals (NES), which are recognized by CRM1. NPM1 is mainly
localized in nucleolar, but it also shuttles between nucleus, nucleoplasm and
cytoplasm [8]. This shuttling is regulated by these two NES and a nuclear
localization signal (NLS), which is present between two acidic regions [9]. In
addition to NPM1/B23.1, two splicing variants have been identified namely B23.2
and B23.3. The last 25 C-terminal amino acids of NPM1/B23.1 are absent in
B23.2, whereas B23.3 lacks 29 amino acids of B23.1 at the C-terminal basic
amino acid rich region (Figure 1). NPM1 forms a pentamer and decamer through
N-terminal oligomerization domain [10,11]. Disruption of NPM1 oligomerization
causes nucleoplasmic localization [12,13], suggesting that oligomerization is

6
required for nucleolar localization.
At present, many studies have reported the multiple functions of NPM1. One
main feature of NPM1 is to function as histone chaperone. Previously, our
laboratory identified NPM1 as a major component of template activating factor-III,
which can stimulate adenovirus core DNA replication mediated by chromatin
remodeling activity [14]. In addition, we reported that NPM1 binds to core histones,
preferentially to histone H3, and acts as histone chaperone [15]. NPM1 also
shows a chaperone activity for linker histone H1 [16].
Importantly, NPM1 is involved in the multiple steps of ribosome biogenesis.
NPM1 is directly interacted with ribosomal protein L5, which is a known
chaperone for the 5S rRNA and transport L5 ribosome complexes from nuclear to
cytoplasm [17]. It has been reported that NPM1 has intrinsic ribonuclease activity
for maturing rRNA transcript [18,19]. Previous study by our laboratory
demonstrated that NPM1 is associated with the rRNA gene chromatin and
promotes the transcription of rRNA gene [20].
Furthermore, NPM1 is involved in the processes of DNA replication and
centrosome duplication. It was reported that NPM1 interacts with retinoblastoma
protein and synergistically stimulates DNA polymerase alpha activity [21]. NPM1
has been shown to associate with the unduplicated centrosome and dissociates
from it after phosphorylation on threonine 199 by CDK2 and cyclin E, which
enables the centrosome duplication [22]. During mitosis, phosphorylated NPM1
associates with the centrosome and contributes to correct spindle formation and

7
chromosome segregation [23].
NPM1 knockout mouse shows the aberrant organogenesis and die between
embryonic day E11.5 and E16.5 because of the severe anemia resulting from
defects in primitive haematopoiesis [24]. NPM1 inactivation leads to chromosome
amplification and genomic instability, which can induce the p53 dependent
cell-cycle arrest and apoptosis [24].
It is well known that NPM1 is involved in the tumorigenesis. The NPM1 gene
is mutated at C-terminal region in about 30% of acute myeloid leukemia, which
results in the aberrant cytoplasmic expression of NPM1 [25]. NPM1 gene locus is
frequently targeted in chromosome translocation associated with haematopoietic
tumors, which results in the expression of oncogenic fusion proteins [26-28].
NPM1 is highly expressed in various solid tumors such as gastric, colon, ovarian
and prostate, thus it has been proposed as a tumor marker [29].
NPM1 has been implicated in both growth promoting and growth
suppression pathways. It was found that ARF promotes ubiquitin-dependent
degradation of NPM1 and interferes rRNA processing mediated by NPM1 [30]. On
the other hand, NPM1 interacts with ARF in the nucleolus and inhibits the
association between ARF and MDM2, which results in the release of MDM2 and
proteasomal degradation of p53 [31]. In normal cells, ARF is not expressed and
MDM2 maintains low levels of p53, when oncogenic stimuli induce the expression
of ARF, which allowing the down-regulation of NPM1 and the releasing ARF into
the nucleoplasm. It leads to p53 activation and inhibition of cell growth. The

8
overexpression of NPM1 increases the nucleolar localization of ARF [31]. It is
suggested that the high expression level of NPM1 is linked to increased
proliferation by interfering the p53 activation by ARF. These observations suggest
that NPM1 functions as a proto-oncogene. In contrast, other studies reported that
NPM1 is directly interacted with MDM2 independently of ARF and protect p53
from proteasome degradation [32]. In this case, it is suggested that NPM1 acts as
a tumor suppressor gene.
NPM1 is involved in transcription processes through their interaction with
transcription factors. NPM1 reduces the transcription activity of YY1 and IRF1 by
binding to these proteins [33,34]. NPM1 and AP2γ form a complex and act as a
transcriptional repressor of ERα [35]. It was shown that during retinoic acid
induced cell differentiation, AP2α recruits NPM1 to the promoters of retinoic acid
responsive genes and NPM1 acts as a negative co-regulator for their expressions
through recruitment of histone deacetylases [36]. Meanwhile, NPM1 enhances
the gene expression of MnSOD by interacting with NFκB [37]. We recently
reported that NPM1 enhances the DNA binding ability of NFκB and positively
regulates the NFκB mediated transcription [38]. NPM1 directly interacts with
c-Myc and regulates the expression of c-Myc target genes at their promoter [39].
As described above, it has been revealed that NPM1 is involved in many
critical cellular processes. In this dissertation, I examined the function of NPM1 in
transcription regulation. I identified the genes regulated by NPM1 and examined
its regulation mechanism.

9
Figure 1. Schematic representations of the human NPM1 family proteins Human NPM1 family members, NPM1, NPM2, and NPM3, are represented. NPM family has a conserved N-terminal oligomerization domain and acidic domains.
NPM1 forms a pentamer and decamer through N-terminal oligomerization domain. Only NPM1 has the RNA binding domain at the C-terminal region. The N-terminal core domain contains two nuclear export signals (NES). Nuclear localization
signal (NLS) is present between two acidic regions. Two splicing variants of NPM1/B23.1 have been identified namely B23.2 and B23.3. The last 25 C-terminal amino acids of NPM1/B23.1 are absent in B23.2, whereas B23.3 lacks
29 amino acids of B23.1 at the C-terminal basic amino acid rich region.

10
Chapter 2: Selective regulation of the type II IFN-
inducible genes by NPM1/nucleophosmin
2-1. Abstract
NPM1/nucleophosmin is a multifunctional nucleolar protein. Here, I analyzed
the function of NPM1 in gene expression using previous our microarray data and
found a relationship between NPM1 and interferon (IFN)-γ-inducible genes. I
showed that NPM1 selectively regulates the expression of a subset of
IFN-γ-inducible genes and directly binds to two important transcription factors in
the type II IFN pathway: STAT1 and IRF1. Furthermore, NPM1 was found to
regulate the IFN-γ-inducible promoter activity of MHC class II transactivator
(CIITA) and mutation of the IRF1 binding site on the CIITA promoter abolished the
effect of NPM1. My results suggest a novel mechanism for IFN-γ-mediated gene
expression by NPM1.

11
2-2. Introduction
NPM1/nucleophosmin is a phosphoprotein that is mainly localized in the
nucleolus, although it constantly shuttles between the nucleolus, the nucleus, and
the cytoplasm [8]. Importantly, NPM1 is highly expressed in human solid
malignancies and has been implicated in tumorigenesis; genetic mutations of its
gene are frequently found in acute myeloid leukemia [25,40]. Therefore, it is
important to understand the functions of NPM1 in both normal and malignant cells.
NPM1 is a multifunctional protein, which is involved in the regulation of ribosome
biogenesis, DNA replication, apoptosis, centrosome duplication, and cell
proliferation [29,40]. We previously reported that NPM1 shows histone chaperone
activity in vitro and participates in the regulation of chromatin structure [15]. It has
been also shown that NPM1 interacts with transcription factors including c-Myc,
NFκB, YY1, AP-2γ, and IRF1, and is required for the regulation of their target
genes [33-35,38,39]. Consistent with these observations, our recent microarray
analysis demonstrated that NPM1 is involved in the regulation of various genes
[38]; however, the molecular mechanism by which NPM1 regulates the
expression of those genes is not well understood.
Interferons (IFNs) are cytokines that play important roles in antiviral and
anti-proliferative responses [41]. IFNs are classified into type I, II, and III based on
receptor specificity and sequence homology.
The main signaling pathway activated by IFNs is the Janus-activated kinase
(JAK) signal transducer and activator of transcription (STAT) pathway [41,42].

12
Type I and II IFNs bind the IFN-α receptor (IFNAR) and the IFN γ receptor
(IFNGR), respectively. The binding of type I IFNs to IFNAR results in the
autophosphorylation and activation of the receptor-associated JAK1 and tyrosine
kinase 2 (TYK2) pathways, which in turn regulates the tyrosine phosphorylation of
STAT1 and STAT2. Tyrosine-phosphorylated STAT1 and STAT2 heterodimers
translocate to the nucleus, where they assemble with IFN-regulatory factor 9
(IRF9) to form a complex called IFN-stimulated gene factor 3 (ISGF3). This
complex binds to specific elements, termed IFN stimulated response elements
(ISREs) that are present in the promoters of IFN-stimulated genes (ISGs) to
initiate transcription. The type III IFNs bind to a receptor complex composed of
interferon lambda receptor 1 (IFNLR1) and interleukin-10 receptor B (IL10RB),
and use the JAK-STAT signal transduction pathway similarly to type I IFNs [43].
In contrast, the only type II IFN, IFN-γ, binds to the IFN-γ receptor, followed
by JAK1- and JAK2-mediated phosphorylation of STAT1. Phosphorylated STAT1
homodimers, translocate to the nucleus, and bind to the DNA sequence termed
the IFN-γ activation site (GAS) to initiate transcription.
Interferon regulatory factor 1 (IRF1) is induced by both IFN-α/β and IFN-γ
and binds to the ISRE/IRF-E sequence on the target genes’ promoters. The major
histocompatibility complex (MHC) I and II genes, which are required for antigen
presentation, are induced by IRF1 on stimulation with IFN-γ [44]. The NOD-like
receptor family CARD domain containing 5 (NLRC5), and MHC class II
transactivator (CIITA) genes are also required for the expression of MHC I and

13
MHC II genes, respectively [45-47].
From the previous microarray data, I found that the expression of
IFN-γ-inducible genes is decreased by NPM1 knockdown. Interestingly, I
demonstrated that NPM1 binds directly to both STAT1 and IRF1, and participated
in the transcriptional regulation of a subset of IFN -γ-inducible genes. I propose a
novel mechanism for the type II IFN signaling pathway by NPM1.

14
2-3. Materials and methods
2-3-1. Plasmid construction
Plasmids pGEX2T-NPM1, pET14b-NPM1, pET14b-B23.2, pET14b-B23.3,
pET14b-NPM1ΔA, pET14b-NPM1ΔC, pET14-NPM1ΔN, pET14b-NPM1CR, and
pET14b-NPM1CR1.5 were described previously [48]. The STAT1 and IRF1 were
amplified by PCR using primer sets 5’- aaaggatccatgtctcagtggtacgaact-3’ and
5’-aaaggatccctatactgtgttcatcatac-3’, and 5’-agctggatccatgcccatcactcggatgcg-3’
and 5’-agcgaattctacggtgcacagggaatggcc-3’ with cDNA prepared from HeLa cells
as a template. The amplified cDNAs were subcloned into BamH I and EcoR I sites
of pcDNA3.1-Flag vector. To construct pCAGGS-Flag-IRF1, the IRF1 cDNA was
cut out from pcDNA3.1-Flag-IRF1 by Hind III and EcoR I, blunted by Klenow
Fragment (Toyobo), and subcloned into pCAGGS treated with Xho I and Klenow
fragment. To construct pGEX6P-1-IRF1, the IRF1 cDNA was cloned into BamH I
and EcoR I sites of pGEX6P-1 vector. The promoter IV sequence of the human
CIITA gene (CIITA-237) was amplified by PCR using a primer set 5’-
AAAAGATCTGGGGCCTGGGACTCTCCCCG-3’ and 5’-
AAAAAGCTTCCCGACCTTAGGGGTTACAG-3’ with genomic DNA extracted
from HeLa cells as a template. To construct a series of 5’ deletion mutants,
forward primers 5’- AAAAGATCTTTGGGATGCCACTTCTGATA-3’ for CIITA-154,
5’-AAAAGATCTCAGCGCTGCAGAAAGAAAGT-3’ for CIITA-82, or 5’-
AAAAGATCTGAAAAAGAACTGCGGGGAGG-3’ for CIITA-54 and the reverse
primer described above were used. The amplified DNA was subcloned into Bgl II

15
and Hind III sites of pGV-B vector. Site directed mutations at the IRF1 recognition
sequence and the GAS in pGV-B-CIITA-237 were introduced by primer sets 5’-
CTTTTTCTCGAGCACTGTCTTTCTGCAGCGCTGAGCTCG-3’ and 5’-
GCAGAAAGACAGTGCTCGAGAAAAAGAACTGCGGGGAGG-3’, and
5’-CACGTGCTTTAGAATTCGTGGCATCCCAACTGCCTGG-3’ and
5’-ATGCCACGAATTCTAAAGCACGTGGTGGCCACAGTAG-3’, respectively.
2-3-2. Cell culture, transfection and reagents
HeLa and 293T cells were maintained in Dulbecco’s modified Eagle’s medium
(Nacalai Tesque) supplemented with 10% heat-inactivated fetal bovine serum at
37oC with 5% CO2. The stable cell line of HeLa cells with pEGFP-Flag-NPM1 was
established previously [49] and maintained as described above.
Transient transfection of plasmid DNA and siRNAs were performed using
GeneJuice (Novagen) and Lipofectamine RNA iMAX (Life Technologies),
respectively, according to the manufacturer’s instructions. Stealth RNAs for
negative controls and human NPM1 were described previously [49]. Antibodies
used were NPM1 (Invitrogen), Flag-tag (M2, Sigma Aldrich), STAT1 (sc-346,
Santa Cruz), p-STAT1 (Y701) (D4A7, CST), IRF1 (ab26109, Abcam), and β-actin
(sc-47778, Santa Cruz). Recombinant human IFN-β and IFN-γ (PEPROTECH)
were commercially available.

16
2-3-3. Purification of recombinant proteins
For expression and purification of GST tagged proteins, BL21 (DE3) and BL21
(RIL) were transformed with pGEX2T-NPM1 and pGEX6P-1-IRF1, respectively.
The transformed E.coli was grown at 37oC until OD600 reached 0.4. Expression
of the recombinant proteins was induced by the addition of isopropyl
β-D-thiogalactopyranoside at 16oC for 16 h. Bacterial cell lysates expressing
GST-tagged proteins were sonicated in buffer A (50 mM Tris-HCl (pH 7.9), 0.1%
Triton X-100, and 1 mM phenylmethylsulfonyl fluoride (PMSF)) containing 100
mM NaCl. For purification of Flag-tagged STAT1, 293T cells transfected with
pcDNA3.1-Flag-STAT1 were suspended in buffer B (0.2% Triton X-100, 20 mM
Tris-HCl pH 7.9, 10 mM KCl, 1.5 mM MgCl2, 0.5 mM PMSF) containing 400 mM
NaCl on ice for 10 min and rotate at 4oC for 30 min followed by centrifuge at
21,500 x g, 4oC for 15 min. The supernatants were recovered and diluted with
twice volumes of buffer B without NaCl. The cell extracts were incubated with
anti-Flag M2 affinity gels (Sigma Aldrich) for 2 h at 4oC and then washed by buffer
A containing 300 mM NaCl. The proteins bound with the resin were eluted with
buffer A containing 150 mM NaCl and Flag peptide (Sigma Aldrich), and the
eluted proteins were dialyzed against buffer H (20 mM Hepes-NaOH pH7.9, 50
mM NaCl, 0.1 mM ethylenediaminetetraacetic acid (EDTA), 1 mM dithiothreitol
(DTT), 0.5 mM PMSF and 10% glycerol). Purification of His-tagged proteins were
described previously [48].

17
2-3-4. Immunoprecipitation and GST-pull down assays
Flag-IRF1 was transiently expressed in 293T cells. The cells were treated with or
without IFN-γ for 6 h, collected, and sonicated in buffer A containing 100 mM NaCl.
The cell lysates were incubated with anti-Flag M2 affinity gels (Sigma Aldrich) in
buffer A containing 100 mM NaCl. The resins were washed extensively with the
same buffer. The proteins bound with the resin were eluted with buffer A
containing 100 mM NaCl and Flag peptide (Sigma Aldrich), separated by sodium
dodecyl sulphate-polyacrylamide gel electrophoresis (SDS-PAGE) and analyzed
by western blotting. For immunoprecipitation of STAT1, HeLa cells were treated
without or with IFN-γ for 1 h and the cell lysates were prepared. The extracts were
subjected to immunoprecipitation with control IgG or anti-STAT1 antibody, and
immunoprecipitated proteins were separated by SDS-PAGE and detected by
western blotting. For GST-pull down assays, glutathione sepharose beads
immobilized GST, GST-NPM1 or GST-IRF1 were mixed with Flag-STAT1,
His-NPM1 or its deletion mutants, and incubated at 4oC for 1 h followed by
extensive washing with buffer A containing 100 mM NaCl. Proteins were eluted
from the beads by an SDS sample buffer, separated by SDS-PAGE, and
visualized by CBB staining or western blotting.
2-3-5. Reporter assay
HeLa cells (4x10⁴ per well) transfected with control or NPM1 siRNA were seeded
in 24-well plates and transfected with 125 ng of pGV-B-CIITA, pGAS-TA-Luc
(Clontech), or pISRE-TA-Luc (Clontech) (Firefly luciferase) and 125 ng of pTA-RL

18
(Renilla luciferase) 24 h after siRNA transfection. Twenty-four hours after plasmid
DNA transfection, cells were treated with IFN-γ (20 ng/ml) for 24 h. For
pISRE-TA-Luc reporter, cells were treated with IFN-β (1000 IU/ml) for 3h.
Luciferase assay was performed using Renilla Luciferase Assay System kit
(Promega Corporation, USA) according to the manufacturer’s instructions.
2-3-6. RT-qPCR
HeLa cells were transfected with siRNA for NPM1 or negative control for 48 h and
IFN-γ (20 ng/ml) was added and further incubated for 24 h. Total RNA was
extracted using RNeasy Kit (Qiagen) according to the manufacturer’s instructions.
cDNA was prepared from purified RNA (1 µg) by using ReverTraAce (Toyobo)
with oligo dT primer. Real-time PCR was carried out in triplicate with SYBR Green
Real time PCR Master Mix-Plus (Toyobo) in the Thermal Cycler Dice Real-Time
PCR system (TaKaRa). Primer sets for RT-PCR are listed in table, 2-7.
2-3-7. Immunofluorescence
The cells on cover slips were fixed with 3% paraformardehyde in PBS,
permeabilized in a buffer (300 mM sucrose, 3 mM MgCl2 in PBS) containing 0.5%
Triton X-100, and incubated in PBS containing milk and 0.1% Triton X-100. The
fixed and permeabilized cells were incubated with anti-STAT1 or IRF1 antibodies
diluted with PBS containing 0.5% non-fat dry milk. The cells on coverslips were
washed with PBS containing 0.1% Triton X-100 (PBST), incubated with
secondary antibodies conjugating with AlexaFluor dyes (Molecular Probes),
washed extensively with PBST, and incubated with TO-PRO-3 (Invitrogen). All

19
fluorescence images were captured by a confocal microscopy (LSM 5 Exciter,
Carl Zeiss).

20
2-4. Results
2-4-1. NPM1 regulates the transcription of IFN-γ-induced genes
Previously, my laboratory performed a comprehensive microarray analysis
of the effect of NPM1 knockdown on gene expression in HeLa cells [38], where
539 genes were found to be downregulated (<0.669-fold). Gene ontology analysis
of these genes showed functional enrichment in immune responses including
antigen processing and presentation via MHC class I (Figure 2-1A). I also noticed
that the immune response genes decreased by NPM1 knockdown are induced by
IFN-γ; therefore, I questioned whether NPM1 is involved in the type II IFN
signaling pathway. I first focused on the genes encoding the class I and II antigen
presentation machinery. To confirm the microarray results, RT-qPCR was
performed using HeLa cells treated with control or NPM1 siRNA and IFN-γ
(Figures 2-1B and C). NPM1 was efficiently reduced by NPM1 siRNA treatment
(Figure 2-1B). The expression of the human MHC class I gene, HLAB, was
detected at a low level and that of the MHC class II genes, HLADR and HLADQ,
was not detected under nonstimulated conditions. The expression of both MHC
class I and II genes was greatly increased upon IFN-γ treatment. Interestingly, I
demonstrated that the expression of these MHC genes decreased by NPM1
knockdown, suggesting that NPM1 is involved in the type II IFN signaling pathway.
To gain insight into the function of NPM1 in the type II IFN signaling pathway, I
next focused on the transcription regulators of IFN-γ induced transcription (Figure
2-1D). It is well-established that STAT1 is a master regulator of the type II IFN

21
signaling pathway and activated-STAT1 induces downstream genes such as IRF1,
CIITA, NLRC5, and STAT1 itself by binding to the consensus sequence (GAS) in
their promoters [42,44,50]. These transcription factors induced by STAT1 are
required for the IFN-γ-induced expression of the MHC genes. Under
nonstimulated conditions, the expression of CIITA was not detected, indicating
that CIITA is required for the expression of the MHC II genes in HeLa cells. The
expression levels of STAT1, IRF1, CIITA, and NLRC5 were increased by IFN-γ
treatment and those of STAT1, IRF1, and CIITA, but not NLRC5, were
significantly reduced by NPM1 knockdown. These results raised the possibility
that NPM1 is selectively involved in the regulation of a subset of STAT1 target
genes. I also examined whether NPM1 knockdown decreases the protein levels of
STAT1 and IRF1 by quantitative western blotting (Figure 2-1E) using the level of
actin as a loading control. Consistent with the RT-qPCR results, the expression of
the STAT1 protein in NPM1 knockdown cells was lower than that in control cells
6-24 h after IFN-γ treatment. However, the levels of IRF1 in control and NPM1
siRNA treated cells were similarly increased after IFN-γ treatment.
To examine the function of NPM1 in the type II IFN signaling pathway, I next
examined the localization of NPM1 in cells treated with IFN-γ using HeLa cells
stably expressing EGFP-tagged NPM1. NPM1 mainly localizes to the nucleoli in
control cells and shuttles between the nucleoplasm and the nucleoli. On IFN-γ
treatment, NPM1 localization was not clearly changed, while STAT1 and IRF1
were clearly accumulated in the nuclei (Figure 2-2A). I also examined the
22
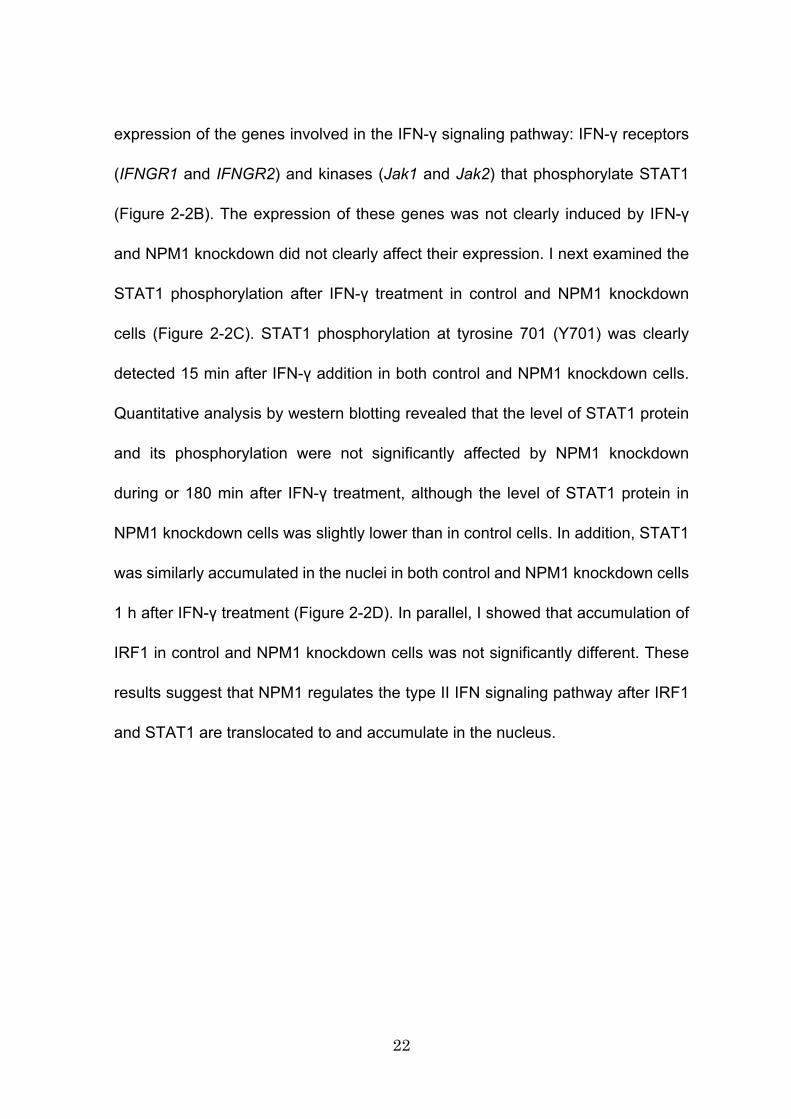
expression of the genes involved in the IFN-γ signaling pathway: IFN-γ receptors
(IFNGR1 and IFNGR2) and kinases (Jak1 and Jak2) that phosphorylate STAT1
(Figure 2-2B). The expression of these genes was not clearly induced by IFN-γ
and NPM1 knockdown did not clearly affect their expression. I next examined the
STAT1 phosphorylation after IFN-γ treatment in control and NPM1 knockdown
cells (Figure 2-2C). STAT1 phosphorylation at tyrosine 701 (Y701) was clearly
detected 15 min after IFN-γ addition in both control and NPM1 knockdown cells.
Quantitative analysis by western blotting revealed that the level of STAT1 protein
and its phosphorylation were not significantly affected by NPM1 knockdown
during or 180 min after IFN-γ treatment, although the level of STAT1 protein in
NPM1 knockdown cells was slightly lower than in control cells. In addition, STAT1
was similarly accumulated in the nuclei in both control and NPM1 knockdown cells
1 h after IFN-γ treatment (Figure 2-2D). In parallel, I showed that accumulation of
IRF1 in control and NPM1 knockdown cells was not significantly different. These
results suggest that NPM1 regulates the type II IFN signaling pathway after IRF1
and STAT1 are translocated to and accumulate in the nucleus.

23
2-4-2. NPM1 affects STAT1-mediated transcription
Because NPM1 depletion decreased the IFN-γ induced expression of
STAT1 (see Figure 2-1E), it is likely that NPM1 affects both the type I and II
interferon signaling pathways. To address this point, I performed reporter assays
using pGAS-TA-luc and pISRE-TA-luc reporter plasmids (Figures 2-3A and B),
which contains the binding sites of STAT1 homodimer (gamma associated site,
GAS) and ISGF3 (IFN-stimulated response element, ISRE), respectively. I
observed IFN-γ-induced expression of the reporter gene, but not IFN-β-induced
expression, was significantly reduced by NPM1 knockdown. These results
suggest that NPM1 is involved in the regulation of the type II IFN signaling
pathway, and that the decreased type II IFN induced gene expression by NPM1 is
not simply explained by decreased STAT1 expression.
To clarify the mechanism by which NPM1 regulates STAT1-medicated
transcription, I examined the endogenous interaction between NPM1 and STAT1
by co-immunoprecipitation with anti-STAT1 antibodies in HeLa cells treated with
or without IFN-γ (Figure 2-3C). Endogenous NPM1 was co-immunoprecipitated
with STAT1 independent of IFN-γ treatment. To test whether NPM1 directly
interacts with STAT1, I prepared recombinant proteins of GST, GST-tagged
NPM1, and Flag-tagged STAT1 (Figure 2-3D), and GST-pull down assays were
performed (Figure 2-3E). Flag-tagged STAT1 precipitated with GST-tagged
NPM1, but not with GST, indicating that NPM1 directly associates with STAT1.
These results suggest that NPM1 is involved in the type II IFN pathway by direct

24
interaction with STAT1.
2-4-3. NPM1 regulates the CIITA gene expression
Next, I examined whether NPM1 regulates the promoter activity of STAT1
target genes. To this end, I chose the promoter activity of the CIITA gene,
because its expression is absolutely dependent on IFN-γ and is significantly
decreased by NPM1 knockdown in HeLa cells (see Figure 2-1). The expression of
the CIITA gene is controlled by four different promoters; pI, pII, pIII and pIV [51].
CIITA pI and pIII are active in cells of myeloid and lymphoid origins, respectively,
while the significance of CIITA pII remains unknown [52]. CIITA pIV is induced by
IFN-γ in most cell types; therefore I focused on this promoter element. The
proximal promoter region of pIV contains multiple cis-acting elements recognized
by transcription factors such as NFκB, NF-GMa, STAT1 (GAS), USF1 (E box),
and IRF1 [53]. To examine the effect of NPM1 on the promoter activity of CIITA
pIV upon IFN-γ treatment, I prepared the proximal promoter of human CIITA pIV
with a series of 5’ deletion mutants and performed reporter assays (Figure 2-4A).
Consistent with the decreased expression of endogenous CIITA in NPM1
knockdown cells, the reporter activity of the pGV-B-CIITA-237 construct, which
contains 237 base pairs (bp) upstream and 115 bp downstream of the
transcription start site (+1) of the CIITA gene was significantly decreased by
NPM1 knockdown. The reporter activity of the NFκB binding element deletion
construct (pGV-B-CIITA-154) was similar to that of the full-length construct and
was decreased by NPM1 depletion, suggesting that NFκB is not involved in the

25
regulation of the CIITA gene under the assay condition employed here. Further
deletion of three elements, the NF-GMa binding site, GAS, and the E box (pGV-B-
CIITA-82), partially reduced IFN-γ-induced reporter gene expression, and its
reporter activity induced by IFN-γ was decreased by NPM1 knockdown.
Conversely, the deletion construct pGV-B-CIITA-54 abolished IFN-γ-induced
expression of the reporter gene, and the reporter activity of this construct was not
affected by NPM1 knockdown.
To further confirm the result of the CIITA promoter analysis by NPM1
knockdown, I generated constructs with site-specific mutations either in the GAS
or IRF1 binding sequences. In accordance with the results of the GAS element
deletion construct (pGVB CIITA-82), the mutation of GAS slightly decreased the
IFN-γ induction and IFN-γ-induced expression of this construct was decreased by
NPM1 knockdown (Figure 2-4B). When the CIITA promoter contained mutations
at the IRF1 binding site, the IFN-γ induced reporter activity was abolished but also
not affected by NPM1 knockdown (Figure 2-4C). These results suggest that
NPM1 regulates the IFN-γ induced stimulation of CIITA pIV via IRF1, although I
could not completely exclude the possibility that NPM1 regulates STAT1 binding
to the CIITA pIV.

26
2-4-4. NPM1 binds to IRF1 through the oligomerization domain
Previous study has shown that NPM1 interacts with IRF1 through its
multifunctional domain 2 in vitro [54]. To confirm this interaction, Flag tagged IRF1
was expressed in 293T cells and an immunoprecipitation assay performed (Figure
2-5A). 293T cells were used here to obtain sufficient amounts of Flag-IRF1 for
immunoprecipitation. I found that Flag-tagged IRF1 binds to endogenous NPM1 in
the absence or presence of INF-γ treatment. To determine the IRF1 binding
region of NPM1, GST-pull down assays are carried out with a series of NPM1
deletion mutant proteins (Figure 2-5B). The two splicing variants of NPM1/B23.1,
namely B23.2 and B23.3, which lack the C-terminal RNA binding domain and the
basic region, respectively, interacted with IRF1 (Figure 2-5C), This indicates that
the C-terminal domain and the basic region are dispensable for the interaction.
These two highly acidic regions are known requirements for efficient histone
binding and nucleosome assembly [14]. The deletion of these acidic regions did
not affect the interaction with IRF1 (Figure 5D, lanes 7–8). Further analyses
showed that the C-terminal half of the protein (amino acid 121–294) was
dispensable for IRF1 binding and the N-terminal oligomerization domain (amino
acid 1–120) was sufficient to interact with IRF1.

27
2-5. Discussion
In this study, I demonstrated that NPM1 regulates a subset of
IFN-γ-inducible genes such as the MHC class I and II genes (Figure 2-1C). The
effect of NPM1 knockdown is likely due to the decreased expression of the
transcription regulators, STAT1, IRF1, and CIITA (Figure 2-1D), all of which are
induced by IFN-γ. The STAT1 protein level induced by IFN-γ treatment was also
decreased by NPM1 knockdown (Figure 2-1E), suggesting that the regulation of
the STAT1 expression level is a primary function of NPM1 in the type II IFN
signaling pathway. Given that NPM1 did not affect the phosphorylation of STAT1
at tyrosine 701 or the nuclear accumulation of STAT1 and IRF1 (Figure 2-2B and
2-2C), it is suggested that NPM1 regulates the type II IFN signaling pathway after
the nuclear accumulation of STAT1 and IRF1. Although I demonstrated that
NPM1 directly binds to STAT1 and regulates the expression of a reporter gene
containing GAS (Figure 2-3A, C, and E), NPM1 failed to regulate the STAT1
target gene NLRC5. These results suggest that NPM1 confers a preferential
binding sequence of STAT1. Sequence variation in GAS or the sequences
adjacent to GAS may affect the sequence preference of the STAT1-NPM1
complex.
In HeLa cells, the expression of the MHC class II gene and its regulator
CIITA was not detected by RT-PCR. This supports the previous finding that CIITA
is an essential transcription regulator of the MHC class II genes, but not the MHC
class I genes. My results imply that NPM1 regulates the expression of the MHC

28
class II genes via decreased expression of the CIITA gene. Although the CIITA
pIV promoter contains STAT1 binding sites, NPM1 knockdown decreased the
activity of the CIITA pIV even in the absence of STAT1 binding sites (Figure 2-4A
and B). It was previously demonstrated that the binding of STAT1 to CIITA pIV
depends on the transcription factor USF1, which binds to the E box on CIITA pIV
[53]. This local environment of GAS on CIITA pIV may be why NPM1 does not
affect STAT1 binding. Thus, it is likely that NPM1 regulates the function of IRF1 in
IFN-γ-induced expression of CIITA. However, STAT1 did not stimulate CIITA pIV
activity when the IRF1 binding site was mutated; therefore, I could not exclude the
possibility that NPM1 regulates the CIITA pIV via interaction with both STAT1 and
IRF1.
Consistent with previous studies [34,54], I found that NPM1 shows potential
association with IRF1 (Figure 2-5). Although a previous study reported that NPM1
inhibits the DNA binding of IRF1 [34], my results suggest that NPM1 positively
regulates IRF1 function. Further study is required to address this discrepancy and
to clarify the molecular mechanism by which NPM1 regulates the IRF1 function.
Although the effect of NPM1 knockdown on the expression of the reporter
gene containing ISRE induced by IFN-β was not clearly observed (Figure 2-3B), I
cannot exclude the possibility that NPM1 regulates the type I IFN-inducible genes
that contain different ISRE sequences or ISRE adjacent to cis-regulatory
elements. It is possible that NPM1 associates with and regulates the function of
ISGF3 through its STAT1 binding activity.

29
Here, I demonstrated that NPM1, an oncogenic nucleolar protein, is involved
in the regulation of the type II IFN signaling pathway. INF-γ is a well -established
proinflammatory cytokine that plays critical roles in both the acquired and innate
immune systems, host defense, and in tumor surveillance [42]. It also plays a role
in enhancing the inflammatory responses in damaged sites and tumor
microenvironments. My coworker previously demonstrated that NPM1 regulates
the TNF-α inflammatory response by enhancing the DNA binding activity of NFκB
[38]. These results suggest a key regulatory role of NPM1 in inflammation and
various diseases including cancer caused and/or enhanced by inflammation
(Figure 2-6).

30
2-6. Figures and legends
Figure 2-1. NPM1 regulates the transcription of IFN-γ-induced genes. (A) Gene ontology analysis of the gene set decreased by NPM1 knockdown. The
gene ontology analysis was performed using the 539 downregulated genes and the list of the enriched functions was shown. The previous microarray data (NCBI Gene Expression Omnibus (GEO) under accession number GSE81785)
was used. (B) Knockdown of NPM1 by siRNA. Expression of NPM1 in HeLa cells treated with control or NPM1 siRNA were examined by western blotting using anti-NPM1 antibody. Actin was used as a loading control. (C and D) RT-qPCR
analyses. Please see next page.

31
Figure 2-1. NPM1 regulates the transcription of IFN-γ induced genes. (C and D) RT-qPCR analyses. RNA was extracted from control or NPM1 knockdown HeLa cells treated without or with IFN-γ (20 ng/ml) for 24 h as indicated at the bottom of the graphs and RT-qPCR was performed using
gene-specific primers. White and black bars indicate the results from control and NPM1 siRNA, respectively. Relative mRNA levels were normalized by the expression level of GAPDH. Three independent experiments were performed and
error bars indicate ±SD. The results were statistically analyzed by t-test and ***, **, and * represent P < 0.001, 0.01 and 0.05, respectively. (E) Effect of NPM1 knockdown on the expression level of STAT1 and IRF1. HeLa cells were treated
with control or NPM1 siRNA for 72 h and IFN-γ (20 ng/ml) was added and further incubated for 6, 12, and 24 h. The expression levels of STAT1, IRF1, NPM1, and β-actin were examined by western blotting. The band intensities of STAT1, IRF1,
and β-actin were measured and those of STAT1 and IRF1 were normalized by the intensity of β-actin. Three independent experiments were performed and error bars indicate ±SD.

32
Figure 2-2. NPM1 does not affect the early steps of IFN-γ signaling pathway.
(A) Localization of NPM1 after IFN-γ treatment. HeLa cells stably expressing EGFP-NPM1 were treated without or with IFN-γ (20 ng/ml) for 6 h , followed by immunofluorescence analysis with anti-STAT1 (left panels) or anti-IRF1 (right
panels) antibody. The localization of the proteins was observed by a confocal microscope. (B) Expression of JAKs and IFNGRs genes by RT-qPCR. RNA was extracted from control or NPM1 knockdown HeLa cells treated without or with
IFN-γ (20 ng/ml) for 24 h and RT-qPCR was performed using gene-specific primers. White bar and black bar indicate the results from control siRNA and NPM1 siRNA, respectively. Relative mRNA levels were normalized to GAPDH.
Three independent experiments were performed and error bars indicate ±SD.

33
Figure 2-2. NPM1 does not affect the early steps of IFN-γ signaling pathway. (C) The level of STAT1 Y701 phosphorylation. The cell extracts prepared from HeLa cells treated with control or NPM1 siRNA after IFN-γ (20 ng/ml) treatment
were separated by SDS-PAGE and analyzed by western blotting with anti-STAT1 phosphorylated at tyrosine 701 (p-STAT1), -STAT1, -NPM1, and -β-actin antibodies. Time (min) after IFN-γ treatment was shown at the top of the panel.
The band intensities of STAT1 and STAT1 (p-Y701) were normalized by that of β-actin and relative intensities were graphically shown in right panel. Three independent experiments were performed and error bars indicate ±SD.

34
Figure 2-2. NPM1 does not affect the early steps of IFN-γ signaling pathway. (D) Localization of STAT1 and IRF1 in NPM1 knockdown cells. HeLa cells were treated with control or NPM1 siRNA and stimulated by IFN-γ for the indicated time periods. STAT1 or IRF1 was visualized by immunofluorescence staining using
anti-STAT1 and -IRF1 antibodies, respectively. DNA was stained with TO-PRO-3. Localizations were observed by a confocal microscopy.

35
Figure 2-3. NPM1 regulates the IFN-γ induced, but not IFN-β induced transcription through direct interaction with STAT1. (A and B) Luciferase assays with GAS-Luc and ISRE-Luc reporters. HeLa cells treated with control or NPM1 siRNA were transfected with pGAS-TA-Luc (A) or pISRE-TA-Luc (B) with pTA-Renilla Luc vectors. Twenty four hours post
transfection, the cells were stimulated without or with IFN-γ (20 ng/ml) (A) for 24 h or IFN-β (1000 IU/ml) (B) for 3 h and subjected to luciferase reporter assay. Luciferase activity of each sample was normalized to Renilla luciferase activity to
calculate relative luciferase activity. Three independent experiments were performed and error bars indicate ±SD. The results were statistically analyzed by t-test, and ** and * represent P < 0.01 and 0.05, respectively.

36
Figure 2-3. NPM1 regulates the IFN-γ induced, but not IFN-β induced transcription through direct interaction with STAT1. (C) Immunoprecipitation analysis of STAT1. Cell extracts were prepared from HeLa cells treated without or with IFN-γ (20 ng/ml) for 1 h, and the interaction between NPM1 and STAT1 was analyzed by immunoprecipitation with control IgG
or anti-STAT1 antibody. The input (lanes 1 and 2) and immunoprecipitated (lanes 3–6) proteins were separated by SDS-PAGE and analyzed by western blotting with anti-NPM1, -STAT1, and -p-STAT1 antibodies. (D) Purified recombinant
proteins. Recombinant GST, GST- tagged NPM1 and Flag- tagged STAT1 proteins were separated by SDS-PAGE and visualized with CBB staining. Lane M is a molecular size marker. (E) GST-pull down assay. GST or GST-tagged NPM1
(lanes 2 and 3, 1 µ g) was mixed and incubated with purified Flag-STAT1. The protein bound to GST proteins were examined by western blotting with anti-Flag antibody and the GST proteins were visualized by CBB staining.

37
Figure 2-4. NPM1 regulates the transcription of CIITA gene through the IRF1 binding element. (A) Luciferase assay with the CIITA promoter IV. The proximal cis-acting elements (CIITA -237, 237 bp upstream and 115 bp downstream of transcription start site (+1)) of the CIITA promoter IV was cloned and used for reporter assay.
5’-deletion mutants, CIITA -154, -82, and -54 were also constructed and examined the luciferase activity. HeLa cells treated with control or NPM1 siRNA were transfected with pGV-B-CIITA plasmids with pTA-RL vectors. Twenty four
hours post-transfection, the cells were stimulated without or with IFN-γ (20 ng/ml) for 24 h and subjected to luciferase reporter assay. Luciferase activity of each sample was normalized by Renilla luciferase activity and the activity of HeLa cells
treated with control siRNA and without IFN-γ was set as 1.0 and the relative reporter activity was calculated. Three independent experiments were performed and error bars indicate ±SD. The results were statistically analyzed by t-test,
and ** and * represent P < 0.01 and 0.05, respectively.

38
Figure 2-4. NPM1 regulates the transcription of CIITA gene through the IRF1 binding element. (B and C) Luciferase assay with the reporter plasmids containing mutations at GAS (B) and IRF1 binding site (C) in the CIITA promoter IV. Experiments and data calculation were performed as in (A).

39
Figure 2-5. NPM1 directly interacts with IRF1 through the oligomerization domain. (A) Immunoprecipitation assay. Cell extracts were prepared from 293T cells expressing Flag-tagged IRF1 treated without or with IFN-γ (20 ng/ml) for 6 h, and immunoprecipitation was performed with anti-Flag M2 beads. Input (lanes 1 to 4)
and immunoprecipitated proteins (lanes 5 to 8) were separated by SDS-PAGE and subjected to western blotting with anti-Flag and -NPM1 antibodies. (B) Diagram of the splicing variants and truncated mutants of NPM1. Black, light gray
and dark gray boxes indicate oligomerization domain, acidic regions and the C-terminal globular domain, respectively. (C and D) GST-pull down assay. (Please see next page.)

40
Figure 2-5. NPM1 directly interacts with IRF1 through the oligomerization domain. (C and D) GST-pull down assay. GST or GST-tagged IRF1 (1 µg/sample) immobilized on glutathione sepharose beads were incubated with His-tagged NPM1/B23 proteins (1 µg/sample). The beads were extensively
washed and the bound proteins were separated by SDS-PAGE and visualized by CBB staining. The positions of the His-tagged proteins co-precipitated with GST-tagged IRF1 are indicated at the left side of each lane.

41
Figure 2-6. A key regulatory role of NPM1 in inflammation and cancer development. NPM1 is involved in the regulation of the IFN-γ signaling pathway through STAT1
and IRF1. INF-γ is a well-established proinflammatory cytokine that plays critical roles in both the acquired and innate immune systems, host defense, and in tumor surveillance. On the other hand, if its activity is excessive, it can enhance the
inflammatory responses in damaged sites and tumor microenvironments by releasing proinflammatory cytokines. NPM1 also regulates the TNFα inflammatory response by regulating the NFκB pathway. These results suggest a
key regulatory role of NPM1 in cancer caused and/or enhanced by inflammation.

42
2-7. Table for primers Primers used for RT-PCR Primers Sequences
HLAB-F GCGGCTACTACAACCAGAGC
HLAB-R GATGTAATCCTTGCCGTCGT
HLADR-F GAGTTTGATGCTCCAAGCCCTCTCCCA
HLADR-R CAGAGGCCCCCTGCGTTCTGCTGCATT
HLADQ-F GGGCTGACTGAAACTATGGC
HLADQ-R AGGGTGGGAACACAAGGAAG
STAT1-F CCATCCTTTGGTACAACATGC
STAT1-R TGCACATGGTGGAGTCAGG
IRF1-F GAACTCCCTGCCAGATATCGAG
IRF1-R TGCTCTTAGCATCTCGGCTGGA
CIITA-F CTGAAGGATGTGGAAGACCTGGGAAAGC
CIITA-R GTCCCCGATCTTGTTCTCACTC
NLRC5-F CTGGCCAGTCTCACCGCACAA
NLRC5-R CCAGGGGACAGCCATCAAAATC
JAK1-F AAATCGCACCATCACCGTTG
JAK1-R ATTGTCGTTGGTTCCATGCC
JAK2-F AGTGGCGGCATGATTTTGTG
JAK2-R TCTAACACTGCCATCCCAAGAC
IFNGR1-F TTTCTCCTACCCCTTGTCATGC
IFNGR1-R TTAGTTGGTGTAGGCACTGAGG
IFNGR2-F AAGATTCGCCTGTACAACGC
IFNGR2-R GCCGTGAACCATTTACTGTCG
GAPDH-F CCACATCGCTCAGACACCAT
GAPDH-R GCGCCCAATACGACCAAA

43
Chapter 3: Characterization of linker histone H1 variants
3-1. Introduction
In eukaryotes, DNA is wrapped around histones consisting of two copies
each of histones H2A, H2B, H3, and H4, and forms the nucleosome, which is the
fundamental unit of chromatin. The fifth histone is linker histone H1 that binds to
linker DNA region [55]. The structure, composed of DNA, core histone octamer
and linker histone H1, is called a chromatosome [56], which contributes to the
formation of a higher order chromatin structure. There are eleven H1 variants in
mammalian cells [57]. Each of the eleven H1 variant genes exists in a single copy
gene. The H1 variants, H1.1, H1.2, H1.3, H1.4, and H1.5, are synthesized during
the S phase, whereas H1.0 and H1.X are synthesized independently of S phase.
These seven H1 variants are expressed in somatic cells. On the other hand, the
other four H1 variants, H1t, H1T2, HILS1 and H1oo, are expressed in germ cells.
The linker histone H1 is constructed by three domain structures, which are
short N-terminal domain, central globular domain, and long C-terminal domain.
The short N-terminal domain of about 45 amino acids is enriched in basic amino
acids. The central domain is conserved among H1 variants and has a globular
conformation. The long C-terminal domain of about 100 amino acids is highly
enriched in lysine, serine, and proline.
Several studies suggested the specific functions for H1 variants. For
example, it was shown that the ability to compact nucleosome was different
among H1 variants in vitro, and H1 variants have distinct chromatin binding

44
affinities [58-60]. In addition, H1.X was detected in the nucleolus, which is
different from the patterns of localization of other H1 variants [61]. It was shown
that H1 variants are differentially expressed and incorporated in chromatin upon
differentiation of human ES cells or reprograming of adult somatic cells to
pluripotency [62]. Microarray analysis using human breast cancer cells showed
that the expression of a different subset of genes was affected in individual H1
variant knockdown [63]. A specific role for regulating the gene expression
mediated of particular H1 variant has been reported. Mouse H1b (the homologues
of human H1.5) and MsX1 bind to a key regulatory element of MyoD, a central
regulator of skeletal muscle differentiation, and repress the expression of MyoD
gene, which results in the inhibition of muscle differentiation [64]. Furthermore,
distribution patterns of linker histones have been reported to be different [65]. For
example, H1.0 is enriched at 5S rRNA genes and telomeric satellites, whereas
H1.X is enriched in actively transcribed genes. These studies raised a possibility
that H1 variants have distinct functions. However, the detailed functional
differences among H1 variants and their action mechanism remain unknown.
In this study, to understand the distinct function of seven somatic H1 variants,
I examined their cellular behaviors by FRAP assay. Interestingly, I found that their
cellular mobility is different and classified into three groups, those with fast (H1.X),
intermediate (H1.1 and H1.2), and slow group (H1.3, H1.4, H1.5, and H1.0). To
reveal the mechanism by which H1 variants show different cellular behaviors, I
biochemically examined their intrinsic DNA, nucleosome, and histone chaperone

45
binding activity of H1 variants in vitro. I demonstrated that the DNA, nucleosome,
and histone chaperone binding activity of H1.X are lower than those of H1.1 and
H1.0 in vitro. It is suggested that those distinct binding activity of H1 variants
generate the differential patterns of chromatin structure and gene expression.

46
3-2. Materials and Methods
3-2-1. Plasmid construction
To construct pGEX6P-1-H1.0, pEGEX6P-1-H1.1, pEGEX6P -H1.X, pEGEX6P
-H1.2, pEGEX6P -H1.3, pEGEX6P -H1.4, and pEGEX6P -H1.5, cDNAs were
amplified from the genomic DNA extracted from HeLa cells by PCR with primer
sets, H1.0-F and H1.0-R, H1.1-F and H1.1-R, and H1.X-F and H1.X-R, H1.2-F
and H1.2-R, H1.3-F and H1.3-R, H1.4-F and H1.4-R, H1.5-F and H1.5-R,
respectively. Amplified DNAs were digested with BamH1 and ligated into a BamH
I-digested pEGFPC1 vector (Clontech). Primer sets for cloning of linker histones
are listed in table, 3-6. The plasmids, pGEX6P-1-H1.0, pEGEX6P-1-H1.1,
pEGEX6P -H1.X, pEGEX6P -H1.2, pEGEX6P -H1.3, pEGEX6P -H1.4, and
pEGEX6P -H1.5 are digested by Bam HI and ligated into Bam HI digested
pGEX6P, respectively. Plasmids pET-14b-NPM1, pET14b-TAF-Iβ,
pET14b-sNASP, pET14b-NAP1L1, pET14b-NAP1L4, pcDNA3.1-sNASP,
pcDNA3-H1.X-Flag, pET14b-H1.0, pET14b-H1.1, and pET14b-H1.X were
described previously [14,66,67].
Four human core histone cDNAs cloned in pET22b vector were transferred to
pET14b vector (Novagen) with appropriate restriction enzymes and generated
pET14b-H2A, pET14b-H2B, pET14b-H3, and pET14b-H4.
3-2-2. Cell culture, transfection and reagents
HeLa and HEK293T were maintained in Dulbecco’s modified Eagle’s medium
(Nacalai Tesque) supplemented with 10% fetal bovine serum and

47
penicillin-streptomycin solution (Nacalai Tesque). Cell lines, HeLa H1.0-Flag,
HeLa H1.1-Flag, and HeLa H1.X-Flag were established as described previously
[66]. Transient transfection of plasmid DNA was performed using Gene Juice
(Novagen) according to the manufacturer’s instruction. To establish stable cell
lines, HeLa cells were transfected with pGEX6P-1-H1.0, pEGEX6P-1-H1.1,
pEGEX6P -H1.X, pEGEX6P -H1.2, pEGEX6P -H1.3, pEGEX6P -H1.4, and
pEGEX6P -H1.5. Neomycin-resistant cells were selected by G418.
3-2-3. Purification of recombinant proteins
To express and purify the recombinant proteins, BL21 (DE3)-RP (Novagen) was
transformed with pGEX6P-1-H1.0, pEGEX6P-1-H1.1, pEGEX6P -H1.X,
pEGEX6P -H1.2, pEGEX6P -H1.3, pEGEX6P -H1.4, pEGEX6P -H1.5, pET,
pET-14b-NPM1, pET14b-TAF-Iβ, pET14b-sNASP, pET14b-NAP1L1,
pET14b-NAP1L4, pET14b-H1.0, pET14b-H1.1, and pET14b-H1.X. The
transformed E.coli were grown at 37oC until OD600 reached 0.4. Expression of the
recombinant proteins was incuduced by addition of 0.1 mM isopropyl
β-D-thiogalactopyranoside at 30oC for 3 hours. Bacterial cell lysates were
sonicated in buffer A (50 mM Tris-HCl (pH 7.9), 0.1% Triton X-100, and 1 mM
phenylmethylsulfonyl fluoride (PMSF)) containing 100 mM NaCl for GST-tagged
proteins or in His-binding buffer (50 mM Na2HPO4, 50 mM NaH2PO4, 10 mM
Imidazole) containing 300 mM NaCl for His-tagged proteins. His-tagged proteins
were purified with HIS-Select Nickel affinity gel according to the manufacturer’s
instruction (Sigma-Aldrich). Purified proteins were dialyzed against buffer H (20

48
mM HePes-NaOH (pH8.0), 50 mM NaCl, 0.1 mM EDTA, 10% (v/v) glycerol, 1 mM
DTT, 0.5 mM PMSF) or H1 buffer for H1 proteins (20 mM, Tris-HCl (pH7.9), 200
mM NaCl, 0.1 mM PMSF) for 6 hours at 4oC. Dialyzed H1 proteins were
fractionated by a Mono S column (GE Healthcare) and purified with salt gradient
from 0.2 M to 1 M NaCl. GST-tagged proteins were purified with Glutathione
sepharose (GE Healthcare). Flag-NCL was expressed in 293T cells using
pcDNA3.1-NCL. The Flag-NCL was immunoprecipitated using anti-Flag M2
beads (Sigma-Aldrich), treated with micrococcal nuclease to remove RNAs, and
eluted with Flag peptide (Sigma-Aldrich). The expression and purification of
recombinant core histones are described previously [68].
3-2-4. Reconstitution and purification of nucleosome core particles
NCPs were assembled with the 196 bp 5S rRNA gene fragment and core histones
by salt dilution method [67]. Reconstituted NCPs (200 µL) incubated at 42°C for 1
h were loaded on 15%–35% glycerol gradient in 10 mM Tris-HCl (pH7.9), 1 mM
DTT (2.2 mL). The samples were centrifuged at 54,000 rpm for 8 h at 4°C in S55S
rotor (Hitachi Koki, 202 SC100GXII), and fractions (100 µl) were collected from
the top.
3-2-5. DNA/NCP and histone chaperone binding assays
DNA or purified NCP (10 nM DNA) was mixed and incubated with increasing
amounts of His-tagged H1 proteins in a buffer containing (15 mM Tris-HCl pH7.9,
150 mM NaCl, 12% glycerol, and 200 µg/ml BSA) at 30°C for 30 min. Samples
were separated on 6% native-PAGE in 0.5×TBE at 100 V for 80 min. DNA was
49
visualized by GelRed (Biotium) staining. For histone chaperone activity assay on
DNA, His-tagged sNASP, NAP1L1, NAP1L4, TAF-Iβ, NPM1 or Flag-tagged NCL
was incubated with His-tagged H1, and further incubated with the 196 bp 5S
rDNA gene fragments for 30 min at 30oC. For histone chaperone activity assay on
NCP, His-tagged TAF-Iβ or NPM1 was incubated with His-tagged H1, and further
incubated with NCPs for 30 min at 30oC. Samples were separated on 6%
native-PAGE in 0.5×TBE at 100 V for 80 min. DNA was visualized by GelRed
(Biotium) staining. For histone chaperone binding assays, His-tagged histone
chaperone proteins were mixed with increasing amount of His-tagged H1 and
incubated for 30 min at room temperature in a buffer containing (15 mM 225
Tris-HCl pH7.9, 150 mM NaCl, and 12% glycerol). Samples were separated on
native-PAGE in 0.5×TBE at 100V for 90 min. Proteins were visualized by CBB
staining.
3-2-6. Immunoprecipitation and GST-pull down
Nuclear protein-rich extracts from HeLa cell lines expressing Flag-tagged H1.X
were prepared with the standard method [69]. Briefly, cells were suspended in 5
packed cell volume of buffer A (10 mM Hepes (pH 7.9), 1.5 mM MgCl2, 10 mM
KCl, 0.5 mM DTT, 0.5 mM PMSF) and incubated on ice for 10 min. Cells were
centrifuged and the buffer was removed. Cells were suspended in 1 mL of buffer
A, homogenized in Dounce homogenizer and the intact cells were separated from
the cytoplasmic protein-rich fraction by centrifuge. The isolated nuclei were
re-suspended in buffer C (20 mM Hepes (pH 7.9), 25% (v/v) glycerol, 0.42 M NaCl,

50
1.5 mM MgCl2, 0.2 mM EDTA, 0.5 mM PMSF and 0.5 mM DTT), homogenized 10
strokes and incubated on ice for 30 min. The soluble nuclear protein-rich extracts
were recovered by centrifuge. The extracts were dialyzed in dialysis buffer (50
mM Tris (pH 7.9), 100 mM NaCl, 1 mM DTT, 0.5 mM PMSF, and 10% (v/v)
glycerol). The dialyzed extracts were supplemented with 0.1% Triton X-100 and
mixed with Flag M2 beads (Sigma-Aldrich). Precipitated proteins were eluted with
the same buffer containing 0.1 mg/mL of Flag peptide (Sigma-Aldrich). Eluted
proteins were analyzed by SDS-PAGE followed by Western blotting.
For GST-pull down assays, glutathione sepharose beads immobilized
GST-tagged H1 were mixed with His-tagged sNASP, NAP1L1, NAP1L4, TAF-Iβ,
NPM1(B23.1) or Flag-tagged NCL and incubated at 4oC for 1 h followed by
extensive washing with buffer A containing 300 mM NaCl or 200 mM NaCl.
Proteins were eluted from the beads by an SDS sample buffer, separated by
SDS-PAGE, and visualized by CBB staining or western blotting.
3-2-7. FRAP assay
HeLa cells stably expressing EGFP-tagged linker histone H1 proteins grown on
35-mm glass-base dishes (AGC Techno Glass) were used for FRAP analysis.
The dish was set on inverted microscope (LSM EXCITER; Carl Zeiss
Microimaging) in an air chamber containing 5% CO2 at 37oC and analyzed as
previously described [70]. The data were represented as mean values ± SD from
at least 10 experiments.
3-2-8. Antibodies

51
Following antibodies were used in this study: Anti-TAF-I (KM1725, 1:100) [71],
anti-NPM1/B23 (Thermo Fisher Scientific (32-5200) 1:1000), anti-nucleolin (D6,
Santacruz Biotechnology (SC-17826), 1:1000), anti-NASP (Proteintech
(11323-1-AP), 1:1000), anti-Flag M2 (Sigma-Aldrich (F1804), 1:1000).

52
3-3. Results
3-3-1. Cellular behaviors of individual H1 variants
To examine the cellular behaviors of H1 variants, FRAP assays were carried
out using HeLa cell lines stably expressing N-terminally GFP-tagged H1.0, H1.1,
H1X, H1.2, H1.3, H1.4, or H1.5. GFP-tagged H1 variants were detected in
nucleus, whereas H1.X was also detected in the nucleolus. I observed that H1
variants show the distinct cellular behavior (Figure 3-1A). Cellular mobility was
classified into three groups, those with fast (H1.X), intermediate (H1.1 and H1.2),
and slow group (H1.3, H1.4, H1.5, and H1.0) (Figure 3-1B). The recovery rate of
H1.X was highest among H1 variants (Figure 3-1B).
3-3-2. DNA and nucleosome binding activity of H1 variants in vitro
Next, I questioned how the distinct cellular mobility of H1 variants is
determined. It has been reported that the cellular mobility of H1 directly reflects
the binding strength of H1 to chromatin [72]. Therefore, I examined the DNA and
nucleosome binding activities of H1 variants in vitro. To this end, nucleosome core
particle (NCP) is reconstituted with four recombinant core histones (Figure 3-2A)
and the 196 bp long DNA fragment by salt dilution method. Reconstituted NCPs
were purified using a glycerol gradient (Figure 3-2B). The peak NCP fractions
were used for binding assays (Figure 3-2B, lane 12 to lane 14). The reconstituted
NCP was detected as two bands on native PAGE due to the different positioning
of NCP along the 196 bp DNA fragments. The H1 variants used for this assay
were H1.X, H1.0 and H1.1, which were representative of each group of cellular

53
mobility. His-tagged H1.X, H1.0 and H1.1 were purified by ion exchange column
(Figure 3-2C). DNA and NCP (Figure 3-2D top and bottom, respectively) were
mixed with increasing amounts of H1.0, H1.1, and H1.X, and the complexes were
separated using native PAGE. All H1 variants, H1.0, H1.1, and H1.X, bound to
both naked DNA and NCP in a dose-dependent manner, and their affinities
toward NCP were higher than those toward naked DNA, suggesting that linker
histones preferred to bind the structured region (Figure 3-2D). In addition, DNA
and NCP binding activities of H1.X were lower than those of H1.1 and H1.0. This
result indicates that the highest cellular mobility of H1.X could be explained by its
lower DNA and NCP binding activities.
3-3-3. Interaction between H1 and histone chaperones
Histone chaperones help to assemble H1 onto nucleosome and
disassemble H1 from nucleosome. Therefore, histone chaperones are also
involved in the regulation of cellular mobility of H1. To examine whether seven H1
variants associate with previously known linker histone chaperones in vitro, GST-
pull down assays were performed (Figure 3-3A). Although a lot of bands were
observed in GST-tagged H1 variants (Figure 3-3A, lane 3 to 9), the top band
indicated the full-length product. All histone chaperones except for sNASP were
pulled-down with GST-tagged H1 variants in a buffer containing 300 mM NaCl,
but not with GST alone, indicating that these histone chaperones directly
associate with individual H1 variants. By reducing the salt in a buffer, sNASP was
also pulled-down (Figure 3-3A, bottom). It suggests that binding of H1 to sNASP

54
was lower than those to other histone chaperones. Furthermore, to examine the
interaction between histone chaperones and H1.X in vivo, immunoprecipitation
assay was performed using the nuclear extracts prepared from HeLa cells stably
expressing Flag-tagged H1.X. Flag-tagged H1.X was successfully purified from
the extracts (Figure 3B, lane 7 and 8). The histone chaperones
nucleophosmin/B23, Nucleolin (NCL), and TAF-I, but not sNASP were co-purified
with Flag-tagged H1.X, suggesting that these histone chaperones have a potential
ability to regulate the dynamic behavior of H1 variants in the nucleus.
3-3-4. Histone chaperone activity for H1 variants
Next, I quantitatively analyzed the histone chaperone binding activity of H1
variants in vitro (Figure 3-4A to C). Because both NPM1 and TAF-I are highly
acidic proteins, they move to the cathode on native PAGE. Free NPM1 and TAF-I
(indicated by arrow head) were reduced by increasing amounts of H1 variants
(Figure 3-4B). TAF-I was detected with a single band by native PAGE, and the
amount of free TAF-I was quantitatively analyzed (Figure 3-4C). The result
demonstrated that the affinity of TAF-I to H1.X was clearly lower than that to H1.0
and H1.1. Because NPM1 alone was not accumulated into a single band on
native PAGE, I failed to quantitatively estimate the amount of free NPM1 after the
addition of H1. However, free NPM1 bands were still detected after addition of 16
pmole of H1.X, whereas it was not detected after the addition of 16 pmole of H1.1
or H1.0 (Figure 3-4B, compare lanes 4, 10, and 16), indicating that the affinity of
NPM1 to H1.X was also lower than that to H1.0 and H1.1.

55
The functions of histone chaperone are to inhibit random DNA binding of
histones and mediate proper histone-DNA formation. I next examined whether
NCL, sNASP, NAP1L1, NAP1L4, TAF-I, and NPM1 function as chaperones for H1
(Figure 3-4D to F). Consistent with the data shown in Figure 3-2D, H1 randomly
bound to DNA (Figure 3-4D to F, lane2 to 5) and DNA binding activity of H1.X was
lower than those of H1.0 and H1.1 (Figure 3-4F, lane2 to 5). However, the DNA
binding of H1 was inhibited by the addition of chaperones except for NCL.
Although I showed that NCL interacted with H1 (Figure 3-3A), I could not evaluate
the histone chaperone function of NCL in this assay system. Next, I examined the
effect of NPM1 and TAF-I on the H1-NCP formation. When NCP was mixed with
high concentrations of H1, large aggregates were observed and could not enter
native PAGE (Figure 3-4G to I, lane 2). However, the H1–NCP formation was
appeared by adding the increasing amounts of TAF-I and NPM1 (Figure 3-4G to I,
lanes 5–9 and 10–14, respectively). The excess amount of TAF-I disrupted the
deposition of all linker histones on NCPs and free NCPs were clearly detected.
From these results, it was demonstrated that NPM1 and TAF-I inhibit the random
DNA binding of H1, and contributes to the proper H1-NCP formation. Furthermore,
the chaperone activity of NPM1 and TAF-I were different from each other.

56
3-4. Discussion In this study, I examined the cellular behavior of H1 variants by FRAP assay.
The cellular mobility of H1 variants was different and classified into three groups,
those with fast (H1.X), intermediate (H1.1 and H1.2), and slow group (H1.3, H1.4,
H1.5, and H1.0). In addition, I analyzed the mechanism by which H1 variants
show different cellular behavior. Biochemical analyses demonstrated that DNA
and NCP binding activities of H1.X were lower than those of H1.1 and H1.0.
Since histone chaperone is also involved in the cellular behavior of H1, I
examined the histone chaperone binding activity of H1 variants. Previously known
histone chaperones, NCL, sNASP, NAP1L1, NAP1L4, TAF-I, and NPM1 directly
interacted with seven somatic H1 variants. The quantitative biochemical analyses
demonstrated that H1.X shows the lower binding ability with histone chaperones,
NPM1 and TAF-I compared with H1.0 and H1.1. These results suggest that lower
DNA, nucleosome and chaperone binding activities of H1.X contribute to the
highest cellular behavior of H1.X.
The chaperone activity of TAF-I and NPM1 toward H1 was different. I
showed that TAF-I and NPM1 deposited the H1 onto nucleosome, whereas TAF-I,
but not NPM1, removed the H1 from nucleosome. This can be explained by
binding preference of H1 toward chaperones and nucleosome. It is likely that H1
preferentially bind to the DNA compared with NPM1, thereby H1 cannot be
removed from nucleosome by NPM1. So far, it has not been reported that there is
a specific chaperone for H1 variant, however it is possible that unknown

57
chaperone exists and involved in the distinct cellular behavior.
Although my study did not reveal which domain structures of H1 contribute
to the dynamic behavior in the cells, previous studies have reported that the
dynamics of H1 are regulated by both central globular domain (GD) and
C-terminal domain (CTD) [73], and the deletion of the N-terminal domain (NTD)
also decreased the stable chromatin binding of linker histones [74]. Later, my
laboratory member performed the domain swapping analysis. He constructed
chimeric H1 proteins that comprised H1.0 containing NTD, GD, and CTD of H1.X
and H1.X containing NTD, GD, and CTD of H1.0. It was demonstrated that the
mobility of H1.0 significantly increased by the substitution of either its GD or CTD
with that of H1.X. This result suggests that both GD and CTD of H1.X contribute to
the cellular behavior of H1.X in the nucleus. Further biochemical analyses
indicated that the CTD of H1.X has a weak DNA and nucleosome binding of H1.X
among H1 variants. It is known that CTD of linker histones is enriched in basic
amino acids, which are required for the interaction with DNA or chaperones. The
basic amino acid content of H1.X (34%) is lower than that of H1.0 CTD (49%). It
suggests that this difference may generate the distinct DNA, nucleosome and
histone chaperone binding activities.
The DNA binding activity of H1 is also affected by DNA methylation and their
post-translational modification [75-77]. Therefore, it is interesting to examine the
effect of DNA methylation and post-transcriptional modification of H1 on the DNA
binding activity of H1 in future. These analyses will be helpful to more closely

58
understand the cellular behavior of H1.
Previous study reported that individual H1 variant knockdown affected a
different subset of genes [63]. It is suggested that distinct characteristics of H1
generate the differential patterns of chromatin structure and affect the gene
expression.

59
3-5. Figures and legends
Figure 3-1. Cellular behaviors of individual H1 variants. (A) FRAP assay. Stable HeLa cell lines expressing EGFP-H1 variants were examined for fluorescence recovery after photobleaching assays (FRAP). Regions marked by red were bleached with 488 nm-laser line and the EGFP
signal was measured every 1 sec. EGFP, EGFP-H1.1, -H1.2, -H1.3, -H1.4, -H1.5, -H1.1, and -H1.X expressing cells were examined and results for EGFP-H1.0, EGFP-H1.1, and EGFP-H1.X are shown. Ten cells were examined for FRAP
assays for each H1 variants and the intensity of bleached area was normalized with that of non-bleached area. (B) Recovery rate. The averaged relative intensity was plotted as a function of time (sec) after photobleaching.

60
Figure 3-2. DNA and nucleosome binding activity of H1 variants in vitro. (A) Purified recombinant histone octamers. Recombinant proteins were separated by 12.5% SDS-PAGE, and visualized with Coomassie Briliant Blue (CBB) staining. Lane M indicates molecular size markers. (B) NCP purification by 15-35%
Glycerol gradient. Reconstituted NCP sample was put on 15-35% glycerol gradient and centrifuged at 54,000 rpm for 8 hours at 4oC. Fractions (100 µl) were recovered from the top of the tube. The purification of nucleosome was confirmed
by 6% non-denaturing PAGE. DNA was visualized by GelRed staining. Fractions 12-14 were used for the DNA/NCP binding assays.

61
Figure 3-2. DNA and nucleosome binding activity of H1 variants in vitro. (C) Purified recombinant H1 proteins. Recombinant His-H1.X, His-H1.1, His-H1.0 (lanes 1–3) were separated by 12.5% SDS-PAGE, and visualized with Coomassie
Brilliant Blue (CBB) staining. Lane M indicates molecular size markers. (D) DNA and NCP binding activity of H1 variants. Naked DNA (196 bp-5S rRNA gene fragment, upper panel) or NCP assembled on the same DNA fragment (bottom
panel) (0.01 µM each) were mixed without or with 0.02, 0.04, 0.06, 0.08, and 0.1 µM of H1.0 (lanes 2–6), H1.1 (lanes 7–11), and H1.X (lanes 12–16), and incubated at 30°C for 30 min, followed by native PAGE analysis. The positions of
free DNA and NCP are indicated by arrowheads. The intensities of free DNA (upper panel) and NCP (blank arrowheads in the bottom panel) were measured and the amounts of free DNA/NCP were graphically shown at the right. Two
independent experiments were performed and error bars indicate ± SD.

62
Figure 3-3. Interaction between H1 and histone chaperones. (A) GST-pull down assay. GST, GST-H1.1, GST-H1.2, GST-H1.3, GST-H1.4,
GST-H1.5, GST-H1.0, or GST-H1.X (1 µg each) were expressed and immobilized on glutathione sepharose beads (Top panel), and mixed with 1 µg of Flag-NCL, sNASP, NAP1L1, NAP1L4, His-TAF-I, or His-NPM1. After extensive washing in a
buffer containing 300 mM or 200 mM NaCl only for sNASP (Bottom panel), proteins on the beads were analyzed by SDS-PAGE and western blotting with anti-NCL, -sNASP, -NAP1L1, -NAP1L4, -TAF-I, and –NPM1 antibodies. The
membrane was stained with CBB (Top panel).

63
Figure 3-3. Interaction between H1 and histone chaperones. (B) Interaction of H1.X with linker histone chaperones in the extracts. Histone chaperones co-immunoprecipitated with FLAG-tagged histones from HeLa cell
extracts were detected by western blotting analyses. Cytoplasmic extracts (CE) and nuclear extracts (NE) prepared from HeLa cell lines expressing FLAG-tagged histones were used. Con (Control) indicates HeLa cells without expression of
tagged protein. Input is 0.5% of total extract volume and Immunoprecipitated proteins (IP) is 20% of total elution volume These were separated by 13% SDS-PAGE followed by western blotting with anti-FLAG tag, -sNASP, -TAF-I,
-Nucleolin, -NAP-1, -NPM1. Positions of proteins are indicated by arrowhead.

64
Figure 3-4. Histone chaperone activity for H1 variants. (A) Purified proteins. His-tagged TAF-I and NPM1 (200 ng each) were separated by 10% SDS-PAGE and visualized by CBB staining. Lane M indicates molecular size markers. (B) Native PAGE analyses of linker histone–histone chaperone
complex formation. NPM1 (top panels) and TAF-I (bottom panels) (1.6 µM each) were incubated with increasing amounts (0, 0.8, 1.2, 1.6, 2.0, and 2.4 µM) of His-H1.0, His-H1.1, and His-H1.X at room temperature for 30 min. The mixture
was separated by 6% native PAGE, and visualized by CBB staining. Positions of free chaperones were shown by arrowheads. The amounts of free TAF-I after the addition of linker histones were quantitatively analyzed by Image J, and the
relative intensity was plotted as shown in (C).

65
Figure 3-4. Histone chaperone activity for H1 variants. (D) DNA binding activity. Recombinant His-H1.0 (0, 10, 20, 50, 100 ng) and indicated chaperones (100 ng) were pre-incubated. After pre-incubation, the 196
bp 5S rRNA gene fragments (10 ng) were added and incubated. The complexes were separated by 6% non-denaturing PAGE, and DNA was visualized by Gel Red staining. Same experiments were performed using H1.1 (E) and H1.X (F).

66
Figure 3-4. Histone chaperone activity for H1 variants. (G) Nucleosome binding activity. NCPs (0.23 pmols) were mixed without (lane 1) or with His-tagged H1, GST-NPM1, or GST-TAF-I. His-tagged H1 variants were pre-incubated with GST-TAF-I (lanes 5–9) or GST-NPM1 (lanes 10–14) in the
following ratio (H1: chaperone, 1:1,1:5,1:10,1:20,1:30) and then NCP (0.23 pmols) was added and further incubated. The results of histone chaperone activity with His-H1.1, His-H1.0, and His-H1.X were shown in left (G), right upper panels
(H), and bottom panel (I), respectively. The mixtures were loaded on 6% native PAGE and DNA was visualized by Gel Red staining. Positions of free DNA, NCP, and H1-bound NCP are indicated at the right side of the gels.

67
3-6. Table for primers Primer sequences for cloning of linker histones Primers Sequences
H1.0-F AGCTGGATCCGCCGCCACCATGACCGAGAATTCCACGTC
H1.0-R AGCGGATCCTCACTTCTTCTTGCCGGCCC
H1.1-F AGCTGGATCCGCCGCCACCATGTCTGAAACAGTGCCTCC
H1.1-R AGCGGATCCTTACTTTTTCTTGGGTGCCG
H1.X-F AGCTGGATCCGCCGCCACCCATATGTCCGTGGAGCTCGAGGA
H1.X-R AGCGGATCCTCACTTGCGGCCCTTGGGCA
H1.2-F AAAGGATCCATGTCCGAGACTGCTCCTGC
H1.2-R AAAGGATCCCTATTTCTTCTTGGGCGCCG
H1.3-F AAAGGATCCATGTCGGAGACTGCTCCACT
H1.3-R AAAGGATCCTCACTTTTTCTTCGGAGCTG
H1.4-F AAAGGATCCATGTCCGAGACTGCGCCTGC
H1.4-R AAAGGATCCCTACTTTTTCTTGGCTGCCG
H1.5-F AAAGGATCCATGTCGGAAACCGCTCCTGC
H1.5-R AAAGGATCCCTACTTCTTTTTGGCAGCCG

68
Chapter 4: A mechanism maintaining the amount of H1 4-1. Introduction
Previous studies reported the gene disruption of H1 variants in mice. [78,79].
It was shown that single-knockout of H1 variant genes: H10, H1c, H1d, or H1e
(murine homologues of human H1.0, H1.2, H1.3, and H1.4), and
double-knockouts of H1 variant genes: H1c/ H10, H1d/ H10, or H1e/ H10 in mice
did not affect mice development. Interestingly, total amount of H1 was not
changed by either single or double knockout of H1 variants, because the other H1
variants compensated the lost amount of H1. Importantly, these results suggest
that the functions of H1 variants are redundant among H1 variants. Furthermore,
these results prompted me to hypothesize that there should be a mechanism
maintaining the amount of H1. However, this mechanism cannot function anymore
when three H1 variant genes were knocked out at the same time [80]. Mice
lacking three H1 variant genes, H1c, H1d, and H1e, dies by E11.5 with a broad
range of defects. The H1 to core histone stoichiometry in triple-H1-null embryos
was found to be 50% of that in wild-type embryos. This H1 depletion caused the
core histone modifications and chromatin structure changes, including decreased
nucleosome repeat length and decreased local chromatin compaction [81].
However, microarray analysis of H1 triple-knockout mice revealed that expression
of only a small number of genes is affected [81]. Many of the affected genes are
imprinted genes or are genes on the X chromosome, which are normally
regulated by DNA methylation. The reduced level of H1 decreased the DNA

69
methylation of CpGs within the regulatory regions of their genes, suggesting that
H1 participates in regulation of DNA methylation. These results suggest that the
amount of H1 is essential for mouse development and involved in the regulation of
chromatin structure and gene expression through epigenetic modification.
My research aim is to reveal the molecular mechanism maintaining the
amount of H1. To examine whether H1 depletion increases the expression of the
other H1 variant genes, I established the HCT116 cell lines stably expressing
H1.4 shRNA or H1.0 shRNA. In addition, to examine the protein expression of
individual H1 variants in H1.4 knockdown cells, I learned the method of Triton
Acid Urea (TAU) gel and Reverse Phase-high Performance Liquid
Chromatography (RP-HPLC).

70
4-2. Materials and methods
4-2-1. Cell culture, transfection and reagents
HeLa cells, HEK293T cells and HCT116 cells were maintained in Dulbecco’s
modified Eagle’s medium (Nacalai Tesque) supplemented with 10% fetal bovine
serum and penicillin-streptomycin solution (Nacalai Tesque). HEK293T cells were
transfected with three lentivirus-packaging plasmids (pMDLg/pRRE, pMD2-G2,
pRSV-Rev), Luciferase shRNA (Sigma-Aldrich, pLKO.1-puro Luciferase shRNA
Control plasmid DNA) and either H1.4 shRNA (Sigma-Aldrich, HIST1H1E
MISSION shRNA Lentiviral Transduction Particles) or H1.0 shRNA
(Sigma-Aldrich, H1F0 MISSION shRNA Lentiviral Transduction Particles) by
JetPRIME (Polyplus-transfection) reagent according to the manufacturer’s
instructions. After 72 hours post transfection, supernatants containing lentivirus
particles were filtrated by 0.45 µm PVDF and collected by centrifuge with 6 µg/ml
polybrene. Lentivirus particles were added to HCT116 cells and incubated for 48
hours. Cells were selected by puromycin.
4-2-2. Isolation of histone proteins
HCT116 cells or HeLa cells were homogenized with homogenization buffer (0.32
M sucrose, 0.1% Triton X-100, 5 mM MgCl2, 10 mM Tris pH7.2, 1% thiodiglycerol,
0.5 mM phenylmethylsulfonyl fluoride). Crude nulei were collected by
centrifugation. The pellet was re-suspended in high salt buffer (0.25 M KCl, 10
mM Tris pH 7.2, 5 mM MgCl2, 0.5 mM PMSF) and incubated on ice for 20 min.
Crude chromatin was pelleted by centrifugation. The crude chromatin pellet was

71
resuspended in cold 0.2 M H2SO4 and incubated on ice for 20 min. Insoluble
material was pelleted by centrifugation. Supernatant was precipitated with 35%
trichloroacetic acid (TCA) and kept on ice for 1 hour. After centrifugation, histone
pellet was washed by acetone three times. To isolate linker histone H1 proteins,
crude chromatin was resuspended in 5% HClO4 and incubated 20 min. Insoluble
material was pelleted by centrifugation. Supernatant was precipitated 6 volume of
acetone containing 10 mM HCl and kept on ice for 1 hour. After centrifugation, H1
pellet was washed by cold acetone containing 10 mM HCl and washed twice by
acetone.
4-2-3. Triton acid urea gel
The separating gel consisted of 40%:0.08% acrylamide:biascrylamide, 8M Urea
and 5% acetic acid. The samples were prepared and dissolved in TAU sample
buffer (8M Urea, 5% acetic acid, 0.1M DTT, 0.05% Methyl green, 5%
Thiodiglycerol, and 5% glycerol). Electrophoresis was performed at 200 V for 2
hours in running buffer containing 5% acetic acid.
4-2-4. Reversed-phase HPLC separation of histones
Standard C-18 column (Phenomenex) was used. The histone sample from HeLa
cells was run by acetonitrile gradient. The gradient used on an Waters Alliance
2695 Separations Module consisted of 0–25% B in 10 min, 25–55% B in 55 min,
55-90% B in 5 min (A, 0.1% acetic acid; B, 95% acetonitrile in 0.1% acetic acid).
To identify the H1 variant, fractionated samples were collected and lyophilized in a
SpeedVac for 4 hours. Lyophilized fractions were re-dissolved in ddH2O and

72
analyzed by multidimensional liquid chromatography (LTQ Orbitrap Velos) mass
spectrometry.
4-2-5. RT-qPCR
Total RNA was extracted using RNeasy Kit (Qiagen) according to the
manufacturer’s instructions. cDNA was prepared from purified RNA (1 µg) by
using ReverTraAce (Toyobo) with oligo dT primer. Real-time PCR was carried out
with SYBR Green Real time PCR Master Mix-Plus (Toyobo) in the Thermal Cycler
Dice Real-Time PCR system (TaKaRa). Primer sets for RT-PCR are listed in table,
4-6.

73
4-3. Results
4-3-1. The effect of H1.4 or H1.0 depletion on the expression of the other H1
variant genes.
Firstly, I tested whether decreased amount of one H1 variant gene results in
the mRNA up-regulation of the other H1 variant genes by RT-qPCR even in
cultured cancer cells (Figure 4-1). I established HCT116 cell lines stably
expressing either H1.4 shRNA or H1.0 shRNA and used them for this assay. The
expression of H1.4 mRNA was reduced about 70% by H1.4 shRNA. The depletion
of H1.4 resulted in 3 fold and 1.5 fold increase of H1.0 and H1.2 mRNA,
respectively (Figure 4-1A), whereas the expression of H1.X mRNA was not
affected by H1.4 depletion. The expression of H1.1, H1.3 and H1.5 mRNA was
not detected in HCT116 cells. On the other hand, the expression of H1.0 mRNA
was reduced about 60% by H1.0 shRNA, while the expression of H1.2 and H1.4
mRNA was also reduced by H1.0 shRNA (Figure 4-1B). The result showed that
the depletion of H1.0 increased the expression of H1.X mRNA about 2 fold. These
results suggest that a mechanism maintaining the amount of H1 is regulated
before translation. Furthermore, I found some trends for their regulation. For
example, when H1.4 is depleted, the expression of H1.0 and H1.2 are increased,
and when H1.0 is depleted, the expression of H1.X is increased.

74
4-3-2. Separation of H1 variant proteins
Next, to examine whether the depletion of H1 increases the protein
expression of other H1 variants, I analyzed the histone proteins isolated by acid
extraction from HeLa cells. The procedure of histone extraction was described in
Figure 4-2A. Briefly, cells were lysed using hypotonic buffer and intact nuclei were
collected. The nuclei were extracted in acidic conditions to selectively isolate
histones. In addition, linker histones were extracted using HClO4. Because there
were not specific antibodies for linker histone variants, I first tried to separate the
H1 variant proteins by TAU gel (Figure 4-2B). TAU gel is known to be able to
separate certain histone variants, such as H3 variants H3.1, H3.2, H3.3 by binding
of the triton X-100 to hydrophobic regions of the proteins. Linker histones were
isolated by HClO4, however, these histones were not individually separated by
TAU gel (Figure 4-2B, lane1). Next, I tested whether H1 variant proteins are
separated by RP-HPLC. Isolated histones were separated by C18 column in an
acetonitrile gradient (Figure 4-2C). The samples indicated by arrows (Figure 4-2C,
bottom panel) were separated by SDS-PAGE (Figure 4-2D) and analyzed by
mass-spectrometry. The results showed that H1.0 was identified in the peak (34
to 35 min), and H1.2, H1.3, and H1.5 were identified in the peak (52 to 53 min).
Although I could separate histone H1.0 by RP-HPLC, the other H1 variant
proteins could not be separated by this method. In future, I will increase the
retention time and collect samples in short time period.

75
4-3-3. The effect of H1.4 depletion on the expression of the other H1 variant
proteins
Although it was difficult to detect the individual H1 variant proteins by TAU
and RP-HPLC under the analysis conditions employed here, isolated H1 variant
proteins were partially separated by 18% SDS-PAGE. Three major bands were
detected in both control and H1.4 knockdown cells. The intensity of band 1 in
Figure 4-2D was decreased in H1.4 knockdown cells, suggesting that this band
may include the H1.4 protein. On the other hand, the intensity of band 3 shown in
Figure 4-2D was increased in H1.4 knockdown cells, suggesting that this band
may include the H1.0 protein. Although I could not determine the identity of H1
variants, these results indicate that H1.4 depletion increases the other H1 variant
proteins. I will improve the separation method of H1 variant proteins, and clarify
which H1 variant proteins are increased by H1.4 depletion in future.

76
4-4. Discussion
Previous studies showed that when H1 is decreased by some reason, cells
try to compensate and keep the stable amount of H1. In this study, I found that
H1.4 depletion resulted in the increased expression of H1.0 and H1.2 mRNA,
while H1.0 depletion resulted in the increased expression of H1.X mRNA. These
results suggest that the compensation of the amount of H1 is regulated before
translation. However, it is still unclear how H1 depletion is sensed and regulated
at mRNA level. The function of H1 is to construct the higher order chromatin
structure. Therefore, H1 is thought to be transcriptional repressor. It is possible
that H1 regulates the gene expression of other H1 variant genes. There are two
ideas; first one is that H1.4 binds to the regulatory region of H1.0 gene, and when
H1.4 is reduced, down-regulated H1.0 gene is expressed, second one is that H1.4
binds to the regulatory region of high-mobility group box 1 (HBP1) transcription
factor [82], which is a specific transcriptional regulator of H1.0 gene, and when
H1.4 is reduced, HBP1 is expressed, which leads to the expression of H1.0 gene.
To demonstrate these ideas, next I would like to examine whether H1.4 binds to
the regulatory region of H1.0 gene or HBP1 gene by chromatin
immunoprecipitation assay.
H1 variants are differentially expressed and incorporated into chromatin
during differentiation [62]. It has been shown that the expression of H1.0 and H1.X
genes was increased, whereas the expression of H1.2, H1.3, H1.4, and H1.5
genes were clearly down-regulated during the retinoic acid (RA)-induced

77
differentiation of NT2 cells [62]. It has a possibility that the expression of H1
variant genes upon differentiation is regulated by a same mechanism maintaining
the amount of H1.
Linker histone H1 is an essential component constructing the chromatin
structure. H1 depletion changes the nucleosome spacing and chromatin
compaction [81]. Therefore, cells have a back-up system keeping stable amount
of H1, which contributes to the maintenance of chromatin structure. Chromatin
structure is involved in the regulation of gene expression. Thus, this study
contributes to the understanding of mechanism by which gene expression is
properly regulated.

78
4-5. Figures and legends
Figure 4-1. The effect of H1.4 or H1.0 depletion on the expression of the other H1 variant genes. (A) The effect of H1.4 depletion on the expression of the other H1 variant genes.
RNA was extracted from HCT116 cell lines stably expressing control luciferase shRNA or H1.4 shRNA. RT-qPCR was performed using gene-specific primers. White and black bars indicate the results from control and either H1.4 or H1.0
shRNA, respectively. Relative mRNA levels were normalized by the expression level of GAPDH. The expression of H1.1, H1.3, and H1.5 mRNA was not detected in both control and H1 knockdown HCT116 cell lines. (B) The effect of H1.0
depletion on the expression of the other H1 variant genes. RNA extraction and RT-qPCR was performed as described in (A).

79
Figure 4-2. Separation of H1 variant proteins. (A) Isolation of H1 protein by acid extraction. Cells were homogenized with a
homogenized buffer. Crude nuclei were collected and re-suspended in high salt buffer. To isolate all histone proteins, crude chromatin was re-suspended in cold 0.2 M H2SO4. Supernatant was precipitated with 35% TCA. Histone pellet was
washed by acetone. To isolate H1 protein, crude chromatin was re-suspended in 5% HClO4. Supernatant was precipitated with acetone containing 10 mM HCl. H1 pellet was washed by cold acetone. (B) TAU gel. H1 protein (Lane 1) and total
histone proteins (Lane 2) extracted from HeLa cells were separated by triton acid urea (TAU) gel and visualized by CBB staining.

80
Figure 4-2. Separation of H1 variant proteins. (C) Reverse phase high performance liquid chromatography (RP-HPLC). Histone
sample was run using standard C-18 column with an acetonitrile gradient. Buffer A and B are composed of 0.1% acetic acid and 95% acetonitrile in 0.1% acetic acid, respectively. The peaks indicated by arrowheads were collected and further
analyzed by mass-spectrometry.

81
Figure 4-2. Separation of H1 variant proteins. (D) Identification of histone composition of individual HPLC fractions by SDS-18% PAGE. The fractionated samples derived from RP-HPLC were separated by 18%
SDS-PAGE and visualized by CBB staining. The Reverse phase high performance liquid chromatography (RP-HPLC). The fractionated time was shown above. The samples were analyzed by mass-spectrometry. Identified histones
were shown above. Recombinant histone proteins were shown in lane 13 to 17.

82
Figure 4-3. The effect of H1.4 depletion on the expression of other H1 variant proteins. (A) SDS-PAGE. H1 proteins, which are Isolated from HCT116 cell lines stably expressing control luciferase shRNA and H1.4 shRNA, were separated by 18% SDS-PAGE. Lane 1 and 2 in left panel showed the control and H1.4 knockdown
cells, respectively. (B) Enlarged image of the protein bands of H1 were shown. Three major bands were observed (Lane 1 to 3). The band intensity was measured and shown in the Figure below.

83
4-6. Table for primers Primers used for RT-PCR Primers Sequences
H1.2-F TGCCAAAAGTGCTGCTAAGG
H1.2-R GGTTTTAGAAGTAGGCGTTCGC
H1.4-F CGAATTGCTCTCGCTCAC
H1.4-R CCTTCTTCTTCACGGGAGTC
H1.0-F ATGCTCACCACCACCTTTTG
H1.0-R TGTTGCTGTCCTTGCACAAC
H1.X-F CCCAACGATGTAGCGTTTTT
H1.X-R AAGGCCGAGAGCCAATAGA
GAPDH-F CCACATCGCTCAGACACCAT
GAPDH-R GCGCCCAATACGACCAAA

84
Chapter 5: Summary In chapter 1, the various biological functions of NPM1 are described. In this
dissertation, I focused on the function of NPM1 in the transcriptional regulation of
the genes, especially the IFN-γ induced genes as described in Chapter 2.
Although we previously reported the function of NPM1 as a chromatin remodeling
factor, the transcriptional regulatory function of NPM1 was distinct from the
chromatin regulatory functions of NPM1. I demonstrated that NPM1 depletion
selectively decreases the transcription of IFN-γ induced genes, suggesting that
NPM1 positively regulates these gene expressions. I showed that NPM1 directly
binds to STAT1 and regulates the expression of the reporter gene containing GAS.
NPM1 knockdown decreases the transcriptional activity of the CIITA pIV promoter.
Although the CIITA pIV promoter contains the STAT1 binding site, NPM1 did not
strongly affect the STAT1 function on the CIITA pIV. The effect of NPM1 was
cancelled when the IRF1 binding site was deleted or mutated. Thus, it is likely that
NPM1 regulates the expression of CIITA through IRF1. Consistent with previous
studies, I found that NPM1 shows potential ability to associate with IRF1. Further
study is required to clarify the molecular mechanism regulating the function of
STAT1 and IRF1 by NPM1.
In chapter 3, I biochemically characterized the seven somatic H1 variants. I
showed that the cellular mobility of H1 variants was different and classified into
three groups, those with fast (H1.X), intermediate (H1.1 and H1.2), and slow
group (H1.3, H1.4, H1.5, and H1.0). Since the cellular mobility of H1 reflects its

85
intrinsic DNA, nucleosome and chaperone binding activities, I examined the
difference of these binding activities among H1 variants. I found that H1.X shows
a lower DNA, nucleosome, and histone chaperone binding activities. This is
probably the reason why H1.X has the highest cellular mobility. Furthermore, I
showed that previously known histone chaperones directly interact with H1 variant
proteins. The histone chaperones, TAF-I and B23, which also associate with H1 in
vivo, showed the distinct chaperone activity toward H1.
In chapter 4, I focused on the regulation mechanism maintaining the amount
of H1. To investigate whether the H1 depletion increases the mRNA expression of
the other H1 variants genes, I established either H1.4 or H1.0 knockdown cell
lines. I demonstrated that H1.4 depletion resulted in increased expression of H1.0
and H1.2 mRNA, while H1.0 depletion resulted in increased expression of H1.X
mRNA. Although the expression of H1.0 and H1.2 mRNA was increased by H1.4
depletion, I wanted to check whether the protein expression level of H1.0 was also
increased by H1.4 depletion. Since there are no commercially available antibodies
against individual H1 variants, I tried to analyze H1 variant proteins by learning
the method of TAU gel and RP-HPLC. However, TAU gel was not suitable for
separating the H1 variant proteins, while RP-HPLC partially separated the H1
variant proteins. By improving the analysis condition of RP-HPLC, I will separate
the individual H1 variant proteins.
Even though I could not confirm that the protein level of H1.0 was increased
by H1.4 depletion, the result of SDS-PAGE suggested that H1.4 depletion

86
increased the other H1 variant proteins.

87
Chapter 6: Significance and perspective I demonstrated that NPM1 has dual functions for the regulation of gene
expression. Firstly, NPM1 acts as a histone chaperon and promotes the
chromatin remodeling, which allows the efficient gene expression. Secondly,
NPM1 acts as a transcriptional co-regulator and enhances the activity of
transcription factors by their direct interaction, which promotes the gene
expression.
In addition, it was previously revealed that NFκB requires the NPM1 as a
cofactor for the maximal expression of its target genes. It was suggested that two
oncogenic factors, NPM1 and NFκB cooperatively regulate the expression of
inflammatory genes. Interestingly, it was reported that the up-regulation of STAT1
activity correlates with the tumor progression. Therefore, it is possible that
increased expression of NPM1 in tumor cells contributes to the tumor
microenvironment by enhancing the activity of NFκB, STAT1, and IRF1. This may
support the function of NPM1 as an oncogene. In the future, it is possible that the
therapeutic drug inhibiting their interaction can suppress the tumor progression
and invasion. Because my study suggests that NPM1 positively regulates the
expression of IFN-γ induced genes, which plays critical roles in both acquired and
innate immune system, NPM1 can possibly enhance the immune reaction during
infections.
Since chromatin structure is closely related to the regulation of gene
expression, I examined how chromatin structure is regulated and maintained. To

88
this end, I focused on the linker histone H1, which is one of the components of
chromatin structure. I demonstrated the distinct DNA, nucleosome, and histone
chaperone binding activities of H1 variants. It is possible that these distinct
characteristics are important to make a variety of chromatin conformation and
thereby gene expression. In the future, it is also interesting that the DNA binding
activity of H1 is affected by its post-transcriptional modification and DNA
methylation.
So far, it is suggested that cells can quickly sense decreased of H1 using the
backup system to maintain the chromatin structure and the proper gene
expression. I demonstrated that H1.4 depletion resulted in the increased
expression of H1.0 and H1.2 mRNA, suggesting that this backup system is
regulated before translation. However, the mechanism is still unclear. It is
hypothesized that H1.4 normally inhibits the transcription of H1.0 gene or HBP1
gene, which encodes a transcription factor to stimulate the H1.0 gene. Therefore,
it will be interesting to examine whether H1.4 exists in the regulatory region of
H1.0 gene or HBP1 gene. The expression of S-phase dependent H1 variant
genes is decreased during differentiation, however, the expression of S-phase
independent H1 variant genes is increased, suggesting that the amount of H1 is
sensed and regulated by the backup system during differentiation.

89
References
[1] Feuerstein, N. and Mond, J.J. (1987). Identification of a prominent nuclear protein
associated with proliferation of normal and malignant B cells. J Immunol 139,
1818-22.
[2] Schmidt-Zachmann, M.S., Hugle-Dorr, B. and Franke, W.W. (1987). A constitutive
nucleolar protein identified as a member of the nucleoplasmin family. Embo j 6,
1881-90.
[3] Kang, Y.J., Olson, M.O. and Busch, H. (1974). Phosphorylation of acid-soluble
proteins in isolated nucleoli of Novikoff hepatoma ascites cells. Effects of divalent
cations. J Biol Chem 249, 5580-5.
[4] Kang, Y.J., Olson, M.O., Jones, C. and Busch, H. (1975). Nucleolar
phosphoproteins of normal rat liver and Novikoff hepatoma ascites cells. Cancer
Res 35, 1470-5.
[5] Nishimura, Y., Ohkubo, T., Furuichi, Y. and Umekawa, H. (2002). Tryptophans
286 and 288 in the C-terminal region of protein B23.1 are important for its
nucleolar localization. Biosci Biotechnol Biochem 66, 2239-42.
[6] Federici, L. et al. (2010). Nucleophosmin C-terminal leukemia-associated domain
interacts with G-rich quadruplex forming DNA. J Biol Chem 285, 37138-49.
[7] Gallo, A., Lo Sterzo, C., Mori, M., Di Matteo, A., Bertini, I., Banci, L., Brunori, M.
and Federici, L. (2012). Structure of nucleophosmin DNA-binding domain and
analysis of its complex with a G-quadruplex sequence from the c-MYC promoter.
J Biol Chem 287, 26539-48.
[8] Borer, R.A., Lehner, C.F., Eppenberger, H.M. and Nigg, E.A. (1989). Major
nucleolar proteins shuttle between nucleus and cytoplasm. Cell 56, 379-90.
[9] Dingwall, C., Dilworth, S.M., Black, S.J., Kearsey, S.E., Cox, L.S. and Laskey, R.A.
(1987). Nucleoplasmin cDNA sequence reveals polyglutamic acid tracts and a
cluster of sequences homologous to putative nuclear localization signals. Embo j
6, 69-74.
[10] Dutta, S., Akey, I.V., Dingwall, C., Hartman, K.L., Laue, T., Nolte, R.T., Head, J.F.
and Akey, C.W. (2001). The crystal structure of nucleoplasmin-core: implications
for histone binding and nucleosome assembly. Mol Cell 8, 841-53.
[11] Namboodiri, V.M., Dutta, S., Akey, I.V., Head, J.F. and Akey, C.W. (2003). The
crystal structure of Drosophila NLP-core provides insight into pentamer formation

90
and histone binding. Structure 11, 175-86.
[12] Qi, W., Shakalya, K., Stejskal, A., Goldman, A., Beeck, S., Cooke, L. and
Mahadevan, D. (2008). NSC348884, a nucleophosmin inhibitor disrupts oligomer
formation and induces apoptosis in human cancer cells. Oncogene 27, 4210-20.
[13] Jian, Y., Gao, Z., Sun, J., Shen, Q., Feng, F., Jing, Y. and Yang, C. (2009). RNA
aptamers interfering with nucleophosmin oligomerization induce apoptosis of
cancer cells. Oncogene 28, 4201-11.
[14] Okuwaki, M., Iwamatsu, A., Tsujimoto, M. and Nagata, K. (2001). Identification of
nucleophosmin/B23, an acidic nucleolar protein, as a stimulatory factor for in vitro
replication of adenovirus DNA complexed with viral basic core proteins. J Mol Biol
311, 41-55.
[15] Okuwaki, M., Matsumoto, K., Tsujimoto, M. and Nagata, K. (2001). Function of
nucleophosmin/B23, a nucleolar acidic protein, as a histone chaperone. FEBS
Lett 506, 272-6.
[16] Gadad, S.S. et al. (2011). The multifunctional protein nucleophosmin (NPM1) is a
human linker histone H1 chaperone. Biochemistry 50, 2780-9.
[17] Yu, Y., Maggi, L.B., Jr., Brady, S.N., Apicelli, A.J., Dai, M.S., Lu, H. and Weber,
J.D. (2006). Nucleophosmin is essential for ribosomal protein L5 nuclear export.
Mol Cell Biol 26, 3798-809.
[18] Herrera, J.E., Savkur, R. and Olson, M.O. (1995). The ribonuclease activity of
nucleolar protein B23. Nucleic Acids Res 23, 3974-9.
[19] Savkur, R.S. and Olson, M.O. (1998). Preferential cleavage in pre-ribosomal RNA
byprotein B23 endoribonuclease. Nucleic Acids Res 26, 4508-15.
[20] Murano, K., Okuwaki, M., Hisaoka, M. and Nagata, K. (2008). Transcription
regulation of the rRNA gene by a multifunctional nucleolar protein,
B23/nucleophosmin, through its histone chaperone activity. Mol Cell Biol 28,
3114-26.
[21] Takemura, M., Sato, K., Nishio, M., Akiyama, T., Umekawa, H. and Yoshida, S.
(1999). Nucleolar protein B23.1 binds to retinoblastoma protein and
synergistically stimulates DNA polymerase alpha activity. J Biochem 125, 904-9.
[22] Okuda, M. et al. (2000). Nucleophosmin/B23 is a target of CDK2/cyclin E in
centrosome duplication. Cell 103, 127-40.
[23] Zhang, H., Shi, X., Paddon, H., Hampong, M., Dai, W. and Pelech, S. (2004).

91
B23/nucleophosmin serine 4 phosphorylation mediates mitotic functions of
polo-like kinase 1. J Biol Chem 279, 35726-34.
[24] Grisendi, S., Bernardi, R., Rossi, M., Cheng, K., Khandker, L., Manova, K. and
Pandolfi, P.P. (2005). Role of nucleophosmin in embryonic development and
tumorigenesis. Nature 437, 147-53.
[25] Falini, B. et al. (2005). Cytoplasmic nucleophosmin in acute myelogenous
leukemia with a normal karyotype. N Engl J Med 352, 254-66.
[26] Redner, R.L., Rush, E.A., Faas, S., Rudert, W.A. and Corey, S.J. (1996). The
t(5;17) variant of acute promyelocytic leukemia expresses a
nucleophosmin-retinoic acid receptor fusion. Blood 87, 882-6.
[27] Morris, S.W., Kirstein, M.N., Valentine, M.B., Dittmer, K.G., Shapiro, D.N.,
Saltman, D.L. and Look, A.T. (1994). Fusion of a kinase gene, ALK, to a nucleolar
protein gene, NPM, in non-Hodgkin's lymphoma. Science 263, 1281-4.
[28] Yoneda-Kato, N., Look, A.T., Kirstein, M.N., Valentine, M.B., Raimondi, S.C.,
Cohen, K.J., Carroll, A.J. and Morris, S.W. (1996). The t(3;5)(q25.1;q34) of
myelodysplastic syndrome and acute myeloid leukemia produces a novel fusion
gene, NPM-MLF1. Oncogene 12, 265-75.
[29] Grisendi, S., Mecucci, C., Falini, B. and Pandolfi, P.P. (2006). Nucleophosmin and
cancer. Nat Rev Cancer 6, 493-505.
[30] Itahana, K., Bhat, K.P., Jin, A., Itahana, Y., Hawke, D., Kobayashi, R. and Zhang,
Y. (2003). Tumor suppressor ARF degrades B23, a nucleolar protein involved in
ribosome biogenesis and cell proliferation. Mol Cell 12, 1151-64.
[31] Korgaonkar, C., Hagen, J., Tompkins, V., Frazier, A.A., Allamargot, C., Quelle,
F.W. and Quelle, D.E. (2005). Nucleophosmin (B23) targets ARF to nucleoli and
inhibits its function. Mol Cell Biol 25, 1258-71.
[32] Kurki, S., Peltonen, K., Latonen, L., Kiviharju, T.M., Ojala, P.M., Meek, D. and
Laiho, M. (2004). Nucleolar protein NPM interacts with HDM2 and protects tumor
suppressor protein p53 from HDM2-mediated degradation. Cancer Cell 5, 465-75.
[33] Inouye, C.J. and Seto, E. (1994). Relief of YY1-induced transcriptional repression
by protein-protein interaction with the nucleolar phosphoprotein B23. J Biol Chem
269, 6506-10.
[34] Kondo, T., Minamino, N., Nagamura-Inoue, T., Matsumoto, M., Taniguchi, T. and
Tanaka, N. (1997). Identification and characterization of

92
nucleophosmin/B23/numatrin which binds the anti-oncogenic transcription factor
IRF-1 and manifests oncogenic activity. Oncogene 15, 1275-81.
[35] Lin, C.Y., Chao, A., Wang, T.H., Lee, L.Y., Yang, L.Y., Tsai, C.L., Wang, H.S. and
Lai, C.H. (2016). Nucleophosmin/B23 is a negative regulator of estrogen receptor
alpha expression via AP2gamma in endometrial cancer cells. Oncotarget 7,
60038-60052.
[36] Liu, H., Tan, B.C., Tseng, K.H., Chuang, C.P., Yeh, C.W., Chen, K.D., Lee, S.C.
and Yung, B.Y. (2007). Nucleophosmin acts as a novel AP2alpha-binding
transcriptional corepressor during cell differentiation. EMBO Rep 8, 394-400.
[37] Dhar, S.K., Lynn, B.C., Daosukho, C. and St Clair, D.K. (2004). Identification of
nucleophosmin as an NF-kappaB co-activator for the induction of the human
SOD2 gene. J Biol Chem 279, 28209-19.
[38] Lin, J., Kato, M., Nagata, K. and Okuwaki, M. (2017). Efficient DNA binding of
NF-kappaB requires the chaperone-like function of NPM1. Nucleic Acids Res 45,
3707-3723.
[39] Li, Z., Boone, D. and Hann, S.R. (2008). Nucleophosmin interacts directly with
c-Myc and controls c-Myc-induced hyperproliferation and transformation. Proc
Natl Acad Sci U S A 105, 18794-9.
[40] Lindstrom, M.S. (2011). NPM1/B23: A Multifunctional Chaperone in Ribosome
Biogenesis and Chromatin Remodeling. Biochem Res Int 2011, 195209.
[41] Platanias, L.C. (2005). Mechanisms of type-I- and type-II-interferon-mediated
signalling. Nat Rev Immunol 5, 375-86.
[42] Schroder, K., Hertzog, P.J., Ravasi, T. and Hume, D.A. (2004). Interferon-gamma:
an overview of signals, mechanisms and functions. J Leukoc Biol 75, 163-89.
[43] Hermant, P. and Michiels, T. (2014). Interferon-lambda in the context of viral
infections: production, response and therapeutic implications. J Innate Immun 6,
563-74.
[44] Kobayashi, K.S. and van den Elsen, P.J. (2012). NLRC5: a key regulator of MHC
class I-dependent immune responses. Nat Rev Immunol 12, 813-20.
[45] Biswas, A., Meissner, T.B., Kawai, T. and Kobayashi, K.S. (2012). Cutting edge:
impaired MHC class I expression in mice deficient for Nlrc5/class I transactivator.
J Immunol 189, 516-20.
[46] Steimle, V., Otten, L.A., Zufferey, M. and Mach, B. (2007). Complementation

93
cloning of an MHC class II transactivator mutated in hereditary MHC class II
deficiency (or bare lymphocyte syndrome). 1993. J Immunol 178, 6677-88.
[47] Chang, C.H., Guerder, S., Hong, S.C., van Ewijk, W. and Flavell, R.A. (1996).
Mice lacking the MHC class II transactivator (CIITA) show tissue-specific
impairment of MHC class II expression. Immunity 4, 167-78.
[48] Hisaoka, M., Nagata, K. and Okuwaki, M. (2014). Intrinsically disordered regions
of nucleophosmin/B23 regulate its RNA binding activity through their inter- and
intra-molecular association. Nucleic Acids Res 42, 1180-95.
[49] Hisaoka, M., Ueshima, S., Murano, K., Nagata, K. and Okuwaki, M. (2010).
Regulation of nucleolar chromatin by B23/nucleophosmin jointly depends upon its
RNA binding activity and transcription factor UBF. Mol Cell Biol 30, 4952-64.
[50] Yuasa, K. and Hijikata, T. (2016). Distal regulatory element of the STAT1 gene
potentially mediates positive feedback control of STAT1 expression. Genes Cells
21, 25-40.
[51] Muhlethaler-Mottet, A., Otten, L.A., Steimle, V. and Mach, B. (1997). Expression
of MHC class II molecules in different cellular and functional compartments is
controlled by differential usage of multiple promoters of the transactivator CIITA.
Embo j 16, 2851-60.
[52] LeibundGut-Landmann, S., Waldburger, J.M., Reis e Sousa, C., Acha-Orbea, H.
and Reith, W. (2004). MHC class II expression is differentially regulated in
plasmacytoid and conventional dendritic cells. Nat Immunol 5, 899-908.
[53] Muhlethaler-Mottet, A., Di Berardino, W., Otten, L.A. and Mach, B. (1998).
Activation of the MHC class II transactivator CIITA by interferon-gamma requires
cooperative interaction between Stat1 and USF-1. Immunity 8, 157-66.
[54] Narayan, V., Halada, P., Hernychova, L., Chong, Y.P., Zakova, J., Hupp, T.R.,
Vojtesek, B. and Ball, K.L. (2011). A multiprotein binding interface in an
intrinsically disordered region of the tumor suppressor protein interferon
regulatory factor-1. J Biol Chem 286, 14291-303.
[55] Wolffe, A.P. (1997). Histone H1. Int J Biochem Cell Biol 29, 1463-6.
[56] Simpson, R.T. (1978). Structure of the chromatosome, a chromatin particle
containing 160 base pairs of DNA and all the histones. Biochemistry 17, 5524-31.
[57] Happel, N. and Doenecke, D. (2009). Histone H1 and its isoforms: contribution to
chromatin structure and function. Gene 431, 1-12.

94
[58] Clausell, J., Happel, N., Hale, T.K., Doenecke, D. and Beato, M. (2009). Histone
H1 subtypes differentially modulate chromatin condensation without preventing
ATP-dependent remodeling by SWI/SNF or NURF. PLoS One 4, e0007243.
[59] Th'ng, J.P., Sung, R., Ye, M. and Hendzel, M.J. (2005). H1 family histones in the
nucleus. Control of binding and localization by the C-terminal domain. J Biol
Chem 280, 27809-14.
[60] Orrego, M., Ponte, I., Roque, A., Buschati, N., Mora, X. and Suau, P. (2007).
Differential affinity of mammalian histone H1 somatic subtypes for DNA and
chromatin. BMC Biol 5, 22.
[61] Stoldt, S., Wenzel, D., Schulze, E., Doenecke, D. and Happel, N. (2007). G1
phase-dependent nucleolar accumulation of human histone H1x. Biol Cell 99,
541-52.
[62] Terme, J.M., Sese, B., Millan-Arino, L., Mayor, R., Izpisua Belmonte, J.C., Barrero,
M.J. and Jordan, A. (2011). Histone H1 variants are differentially expressed and
incorporated into chromatin during differentiation and reprogramming to
pluripotency. J Biol Chem 286, 35347-57.
[63] Sancho, M., Diani, E., Beato, M. and Jordan, A. (2008). Depletion of human
histone H1 variants uncovers specific roles in gene expression and cell growth.
PLoS Genet 4, e1000227.
[64] Lee, H., Habas, R. and Abate-Shen, C. (2004). MSX1 cooperates with histone
H1b for inhibition of transcription and myogenesis. Science 304, 1675-8.
[65] Mayor, R., Izquierdo-Bouldstridge, A., Millan-Arino, L., Bustillos, A., Sampaio, C.,
Luque, N. and Jordan, A. (2015). Genome distribution of replication-independent
histone H1 variants shows H1.0 associated with nucleolar domains and H1X
associated with RNA polymerase II-enriched regions. J Biol Chem 290, 7474-91.
[66] Kato, K., Okuwaki, M. and Nagata, K. (2011). Role of Template Activating Factor-I
as a chaperone in linker histone dynamics. J Cell Sci 124, 3254-65.
[67] Okuwaki, M., Kato, K., Shimahara, H., Tate, S. and Nagata, K. (2005). Assembly
and disassembly of nucleosome core particles containing histone variants by
human nucleosome assembly protein I. Mol Cell Biol 25, 10639-51.
[68] Okuwaki, M., Abe, M., Hisaoka, M. and Nagata, K. (2016). Regulation of Cellular
Dynamics and Chromosomal Binding Site Preference of Linker Histones H1.0 and
H1.X. Mol Cell Biol 36, 2681-2696.

95
[69] Dignam, J.D., Lebovitz, R.M. and Roeder, R.G. (1983). Accurate transcription
initiation by RNA polymerase II in a soluble extract from isolated mammalian
nuclei. Nucleic Acids Res 11, 1475-89.
[70] Okuwaki, M., Sumi, A., Hisaoka, M., Saotome-Nakamura, A., Akashi, S.,
Nishimura, Y. and Nagata, K. (2012). Function of homo- and hetero-oligomers of
human nucleoplasmin/nucleophosmin family proteins NPM1, NPM2 and NPM3
during sperm chromatin remodeling. Nucleic Acids Res 40, 4861-78.
[71] Nagata, K. et al. (1998). Cellular localization and expression of
template-activating factor I in different cell types. Exp Cell Res 240, 274-81.
[72] Catez, F., Ueda, T. and Bustin, M. (2006). Determinants of histone H1 mobility
and chromatin binding in living cells. Nat Struct Mol Biol 13, 305-10.
[73] Stasevich, T.J., Mueller, F., Brown, D.T. and McNally, J.G. (2010). Dissecting the
binding mechanism of the linker histone in live cells: an integrated FRAP analysis.
Embo j 29, 1225-34.
[74] Oberg, C. and Belikov, S. (2012). The N-terminal domain determines the affinity
and specificity of H1 binding to chromatin. Biochem Biophys Res Commun 420,
321-4.
[75] McArthur, M. and Thomas, J.O. (1996). A preference of histone H1 for methylated
DNA. EMBO J 15, 1705-14.
[76] Gilbert, N., Thomson, I., Boyle, S., Allan, J., Ramsahoye, B. and Bickmore, W.A.
(2007). DNA methylation affects nuclear organization, histone modifications, and
linker histone binding but not chromatin compaction. J Cell Biol 177, 401-11.
[77] Alexandrow, M.G. and Hamlin, J.L. (2005). Chromatin decondensation in S-phase
involves recruitment of Cdk2 by Cdc45 and histone H1 phosphorylation. J Cell
Biol 168, 875-86.
[78] Fan, Y., Sirotkin, A., Russell, R.G., Ayala, J. and Skoultchi, A.I. (2001). Individual
somatic H1 subtypes are dispensable for mouse development even in mice
lacking the H1(0) replacement subtype. Mol Cell Biol 21, 7933-43.
[79] Sirotkin, A.M., Edelmann, W., Cheng, G., Klein-Szanto, A., Kucherlapati, R. and
Skoultchi, A.I. (1995). Mice develop normally without the H1(0) linker histone.
Proc Natl Acad Sci U S A 92, 6434-8.
[80] Fan, Y., Nikitina, T., Morin-Kensicki, E.M., Zhao, J., Magnuson, T.R., Woodcock,
C.L. and Skoultchi, A.I. (2003). H1 linker histones are essential for mouse

96
development and affect nucleosome spacing in vivo. Mol Cell Biol 23, 4559-72.
[81] Fan, Y. et al. (2005). Histone H1 depletion in mammals alters global chromatin
structure but causes specific changes in gene regulation. Cell 123, 1199-212.
[82] Lemercier, C., Duncliffe, K., Boibessot, I., Zhang, H., Verdel, A., Angelov, D. and
Khochbin, S. (2000). Involvement of retinoblastoma protein and HBP1 in histone
H1(0) gene expression. Mol Cell Biol 20, 6627-37.

97
Acknowledgement
I first would like to thank you to Dr. Mitsuru Okuwaki for the continuous support
during my Ph.D. study. His guidance helped me a lot in all the time of research.
I also would like to show my gratitude to the Dr. Miharu Hisaoka, Dr. Shuhei
Ueshima, and Dr. Jianhuang Lin who taught me experiments, gave me advice,
and encouraged me throughout my study. I also appreciate Professor Kyosuke
Nagata for discussing all my progress, and Dr.Gunjan and his laboratory
members who taught me the techniques to isolate and identify histones. During
my international laboratory internship in Netherlands and USA, my host families
kindly accepted me to stay and took care me like a real daughter. I really
appreciate them.
Finally, I must express gratitude to my parents, all of my laboratory members, and
my friends for supporting me and encouraging me throughout my years of study in
Tsukuba.