a new way of seeing value - assets.contentstack.io
TRANSCRIPT

1
INTRODUCTION
A New Way Of Seeing Value
September 2021
INTRODUCING THE ENGINE NO. 1 TOTAL VALUE FRAMEWORK

2
INTRODUCTION
Table of ContentsINTRODUCTION 4
Part I: FROM VALUES TO VALUE 8
Part II: THE DATA DILEMMA 16
Part III: THE ENGINE NO. 1 TOTAL VALUE FRAMEWORK 25

3
INTRODUCTION
Engine No. 1Engine No. 1 is an investment firm that drives performance through impact. The firm was founded on the shared belief that a company’s ability to create long-term shareholder value depends on the investments it makes in its employees, customers, communities, and the environment. Learn more at www.engine1.com.
Witold J. HeniszWitold J. Henisz is the Deloitte & Touche Professor of Management at The Wharton School, The University of Pennsylvania. He is also Director of the Wharton Political Risk Lab and the founder of the Wharton ESG Analytics Lab. His research examines the impact of political hazards as well as environmental, social, and governance factors more broadly on the strategy and valuation of global corporations.
About Us

4
INTRODUCTION
The last decade has seen exponential growth of money flows into investment funds that claim to incorporate environmental, social, and governance (ESG) criteria into their strategies. Some reports suggest managers of $40 trillion in assets are now governed by mandates that take ESG factors into account. The United Nations Principles for Responsible Investment has garnered signatories with nearly triple that amount.
For all the hype and hope in these extrava-gant numbers, however, the results have so far been disappointing.
The financial returns delivered by most ESG strategies have been equivocal at best. And they have produced only a modest impact on ESG outcomes: for instance, reductions in carbon emissions, pollution, or natural-resource consumption, or a better customer experience and improved employee welfare.
Far from changing corporate behavior and creating a better world, some ESG funds have served the narrower and more self-indulgent purpose of making investors feel better by excluding obviously “bad” companies from their portfolios.
This failure to achieve goals commensurate with the ambition is, in part, the legacy of
an approach to responsible investing that is still focused on moral purity rather than on impact. Early responsible-investing pioneers were focused on moral values—not financial value—as many of those pioneers were religious investors who for centuries identified “sin stocks” and removed them from their portfolios. Much of the ESG investing world is still influenced by that mode of thinking.
Despite vastly improved and more sophisticated data sources, many of the ESG-investing strategies that have emerged in the last few years are derivatives of this approach.
Accordingly, investors have struggled to integrate ESG into mainstream financial analysis or thereby afford it the prominence it deserves. A separate but equally formidable challenge has arrived with the entry and subsequent growth of low-fee passive ESG-investment options—itself a response both to these data challenges and to the success of low-fee-based passive investing elsewhere. Absent active managers who are able to produce superior returns, investors have focused their attention on funds that mirror indexes modified by the exclusion of stocks with unfavorable ESG ratings and, in
Introduction
5
INTRODUCTION
some cases, by the overweighting of more highly rated counterparts. Without more convincing evidence of a link between ESG and financial performance, such screening or exclusionary strategies will continue to dominate.
What’s needed now is a radical new research-based approach that integrates non-traditional but financially material ESG data, methods, and systems into
traditional analysis. Such a revolution must be objective, replicable, and auditable—and, as a result, readily incorporated in financial disclosures, prospectuses, and pedagogy.
Without such a change, ESG investing is unlikely to harness the power of capital needed to address systemic challenges like climate risk and human rights.
01Part I: The history of ESG investing, in order to explain the current ESG focus on
purity over impact.
02Part II: The flaws inherent in today’s ESG data and measurement, which have kept
ESG analysis mostly disconnected from other financial or operational
analysis of a given company.
03Part III: Engine No. 1’s new framework, which we believe addresses these flaws and
gives us a new vision of value as investors.
This paper will explore:

6
INTRODUCTION
We developed our Total Value Framework to address the current deficiencies in ESG data and to help investors generate lasting impact on corporate behavior and robust long-term financial returns—not just the warm glow of a “pure” portfolio.
Through the Total Value Framework, we attempt to measure the value companies create or destroy for both shareholders and stakeholders— their employees, customers, communities, and environment—as well as on the connection between the two groups. Instead of ESG scores and ranks, which in effect constitute little more than emojis and are as difficult to incorporate into spreadsheets or algorithms, we try where possible to quantify the impact in dollars. We use independent sources and estimates to assess the firm-level costs of emissions, resource use, waste, social practices, and a host of other ESG factors.
Armed with this new data, we can proceed to focus on how the value a company delivers to its stakeholders affects the value it is then able to impart to its shareholders. This forces us to examine drivers like potential regulation, changes in customer or employee preferences, technological disruption, and other relevant contributors to a company’s risk or growth.
For example, we can show that variations in the level of value a company creates or destroys for its stakeholders strongly predict future shifts in financial value, including in revenues, worker productivity, earnings,
net income, market capitalization, and earnings multiples. The association between stakeholder value and these financial outcomes has indeed turned out to be far stronger and more robust than have the observed correlations between traditional ESG metrics and these same outcomes.
Crucially, the framework’s analysis informs our decisions as investors—the investments we make, as well as what we subsequently do as owners. We believe investors can only effect lasting change when they work as active owners. With the Total Value Framework, we come armed with an approach that is rooted in data, connected to value, integrated with our investing process, and focused on change.
The uncomfortable truth for large swaths of the ESG “industry” is that current approaches to measuring ESG performance in scores or ranks look good in ESG reports, but they are extremely difficult to incorporate into the analyses that investors and companies use to actually make decisions.
Without more convincing evidence of a link between ESG and performance, screening or exclusionary strategies will continue to dominate. We need new thinking and honest appraisal. Without it, we face the danger that the passion, energy, and vision that have gone into the ESG movement will soon dissipate into a cloud of uncertainty and confusion. With the Total Value Framework, we’re offering a new way of seeing value.

7
INTRODUCTION
FROM VALUES TO VALUEA Short History of ESG Investing
01
8
FROM VALUES TO VALUE
ESG emerged into today’s investing mainstream from old roots.
The earliest responsible investors began as a fringe prohibitionist
protest against “socially unacceptable” activities. Responsible
investors have since developed a range of tactics, but many are
derived from this initial desire for moral purity. We can see this
history most clearly in three of the most common ESG strategies
today: exclusionary screens; portfolio optimization and tilting; and
as a factor within broader smart-beta strategies. In all of these
cases, investors use ESG characteristics to decide whether to
include a given company in their portfolios.
Exclusionary screens
Early initiatives to encourage socially responsible investing targeted “offending” products like guns, tobacco, pornography, or bad practices such as environmental degradation and human-rights abuses. Investors would simply avoid buying such companies’ stocks.
Many of these investors took their cue from religious orders such as Quakers, Methodists, and Muslims, many of whom had long prohibited investment in businesses associated with slavery, weapons, or alcohol. An early example was the Pioneer Group, a mutual fund founded in 1928 that excluded companies involved in tobacco, alcohol, and gambling.
In the wake of the 1970s campaigns against
the South African apartheid and the Vietnam War, financial institutions offered portfolios that omitted not just companies in the traditional “sin” sectors but also those operating in South Africa or contracting with the US defense department. The Pax World Fund (1971), The First Spectrum Fund (1971) and The Dreyfus Third Century Fund (1972) were early entrants.i
Investors in these funds were motivated more by ethical principles than by the prospect of improving their risk-adjusted returnii—and perhaps just as well, since researchers have found that exclusionary strategies either mirror market returnsiii or slightly underperform them.iv There may have been some financial benefits in the form of lower risk,v particularly during crises, although such outcomes were unintended.vi

9
FROM VALUES TO VALUE
These investors’ impact on corporate behavior was also limited. And in fact a growing body of theoretical and empirical research has challenged the idea that excluding companies from a portfolio, or divesting, is effective as a lever for impact.vii Researchers have found that only a handful of “offending” companies and industries changed their practices in response to the actions of these early funds.
Portfolio optimization and tilting
More recently, ESG investors have gone beyond the binary choice of including or excluding companies. Instead, they will shift the weights of companies within their portfolios to reflect some view of ESG performance—perhaps doubling or tripling the weight of companies with high ESG ratings while removing or reducing the weight of low-rated names. That stands in contrast with an exclusionary investor, who may prefer to invest in a market-cap-weighted S&P 500 index fund that excludes (for instance) oil and gas stocks.
The former practice is often known as “portfolio optimization” or “tilting.” And its goal—unlike that of some exclusionary strategies—may be increasing an investor’s financial risk-adjusted return.
Naturally, researchers have tried to identify formulas that generate above-average returns by tilting toward these higher-performing ESG firms,viii those on an upward improvement trajectory in relation to ESG,ix or those attracting strong ESG sentiment.x
However not all studies corroborate evidence of a strong link, in part due to the inconsistency of the data.xi
The appetite for portfolio optimization and tilt strategies is undeniably strong, but the evidence is still piecemeal.
ESG as a factor in smart-beta strategies
Rather than re-weighting a portfolio based on companies’ ESG performance, investors can also integrate ESG factors into portfolios constructed around other traditional factors as well—like value, momentum, size, volatility, and quality.
Based on recent analyses, companies with the most positive ESG ratings tend to show only moderate overlap with existing strategies, emphasizing ESG’s effectiveness as a standalone factor in investment portfolios. Moreover, since more highly ESG-rated companies tend to exhibit lower volatility, an ESG factor can lead to better risk-adjusted returns in the form of a higher Sharpe ratio. Leaders in the development of the smart-beta ESG factor include RobecoSAM, with their Sustainability Investment Factor,xii and MSCI.xiii These firms are supported by a growing body of research—including, in particular, studies of credit riskxiv—that corroborate the potential risk reduction of those efforts.xv Some studies, however, still dispute the existence of an ESG factor,xvi once again highlighting the need for more consistent and transparent data disclosure.

10
FROM VALUES TO VALUE
The rise of low-fee, passive ESG investingWith high-fee, active managers still struggling to prove they can generate alpha by integrating ESG into their investing processes, investors have turned their focus to cost and convenience. The largest-growth segment in the ESG space has comprised low-fee funds that largely mirror passive indexes, but with the application of exclusion or portfolio optimization and tilting strategies.
Recent trends are clear. Fees for ESG mutual funds have fallen from 1.3% in 2007 to under 1.2% in 2020, and since 2016 there has been
a surge of ESG ETF offerings with fees at or below those of benchmark funds. The downward pressure on fees is diluting the distinctiveness of ESG funds in comparison with their benchmark peers as less distinctive low-fee funds have dominated growth.
When it comes to financial performance, moderate-, high-, and low-fee funds have been roughly comparable: each group has underperformed its respective benchmark by a fraction of a basis point. But ESG performance among the low-fee funds differs more substantively versus peers, actually coming in under the relevant benchmarks.
2007
0%
10%
20%
30%
40%
50%
60%
70%
80%
90%
100%
2008
High Medium Low
2009 2010 2011 2012 2013 2014 2015 2016 2017 2018 2019 2020
Figure 1: Low-fee ESG funds gain share (of assets under management) in 2018-2020

11
FROM VALUES TO VALUE
The upshot is that while investor interest in ESG funds is surging, money is flowing into funds that, by some metrics, have the lowest ESG performance within the category and may even underperform their ESG benchmarks. Many are run by established incumbent asset managers with scant track records in ESG investing. In fact, in some cases these managers simply rebrand existing funds with an ESG label after introducing relatively superficial changes in exclusions or investment strategy. xvii Claims of ESG greenwashing appear justified.
The rise of low-cost ESG options, counterintuitively, raises the bar for those trying to integrate ESG factors into their investing decisions in core and fundamental ways. Specialist asset managers pursuing “active” ESG strategies and seeking to fuse traditional financial and new ESG analysis now have to compete for new business not only with early ESG entrants, but also with mainstream incumbents offering the lure of cheaper alternatives. New ESG investors will need a clear, compelling, and convincing evidence-based proposition if they are to overcome inbuilt loyalty to incumbent fund managers.
The path forward for ESG investment
The challenge for investors lies in the temptation to pander to stakeholder pressure just by purchasing a new ESG data set or by hiring some token specialists. Investors must find ways to fully integrate a company’s
ESG characteristics into their investment decisions if they are committed to the belief that a company’s impact on society and the environment affects that firm’s ability to generate long-term value. Only then will ESG move from its current status as temporary fad to a permanent position in best-in-class investing.
But, not surprisingly, skepticism is widespread. Annual surveys by the Callen Group over the last five years suggest that the majority of institutional investors do not consider ESG factors to be material to financial performance. The minority of respondents who have incorporated ESG factors into their investment decisions cite a mix of stakeholder pressures, values- or impact-based arguments, potential correlations with risk, and financial returns. Significantly, the prospect of “higher long-term returns” is one of the weakest incentives.
Two trends in ESG investing may illuminate the way forward. The first is fully integrating ESG factors into the fundamental financial and operational analyses that investors already rely on. The second is working as an active owner: engaging directly with companies to improve and, in doing so, increasing their value. Both of these promise to take ESG investing well beyond its current trajectory.
ESG integration
Rather than allowing a company’s ESG performance to inform its weight in a portfolio, true integration of ESG into

12
FROM VALUES TO VALUE
fundamental analysis requires a bottom-up process in which environmental, social, and governance issues are integrated into financial-model forecasts. This means ESG data would not be held as a distinct factor, but would instead be used in assessing such line items as revenue, operating margins, and risk that ultimately drive the numerator of intrinsic valuation and the expected return. ESG factors are financially material because they can affect top-line growth, costs and margins, regulatory and legal interventions, employee productivity, and investment and asset optimization.xviii
Investors have recently indicated a preference for scenario-based analyses as the best way to quantify ESG-related issues,xix especially following calls by regulatory bodies like the Financial Stability Board’s (FSB) Task Force on Climate-related Financial Disclosures (TCFD) for companies to report their own climate change scenarios.
An important challenge for the future will be training analysts to integrate ESG factors, including regulatory risk, gender diversity, energy efficiency, and human rights, into their core business assessments. Analysts may know the businesses they cover inside and out, but they do not necessarily have the expertise on climate, human rights, or other ESG issues that would be required in order for them to ask companies the right questions, to adjust their fundamental models, or to make recommendations based on an integrated assessment of the traditional and non-traditional factors that will influence long-term returns. Such
training is not only time-consuming but is also likely to encounter industry resistance given the immediate costs of investments in human capital, data, and modeling versus the further-out benefit of higher returns, which may not emerge for three to five years.xx And the dominance of passive, low-cost investment strategies stands to amplify the reluctance to accept this J curve. Not surprisingly, this same challenge also exists within companies seeking to invest in better ESG practices.
For ESG investors, the Holy Grail is successfully integrating reliable ESG data into broader financial analysis. At the moment a company’s weight in an ESG-orientated portfolio is typically determined by ratings that are often inconsistent and uncorrelated, and which therefore provide a crude ranking that may have the zip of emojis but about as much rigor as well. What’s lacking is a bottom-up process that reflects the impact of ESG issues on a company’s value.
The industry needs to build those new capabilities, even amid the current challenging environment.
Active ownership and corporate engagement
All of the strategies above—both historical and current—have focused on using ESG to make investing decisions. But none address how investors can use ESG factors to determine their engagement with companies once those shares are purchased. Here, again, we’re seeing a possible new direction for the ESG movement.

13
FROM VALUES TO VALUE
Pension funds in Europe and the US have long engaged on ESG (and particularly on governance issues), among them CalPERS, NBIM, and APG. Endowed with “partnership” mindsets, long-term investment horizons and sizeable ownership stakes, at times these players have had a significant impact on corporate strategy and behavior—as well as on financial performance.
From 1987 to 2010, for example, CalPERS targeted a small number of companies it deemed to be underperforming on governance—notably in board quality and diversity, reporting transparency, investor rights, management of environmental and social issues, and shareholder alignment on executive compensation. The agency highlighted those companies in a name-and-shame campaign called the Focus List. Then, after 2010, it shifted to a more private engagement strategy.
The impact has been significant. In 2014 Wilshire Associates, a consultant to the CalPERS board, published an analysis of the 188 companies in the Focus List program for the period between 1999 and fall 2013. These outperformed their Russell 1000 sector benchmarks by 11.9%.xxi
Other studies have likewise found evidence that engagement can both yield higher financial returns and prompt companies to take remedial action. One looked at plants targeted by the New York City Pension System’s Boardroom Accountability Project, and it found substantial reductions in toxic
releases, greenhouse gas emissions, and cancer-causing pollution due to the firms’ investments in abatement technology.
Coordination by activists appears to be a determinant of successful engagements.xxii One study examined thirty-one campaigns on the Principle for Responsible Investing platform, and it found that coalitions with a lead investor from the same country as that of the targeted company, and a wide array of capable and influential supporters, are more likely to drive change and boost performance.xxiii Similar results are reported in a study of 256 engagements conducted by the Canadian Coalition for Good Governance.xxiv
So engagement appears to be a more effective way to achieve change than are exclusionary screens, although it is nevertheless more costly and allows other stakeholders a “free ride.” In this context, the recent concentration of the asset-management industry may be beneficial. Some argue, however, that index-based investing (which allows for a swift exit) limits the scope of big funds in their ability to make a significant impact, and that the same applies to the conflict of interests inherent in these firms’ management of corporate pension funds. Whatever the reasons, the current pace and scope of engagement activity is certainly insufficient for achieving such systemic change as that sought by the net-zero emissions target or the Sustainable Development Goals of the United Nations.

14
FROM VALUES TO VALUE
Conclusion: From values to value
Through its history, ESG investing has meant many things to many people. For the earliest responsible investors, it was a way to purge “sin stocks” from their portfolios. But for some recent investors the question has changed from “How pure is my portfolio?” to a new question: “What impact do my investments have?”
When investors begin with the “pure” question, it makes sense to look at each
company’s sector, ratings, or scores. But the more pragmatic “impact” question is being asked by an increasing number of investors. To answer this, they must understand how their investing decisions affect a company’s operations and externalities, and how those operations and externalities then influence that company’s performance.
To do this, they must eschew the simplifying “purity” approaches of exclusion or portfolio optimization and tilting, and instead focus on the hard “impact” work of true ESG integration and active ownership.

15
INTRODUCTION
THE DATA DILEMMAThe Flaws in ESG Metrics, Ratings, and Analysis
02
16
THE DATA DILEMMA
Without objective, consistently available data on ESG performance
it’s difficult to constructively pursue any of the ESG-investing
strategies we’ve described. While some norms have evolved,
there is still no regulatory guidance regarding what to disclose and
in what form. Indeed, questions pertaining to data integrity and
reliability act as significant constraints on researchers in the field.
The environmental and social activists who developed ESG data-reporting standards were concerned about quantities of output by firms or incidents, and this focus persists in the vast majority of current reporting by the companies and third-party rating agencies that process this data into rankings or scores. Increasingly, however, the audience for this data—ESG data consumers—are financial analysts seeking to integrate ESG information into their investment strategies. This presents a significant challenge, as many analysts are not well versed in the technical and engineering components of environmental mitigation. Therefore, determining actual environmental impact is somewhat subjective, even with a rating system.
These financial analysts and modelers have adapted to the norms of disclosure. But ultimately they have to integrate ESG performance into a dollar-denominated financial model even as such performance is typically measured in various units of output or standardized into scores. They do this without the scientific knowledge of conversion factors, relying on simple
correlations and data analysis rather than any overarching theory or framework.
Again, these analysts and modelers are left with the ESG equivalent of emojis—extremely difficult to integrate into the analysis of a company’s growth rates, profits, or potential losses. We need to bring new data to the discussion and follow this by asking different, more substantive questions.
The state of ESG data today
Thanks to much-improved standards of corporate disclosure, the quantity of ESG data has grown substantially in recent years. In 2021, for example, Bloomberg terminals offered 900 ESG data fields for 13,000 companies covering the last twelve years, amounting to 140 million data points (against 6 million in 2015 and just 1.5 million in 2010). By 2016, 81% of S&P 500 components were issuing sustainability reports, and by 2020 that number had increased to 90%.
Impressive as this sounds, there are wide variations in the content and format of these

17
THE DATA DILEMMA
disclosures. By one count, there are now more than 230 corporate sustainability standard initiatives; another study, meanwhile, found twenty different reporting schemes for employee health and safety data alone.
In order to address the growing proliferation of metrics and standards, the World Economic Forum’s International Business Council (WEF IBC), in cooperation with the Big Four accounting firms (Deloitte, EY, KPMG, and PwC), has offered a harmonized set of twenty-one core and thirty-four expanded metrics for ESG reporting that are aligned with the existing framework and standard-setting bodies.
In addition to competing standards, a host of private-sector data providers offer proprietary ratings, each with its own adjustments and weighted indexes or scores.
Examples include Kinder, Lydenberg, Domini & Co, Sustainalytics, ASSET4, and Vigeo Eiris. All of these providers follow distinct methodologies for use of voluntary disclosures as they construct measures of a company’s social performance relative to some absolute standard of practices, processes, and outcomes.
Innovest, launched in the late 1990s, has sought to provide scores as a proxy for the value of such intangible assets as the environment, human capital, stakeholder capital, and
strategic governance. Its ratings explicitly compare a company with industry peers, and they are designed to help investors achieve supranormal risk-adjusted returns through portfolio optimization and tilting and smart-beta strategies. RobecoSAM was among those that adopted this same approach.
As interest in ESG data has developed among mainstream financial investors over the last ten years, the primary financial-service data providers have acquired their own expertise, often through the acquisition of ESG data providers.1 More recently a new breed of player has been using web crawlers and natural language parsing, often combined with artificial intelligence, in an attempt to supplement companies’ voluntarily released information with relevant media-event data and other unstructured text.2
Notwithstanding this flood of third-party rankings and increased voluntary corporate disclosure, much of the new data is inconsistent and it often omits the most material information—and it is, therefore, of limited financial value to investors. A recent study characterizes the field of ESG metrics as one of “Aggregate Confusion.”3 We feel that while this is a start, we need to expand the reporting metrics and standards to include more rigorous scientific and engineering principles, grounded in robust and representative data science and analysis.
1 KLD and Innovest were taken over by MSCI, which also acquired ISS; Sustainalytics was acquired by Morningstar which also collaborated with Glass Lewis; ASSET4 was acquired by Thomson Reuters, which also owns 45% of Refinitiv; and Vigeo Eiris was taken over by Moody’s, and RobecoSAM by ORIX.
2 Examples include TruValue Labs, Arabesque, Ravenpack, RepRisk, government regulatory filings (SenseFolio and SigWatch), NGO statements and reports (TruValue Labs, Reprisk, Sigwatch).
3 Berg, F., Koelbel, J. F., & Rigobon, R. 2019. Aggregate Confusion: The Divergence of ESG Ratings: MIT Sloan School of Management.
18
4 Boffo, R., & Patalano, R. 2020. ESG Investing: Practices, Progress and Challenges: OECD. 5 Doyle, T. M. 2018. Ratings That Don’t Rate: The Subjective World of ESG Rating Agencies: American Council for Capital Formation. 6 LaBella, M. J., Sullivan, L., Russell, J., & Novikov, D. 2019. The Devil Is in the Details: The Divergence in ESG Data and Implications for
Sustainable Investing: QS Investors, Lopez, C., Contreras, O., & Bendix, J. 2020. ESG Ratings: The Road Ahead. Munich Personal RepEc Archive, 103259.
7 Dorfleitner, G., Halbritter, G., & Nguyen, M. 2015. Measuring the Level of Corporate Responsibility: Journal of Asset Management.8 Avramov, D., Cheng, S., Lioui, A., & Tarelli, A. 2020. Investment and Asset Pricing with ESG Disagreement. Available at SSRN: https://ssrn.
com/abstract=3711218 or http://dx.doi.org/10.2139/ssrn.3711218.
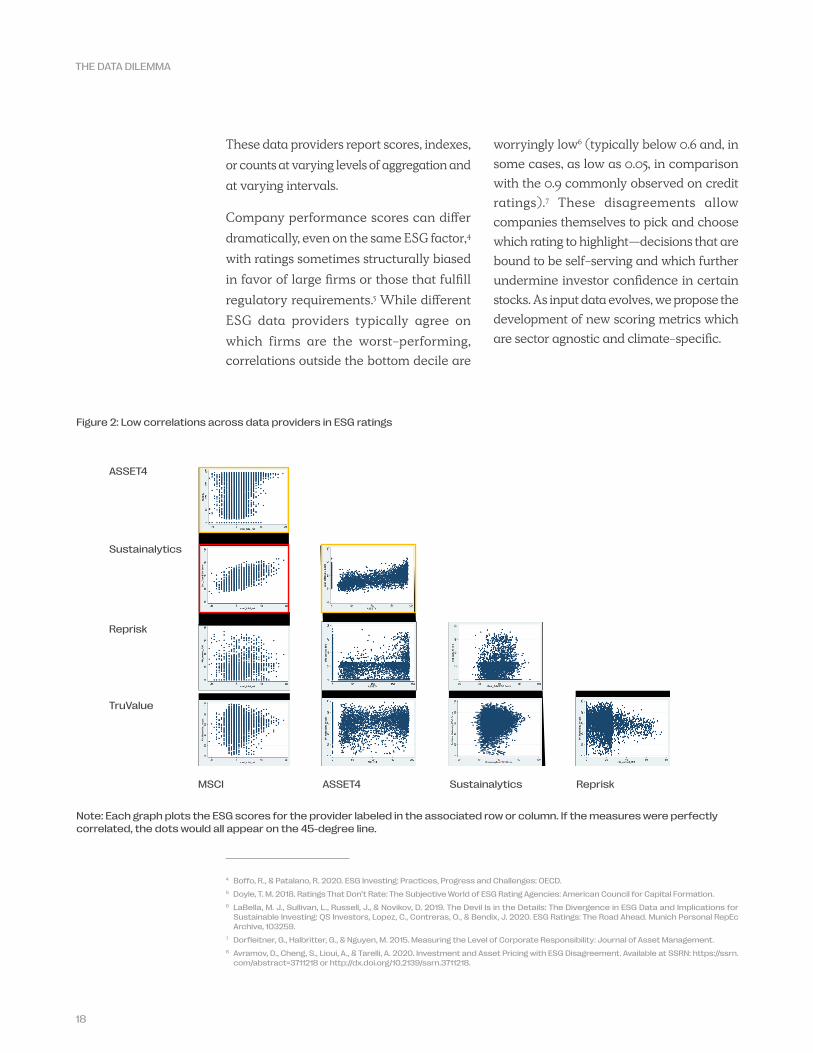
Figure 2: Low correlations across data providers in ESG ratings
Note: Each graph plots the ESG scores for the provider labeled in the associated row or column. If the measures were perfectly correlated, the dots would all appear on the 45-degree line.
ASSET4
Sustainalytics
Reprisk
TruValue
MSCI ASSET4 Sustainalytics Reprisk
THE DATA DILEMMA
These data providers report scores, indexes, or counts at varying levels of aggregation and at varying intervals.
Company performance scores can differ dramatically, even on the same ESG factor,4 with ratings sometimes structurally biased in favor of large firms or those that fulfill regulatory requirements.5 While different ESG data providers typically agree on which firms are the worst-performing, correlations outside the bottom decile are
worryingly low6 (typically below 0.6 and, in some cases, as low as 0.05, in comparison with the 0.9 commonly observed on credit ratings).7 These disagreements allow companies themselves to pick and choose which rating to highlight—decisions that are bound to be self-serving and which further undermine investor confidence in certain stocks. As input data evolves, we propose the development of new scoring metrics which are sector agnostic and climate-specific.

19
Figure 3: Divergence in ESG ratings across large, global companies
Source: MSCI, Sustainalytics, RobecoSAM, and Refinitiv. Ratings as of February 2019. Rating Agency 1 represents MSCI ESG ratings, Rating Agency 2 represents Thomson Reuters ESG ratings, Rating Agency 3 represents Sustainalytics ESG ratings, Rating Agency 4 represents RobecoSAM ESG ratings. Link here: https://www.leggmason.com/content/dam/legg-mason/documents/en/insights-and-education/whitepaper/lm-qs-the-devil-is-in-the-details-0919.pdf.
APPLE
AMAZON
JP MORGAN BERKSHIRE HATHAWAY
MICROSOFT
ESG
ESG
ESG
Environmental
Environmental
Environmental
Rating agency 1 Rating agency 2 Rating agency 3 Rating agency 4
Social
Social
Social
Governance
Governance
Governance
0
0
0 0
0
025
25
25 25
25
2550
50
50 50
50
5075
75
75 75
75
75100
100
100 100
100
100
THE DATA DILEMMA

20
Figure 4: Correlation at aggregate ESG level and at E, S, and G levels
Figure 5: Correlation between rating agencies at the level of categories (SASB taxonomy)
SA - VI SA - KL SA - RS SA -A4 VI -KL VI - RS VI -A4 KL -RS KL - A4 RS - A4
ESG 0.73 0.53 0.68 0.67 0.48 0.71 0.71 0.49 0.42 0.64
E 0.70 0.61 0.66 0.65 0.55 0.74 0.66 0.58 0.55 0.70
S 0.61 0.28 0.55 0.58 0.33 0.70 0.68 0.24 0.24 0.66
G 0.55 0.08 0.53 0.51 0.04 0.78 0.77 0.24 -0.01 0.81
Econ - - - - - - - - - 0.43
KL:A4 KL:RS KL:SA KL:VI RS:A4 RS:SA SA:A4 VI:A4 VI:RS VI:SA Average
GHG Emissions -0.12 -0.07 -0.05 0.40 0.44 0.63 0.57 0.71 0.34 0.32
Air Quality 0.42 0.42
Energy Management 0.27 0.31 0.12 0.24 0.22 0.26 0.30 0.45 0.37 0.38 0.29
Water & Wastewater Management 0.23 0.20 0.31 0.32 0.12 0.42 0.40 0.40 0.47 0.47 0.33
Waste & Hazardous Materials Management
0.27 0.36 0.36 0.33 0.17 0.20 0.40 0.37 0.46 0.38 0.33
Ecological Impacts 0.43 0.42 0.49 0.40 0.70 0.71 0.65 0.59 0.70 0.66 0.57
Human Rights & Community Relations
0.17 0.16 -0.26 0.23 0.64 -0.12 0.06 0.52 0.54 -0.01 0.19
Customer Privacy 0.32 0.36 0.27 0.32
Access & Affordability 0.45 0.53 0.58 0.48 0.65 0.48 0.53
Product Quality & Safety 0.02 0.19 0.02 0.05 0.37 -0.10 -0.05 0.25 0.49 -0.09 0.11
Customer Welfare -0.02 -0.04 0.23 -0.09 0.46 -0.13 -0.13 0.52 0.50 -0.06 0.12
Selling Practices & Product Labeling
0.20 -0.34 -0.47 -0.08 -0.11 0.60 -0.07 0.00 0.43 0.40 0.06
Labor Practices 0.16 0.10 0.20 0.26 0.42 0.46 0.40 0.51 0.57 0.56 0.36
Employee Health & Safety 0.28 0.24 0.04 0.30 0.57 -0.15 -0.16 0.71 0.63 -0.14 0.23
Employee Engagement, Diversity & Inclusion
0.15 0.16 0.13 0.18 0.61 0.40 0.55 0.56 0.51 0.58 0.38
Product Design & Lifecycle Management
0.36 0.32 0.26 0.13 0.54 0.37 0.52 0.35 0.38 0.46 0.37
Supply Chain Management 0.16 0.11 0.17 0.17 0.56 0.53 0.53 0.63 0.64 0.56 0.41
Materials Sourcing & Efficiency 0.59 0.33 0.34 0.42
Physical Impacts of Climate Change
0.44 0.45 0.56 0.48
Business Ethics 0.27 0.02 0.05 0.00 -0.18 0.50 -0.13 -0.17 0.57 0.57 0.15
Competitive Behavior 0.55 -0.04 -0.05 0.15
Management Legal & Regulatory Environment
-0.02 0.09 -0.02 0.02
Critical Incident Risk Management 0.03 -0.21 0.07 -0.04
Systemic Risk Management 0.26 0.26
0.23 0.21 0.13 0.15 0.37 0.30 0.26 0.39 0.53 0.34
Correlations between the ratings on the aggregate level (E, S, G, and ESG) from the five different rating agencies are calculated using the common sample. The results are similar using pairwise common samples based on the full sample. SA, RS, VI, A4, and KL are short for Sustainalytics, RobecoSAM, Vigeo-Eiris, ASSET4, and KLD, respectively.
Correlations between the different categories from different rating agencies. We calculate a value for each criterion on the firm level by taking the average of the available indicators for firm f and rater k. As indicators depend on industries the values of the same criterion but for different firms might not use the same indicators as input. The panel is unbalanced due to differences in scope of different ratings agencies and categories being conditional on industries. The SASB categories of data security and business model resilience are not displayed in this table, because either none or only one of the rating agencies provides indicators for these categories.
THE DATA DILEMMA

21
Sector-specific materiality
One response to this inconsistency has been growing support for materiality: the principle that what is measured and disclosed should be material to investor decision-making, with the understanding that what is material is likely to drive financial performance. In our view, materiality has become an ESG buzzword—we propose to give it meaning through the Total Value Framework.
The Sustainability Accounting Standards Board (SASB) pioneered materiality-based ESG metrics with its trademarked Materiality Map—an interactive tool that provides a snapshot of sector-specific ESG issues deemed material to a reasonable investor, and first inspired by the Harvard Initiative for Responsible Investment.8 “Reasonable investor” is defined within the SASB’s methodology as “an investor who invests primarily for economic reasons with a variety of investment horizons—from short-term to long-term—and investment strategies—from income generation to asset valuation.”9 “Materiality” follows the U.S. Supreme Court definition in US securities law as presenting “a substantial likelihood that the disclosure of the omitted fact would have been viewed by the reasonable investor as having significantly altered the total mix of the information made available.”10 The tool is regularly updated via the SASB’s test-based methodology for
determining sector-specific materiality.
The Materiality Map encompasses thirty generic sustainability issues—everything from labor relations to GHG emissions, and covering five sustainability dimensions applicable to most industries11 (environment, social capital, human capital, business model and innovation, and leadership and governance). Three tests determine potential sector-specific materiality: “evidence of interest,” which utilizes a keyword-based heat map to determine which general sustainability issues are most important to investors and other key stakeholders; “financial impact,” which pertains to the likely impact of management decisions on future valuations; and “forward-looking impact,” intended to identify issues not previously captured that could prove systemically disruptive in the future.
The resulting interactive Materiality Map then shows the relative significance to the sector of each of these generic sustainability issues.
As former SASB CEO Jean Rogers has explained, this empowers companies to “focus their sustainability strategies on the most important issues” while providing “investors with a ‘heat map’ of portfolio exposure to sustainability risks and opportunities.”12
The Total Value Framework proposes moving the discussion from heat maps to actionable insights around a company’s environmental and financial performance.
9 Lydenberg, S., Rogers, J., & Wood, D. J. 2010. From Transparency to Performance: Industry-Based Sustainability Reporting on Key Issues: Initiative for Responsible Investment.
10 Sustainability Accounting Standards Board (SASB). 2013. Conceptual Framework of the Sustainability Accounting Standards Board. 11 Mooney, C. 2014. GRI & SASB: An Understanding of Alignment: BrownFlynn. 12 Rogers, J. 2016. Remarks to the SEC Investor Advisory Committee. Prepared remarks. 13 Ibid.
THE DATA DILEMMA

22
The adoption of the concept of materiality—incorporated into existing and new third-party ratings by the likes of MSCI,13 RobecoSAM,14 and TruValue Labs15—has improved the quality of ESG portfolio optimization (or tilting) and smart-beta strategies, and has made corporate engagement more effective.
But the new methods still fall short of true ESG integration, which requires a new class of metrics divorced from the inconsistent, subjective scores that still prevail. Correlations with financial outcomes remain low for these scores, and the rationales of different data providers are opaque.
Without clearer meaning and definitions, auditors will continue to struggle to fully integrate ESG data into financial reports. And as long as the interpretation of data is more art than science, any widespread effort to train analysts on how to appropriately model ESG data will remain elusive.
Corporate ESG reportingSome companies, meanwhile, have also been trying to embrace the idea of materiality in their reporting. One approach has been to break out what is financially material in sustainability reports. Others have sought to quantify the impact of firm activity on the natural environment; to calculate the multiplier effect of poverty levels, employment, and tax payments on the wider economy; to measure the upside of worker benefits, training and other non-monetary compensation (in terms of, for example, reduced injuries or improved quality of life); and to catalogue measures of customer welfare, such as willingness to pay.
Early adopters include Puma, with its Environmental Profit & Loss Account; Unilever, with assessments of its total impact on poverty in Indonesia (this grew into “brand imprint” assessments globally); and Standard Chartered and Newmont Gold with their efforts to
14 MSCI provides materiality-based ESG ratings meant to convey the ESG risks and opportunities of specific issuers relative to sector peers, as defined by Global Industry Classification Standard (GICS) sub-industry levels. To establish materiality, MSCI identifies thirty-seven key issues within each industry across ten themes within the three categories of environmental, social, and governance. Examples of key issues include carbon emissions, labor management, and ownership structures. Each key ESG issue is mapped annually using a quantitative assessment that looks at the range and average values of each industry for externalized impacts, and subsequently produces a sector-specific weighting. These key issue scores are then weighted within the context of the E, S, and G pillars to arrive at ratings of AAA-CCC. Melas, D., Nagy, Z., & Kulkarni, P. 2016. Factor Investing and ESG Integration: MSCI.
15 RobecoSAM’s sustainability rating, or smart score, process begins with its annual Corporate Sustainability Assessment designed to capture industry-specific and financially material sustainability factors under three distinct dimensions: environmental, social, and economic (including governance). Invited to participate in the annual assessment are the 3,400 largest publicly traded companies globally based on float-adjusted market capitalization. Each sector has its own questionnaire based on rules-based materiality derived from years of assessment responses and the expertise of RobecoSAM’s internal sustainability analysts. Questions include the extent to which firms disclose material ESG risks, undertake sensitivity analysis on ESG factors, monitor key performance indicators covering these factors, and incent their managers according to performance on these metrics. Additional detailed questions cover such topics as climate risk, supply chain risks, diversity, water risks, and community risks. The full questionnaire extends beyond one hundred pages for some firms. To construct a rating, each question and dimension is assigned a weighting based on the materiality assessment and ultimately aggregated into a sustainability score of 0-100. To eliminate bias in determining materiality and subsequent weights, RobecoSAM balances the number of criteria chosen for each dimension and, drawing on its historical database, establishes criteria significance through multi-variate regression. The result is a score that can be used to inform active investors in their fundamental analyses and as an input for RobecoSAM’s own Sustainability Investment Factor.
16 TruValue Labs takes a slightly different approach than the two aforementioned providers. Through a unique combination of artificial intelligence, machine learning, and sector-specific materiality, as defined by the SASB, TruValue provides score-based ratings in real time to end users through its Insight360 platform. In a three-step process that begins with aggregating data from 75,000-plus sources, Insight360 extracts sustainability content and categorizes it into fourteen categories (some of which can be user-customized). The data is then normalized within each SASB category and weighted by timeliness, frequency, and intensity to provide end users with a dynamic scorecard of real-time ESG updates. A multitude of ESG categories, in addition to an overall category, are scored on a scale of 0 to 100, with scores above 50 indicating positive ESG-related sentiment, and those below 50 indicating negative sentiment. These scores are available in a long-term trend score, a momentum score that shows the direction in sentiment, and a short-term “Pulse” score.
THE DATA DILEMMA

23
assess the total contributions of their upstream and downstream operations to the Ghanaian economy. Moreover, PwC’s Total Impact Measurement and Management (TIMM), EY’s Total Value Framework, Deloitte’s Social Impact Measurement Model (SIMM), and KPMG’s “New Vision of Value” have synthesized and standardized methodologies for estimating the impact of corporate actions on the natural environment, economies, workers, and consumers. In academia the Return on Sustainability Investment (ROSI) framework and toolkits—developed by Tensie Whelan at the Center of Sustainable Business at New York University’s Stern School of Business—provide off-the-shelf spreadsheets and guides for identifying and measuring the mechanisms by which sustainability investments can improve financial performance. The Impact Weighted Accounts Initiative, led by George Serafeim at Harvard Business School, uses voluntarily reported corporate data for the assessment of thousands of companies.
Each firm is, however, allowed to choose the measures and methodologies it wishes to report. So the temptation, particularly for recent corporate adopters, is to make one’s self look better in the eyes of stakeholders without changing underlying practices. Standardization of all these frameworks is therefore a vital next step.
Conclusion: Moving toward a new approachThe financial world has been flooded with new ESG data in recent years, with no end in sight. But despite the growing amount of ESG data and the sophisticated nature thereof, there are still three principal challenges:
metrics are unstandardized, ratings are uncorrelated, and analysis is disconnected from the other financial and operational analysis conducted by investors.
But as investors begin to move from the aforementioned “pure portfolio” question to that of actual impact, we believe they will approach ESG in new ways.
• Analysis is integrated: The connection between investors’ actions, their social and environmental impact, and the companies’ financial performance becomes the most important question, rather than a merely incidental one.
• Metrics and ratings focus on change: Rather than attempting to gauge which companies are “good” or “bad,” investors consider how their investment in a company may improve it and heighten the value it delivers to society. If equipped with this mindset, then standardized, well-correlated ratings and scores become more useful as measures of improvement rather than remaining fixed, point-in-time assessments.
• Investors become active owners: Rather than excluding companies from their portfolios or underweighting them, investors focus on how their votes, or the work they do with companies, can be a critical lever in creating long-term value for shareholders and stakeholders. Already among those showing the way here are pension funds rooted in the labor movement, with a culture that is unafraid of exercising power to create change.
All of this requires investors to approach ESG as a new way of seeing value—something that we believe our Total Value Framework can help accomplish.
THE DATA DILEMMA

24
INTRODUCTION
THE ENGINE NO. 1 TOTAL VALUE FRAMEWORK
Building a Better Way
03

25
THE ENGINE NO. 1 TOTAL VALUE FRAMEWORK
We’ve developed our Total Value Framework to address the current deficiencies in ESG data and to help investors generate a lasting impact on corporate behavior and robust long-term financial returns. To that end, we have worked to develop a unique method of measurement that focuses on both the value that companies create or destroy for shareholders and stakeholders, as well as on the connection between these two groups.
• Value for stakeholders: Through the Total Value Framework, we attempt to measure the value that companies create or destroy for both shareholders and stakeholders—their employees, customers, and communities, as well as the environment. We try, where possible, to quantify the impact in dollars instead of
using traditional ESG scores and ranks—which, again, may as well be emojis, as they are just as difficult to incorporate into spreadsheets or algorithms. In service of this, we use independent sources and estimates to assess the firm-level cost of emissions, resource use, waste, social practices, and a host of other ESG factors.
• Value for shareholders: Armed with this new data, we can proceed to focus on how the value delivered to stakeholders affects the value a company is then able to deliver to its shareholders. This forces us to examine drivers like potential regulation, changes in customer or employee preferences, technological disruption, and other relevant contributors to a company’s risk or growth.
Up until now the thrust of most ESG strategies has been to find the
answer to a simple question: are the companies we’re investing in
good, or are they bad? By doing this we could exclude sinners—or
at least reduce their weight in our portfolios—and enjoy a warm
glow of moral satisfaction. But what we couldn’t do was link our
values about right and wrong to the source of long-term financial
value and profitable investing.
That’s why we believe that Engine No. 1’s new Total Value
Framework is such an important step forward. It’s a data-driven
approach to investing that puts tangible value on a company’s
environmental, social and governance impacts and then ties those
impacts to long-term financial value creation.

26
THE ENGINE NO. 1 TOTAL VALUE FRAMEWORK
For example, we can show that variations in the level of value created or destroyed for stakeholders strongly predict future shifts in the company’s financial value, including in revenues, worker productivity, earnings, net income, market capitalization, and earnings multiples. Indeed, the association between stakeholder value and these financial outcomes has turned out to be far stronger and more robust than have the correlations observed between traditional ESG metrics and these same outcomes.
Crucially, the framework’s analysis informs our decisions as investors—the investments we make, as well as what we do as owners once we make those investments. We believe investors can only effect lasting change when they work as active owners. With the Total Value Framework, we come armed with an approach that is rooted in data, connected to value, integrated with our investing process, and focused on change. We also stress the importance of attribution–in our view, understanding causal factors is more important than constructing a deterministic model.
By embracing these principles, we believe ESG investing can harness private capital on the scale needed to address systemic challenges like climate change. Only then will the potential of ESG funds translate into the better financial returns and the corporate, societal, and environmental outcomes they were always meant to deliver.
Better analysis
Rather than use a performance ranking based on another set of subjective criteria, our
methodology integrates reliable ESG data into mainstream financial reporting and attempts to understand and accurately predict how ESG performance affects future valuations.
We put a dollar value on the uncompensated consequences of production or consumption that impact third parties and are not reflected in market prices—so-called negative and positive externalities—such as the costs of respiratory disease from burning diesel, or the costs of lost biodiversity when forests are cleared for palm oil production. An understanding of such “externalities” is critical to any ESG approach.
By measuring the financial value of these externalities, in terms of both positive and negative corporate impacts, the Total Value Framework allows much better comparisons between the performance of firms over time and across industries. That, in turn, leads to better predictions of their impact on future market valuations, which makes it easier to identify the conditions under which ESG performance is likely to be financially material. Perhaps most importantly, the monetization of ESG performance makes it possible to fully integrate ESG factors into mainstream financial analysis and help to overcome some of the inadequacies of subjective and biased data.
Remedies for significant negative externalities often involve imposing costs on the “offending” producers or consumers, a process referred to as “internalization.” This most commonly takes the form of government regulation. For example, the Clean Air and Clean Water acts, passed in the US in the 1960s and 1970s, required

27
THE ENGINE NO. 1 TOTAL VALUE FRAMEWORK
polluting businesses to reduce pollution levels and to pay for some of the costs associated with residual pollution. Also driving internalization are consumer pressure and purchasing decisions, which are often informed by public campaigns from NGOs focused on environmental and social issues. Further internalization comes when local communities successfully sue major corporations for unlawful dumping of waste, or when they demand compensation and damages after high-profile environmental incidents, and companies are then hit with the associated compensation costs and punitive damages. Environmental decline on its own can lead to internalization: witness the disruption to operations, the price volatility in agricultural commodities, and other costs stemming from droughts, floods, soil erosion, and pests.
Similarly we believe that firms that create significant positive externalities will be rewarded over time as regulators treat them favorably, as employee satisfaction grows, and as customers become more inclined to buy their products. Figure 6 illustrates the relationship between the total externalities imposed on stakeholders and the costs internalized by a business.
Figure 7 provides an alternative way of looking at the relationship between stakeholder impacts and shareholder value at the firm level. In the “current state,” the maximization of profits for shareholders is achieved at the expense of workers, customers, and suppliers. This leads to a stakeholder backlash (bottom right) and an erosion of shareholder value. By shifting to a more positive stakeholder orientation (top right) a business can deliver sustainable shareholder returns.
Figure 6: Illustration—internalization of positive externalities over time
Today
Tota
l Be
ne
fits
Time
Business Revenues
External Benefits

28
THE ENGINE NO. 1 TOTAL VALUE FRAMEWORK
By measuring net externalities in addition to shareholder value, Engine No. 1’s Total Value Framework captures the positive and negative externalities generated by a company throughout its value chain. As shown in Figure 8, net externalities are the sum of negative and positive externalities. For an unsustainable business, net externalities are negative and stakeholder value will be lower than shareholder value. In the medium term some of this net externality is likely to be internalized, reducing shareholder value, while some may remain unaccounted for as a residual externality. The final bar illustrates the effect on long-term shareholder value, which is
reduced by the amount of the externality that is internalized.
Conversely, a business that creates net positive value for stakeholders would expect higher long-term shareholder value. This is because its net externalities are positive and a proportion of this may be internalized over time, as shown in Figure 9.
The elements of our frameworkEngine No. 1 uses independent sources and estimates to assess the firm-level cost of emissions, resource use, waste, social practices, and a host of other ESG factors.
Firm
Shareholders
Broadersocietalimpacts
Civilsociety
Government
Community
Suppliers
Customers
Workers
Firm
Shareholders
Broadersocietalimpacts
Civilsociety
Government
Community
Suppliers
Customers
Workers
Figure 7: Illustration of the long-term effects of narrow profit maximization versus positive stakeholder orientation
Current state Future state
Firm
Shareholders
Broadersocietalimpacts
Civilsociety
Government
Community
Suppliers
Customers
Workers
Status quo focus on short-term shareholder value triggers stakeholder backlash and long-term shareholder value erosion
Strategy shift to build long-term stakeholder (and shareholder) value

29
THE ENGINE NO. 1 TOTAL VALUE FRAMEWORK
Figure 8: Long-term shareholder value for an unsustainable business
Figure 9: Long-term shareholder value for a sustainable business
Value
Shareholdervalue
Stakeholdervalue
Long-term shareholder value
Internalizedexternality
value
Residualexternality
valuePositiveexternalities
Netexternalities
Negativeexternalities
Non-sustainablebusiness
Sustainablebusiness
Value
Shareholdervalue
Stakeholdervalue
Long-term shareholder value

30
THE ENGINE NO. 1 TOTAL VALUE FRAMEWORK
The framework utilizes a number of environmental and social factors: Climate Change, Air Quality, Water Consumption, Land Use, Waste, Human Rights, Corruption/Bribery/Fraud, Community Relations, Customer Privacy/Data Security, Product Quality/Safety, Employee Health/Safety, Training/Development, and Diversity/Inclusion, among others. The evolving framework is comprehensive across the supply chain, capturing the financial costs of upstream and downstream impacts as well as those stemming from the firm’s own operations. As we refine our investment strategies by sector and incorporate more attribution measures, the power of the Total Value Framework will become stronger.
Some factors are easier to measure than others. Tracking the cost of greenhouse gases (GHGs) is relatively easy: techniques are increasingly available for converting company emissions into tons of carbon dioxide equivalent and calculating the effect on global welfare. Similarly, it’s possible to compute the social cost of other forms of air pollution, negative effects on land and biodiversity, waste and water consumption, the adverse health consequences of tobacco and alcohol production, and workplace injuries and fatalities. The social consequences of wages that fall below a minimum standard, or the financial benefits of worker training and voluntary community philanthropic expenditure, can also be monetized.
Of all the factors in our framework, GHG data may be the most widely reported, either by companies themselves or by a host of specialist data providers. But a lack of
objective audited data remains the biggest obstacle to assessing a company’s ESG performance. Further, we believe a lack of visibility or accountability as it concerns Scope 3 emissions makes mainstream ESG an arbitrary measure, at best. As recently as the start of 2020, for example, neither BP nor ExxonMobil had published downstream emissions data relating to sales of oil and gas. Where companies do not report the relevant information, we’re forced to impute data from models that draw upon sources such as the United Nations, the International Labor Organization, the Organization for Economic Cooperation and Development, or the European Union. In the absence of reliable primary data, we sometimes have to settle for adjusted industry averages of ESG performance. In all cases, we validate the results to identify outliers or discontinuous jumps and seek out alternative algorithms to fill in gaps.
Better investing
The magnitude of these net externalities varies significantly across sectors, with some showing ten times other sectors’ externalities per dollar of revenue. The obvious question is: what correlation, if any, can we detect between a company’s externalities and its shareholder value?
Our initial analysis strongly supports a far more consistent and powerful association than that found via traditional ESG data. It shows that the difference between a firm’s Total Value and its shareholder value, and changes in those net externalities relative to industry peers, are strongly indicative of future changes in financial outcomes. Between 2010 and 2019, for example, the
31
THE ENGINE NO. 1 TOTAL VALUE FRAMEWORK
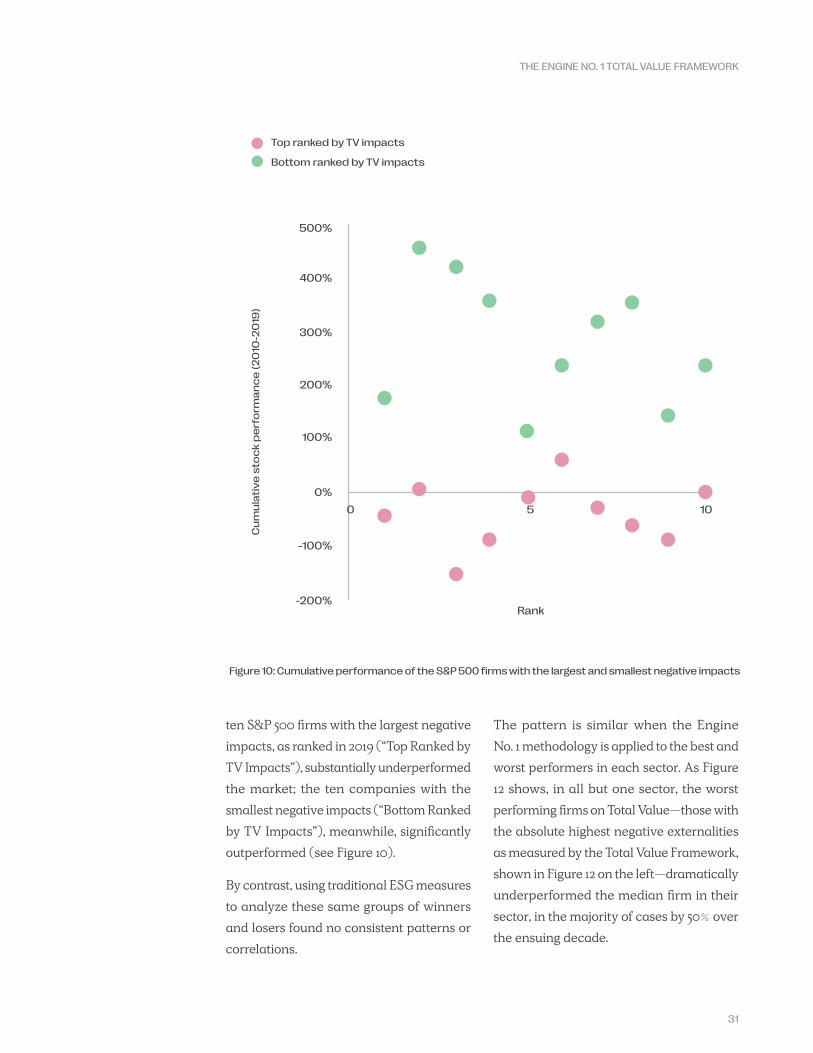
ten S&P 500 firms with the largest negative impacts, as ranked in 2019 (“Top Ranked by TV Impacts”), substantially underperformed the market; the ten companies with the smallest negative impacts (“Bottom Ranked by TV Impacts”), meanwhile, significantly outperformed (see Figure 10).
By contrast, using traditional ESG measures to analyze these same groups of winners and losers found no consistent patterns or correlations.
The pattern is similar when the Engine No. 1 methodology is applied to the best and worst performers in each sector. As Figure 12 shows, in all but one sector, the worst performing firms on Total Value—those with the absolute highest negative externalities as measured by the Total Value Framework, shown in Figure 12 on the left—dramatically underperformed the median firm in their sector, in the majority of cases by 50% over the ensuing decade.
-200%
-100%
0%
0 5 10
100%
200%
300%
400%
500%
Rank
Cu
mu
lati
ve
sto
ck
pe
rfo
rma
nc
e (
20
10-2
019
)
Top ranked by TV impacts
Bottom ranked by TV impacts
Figure 10: Cumulative performance of the S&P 500 firms with the largest and smallest negative impacts

32
THE ENGINE NO. 1 TOTAL VALUE FRAMEWORK
-250%
-250%
-200%
-200%
-150%
-150%
-100%
-100%
-50%
-50%
50%
50%
100%
100%
150%
150%
100%
250%
50%
200%
150%
0%
100%
-50%
50%
-100%
0%
-150%
-50%
-200%
-100%
-250%
-150%
0%
0%
0
0
2
2
4
4
6
6
8
8
10
10
0 2 4 6 8 10
0 2 4 6 8 10
Top ranked by TVL-Insight SASB aII categories
Bottom ranked by TVL-Insight SASB aIl categories
Top ranked by Refinitiv ESG score
Bottom ranked by Refinitiv ESG score
Top ranked by MSCI average of E, S, & G scores
Bottom ranked by MSCI average of E, S, & G scores
Top ranked by TVL-Insight SASB materiality
Bottom ranked by TVL-Insight SASB materiality
Rank
Rank
Rank
Rank
Figure 11: Cumulative performance of the top and bottom S&P 500 firms ranked by traditional ESG measures

33
THE ENGINE NO. 1 TOTAL VALUE FRAMEWORK
Figure 12: Cumulative relative performance vs. S&P 500: 2010-2020 by sector
Figure 13: Financial performance related to Total Value in both environmental and social dimensions
Median vs. companies with absolute highest Total Value within sector in 2010
Negative effect of environmental intensities on financial metrics distribution
Positive effect of D&I and human rights on the distribution of financial metrics
Pa
rtia
l co
rre
lati
on
co
eff
icie
nts
Pa
rtia
l co
rre
lati
on
co
eff
icie
nts
Quantities of financial metrics Quantities of financial metrics
Market cap EBITDA Net income Market cap EBITDA Net income
Median vs. 5th percentile of companies with highestTotal Value within sector in 2010
Utilities
Real Estate
Materials
Information Technology
Industrials
Health Care
Financials
Energy
Consumer Staples
Consumer Discretionary
Communication Services
-200%
5%
5%
15%
15%
25%
25%
35%
35%
Median by sector Companies with absolute highest Total Value within sector
-150% -100% -50% -0% 50% 100%
Utilities
Real Estate
Materials
Information Technology
Industrials
Health Care
Financials
Energy
Consumer Staples
Consumer Discretionary
Communication Services
-200%
Median by sector 5th percentile of companies with highest Total Value within sector
-150% -100% -50% -0% 50% 100%
45%
45%
55%
55%
65%
65%
75%
75%
85%
85%
95%
95%

34
THE ENGINE NO. 1 TOTAL VALUE FRAMEWORK
If we build on the discussion on the preceding pages, we can look at illustrative returns using the Total Value Framework.
In the chart below (see Figure 14), we analyzed the performance of S&P 500 firms between December 2, 2011 and August 9, 2021 using the Total Value Framework and separated the firms into quintiles. Quintile designation on this chart is represented with ‘1’ representing firms with the lowest Total Value Score (or largest negative impacts) which substantially underperformed the benchmark, and ‘5’ representing the highest Total Value Score (or smallest negative impacts) which outperformed the benchmark. While this does not account for an evolving
data framework and it holds assumptions over the time period constant, we can still see in the chart that the framework can be an important and impactful methodology to deploy towards generating favorable financial returns, while at the same time quantifying the requisite ESG impact (as opposed to the aforementioned ranking and rating methods). Subsequent versions of the Total Value Framework will seek to employ a deeper sector- specific analysis, with better defined weighting schemes and more direct attribution statistics. We are seeking to bring a new framework to ESG investing which may carry significant upside potential.
Figure 14: Illustrative return based on Total Value Score (from 1 to 5) vs. S&P 500
Illu
str
ati
ve
re
turn
pe
r U
S d
olla
r in
ve
ste
d o
n J
an
ua
ry 1
, 20
12
$6
$5
$4
$3
$2
$1
$0
$-1
5 S&P 5004321
2011 2012 2013 2014 2015 2016 2017 2018 2019 2020 2021
Note: Provided for illustrative purposes only. The chart does not represent the performance results of any existing or proposed investment vehicle managed by Engine No. 1. The above chart represents the application of the Total Value Framework to approximately 700 companies included in the S&P 500 Index from December 2, 2011 – August 9, 2021 to demonstrate the correlation of performance of companies with lower and higher Total Value Scores.
The Total Value Framework employs a variety of ESG-related data factors to quantify and connect the material impact of a company to financial performance. The framework identifies material and high-impact actions a company can take, and assigns dollar values to those actions, highlighting where a business is under or over-valued based on impact. This process determines each company’s Total Value Score. The companies were then separated into quintiles, with Band 1 including the companies having the lowest Total Value Score, and Band 5 having the highest Total Value Score. Portfolio quintile and S&P index composition adjusted annually.
The chart shows the hypothetical performance of an investment in December 2, 2011 of $1 USD per each Band as of August 9, 2021 and assumes that the basket of securities composing each quintile is rebalanced on January 1 of each year. Hypothetical performance is not actual performance and has inherent limitations and should not form the basis for an investment decision. None of the information set forth above constitutes an offer to purchase or an offer to sell, or a promotion or recommendation of, any security, financial instrument, product or trading strategy. Past performance is not indicative or a guarantee of future results. Please see “Important Information” at the end of this White Paper.
Additional information regarding Engine No. 1’s Total Value Framework and methodology is available upon request.

35
THE ENGINE NO. 1 TOTAL VALUE FRAMEWORK
Our analysis further shows that the strength of the correlations increases across each decile, with the strongest relationship observed among top-performing firms. The lesson is clear: mitigating negative externalities or contributing positive ones is a key differentiator of top-performing firms, and significantly so, for over half the companies in the S&P 500.
Better owners
How does the data offered by the Total Value Framework improve the ESG investing strategies discussed earlier in this paper? By monetizing the impact of ESG, investors will be able to integrate the new data into traditional financial analysis without having to carry out the bespoke and time-consuming assessments required by current ESG data and methodologies.
The objective nature of the data will also allow Total Value accounts to be properly audited, which stands in contrast to the voluntary or custom third-party reporting that is common at the moment.
While Engine No. 1’s Total Value Framework represents a major breakthrough, there is substantial room for improvement. Of the pathways between stakeholder and shareholder value we’ve identified, not all can be integrated into the framework because of existing data limitations. Looking ahead, we aim to find new sources of alternative data, either procuring these from third-party providers or, when necessary, working independently or with partners to
develop them ourselves. In this way we can realize the full potential of the framework.
More advanced techniques based on artificial intelligence will provide further opportunities for improvement. We continue to experiment with data imputation to plug holes. It’s important to note that missing information about ESG is far from random: high ESG-performing firms are generally among the first to report, with laggards likely to be last. We are also trying to better track the speed with which companies internalize the externalities identified by shareholders, and we furthermore hope to identify new factors that will drive the internalization of externalities. These include but are not limited to the development of more focused signals of impending legislative, regulatory, or legal shifts, as well as indications of pressure from within a company’s supply chain—or the specific geographic communities in which a company operates—to address costs imposed on stakeholders.
More fundamentally, we would like to turn the industry away from separating ESG analysis from other financial and operational analysis. We aim to encourage bespoke integration of the two instead, shifting the focus to the dollar value of a firm’s Total Value creation or destruction and the likelihood of internalization by shareholders.
Reframing the ESG integration process is consistent with the recent emphasis on materiality, though the transformation will require a deep cultural shift.

36
THE ENGINE NO. 1 TOTAL VALUE FRAMEWORK
A historical perspective on the ESG movement, such as what we have provided, highlights why the market requires a radical shift in its approach to ESG measurement. The monetization of ESG performance, as provided by Engine No. 1’s Total Value Framework, is an important step in this evolution. We anticipate that the strong, albeit preliminary, new evidence of the links between value and values will spur interest among investors, academics, and policymakers as we advance Engine No. 1’s Total Value methodology.
Conclusion: Building a better way
Interest in responsible and sustainable investing has never been greater. Yet many of the individuals committing their money, companies striving to mend their ways, and governments seeking progress through new regulations are growing frustrated by the results.
By embracing the principles behind the Total Value Framework, we believe ESG investing can harness private capital on the scale needed to address systemic challenges like climate change. Only then can the potential of ESG funds translate into the better financial returns and the corporate, societal, and environmental outcomes they were always meant to deliver.

37
i Eccles, R. G., Lee, L.-E., & Stroehle, J. C. 2020. The Social Origins of ESG: An Analysis of Innovest and KLD. Organization & Environment, 33(4): 575-596, Townsend, B. 2020. From SRI to ESG: The Origins of Socially Responsible and Sustainable Investing. The Journal of Impact and ESG Investing, 1(1): 10-25.
ii Hartzmark, S. M., & Sussman, A. B. 2019. Do Investors Value Sustainability? A Natural Experiment Examining Ranking and Fund Flows. The Journal of Finance, 74(6): 2789-2837, Renneboog, L., Ter Horst, J., & Zhang, C. 2011. Is Ethical Money Financially Smart? Nonfinancial Attributes and Money Flows of Socially Responsible Investment Funds. Journal of Financial Intermediation, 20(4): 562-588, Riedl, A., & Smeets, P. 2017. Why Do Investors Hold Socially Responsible Mutual Funds? The Journal of Finance, 72(6): 2505-2550.
iii Borgers, A., Derwall, J., Koedijk, K., & Ter Horst, J. 2015. Do Social Factors Influence Investment Behavior and Performance? Evidence From Mutual Fund Holdings. Journal of Banking & Finance, 60: 112-126, Eccles, R. G., Lee, L.-E., & Stroehle, J. C. 2020. The Social Origins of ESG: An Analysis of Innovest and KLD. Organization & Environment, 33(4): 575-596, Humphrey, J. E., & Tan, D. T. 2014. Does it Really Hurt to be Responsible? Journal of Business Ethics, 122(3): 375-386, Townsend, B. 2020. From SRI to ESG: The Origins of Socially Responsible and Sustainable Investing. The Journal of Impact and ESG Investing, 1(1): 10-25.
iv Auer, B. R., & Schuhmacher, F. 2016. Do Socially (Ir)responsible Investments Pay? New Evidence from International ESG Data. The Quarterly Review of Economics and Finance, 59: 51-62, Capelle-Blancard, G., & Monjon, S. 2014. The Performance of Socially Responsible Funds: Does the Screening Process Matter? European Financial Management, 20(3): 494-520, Cortez, M. C., Silva, F., & Areal, N. 2012. Socially Responsible Investing in the Global Market: The Performance of US and European Funds. International Journal of Finance & Economics, 17(3): 254-271, El Ghoul, S., & Karoui, A. 2017. Does Corporate Social Responsibility Affect Mutual Fund Performance and Flows? Journal of Banking & Finance, 77: 53-63, Munoz, F., Vargas, M., & Marco, I. 2014. Environmental Mutual Funds: Financial Performance and Managerial Abilities. Journal of Business Ethics, 124(4): 551-569, Renneboog, L., Ter Horst, J., & Zhang, C. 2008. The Price of Ethics and Stakeholder Governance: The Performance of Socially Responsible Mutual Funds. Journal of Corporate Finance, 14(3): 302-322.
v Lee, D. D., Humphrey, J. E., Benson, K. L., & Ahn, J. Y. 2010. Socially Responsible Investment Fund Performance: The Impact of Screening Intensity. Accounting & Finance, 50(2): 351-370, Renneboog, L., Ter Horst, J., & Zhang, C. 2008. The Price of Ethics and Stakeholder Governance: The Performance of Socially Responsible Mutual Funds. Journal of Corporate Finance, 14(3): 302-322.
vi Nofsinger, J., & Varma, A. 2014. Socially Responsible Funds and Market Crises. Journal of Banking & Finance, 48: 180-193.
vii Blitz, D., & Swinkels, L. 2020. Is Exclusion Effective? The Journal of Portfolio Management, 46(3): 42-48, Broccardo, E., Hart, O. D., & Zingales, L. 2020. Exit vs. Voice: National Bureau of Economic Research, Dyck, A., Lins, K. V., Roth, L., & Wagner, H. F. 2019. Do Institutional Investors Drive Corporate Social Responsibility? International Evidence. Journal of Financial Economics, 131(3): 693-714, Jahnke, P. 2019. Ownership Concentration and Institutional Investors’ Governance Through Voice and Exit. Business and Politics, 21(3): 327-350, Whelan, T., Atz, U., Van Holt, T., & Clark, C. 2021. ESG and Financial Performance: NYU Stern Center for Sustainable Business.
viii Amon, J., Rammerstorfer, M., & Weinmayer, K. 2020. Passive ESG Portfolio Management - The Benchmark Strategy for Socially Responsible Investors. Available at SSRN: https://ssrn.com/abstract=3400628 or http://dx.doi.org/10.2139/ssrn.3400628, Conen, R., Hartmann, S., & Rudolf, M. 2020. Going Green Means Being in the Black. Available at SSRN: https://ssrn.com/abstract=3646015 or http://dx.doi.org/10.2139/ssrn.3646015, Geczy, C. C., Guerard, J. B., & Samonov, M. 2020. Warning: SRI Need Not Kill Your Sharpe and Information Ratios—Forecasting of Earnings and Efficient SRI and ESG Portfolios. The Journal of Investing, 29(2): 110-127, Hanicova, D., & Vojtko, R. 2020. Backtesting ESG Factor Investing Strategies. Available at SSRN: https://ssrn.com/abstract=3633303 or http://dx.doi.org/10.2139/ssrn.3633303, Kaiser, L. 2020. ESG Integration: Value, Growth and Momentum. Journal of Asset Management, 21(1): 32-51, Madhavan, A., Sobczyk, A., & Ang, A. 2021. Toward ESG Alpha: Analyzing ESG Exposures Through a Factor Lens. Financial Analysts Journal, 77(1): 69-88, Maiti, M. 2020. Is ESG the Succeeding Risk Factor? Journal of Sustainable Finance & Investment: 1-15, Nagy, Z., Kassam, A., & Lee, L.-E. 2016. Can ESG Add Alpha? An Analysis of ESG Tilt and Momentum Strategies. The Journal of Investing, 25(2): 113-124, Pedersen, L. H., Fitzgibbons, S., & Pomorski, L. 2020. Responsible Investing: The ESG-efficient Frontier. Journal of Financial Economics, Steen, M., Moussawi, J. T., & Gjolberg, O. 2020. Is There a Relationship Between Morningstar’s ESG Ratings and Mutual Fund Performance? Journal of Sustainable Finance & Investment, 10(4): 349-370.
ix Clark, C., & Lalit, H. 2020. ESG Improvers: An Alpha Enhancing Factor: Rockefeller Asset Management, Steen, M., Moussawi, J. T., & Gjolberg, O. 2020. Is There a Relationship Between Morningstar’s ESG Ratings and Mutual Fund Performance? Journal of Sustainable Finance & Investment, 10(4): 349-370.
x Serafeim, G. 2020. Public Sentiment and the Price of Corporate Sustainability. Financial Analysts Journal, 76(2): 26-46.
xi Breedt, A., Ciliberti, S., Gualdi, S., & Seager, P. 2019. Is ESG an Equity Factor or Just an Investment Guide? The Journal of Investing, 28(2): 32-42, Drei, A., Le Guenedal, T., Lepetit, F., Mortier, V., Roncalli, T., & Sekine, T. 2019. ESG Investing in Recent Years: New Insights from Old Challenges. SSRN: https://ssrn.com/abstract=3683469 or http://dx.doi.org/10.2139/ssrn.3683469, Filbeck, A., Filbeck, G., & Zhao, X. 2019. Performance Assessment of Firms Following Sustainalytics ESG Principles. The Journal of Investing, 28(2): 7-20, Verheyden, T., Eccles, R. G., & Feiner, A. 2016. ESG for All? The Impact of ESG Screening on Return, Risk, and Diversification. Journal of Applied Corporate Finance, 28(2): 47-55.
xii Messina, J. 2017. Measuring Intangibles: RobecoSAM’s Corporate Sustainability Assessment Methodology: RobecoSAM AG.
xiii Melas, D., Nagy, Z., & Kulkarni, P. 2016. Factor Investing and ESG Integration: MSCI.
xiv Attig, N., El Ghoul, S., Guedhami, O., & Suh, J. 2013. Corporate Social Responsibility and Credit Ratings. Journal of Business Ethics, 117(4): 679-694, Bae, S. C., Chang, K., & Yi, H.-C. 2016. The Impact of Corporate Social Responsibility Activities on Corporate Financing: A Case of Bank Loan Covenants. Applied Economics Letters, 23(17): 1234-1237, Bae, S. C., Chang, K., & Yi, H.-C. 2018. Corporate Social Responsibility, Credit Rating, and Private Debt Contracting: New Evidence From Syndicated Loan Market. Review of Quantitative Finance and Accounting, 50(1): 261-299, Bae, S. C., Chang, K., & Yi, H.-C. 2018. Corporate Social Responsibility, Credit Rating, and Private Debt Contracting: New Evidence from Syndicated Loan Market. Review of Quantitative Finance and Accounting, 50(1): 261-299, Bahra, B., & Thukral, L. 2020. ESG in Global Corporate Bonds: The Analysis Behind the Hype. The Journal of Portfolio Management, 46(8): 133-147, Chava, S. 2014. Environmental Externalities and Cost of Capital. Management Science, 60(9): 2223-2247, Desclee, A., Dynkin, L., Hyman, J., & Polbennikov, S. 2016. Sustainable Investing and Bond Returns: Barclays Research, Impact Series, El Ghoul, S., Guedhami, O., Kwok, C. C., & Mishra, D. R. 2011. Does Corporate Social Responsibility Affect the Cost of Capital? Journal of Banking & Finance, 35(9): 2388-2406, Goss, A., & Roberts, G. S. 2011. The Impact of Corporate Social Responsibility on the Cost of Bank Loans. Journal of Banking & Finance, 35(7): 1794-1810, Landry, E., Castillo-Lazaro, M., & Lee, A. 2017. Connecting ESG and Corporate Bond Performance, MIT Sloan Management School & Breckinridge Capital Advisors Report, Nguyen-Taylor, K., Naranjo, I., & Roy, C. 2015. The ESG Advantage in Fixed Income Investing: An Empirical Analysis. Calvert Investments, Polbennikov, S., Desclée, A., Dynkin, L., & Maitra, A. 2016. ESG Ratings and Performance of Corporate Bonds. The Journal of Fixed Income, 26(1): 21, Reznick, M., & Viehs, M. 2017. Pricing ESG Risk in Credit Markets. Hermes Investment Management Report, Sharfman, M. P., & Fernando, C. S. 2008. Environmental Risk Management and the Cost of Capital. Strategic Management Journal, 29(6): 569-592.
xv Alessandrini, F., & Jondeau, E. 2020. ESG Investing: From Sin Stocks to Smart Beta. The Journal of Portfolio Management, 46(3): 75-94, Giese, G., Lee, L.-E., Melas, D., Nagy, Z., & Nishikawa, L. 2019. Foundations of ESG Investing: How ESG Affects Equity Valuation, Risk, and Performance. The Journal of Portfolio Management, 45(5): 69-83, Jacobsen, B., Lee, W., & Ma, C. 2019. The Alpha, Beta, and Sigma of ESG: Better Beta, Additional Alpha? The Journal of Portfolio Management, 45(6): 6-15, Jagannathan, R., Ravikumar, A., & Sammon, M. 2017. Environmental, Social, and Governance Criteria: Why Investors Are Paying Attention. NBER Working Paper, 24063.
xvi Kumar, R. 2019. ESG: Alpha or Duty? The Journal of Index Investing, 9(4): 58-66.
xvii Evans, R. 2018. How Socially Responsible Investing Lost Its Soul. Bloomberg Businessweek(December 18).
xviii Koller, T., Nuttall, R., & Henisz, W. 2019. Five Ways that ESG Creates Value. The McKinsey Quarterly(Nov 14, 2019).
xix Nelson, T. 2018. ESG, Climate Change Risk and Disclosure. Governance Directions, 70(11): 705.
xx Cappucci, M. 2018. The ESG Integration Paradox. Journal of Applied Corporate Finance, 30(2): 22-28.
xxi CalPERS. 2015. Focus List Program.
xxii Shekita, N. 2020. Interventions by Common Owners. Available at SSRN.
xxiii Dimson, E., Karakaş, O., & Li, X. 2020. Coordinated Engagements. Available at SSRN 3209072.
xxiv Doidge, C., Dyck, A., Mahmudi, H., & Virani, A. 2019. Collective Action and Governance Activism. Review of Finance, 23(5): 893-933.

TRANSFORMING ACTIVE OWNERSHIP
Important InformationEngine No. 1 LLC (“Engine No. 1”) is registered as an investment adviser with the U.S. Securities and Exchange Commission (the “SEC”). Registration with the SEC or with any state securities authority does not imply a certain level of skill or training. This white paper does not constitute an offer to sell or a solicitation to buy any securities in any investment vehicle managed by Engine No. 1 and may not be relied upon in connection with any offer or sale of securities. Any offer to buy interests in an investment vehicle will be made pursuant to the delivery of the related organizational and offering documents of such investment vehicle. Investing in securities and other financial instruments entails substantial risk, including the possible loss of principal. This white paper is being provided for informational purposes only, is not a research report and should not be considered investment advice. Engine No. 1 is not acting and does not purport to act in any way as an adviser or in a fiduciary capacity vis-a-vis any recipient of this white paper. The information and opinions contained in this white paper are for background purposes only, are subject to change without notice, and Engine No. 1 has no obligation to update it. No representation, warranty or undertaking, express or implied, is given as to the accuracy or completeness of the infor-mation or opinions contained in this white paper by Engine No. 1, any of their affiliates or any of their respective members, partners, directors, officers, employees and agents and no liability is accepted by such persons for the accuracy or completeness of any such information or opinions. In particular, but without prejudice to the generality of the foregoing, no representation or warranty is given as to the achievement or reasonableness of any returns, projections, estimates, valuations or prospects contained in this white paper or in such other written or oral information. This white paper contains information and opinions and has been prepared in good faith on the basis of reasonable, honest-ly-held beliefs. The contents of this white paper are not to be construed as legal, business, financial, or tax advice, and you should consult your own advisors on such matters as you deem appropriate. This white paper contains forward-looking statements and such forward looking statements involve risks and uncertainties, and actual results may differ materially from any expectations, projections, or predictions made or implicated in such forward-looking statements. Unless otherwise indicated, the information contained herein is current as of the date indicated on the cover of this white paper. Cer-tain parts of this white paper contain simplified presentations of complex processes. The investment process and program of Engine No. 1 for any particular product or advice given may differ materially from what is stated herein. There is no obligation to update, modify or amend this white paper or to otherwise notify a reader in the event that any matter stated herein, or any opinion, projection, fore-cast, or estimate set forth herein, changes or subsequently becomes inaccurate.
© 2021 Engine No. 1 LP