a new method to estimate pin (probability of informed …yany/doc/paper64.pdf2 since the seminal...
TRANSCRIPT

1
A new method to estimate PIN
(Probability of Informed Trading)
11/1/2012
Abstract
PIN has been applied quite successfully in many finance and accounting areas.
Recently, a couple of papers address several issues, embedded in the PIN’s estimation
methodology, which could potentially bias research results. Boehmer et al. (2007) find
that the misclassification of trading directions could distort PIN estimation. Lin and Ke
(2011) suggest a way to alleviate the impact of the Floating-Point Exception. Yan and
Zhang (2012) design an algorithm to avoid potential corner solutions. In this paper, we
discuss a more fundamental issue: assumption of independence among trading/event days.
We develop a new method which discards the independence assumption and allows the
probability of events possess its conventional meaning. After comparing our new PIN
estimates with those in Easley et al. (1996, 2010), many interesting findings are presented.
JEL Classification: C13, G12, G14
Keywords: PIN, informed trading, systematic bias, unrealistic assumption, information
risk

2
Since the seminal paper by Easley, Kiefer, O’Hara, and Paperman (1996, EKOP
hereafter), their methodology to estimate the probability of informed trading (PIN) and
the corresponding PIN estimates have been successfully applied by many researchers,
such as Easley et al. (2004), Vega (2006), Fuller et al. (2007), Aslan et al. (2011), Duarte
and Young (2009), Hameed et al. (2008), and Li et al. (2009), and Easley et al. (2010). In
contrast to EKOP, who treat the arrival rates as constants, Easley et al. (2008) propose a
dynamic model that allows the arrival rates of informed and uninformed trades vary over
time. Easley et al. (2002) find that a 10% increase in PIN is accompanied by a 2.5%
increase in the annual expected returns. To test the hypothesis that voluntary conference
calls reduce the long-term information asymmetry, Brown et al. (2004) apply PIN as a
proxy for private information. When studying the cost of debt, Mansi et al. (2005)
incorporate PIN and financial analysts’ forecasts as information proxies. Vega (2006)
includes PIN as a private information component in her examination of market efficiency.
Ng et al. (2012) apply the PIN’s methodology to international firms.
Recently, several papers address issues related to the PIN’s estimation
methodology. Boehmer et al. (2007) find that the misclassification of trading directions
could bias PIN’s estimation. Lin and Ke (2011) suggest a way to alleviate the influence
of the Floating-Point Exception.1 Yan and Zhang (2012) design an algorithm to eliminate
the impact of potential corner solutions. In this paper, we discuss a more fundamental
issue: the assumption of independence among trading days and among event days. This
assumption is unrealistic and problematic since many corporate events are clustered. In
terms of PIN’s estimation, we argue that the assumption of independence among trading
1 The overflow/underflow (because of the huge number of trades) contributes to the failure of the current
method. For comparison, the size of CT (TAQ Consolidated Trade) in July 2001 is 3G (for 9,467 stocks),
whereas this value has skyrocketed to 45G (for 8,592 stocks) in July 2009.

3
(event) days would increase α (probability of events) and eventually lead to an inflated
PIN.
Several recent studies have empirically tested the usefulness of PIN. Mohanram
and Rajgopal (2009) find that 60% of the PIN-factor loadings for small firms and 40% of
PIN-factor loadings for large firms are negative. This result contradicts the perception of
PIN. Since the cost of capital is higher for firms with high PIN, the loading should be
positive. As a result, they claim that their results cast doubts on treating PIN as a priced
risk factor. Benos and Jochec (2007) find that the PIN before earnings announcements is
lower than after. This result is not consistent with the original design of PIN, which is
supposed to capture the probability of informed trading, where the PIN on average is
expected to be higher before earnings announcements. Duarte and Young (2009)
decompose a PIN into two components: illiquidity and asymmetric information. They
argue that PIN is related to the liquidity rather than to the information asymmetry.
However, those papers fail to apply Lin and Ke’s (2011) algorithm to alleviate the impact
of Floating-Point Exception which has a much high influence on large stocks with a
higher trading volumes, nor apply the method in Yan and Zhang (2012) to avoid the
potential corner solutions which occur with a higher tendency to small stocks. More
importantly, none of those studies consider the impact of the assumption of independence
among trading days and among event dates.
In this paper, we design a new method to estimate PIN. This method could be
viewed as an extension of EKOP because their formulas are applied in our derivation,
and their definition of PIN is adopted directly. The new method overcomes the
shortcoming suffered by the current method.

4
1. EKOP’s methodology and related issues
EKOP assume that trading days are independent from each other. On any trading day,
nature decides whether an information event occurs (with a probability of ) or not.
When an event occurs, it could be either bad (with a probability of ) or good (1 ).
Informed traders know the impact of the new information on the underlying securities.
Trades arrive according to Poisson processes. Uninformed traders submit buy (sell)
orders at the daily arrival rates of b (s). On an event day, informed traders buy at good
news or sell at bad news with the same arrival rate of . The probability of observing iB
(buyer-initiated trades) and iS (seller-initiated trades) on each trading day i, is
represented by the following equation:
( )
( )
( )( | , ) (1 )
! !
( )(1 )
! ! ! !
i i
b s
i i i i
b s b s
B S
b si i
i i
B S B S
b s b s
i i i i
L B S e eB S
e e e eB S B S
, (1)
where , , , ,b s is the parameter set we intend to estimate. PIN is defined as:
sb
PIN
. (2)
Intuitively, PIN measures the fraction of informed trades out of the total trades.
EKOP assume independence among trading and event days. This assumption is
unrealistic, since some events could last longer than one day while other corporate events
might be clustered. A more important issue is the potential differential impacts of this
assumption on the estimations of α, δ and PIN for stocks with various characteristics,
such as size. Even if an overestimation (underestimation) of PIN is true because of this
unrealistic assumption, it might have little influence if the overestimation

5
(underestimation) is randomly distributed among individual stocks. Since the bid-ask
bounce has a much greater impact on small stocks, Blume and Stambaugh (1983), we
expect the overestimations of α (probability of events) and PIN would be severer for
small stocks than big ones.
2. Our new methodology to estimate PIN
For our new method, we make two weak assumptions: 1) informed trading has
material impacts on the underlying securities; 2) when a good information event occurs,
B (daily total buyer-initiated trades) increases compared to those on a nonevent day;
when a bad information event happens, S (daily total seller-initiated trades) outnumbers
the corresponding value for nonevent days. Actually, these two assumptions are the
cornerstones underlying the EKOP model. In contrast to them, we do not assume
independence among trading/event days. To estimate a stock’s PIN over a fixed period,
such as one year, our procedure has three simple steps.
Step 1: Identify all event days using the well-known event study methodology,
then calculate α and δ.2
Step 2: Apply the Lee and Ready (1991) algorithm to estimate whether a trade is a
buyer- or seller-initiated.3 Calculate their daily sums (B and S).
2Our method’s advantages includes: 1) no assumption of independence, 2) the probability of events
possesses its conventional meaning, 3) the well-understood event-study methodology is applied; 4) this
method uses both CRSP daily returns and TAQ high-frequency data. More importantly, our method
utilizes more information since event study uses a much longer time period. 3The quote test is conduct first: if the current price is higher than the midpoint of the immediate bid and ask,
it is a buyer-initiated trade, while it is a seller-initiated if the price is less than the midpoint. If the price
equals the midpoint, we resort to the tick test: if the current price (pt) is higher than the previous price (pt-1),
it is a buyer-initiated trade, while if pt < pt-1, it is a seller-initiated. If pt = pt-1, we go back one more lag.
Like Lee and Ready (1991), we apply the 5-second rule.
6
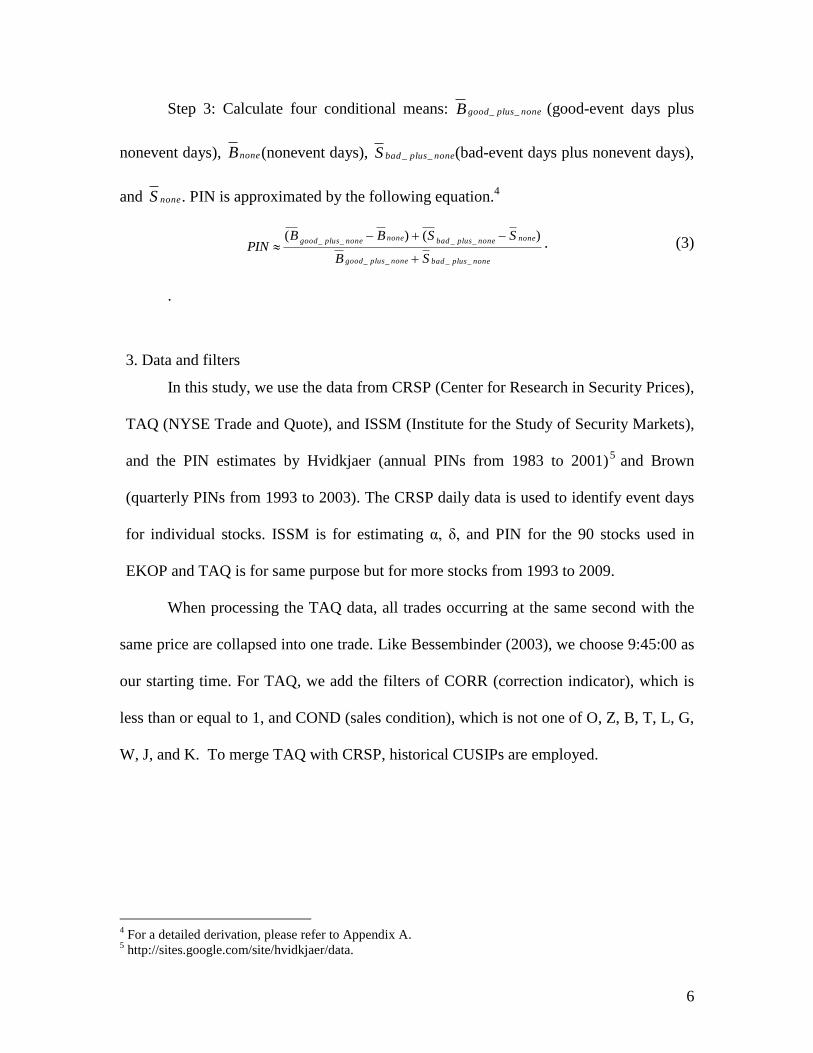
Step 3: Calculate four conditional means: noneplusgoodB __ (good-event days plus
nonevent days), noneB (nonevent days), noneplusbadS __ (bad-event days plus nonevent days),
and noneS . PIN is approximated by the following equation.4
noneplusbadnoneplusgood
nonenoneplusbadnonenoneplusgood
SB
SSBBPIN
____
____)()(
. (3)
.
3. Data and filters
In this study, we use the data from CRSP (Center for Research in Security Prices),
TAQ (NYSE Trade and Quote), and ISSM (Institute for the Study of Security Markets),
and the PIN estimates by Hvidkjaer (annual PINs from 1983 to 2001)5 and Brown
(quarterly PINs from 1993 to 2003). The CRSP daily data is used to identify event days
for individual stocks. ISSM is for estimating α, δ, and PIN for the 90 stocks used in
EKOP and TAQ is for same purpose but for more stocks from 1993 to 2009.
When processing the TAQ data, all trades occurring at the same second with the
same price are collapsed into one trade. Like Bessembinder (2003), we choose 9:45:00 as
our starting time. For TAQ, we add the filters of CORR (correction indicator), which is
less than or equal to 1, and COND (sales condition), which is not one of O, Z, B, T, L, G,
W, J, and K. To merge TAQ with CRSP, historical CUSIPs are employed.
4 For a detailed derivation, please refer to Appendix A.
5 http://sites.google.com/site/hvidkjaer/data.

7
4. Results and discussion
To classify a trading day into an event day, we choose 1.282 as our cut-off point
in terms of Z-score (T-value). This is equivalent to choosing a significant level, such as
1% or 5%, when researchers discuss the robustness of their regressions. The higher is
this critical value, the higher is the chance that a true event would be classified
accordingly. In terms of PIN’s estimation accuracy, the more accurately we could
classify event days; the better the final PIN would be if our sample is large enough.
However, the number of events is a decreasing function of the cut-off value. Fewer
events (observations) would lead to less accurate estimates of B and S, their conditional
means, and will eventually lead to a less accurate PIN estimate.
Below, IBM is selected to illustrate how its PIN is estimated in 1998. To begin,
we identify events by using the CRSP value-weighted market index (NYSE/
AMEX/NASDAQ) in the market model. An event window of (0,0) is chosen, since
each trading day will be checked. Table 2 presents 38 event days identified. For instance,
a value of -3.876 on January 21st, 1998 indicates a negative and significant event.
6 While
a FORTRAN program is used to conduct event study, Eventus® is utilized for a
robustness check (see Table 3 for the SAS codes and the key output). The value of -
3.861 based on Eventus® is very close to the value of -3.876 based on our FORTRAN
program.7
[Insert Tables 1 and 2 about here]
6 For our FORTRAN program, a 255-day window is used for the estimation period. The estimation period
ends 46 days before an event day. Thus, to estimate event days in 1998, we actually use CRSP daily data
for a period greater than two years (1998,1997, and part of 1996) . 7 Running one event study is easy. However checking all trading days for all stocks is not trivial. For
example, in 2001, we have to run 1,958,038 individual event study.

8
Because of 252 trading days and 38 event days, α is 15.08% (38/252). Similarly,
15 bad events lead to a δ of 39.47% (15/38). Subsequently, we estimate B and S based on
the Lee and Ready (1991) by using TAQ. Estimating the conditional means gives:
noneplusgoodB __ = 1001.39, noneB = 968.52, noneplusbadS __ = 936.54, and noneS = 925.79.
Plugging those four values into Equation (3), the PIN is 0.02251 for IBM in 1998 (see
Table 4 for more detail).
[Insert Table 3 about here]
Next, we compare this value of 0.02251 with those estimated by others. For
instance, Hvidkjaer’s annual PIN is 0.0836816. The quarterly PINs from Brown are
0.0634747, 0.0659907, 0.0657421, and 0.0557109 with an average of 0.0627. Our PIN
for IBM in 1998 is much lower than others’ (0.02251 < 0.0627 <0.0834). Brown’s PIN is
3 times our value, while Hvidkjaer’s is 4 times. This result is expected because we argue
that the assumption of independence among trading days and events would increase both
α and PIN. Because of this assumption, Hvidkjaer’s and Brown’s PINs could be inflated.
In terms of the comparison between the values of annual PIN (Hvidkjaer) and the
quarterly PINs (Brown), we argue further that the mean value of the quarterly PINs being
less than their corresponding annual PIN is not a coincidence. The magnitude of the
impact of the independence assumption should be positively correlated with the length of
the period based on which a PIN is estimated. Later in the paper we will formally test the
hypothesis that “quarterly PINs are lower than their corresponding annual PINs derived
based on the assumption of independence of trading days and event days”.
[Insert Table 4 about here]

9
To investigate IBM further, we estimate its annual PINs from 1983 to 2009 and
compare them with Hvidkjaer’s and Brown’s. The results are presented in Table 5. The
first observation is that, for IBM, the Hvidkjaer dataset fails to deliver PIN for 5 years
(1992, 1997, 1999, 2000, and 2001). Let us choose year 1992 as an illustration. The 1992
PIN value for IBM is missing from Hvidkjaer’s dataset, whereas our method generates an
unusual large value of 0.125. The PIN values before and after 1992 are 0.061 and 0.065,
respectively. This indicates that some unknown corporate events took place for IBM in
1992.8 To double check the potential reasons, we use the CRSP daily data to study its
trading behavior. Panel A in Table 5 shows that the daily mean returns for 1991, 1992
and 1993 are -0.065,-0.186, and 0.076 respectively. The loss in 1992 is about 3 times
higher than that of 1991. The trading volume in 1992 is 15% more than the previous year,
but 10% less than 1993. The key finding is that the volatility of daily trading in 1992 is
twice of that in 1991 and about 50% more than in 1993.9
[Insert Table 5 about here]
Next, we turn to the example based on the quarterly PIN. In 1999, Brown’s
dataset has PINs for only three quarters, with the 4th
quarterly PIN missing. The three
quarterly PIN values are 0.0914, 0.44, and 0.4404. The Panel B in Table 6 presents the
mean, standard deviation of daily returns and daily trading volumes on a quarterly basis
for 1998, 1999, and 2000. The daily mean trading volume in Q4 (1999) is 349% higher
than the previous quarter (Q3, 1999) and 263% higher than the next quarter (Q1, 2000).
The standard deviation tells the same story (for more detail please refer to Table 6).
Those two examples suggest that the volatility of daily trading volumes has a significant
8 On January 1992, IBM announced a near $5b loss.
9 Daily volatilities in 1991, 1992, and 1993 are 763,437, 1,547,929 and 1,183,661, respectively.

10
influence on the convergence of the numerical procedure underlying the KEOP
methodology. To compare our methodology with KEOP, we formally formulate several
hypotheses below.
Hypothesis 1: Event days are independent.
The key assumption of EKOP is that the trading days and event days are
independent. In other words, the event days are randomly distributed. For example, for
IBM in 1998, we have 38 events, with their significant levels larger than our critical
value (Z>1.282). If considering only the sign for each event day, they should be
distributed randomly among the 252 trading days in the year. Note that the event days of
IBM in 1998 are sorted chronologically (see Table 1). Just by manually inspecting the
table, we could conclude that these event days are clustered. A good event has a higher
chance of being followed by a good event. This pattern is true for bad events as well. If
event days are truly randomly distributed, then for a certain positive event, the probability
of the next event being positive or negative should be roughly the same, i.e., 50% each.
This should be also true for a negative event. Mathematically, p(Signt+1=1|Signt=1) = 50%
and p(Signt+1=−1|Signt=1) = 50%. According to Table 1, we have p(signt+1=1|signt=1) =
62% (14/23) and p(signt+1=-1| signt=−1) = 47% (7/15). The joint probability for the same
sign between adjacent events will be 55.3% (7+15)/(14+23). Consider another example:
the random-distribution assumption will have a hard time explaining why the first 6
consecutive significant events across 3 months, shown in Table 1, are all negative. On the
other hand, those clustered events could be explained by the weekly momentum, e.g., see
Gutierrez and Kelley (2008). In short, our result rejects the null hypothesis that event
days are independently distributed. Using a much bigger sample of the 90 stocks chosen
by EKOP also leads to the same conclusion that event days are not randomly distributed.

11
Benchmarked on our new methodology, using the EKOP methodology:
Hypothesis 2: α is overestimated;
Hypothesis 3: α is overestimated more for the small stocks than for the big ones;
Hypothesis 4: PIN is overestimated;
Hypothesis 5: PIN is overestimated more for the small stocks than for the big ones;
Hypothesis 6: increase the distances among groups (deciles);
Hypothesis 7A: the PIN’s overestimation is positively correlated with the length of
the period based on which a PIN is estimated; and
Hypothesis 7B: For a fixed estimation period, the PIN is positively correlated with
the number of sub-periods based on them B and S are estimated.
Hypotheses 2 and 3 are related to the probability of an event. The 4th
, 5th
and 7th
(7A
and 7B) hypotheses are associated with the PIN. Hypothesis 6 relates to the testing of
characters of groups (decile) sorted according to the market capitalization of the stocks.
Next, 90 stocks from the EKOP study are used to confirm or reject those hypotheses.
EKOP choose 30 stocks from the 1st decile (the largest stocks), the second set of 30
stocks from the 5th
decile (the medium-sized stocks), and the third set of 30 stocks from
the 8th
decile (the smallest stocks).10
The ISSM is used to estimate daily B and S from
10/1/1990 to 12/23/1990 based on the Lee and Ready (1991) algorithm. The results are
listed in Table 5 (for the first decile), Table 6 (for the 5th
decile), and Table 7 (for the 8th
decile), respectively.
[Insert Table 5 about here]
10
To ensure that our 90 stocks matched theirs, we estimate the average prices and 1990 trading volume by
using the CRSP. Based on the comparison of our results with those in Table A.I in EKOP, there is no
material difference.

12
Let us use Table 5 (for the largest stocks) as an example to compare and contrast
the various parameters estimated based on our method and EKOP’s. In Table 5, the
columns 3–5 present α, δ, and PIN values from EKOP, and the last three columns (6–8)
present α, δ, and PIN estimated in this study. First, look at α (event probability). The
mean of α’s of EKOP is 50.1%, whereas our mean value is 33.5%. Their values are 16.6%
higher than ours.11
This finding is consistent with our hypothesis that the assumption of
independence among trading days will inflate the probability of event days. 12
Table 7
shows that most EKOP’s α’s are greater than ours (20 out of 30). We conduct a simple
test to find out whether the mean values of α’s of the two methods for the stocks in decile
1 (the stocks with the largest size) are equal. Our result rejects the null hypothesis of
equality. The second observation is that for a typical stock, when the α values in EKOP
are larger than ours, the deviation is huge, with a mean of about 150%. In contrast, when
their αs are smaller than ours, the deviations are moderate, with a mean of 10%. We do
not have an explanation for this phenomenon.
Because there are 3 deciles according to EKOP, we study whether the
overestimations are the same across different portfolios. The means of α’s, based on our
estimations are 33.5%, 28.8%, and 25.2%, for the deciles 1, 5, and 8, respectively. For
these three deciles (the 1st, the 5
th, and the 8
th), the overestimations in the mean values are
16.6%, 15.8%, and 10.4%, respectively. We interpret this result as follows: although α is
overestimated on average, the deviation is more severe for big stocks than for small
stocks. This result rejects our third hypothesis that α is overestimated more for small
stocks than for larger stocks. Intuitively, we could explain the result in the following way.
11
The medians of these two sets of α’s, 43.4% vs. 28.1%, narrate the same story. 12
The real meaning of α in EKOP is not clear although it is called the probability of an event happening. In
contrast, our α is estimated exactly according to its definition.

13
Big stocks represent more mature and established firms. Thus, their returns and stock
behaviors are less volatile than start-ups and small firms. Consequently, the independent
assumption should be more “true” to those stocks than volatile small stocks. Thus, its
violation should be more serious. Even so, we should be cautious in its interpretation
since our focus is the final indicator, i.e., PIN. Later, we show that hypothesis 5 has been
accepted, i.e., the PIN is overestimated more for the small stocks than for the big stocks.
[Insert Table 6 about here]
Compared to α, the magnitudes of the differences in δ are much smaller. On average,
δ is underestimated by 9.8%. There is a reasonable difference for the different portfolio
sizes. It is interesting to notice that the 1st decile (the largest-stock portfolio) suffers the
largest underestimation (−15.6%). The second-largest decile (the 5th
decile) has only a
tiny underestimation (−0.003%). In contrast, for the smallest decile (the 8th
decile), the δ
is, on average, overestimated by 6.45%. Again, the various levels of under- and
overestimation for different size portfolios will definitively exert unequal impacts on the
final output: PIN estimates.
The mean PIN values from the EKOP study and this work are 0.1991 and 0.0552,
respectively. Compared with our value, their mean value introduces an overestimation of
193%. To a certain extent, this is entirely expected as an inflated α will eventually lead to
an overstated PIN. In theory, if such overestimations are identical across different deciles,
portfolios, or stocks, it should cause no concern because this phenomenon will not
generate a biased result. Unfortunately this is not the case. The deviation of the smallest
decile is more than double when compared with the largest decile (207.9% vs. 103.9%).
Furthermore, EKOP’s method increases the distance, in terms of PIN, among different

14
portfolios. The distances between the 1st and the 8
th and between the 5
th and the 8
th are 34%
and 2.2% when based on EKOP, whereas the two values are only 15% and 1.27%, if
based on our method. We conclude that EKOP’s method exaggerates the differences
among the three deciles. This bias favors, other factors being equal, the detection of PIN
as a priced risk factor.
[insert Table 7 about here]
It is worthwhile to discuss the cases when the δ values acquire extreme values of
zero (0) and unity (1). δ being zero implies that all events are good for the entire period.
Similarly, δ being 1 refers to a situation where all events are bad. When δ assumes these
two extreme values, we suspect that something must be wrong because it is difficult to
imagine that a firm only has good news or is always unlucky. According to EKOP’s
method, among the 90 stocks, 8 cases have δ as either 100% or 0%.13
One such case is in
the largest portfolio (decile 1), two cases are in the medium-sized portfolio (decile 5), and
5 cases are found for the smallest portfolio (decile 8). We do not believe that such a
monotonic increase of extreme cases from the largest portfolio to the smallest portfolio is
just a coincidence. The main reason is that the basic assumptions are violated and their
violation will lead to unreasonable and extreme results. This is especially true, or has a
higher probability to be true, for the stocks in the smallest portfolio. For these 8 extreme
cases, based on the method developed in this paper, we obtain reasonable δ values. For
example, for the stock with a ticker for CES, EKOP report a δ of 100%, whereas our
estimate is 30.8%. The second case is for CMI, with a δ value of 0%, whereas our value
is 27.3%. Such an extreme value of δ will definitely distort the final PIN estimates.
Nevertheless, our method fails to deliver PIN for one stock: DSO. The reason is that the
13
We treat 0.999987 as 1, refer to stock of CER in EKOP.

15
values of B and S of the stock violate our and EKOP’s basic assumption: when a good
event happens, the informed traders buy (i.e., B increases); and when a bad event occurs,
the informed traders sell (i.e., S increases).
Next, we turn to the correlation coefficients between our PINs and EKOP’s within
each decile. When the first decile is considered, the correlation coefficient is 45.3% (n =
30). This implies that for the largest stocks, our PINs and their PINs share some
similarity, at least to a certain extent. For the 5th
and 8th
decile stocks, the correlation
coefficients are 4.4% and −40%, respectively. These values offer strong support to the
statement that there are a huge difference between our PIN and EKOP’s. It is a surprise to
notice that for the smallest size stocks, our PIN’s and EKOP’s are negatively correlated.
In the EKOP’s PIN formula, Equation (2), it is obvious that PIN is an increasing
function of α. It seems strange that our PIN formula, Equation (3), does not even include
α. However, α is still positively correlated to PIN in our formula since its impact is via
two positive items in the numerator: noneplusgoodB __ and noneplusbadS __ . To see this, assume
that we fix other variables of noneB and noneS , δ, B and S . The higher α is, the higher
the counts of good events for a fixed δ. Thus, we will have a higher value for
noneplusgoodB __ . This is true for noneplusbadS __ as well. For this purpose, we conduct a
simulation to investigate the relationship between α and PIN. Because there are 252
trading days in a year, we choose n1 =252*α(1−δ) as good-event days and n2=252αδ as
bad events. According to our basic assumption, on a good event day, informed traders
buy (i.e., the number of buyer-initiated trades increases), and informed traders sell (the
number of seller-initiated trades increases) on a bad-event day. Our result confirms that
PIN is a monotonically increasing function of α.

16
Next, we show whether the deviation (bias) of PIN estimates is an increasing
function of the estimation period by using Brown’s quarterly and Hvidkjaer’s annual data.
Our results demonstration that the difference between Hvidkjer’s PIN and Brown’s PIN
(based on the average of his quarterly PIN) is negative. This result indicates that Brown’s
quarterly PINs are statistically higher than Hvidkjer’s annual PINs. Our Hypothesis 7A is
rejected.14
On the other hand, to estimate quarterly PIN, Kaul et al. (2008) use six
different intervals: 30-minute, 1-hour, 1-day, 2-day, and 3-day. They find that PIN
declines monotonically when the length of sampling interval increase. Their result offer a
strong support to our Hypothesis 7B since they show that PIN’s are positively correlated
with the number of sub-periods when the length of an estimation period, in this case
Quarter, is fixed.
5. Robustness test
Since the size of 90 stocks is too small for a thorough study, comparison of our new
PIN with a larger number of stocks is required.15
For this purpose, we chose Hvidkjaer’s
annual PIN since his data set covers 5,070 stocks. There is a “black-hole” in Hvidkjer’s
dataset, i.e., failure to deliver PIN for many stock-years. In total, there are 9 data years
(1993 to 2001) and 5,070 unique stocks (PERMNOs). Thus, we expect 44,214 PINs
14
The median (mean) of the difference is -0.003 (-0.0031) if we match two data sets by historical CUSIP
and year with a number of observations of 14, 758. The percentages of positive and negative differences are
45% and 55%, respectively. If we match two data sets by historical CUSIP, ticker and year, the median
(mean) of the difference is -0.0036 (-0.0026) with the number of observations of 14,015. The percentages
of positive and negative difference are 45% and 54%, respectively. 15
The advantage of comparing and contrast with the same 90 stocks in EKOP is that they report a complete
set of parameters, such as stock ID, date, α,δ, PIN, while other public available PIN estimates have only
stock ID, date and PIN.

17
(stock–year).16
However, his data set shows only 41,637 PINs (2,577 missing). It
indicates that the current method fails to generate PIN’s for those stock-year
combinations. Over the years, the numbers of “black holes” are increasing. This simple
fact supports our argument that increase in trading activities enhances the failure rate
over years. For year 2001, there are 2,126 valid PINs in the Hvidkjaer’s dates. We
obtained 2,610 PINs after adding a filter to stipulate that the trading days should be at
least as large as 50. We got 2,611 PIN, which are approximately 500 more than Hvidkajer.
The joint market share of those stocks is 62.6% of the entire market. This value is much
higher than 52%.
6. Conclusions and future research
In this paper, we apply the well-known Event Study methodology to identify all
event days. Based on Lee and Ready’s (1991) algorithm, we compute daily sums of
buyer- (B) and seller-initiated trades (S). By plugging the conditional expected values of
B and S into a simple formula, extended from Easley et al. (1996), we estimate a stock’s
PIN (Probability of Informed Trading). Our method overcomes several shortcomings of
the current model. For example, we discard the assumption of independence among event
days and trading days. In addition, the probability of events has its traditional meaning.
Our method could be extended in several directions. The most urgent task is to
replicate Easely et al. study (2002, 2004) to ascertain whether their conclusions still hold
after discarding the assumption of independence. The next test is related to the rejection
16
Some might argue that we should expect the total number of observations is 45,630 (5070*9). However,
this is an overestimation since not all stocks have complete 9 year trading data.

18
of PIN by Benos and Joche (2007) since researchers could achieve more evenly
distributed PINs by using our method. Researchers could add trading volumes, Benos and
Jochec (2006), or use different event windows. Another potential extension is to collapse
multiple-event days into a single one. After this treatment, researchers could claim that
these “new event-clusters” are independent from each other. Thus, the methodology
developed by Easley et al. (1996) could be applied in the second phase. On the other hand,
researchers could deliberatively exclude certain known events, such as positive earnings
announcements. In a sense, the resulted PIN would represent “true” unknown events, i.e.,
a true measure of private information.17
References
Aslan, H., Easley, D., Hvidkjaer S., O'Hara, M., 2011. The characteristics of
informedtrading: Implications for asset pricing. Journal of Empirical Finance 18,
782–801.
Bessembinder, Hendrik, 2003. Trade execution costs and market quality after
decimalization, Journal of Financial and Quantitative Analysis 38, 747-777.
Benos, Evangelos, and Marek Jochec, 2007. Testing the PIN variable, working paper,
University of Illinois.
Blume, Marshall, and Robert Stambaugh, 1983. Biases in computed returns: An
application to the size effect, Journal of Financial Economics 12, 387-404.
Boehmer, E., Grammig, J., Theissen, E., 2007. Estimating the probability of informed
trading -- Does trade misclassification matter? Journal of Financial Markets 10,
26-47.
17
We thank Bingxuan Lin for mentioning this.

19
Brown, Stephen, Stephen A. Hillegeist, and Kin Lo, 2004. Conference calls and
information asymmetry, Journal of Accounting and Economics 37, 343-366.
Duarte, J., Young, L., 2009. Why is PIN priced? Journal of Financial Economics 91, 119-
138.
Easley, David, Soeren Hvidkjaer and Maureen O’Hara, 2002. Is Information risk a
Determinant of Asset Returns? Journal of Finance 47, 2185–2221.
Easley, David, Nicholas M. Kiefer, and Maureen O’Hara, and Joseph B. Paperman,
1996. Liquidity, information, and infrequently traded stocks, Journal of Finance
51, 1405–1436.
Easley, David, and Maureen O’Hara, 2004. Information and the cost of capital, Journal of
Finance 59, 1553-1583.
Easley, David, Soeren Hvidkjaer, and Maureen O’Hara, 2010. Factoring information into
returns, Journal of Financial and Quantitative Analysis, 45, 293-309.
Easley, D, Robert F. Engle, Maureen O’Hara, and Liuren Wu, 2008. Time-varying
Arrival Rates of Informed and Uninformed Trades, Journal of Financial
Econometrics 6, 171-207.
Fuller, Kathleen P., Bonnie F. Van Ness, and Robert A. Van Ness, 2007. Is Information
risk priced for NASDAQ-listed Stocks? working paper, University of Mississippi.
Gutierrez, Robert C Jr and Eric K. Kelley, 2008. The Long-Lasting Momentum in
Weekly Returns, Journal of Finance 63, 415-447.
Hameed, Allaudeen, Dong Hong, Mitch Warachka, 2008. Momentum and informed
trading, Working paper, National University of Singapore and Singapore
Management University.

20
Kaul, Gautam, Qin Lei and Noah Stoffman, 2008. AIMing at PIN: Order Flow,
Information, and Liquidity, working paper, University of Michigan.
Lee, Charles M. C., and Mark J. Ready, 1991. Inferring trade direction from intraday data,
Journal of Finance 46, 733-746.
Li, Haitao, Junbo Wang, Chunchi Wu and Yan He, 2009. Are Liquidity and Information
Risks Priced in the Treasury Bond Market?, Journal of Finance, 64 (1), 467-503.
Lin, H.W., Ke, W.C., 2011. A computing bias in estimating the probability of informed
trading. Journal of Financial Markets 14, 625-640.
Mansi, Sattar A., William F. Maxwell, anad Darius P. Miller, 2005. Information Risk and
the Cost of Debt Capital, Working paper, Virginia Tech.
Mohanram, Partha and Shiva Rajgopal, 2009. Is PIN Priced Risk? Journal of Accounting
and Economics, 47,3, 226-243.
Vega, Clara, 2006. Stock Price Reaction to Public and Private Information, Journal of
Financial Economics, 82, 1, 103-133.
Yan, Yuxing and Zhang Shaojun, 2012. An improved estimation method and empirical
properties of the probability of informed trading, Journal of Banking and Finance 36,
454-467.

21
Appendix A. Derivation of the methodology developed in this study
The PIN equation in Easley et al. (1996) is copied below,
SB
PIN
, (1)
where α is the probability of events, μ is the Poisson parameter of buying when a good
event happens or selling when a bad event occurs; b (s) is the Poisson parameters for
buyer-(seller-) initiated trades when no event happens. From Appendix A in Yan and
Zhang (2012), we have:
s
b
SE
BE
)(
)1()(. (2)
where δ is the probability of bad events, B(S) is the daily sum of buyer- (seller-) initiated
trades. Because b and s are derived from nonevent days, we could use the corresponding
daily B and S to approximate. According to Easley et al. (1996), for bad events, μ has no
impact on buy. Thus, noneplusgoodBBE __)( , where good_plus_none for good event days
plus none-event days. This is true for E(S) that μ has no impact on sell for bad events:
noneplusbadSSE __)( . Thus,
nonesnoneplusbad
nonebnoneplusgood
SS
BB
__
__ )1(, (3)
In (3), μb and μb are used since they come from different equations. Reorganizing those
two equations, we have
nonenoneplusbads
nonenoneplusgoodb
SS
BB
__
__)1(
(4)
Since Easley et al. (1996) apply the same μ for both informed buys and sells, we could
use its expected value to approximate.
sb )1( (5)
Multiplying (5) by α, we have
,)1( sb . (6)
Plugging (5) into (1) leads to:
nonenonesb
sb
sb SBPIN
)1(
)1( (7)
Substituting (4) into (7), our final formula to estimate PIN is:
noneplusbadnoneplusgood
nonenoneplusbadnoneonneplusgood
SB
SSBBPIN
____
____ )()(
. (8)

22
Table 1: An illustration for estimating α (probability of events) and δ (probability of
bad events) based on the new method
IBM is chosen for 1998. It has 252 trading days. A FORTRAN program18
is used to run
event study, with an event window of (0,0). The CRSP NYSE/AMEX/NASDAQ value-
weighted market index is used in the market model. The cutoff point is 1.282 for T-
STAT(PATELL). The α value is 15.08% and δ is 39.47%. To verify the result, Eventus is
applied. For comparison, 19980121 is chosen. On that event date, CAAR is −6.757 from
Panel A based on our FORTRAN program, and it is −6.76 based on Eventus, please refer
to Table 3. The T-values are −3.876 and −3.861 based on FORTRAN 95 and Eventus,
respectively.
Panel A: all 38 event days (IBM for 1998)
Date CAAR T-STAT
(PATELL)
Date CAAR T-STAT
(PATELL)
19980121 -6.757 -3.876 19980730 2.417 1.508
19980127 -3.110 -1.782 19980812 -2.573 -1.637
19980206 -2.479 -1.466 19980817 -2.275 -1.450
19980302 -2.191 -1.292 19980826 3.430 2.155
19980304 -2.481 -1.470 19980902 2.099 1.325
19980306 -3.492 -2.049 19980903 2.483 1.563
19980325 2.690 1.590 19980910 2.583 1.603
19980415 2.748 1.634 19980918 -2.166 -1.353
19980420 2.917 1.736 19980921 2.560 1.600
19980421 5.756 3.426 19980925 2.148 1.297
19980422 -3.162 -1.895 19981001 2.086 1.283
19980423 3.895 2.331 19981002 -2.263 -1.417
19980514 3.474 2.084 19981007 3.550 2.216
19980616 -3.438 -2.134 19981008 4.601 2.878
19980706 -2.500 -1.567 19981021 2.732 1.709
19980709 2.534 1.592 19981110 3.212 2.009
19980715 -2.087 -1.311 19981218 2.406 1.494
19980721 7.167 4.453 19981222 3.214 1.993
19980729 2.507 1.567 19981229 -2.571 -1.590
19990104 -2.280 -1.284
Panel B: estimation of α and δ
Stock selected IBM
Year 1998
Number of trading days 252
Market index Value-weighted NYSE/AMEX/NASDAQ
Event window (0,0)
Cutoff of T-value 1.282
Number of event days 38 [15 bad (negative) events]
α (probability of events) 15.08% (38/252)
δ (probability of bad events) 39.47% (15/38)
18
Our FORTRAN is based on the FORTRAN program called “evtstudy.f”, written by Premal Vora, visit
http://www.personal.psu.edu/fpv/sourcecode.htm. The original program written in FORTRAN 77 was
modified and transferred into FORTRAN 95.

23
Table 2: Robustness check for detecting event days (alternative method of doing so)
This table shows how to use Eventus to estimate the Z-score for just one stock-event day. The
stock selected is IBM, with PERMNO of 12490. The trading date (event date) is 1/21/1998. The
event window is (0,0), and the NYSE/AMEX/NASDAQ value-weighted index is used in the
market model. Line 4 from the bottom in the last Panel is the focus of the table.
SAS program evt.in has just one record
filename request 'evt.in';
eventus;
request;
windows (0,0);
evtstudy value;
12490 19980121
Eventus (R) Software from Cowan Research, L.C.
ESTIMATION PERIOD: Ends 46 days before the event date;
255 days in length.
TOTAL EVENTS IN REQUEST FILE: 1
EVENTS DROPPED: 0
EVENTS WITH USEABLE RETURNS: 1
MINIMUM RETURN DATA REQUIRED FOR ESTIMATION: 3
STATISTICAL SIGNIFICANCE LEVELS: 1 tailed
Results of Daily Security Return Data Input
Estimation period Returns
PERMNO Name on Event Date Event Date <=255
12490 INTERNATIONAL BUSINESS MACHS COR 01/21/1998 255
Event
Period
Returns
PERMNO <=61 Reason if no useable returns
12490 61
Parameter Estimates and Estimation Period Statistics Market Index=Value
Mean % of Raw
Event Total Returns
PERMNO Date Return >0 Alpha Beta
12490 21JAN1998 0.00170 50.98% 0.00036 1.44
MEAN 0.00170 50.98% 0.00036 1.44
MEDIAN 0.00170 50.98% 0.00036 1.44
Market Total Residual
Model Res- Return Standard Autocor-
PERMNO iduals>0 Variance Deviation relation*
12490 46.67% 0.00049 0.01738 0.0533
MEAN 46.67% 0.00049 0.01738 0.0533
MEDIAN 46.67% 0.00049 0.01738 0.0533
Market Model, Value Weighted Index
Mean
Cumulative Precision
Abnormal Weighted Positive: Patell
Generalized
Days N Return CAAR Negative Z Sign Z
-----------------------------------------------------------------------------------------
(0,0) 1 -6.76% -6.76% 0:1 -3.861*** -0.935
-----------------------------------------------------------------------------------------
The symbols $,*,**, and *** denote statistical significance at the 0.10, 0.05, 0.01
and 0.001 levels, respectively, using a 1-tail test. The symbols (,< or ),> etc.
correspond to $,* and show the significance and direction of the generalized sign test.

24
Table 3: An illustration for estimation of PIN
The stock selected is IBM (PERMNO is 12490). The year examined is 1998. The
B (the number of buyer-initiated trades) and S (the number of seller-initiated trades) of
the first 40 trading days are presented in Panel A. NOT columns show the number of
trades that could not classified into either B or S; Four conditional B and S are provided
in Panel B. The formula used to estimate PIN is:
noneplusbadnoneplusgood
nonenoneplusbadnonenoneplusgood
SB
SSBBPIN
____
____
.
Panel A: B and S for the first 40 days in 1998
date B S NOT date B S NOT
19980102 778 725 0 19980202 1086 1075 4
19980105 1042 1081 8 19980203 1048 1133 10
19980106 989 1015 8 19980204 1175 1176 2
19980107 1202 899 11 19980205 1092 1082 1
19980108 932 892 4 19980206 1005 1080 6
19980109 1785 1490 22 19980209 949 1059 2
19980112 1691 1270 16 19980210 1969 2097 8
19980113 1309 979 8 19980211 1150 1075 13
19980114 1062 1046 10 19980212 1184 920 7
19980115 1225 1083 4 19980213 672 667 3
19980116 932 900 2 19980217 900 964 16
19980120 1523 1337 5 19980218 977 887 11
19980121 3142 2615 22 19980219 1162 1078 14
19980122 1681 1460 7 19980220 958 713 4
19980123 999 1084 6 19980223 866 883 17
19980126 842 934 20 19980224 734 864 5
19980127 1777 1843 6 19980225 1121 1011 15
19980128 1241 1158 0 19980226 957 904 8
19980129 1273 1137 3 19980227 824 960 6
19980130 885 866 1 19980302 925 858 3
Panel B: Conditional B, S, and PIN.
noneplusgoodB __ noneB noneplusbadS __ noneS
PIN
1001.39 968.52 936.54 925.79 0.02251

25
Table 4: Comparison of the PIN values for IBM for the period from 1983 to 2008
The annual PIN is retrieved from Hvidkjaer19
from 1983 to 2001. The quarterly PIN data
is retrieved from Brown from 1993 to 2003. In the table, MISSING indicates that the
methodology fails to deliver a PIN. NA indicates that the period is beyond the original
ranges. The decimals under Hvidkjaer and Brown are the same as the original values. Hvidkjaer’s
annual PIN
Brown’s quarterly PIN This
study
Q1 Q2 Q3 Q4
1983 0.0608953 NA NA NA NA 0.01568
1984 0.0710622 NA NA NA NA 0.01914
1985 0.0814463 NA NA NA NA 0.00914
1986 0.0751914 NA NA NA NA 0.03329
1987 0.0996951 NA NA NA NA 0.04180
1988 0.0850697 NA NA NA NA 0.01347
1989 0.0897893 NA NA NA NA 0.02686
1990 0.1004334 NA NA NA NA 0.02373
1991 0.0836501 NA NA NA NA 0.06092
1992 MISSING NA NA NA NA 0.12479
1993 0.0943453 0.0734534 0.0787739 0.087084 0.092298 0.06549
1994 0.0921332 0.058833 0.087836 0.0975534 0.1085179 0.03286
1995 0.0907272 0.1167084 0.0925708 0.0758357 0.0726396 0.05025
1996 0.1249034 0.0807145 0.1022547 0.0964868 0.1184392 0.05536
1997 MISSING 0.0669151 0.0711548 0.0595478 0.0467814 0.04020
1998 0.0836856 0.0634747 0.0659907 0.0657421 0.0557109 0.02251
1999 MISSING 0.0916 0.44 0.4404 MISSING 0.07203
2000 MISSING 0.2955 0.4623 0.4832 0.4662 0.05319
2001 MISSING 0.2623299 0.1721969 0.4626 0.0376452 0.00894
2002 NA 0.0377033 0.0866691 MISSING MISSING 0.03242
2003 NA 0.0433226 0.0306965 0.0354655 0.1829677 0.00846
2004 NA NA NA NA NA 0.01126
2005 NA NA NA NA NA 0.04149
2006 NA NA NA NA NA 0.01542
2007 NA NA NA NA NA 0.04579
2008 NA NA NA NA NA 0.02208
2009 NA NA NA NA NA 0.02433
19
http://sites.google.com/site/hvidkjaer/data/.

26
Table 5: Comparisons of α, δ, and PIN for the LARGEST stocks (decile 1) with those of
Easley et al. (1996)
The 30 stocks in the first decile (largest stocks), together with their PINs, are copied from
Easley et al. (1996a, Panel A in Table A. II). α is the probability that an event happens; δ
is the probability of bad events when an event happens. The columns 3 to 5 are from
Easley et al. (1996); and the last 3 columns are from this paper.
Easley et al. (1996a) This study
decile ticker α δ PIN α δ PIN
1 ADM 0.478 0.192 0.1229 0.156 0.500 0.0551
1 AET 0.415 0.374 0.1129 0.516 0.515 0.0851
1 AL 0.536 0.503 0.1829 0.156 0.600 0.0387
1 AMD 0.533 0.284 0.2311 0.328 0.571 0.0846
1 AN 0.584 0.340 0.1242 0.234 0.800 0.0389
1 BMG 0.249 0.160 0.1388 0.344 0.455 0.0580
1 BN 0.478 0.512 0.1387 0.234 0.533 0.0309
1 BR 0.216 0.600 0.1473 0.266 0.529 0.0892
1 BUD 0.682 0.363 0.1422 0.156 0.300 0.0040
1 CBU 0.327 0.399 0.2138 0.422 0.333 0.1755
1 CCI 0.627 0.358 0.1446 0.406 0.462 0.0505
1 CHL 0.457 0.585 0.1666 0.516 0.576 0.1104
1 DE 0.369 0.133 0.0997 0.406 0.500 0.0593
1 DGN 0.637 0.486 0.2458 0.531 0.471 0.0428
1 DI 0.437 0.057 0.1782 0.359 0.522 0.1014
1 EK 0.410 0.570 0.0899 0.172 0.455 0.0439
1 F 0.661 0.252 0.1851 0.406 0.538 0.0410
1 GPS 0.440 0.135 0.1854 0.297 0.368 0.0870
1 GT 0.306 0.113 0.1250 0.406 0.346 0.0399
1 GTE 0.659 0.061 0.1527 0.234 0.533 0.0244
1 MXS 0.707 0.720 0.1978 0.313 0.600 0.0065
1 P 0.727 0.571 0.1605 0.203 0.615 0.0296
1 PCI 0.520 0.129 0.1824 0.188 0.250 0.0418
1 PDG 0.410 0.423 0.1504 0.281 0.556 0.0524
1 PFE 0.505 0.374 0.1305 0.109 0.571 0.0258
1 PN 0.648 0.791 0.2878 0.656 0.548 0.1698
1 S 0.722 0.775 0.1849 0.453 0.414 0.0320
1 TOY 0.451 0.037 0.1557 0.453 0.552 0.0687
1 UIS 0.388 0.177 0.2032 0.547 0.486 0.1654
1 WX 0.440 0.000 0.1366 0.313 0.650 0.0340
Mean 0.501 0.349 0.1639 0.335 0.505 0.0629

27
Table 6: For the MEDIAN stocks (decile 5), comparisons of α, δ, and PIN with those of
Easley et al. (1996)
The 30 stocks in the 5th
decile (median-sized stocks), together with their PINs, are copied
from Easley et al. (1996a, Panel A in Table A. II). α is the probability that an event
happens; δ is the probability of bad events when an event happens. The columns 3 to 5
are from Easley et al. (1996); and the last 3 columns are from this paper.
Easley et al. (1996a) In this study
decile ticker α δ PIN α Δ PIN
5 AME 0.506 0.420 0.2340 0.359 0.391 0.1044
5 APM 0.417 0.000 0.2772 0.281 0.444 0.0727
5 ATM 0.234 0.450 0.1553 0.266 0.588 0.0502
5 BNL 0.546 0.343 0.2144 0.469 0.467 0.1680
5 CCK 0.305 0.229 0.1753 0.188 0.750 0.0337
5 CPY 0.508 0.375 0.2296 0.188 0.417 0.0088
5 CUM 0.338 0.190 0.1880 0.313 0.450 0.1461
5 FLO 0.245 0.117 0.1133 0.453 0.414 0.0343
5 FMC 0.548 0.355 0.2418 0.250 0.438 0.0259
5 FQA 0.402 0.793 0.2146 0.391 0.560 0.1005
5 GAL 0.446 0.380 0.2850 0.344 0.409 0.0980
5 HAD 0.631 0.851 0.3224 0.422 0.519 0.0544
5 LNC 0.451 0.433 0.1807 0.422 0.519 0.0838
5 LOC 0.283 0.321 0.1456 0.188 0.417 0.0472
5 MAI 0.588 0.566 0.2809 0.234 0.400 0.0741
5 MCL 0.614 0.417 0.3485 0.234 0.467 0.0255
5 MUR 0.409 0.472 0.2214 0.266 0.765 0.1066
5 OGE 0.590 0.738 0.1920 0.219 0.357 0.0157
5 RGS 0.678 1.000 0.2308 0.141 0.444 0.0344
5 RLC 0.491 0.624 0.2958 0.297 0.421 0.0858
5 RNB 0.243 0.147 0.2196 0.375 0.333 0.2231
5 SCG 0.507 0.609 0.1421 0.172 0.364 0.0060
5 SFD 0.166 0.383 0.1099 0.266 0.529 0.0967
5 SNG 0.647 0.502 0.1973 0.094 0.333 0.0114
5 UCU 0.335 0.346 0.1857 0.328 0.381 0.0218
5 WOA 0.215 0.185 0.1985 0.344 0.409 0.1346
Mean 0.436 0.433 0.2154 0.288 0.461 0.0717
Note: There are 4 stocks missing from this table; they are CF, EFU, FSS, and G. CF has a different name in
CRSP. FSS-trading data is not available from CRSP because its trading days are in the range from
19620702 to 19671221. For EFU, Easley et al. (1996) report its name as “Eastern Gas & Fuel Assoc”,
whereas we find that the name presented in both CRSP and ISSM is “Eastern Enterprises”. For G, the
trading data is not available from the CRSP.

28
Table 7: For the SMALLEST stocks (decile 8), comparisons of α, δ, and PIN with those
of Easley et al. (1996)
The 30 stocks in the 8th
decile(smallest stocks), together with their PINs, are copied from
Easley et al. (1996a, Panel A in Table A. II). α is the probability that an event happens; δ
is the probability of bad events when an event happens. The columns 3 to 5 are from
Easley et al. (1996); and the last 3 columns are from this paper.
Easley et al. (1996a) This study
decile Ticker α δ PIN α δ PIN
8 AGL 0.371 0.839 0.1909 0.266 0.647 0.0334
8 AJG 0.508 0.860 0.2729 0.156 0.300 0.0530
8 AVA 0.655 0.915 0.6839 0.219 0.429 0.0231
8 BDG 0.357 0.186 0.1779 0.250 0.188 0.0909
8 BRY 0.119 0.458 0.1601 0.328 0.571 0.0566
8 CER 0.598 1.000 0.2126 0.203 0.308 0.0331
8 CES 0.052 1.000 0.0584 0.219 0.2861 0.0811
8 CMI 0.088 0.000 0.0954 0.172 0.273 0.1312
8 CNL 0.247 0.147 0.1165 0.172 0.182 0.0551
8 CRI 0.430 0.139 0.2681 0.438 0.464 0.1381
8 CRS 0.384 0.599 0.2373 0.313 0.500 0.0343
8 CYC 0.482 0.573 0.2887 0.375 0.542 0.0628
8 CZM 0.095 0.815 0.1196 0.359 0.609 0.1770
8 ESL 0.359 0.508 0.2248 0.453 0.517 0.1177
8 FED 0.177 0.276 0.2074 0.219 0.429 0.2104
8 HB 0.369 0.134 0.2026 0.234 0.467 0.0853
8 LOG 0.382 0.194 0.1756 0.203 0.538 0.0350
8 MSA 0.410 0.453 0.2747 0.328 0.476 0.0918
8 NC 0.188 0.259 0.1303 0.281 0.444 0.1495
8 PEO 0.303 0.368 0.1330 0.203 0.692 0.0807
8 PNY 0.232 0.779 0.1071 0.156 0.500 0.0716
8 RXN 0.567 1.000 0.3827 0.250 0.313 0.0298
8 SAR 0.303 0.200 0.1787 0.344 0.500 0.0299
8 SEE 0.181 0.394 0.1808 0.234 0.333 0.1187
8 SWN 0.542 0.541 0.3086 0.109 0.857 0.0293
8 TII 0.357 0.666 0.1800 0.359 0.565 0.0649
8 UIC 0.385 0.087 0.0994 0.219 0.429 0.0179
8 WMK 0.292 0.400 0.2345 0.141 0.222 0.0815
Mean 0.337 0.493 0.2108 0.257 0.449 0.0780
Note: DSO has a zero PIN and LMS has a negative one. They have hence been removed
from the table and will be investigated further.

29
Table 8: Sample statistics of 90 stocks based on the two alternate methods
The comparisons are based on the 90 stocks chosen by Easley et al. (1996), selected
according to 3 deciles (1st, 5
th, and 8
th deciles). The year chosen is 1990, and the high-
frequency data is from ISSM. Panels A, B, and C represent the α, δ, and PIN estimates,
respectively. The results are based on two methods: Easley et al. (1996), and ours.
Columns 3–6 are the statistics of mean, median, minimum, and maximum of the stocks
from Easley et al. (1996). The last 4 columns are the corresponding sample statistics for
our results (refer Table 4).
Easley et al. (1996) This study
Mean Median Min. Max. Mean Median Min. Max.
Panel A: alpha
All 0.426 0.424 0.052 0.727 0.295 0.273 0.094 0.656
Decile
1 0.501 0.478 0.216 0.727 0.335 0.320 0.109 0.656
5 0.436 0.449 0.166 0.678 0.288 0.273 0.094 0.469
8 0.337 0.358 0.052 0.655 0.257 0.234 0.109 0.453
Panel B: delta
All 0.423 0.388 0.000 1.000 0.473 0.467 0.182 0.857
Decile
1 0.349 0.360 0.000 0.791 0.505 0.526 0.250 0.800
5 0.433 0.400 0.000 1.000 0.461 0.429 0.333 0.765
8 0.493 0.455 0.000 1.000 0.449 0.465 0.182 0.857
Panel C: PIN
All 0.195 0.184 0.058 0.684 0.071 0.056 0.004 0.223
Decile 1 0.164 0.154 0.090 0.288 0.063 0.047 0.004 0.176
5 0.215 0.215 0.110 0.349 0.072 0.064 0.006 0.223
8 0.211 0.186 0.058 0.684 0.078 0.068 0.018 0.210