a new method for discovering behavior patterns among animal
TRANSCRIPT

A new method for discovering behavior patterns amonganimal movementsYuwei Wanga,b, Ze Luob, John Takekawac,d, Diann Prossere, Yan Xiongb,Scott Newmanf, Xiangming Xiaog, Nyambayar Batbayarh, Kyle Spragensc,Sivananinthaperumal Balachandrani and Baoping Yanb
aUniversity of Chinese Academy of Sciences, Beijing, China; bComputer Network Information Center,Chinese Academy of Sciences, Beijing, China; cWestern Ecological Research Center, US Geological Survey,Vallejo, CA, USA; dScience Division, National Audubon Society, San Francisco, CA, USA; ePatuxent WildlifeResearch Center, US Geological Survey, Beltsville, MD, USA; fEMPRES Wildlife Health and Ecology Unit,Animal Production and Health Division, Food and Agriculture Organization of the United Nations, Rome,Italy; gDepartment of Microbiology and Plant Biology, Center for Spatial Analysis, University of Oklahoma,Norman, Oklahoma, USA; hWildlife Science and Conservation Center, Ulaanbaatar, Mongolia; iBombayNatural History Society, Hornbill House, Mumbai, India
ABSTRACTAdvanced satellite tracking technologies enable biologists to trackanimal movements at fine spatial and temporal scales. The resul-tant data present opportunities and challenges for understandinganimal behavioral mechanisms. In this paper, we develop a newmethod to elucidate animal movement patterns from trackingdata. Here, we propose the notion of continuous behavior pat-terns as a concise representation of popular migration routes andunderlying sequential behaviors during migration. Each stage inthe pattern is characterized in terms of space (i.e., the placestraversed during movements) and time (i.e. the time spent inthose places); that is, the behavioral state corresponding to astage is inferred according to the spatiotemporal and sequentialcontext. Hence, the pattern may be interpreted predictably. Wedevelop a candidate generation and refinement framework toderive all continuous behavior patterns from raw trajectories. Inthe framework, we first define the representative spots to denotethe underlying potential behavioral states that are extracted fromindividual trajectories according to the similarity of relaxed con-tinuous locations in certain distinct time intervals. We determinethe common behaviors of multiple individuals according to thespatiotemporal proximity of representative spots and apply aprojection-based extension approach to generate candidatesequential behavior sequences as candidate patterns. Finally, thecandidate generation procedure is combined with a refinementprocedure to derive continuous behavior patterns. We apply anordered processing strategy to accelerate candidate refinement.The proposed patterns and discovery framework are evaluatedthrough conceptual experiments on both real GPS-tracking andlarge synthetic datasets.
ARTICLE HISTORYReceived 31 January 2015Accepted 1 September 2015
KEYWORDSSpatiotemporal data mining;animal movements;continuous behaviorpatterns
CONTACT Ze Luo [email protected]
INTERNATIONAL JOURNAL OF GEOGRAPHICAL INFORMATION SCIENCE, 2015http://dx.doi.org/10.1080/13658816.2015.1091462
© 2015 Taylor & Francis
Dow
nloa
ded
by [
Uni
vers
ity o
f O
klah
oma
Lib
rari
es]
at 0
8:05
06
Oct
ober
201
5
1. Introduction
The technical advancement of positioning technologies and the increasing pervasive-ness of location-acquisition devices have led to large quantities of movement data fromvarious types of moving objects, such as humans, animals, vehicles, and natural phe-nomena. The trajectory data collected from these objects provide researchers with anopportunity to obtain valuable knowledge about individual or collective behaviors. Thisknowledge can be of practical use in a variety of applications, such as social network,traffic control, mobile recommendation, and biological study. In recent ecologicalresearch studies, satellite tracking technologies have played a significant role in theinvestigation of animal movement dynamics in large spatial and temporal scales; the useof these technologies has become a popular method for remotely clarifying animalbehaviors (Bridge et al. 2011, Cui et al. 2011).
Annual movement patterns can be described as a series of movements amongdiscrete locations on the landscape that are shaped by the resource availability requiredat a distinct time stage in the annual life cycle of species (Alerstam and Lindström 1990,Newton 2008). These movements are observed at certain spatial and temporal scalesdepending on species (Fretwell and Lucas 1969, Johnson 1980, Drent et al. 2003). Forexample, arctic breeding goose populations migrate over long distances to temperatelatitudes to take advantage of food resources (Owen 1980, Prop et al. 2003). Individualsexhibit tendencies to return to sites visited previously (Black et al. 2007); however, thelocation of these sites varies within a species at the population level (Takekawa et al.2009). Animal movement patterns can mainly be derived according to the spatiotem-poral information provided by the locations visited by the animal. Migration trackingdata provide crucial insights that answer basic questions in biological studies and thatexplain observations of animal migration and life histories. These insights have longeluded scientists (Bridge et al. 2011). These data can also assist in identifying animalresidency (Pedersen et al. 2011), the connectivity between breeding and wintering areas,and further guide conservation efforts for preserving animal populations within regionallandscapes (Faaborg et al. 2010, Bridge et al. 2011). However, insights into animalbehavior must be refined as a new challenge in data management and analyses thatutilize high-frequency and high-accuracy datasets.
Many data mining technologies can be applied to animal movement data to abstractanimal mobility-related phenomena, such as in studies on spatial co-locations (Zhanget al. 2004) and group relationship patterns (Benkert et al. 2008, Jeung et al. 2008, Tanget al. 2013), spatiotemporal sequential patterns (Cao et al. 2005, Giannotti et al. 2007),and periodic patterns (Li et al. 2011). These contributions could serve as the basis offurther studies on the intrinsic link between animal movement and the long-term spreadof disease (Prosser et al. 2009, Takekawa et al. 2010, Altizer et al. 2011), and theanticipated responses to changes in environmental conditions and climate. In turn,behavioral states and even associated locations can also be estimated from the envir-onmental and other factors (Pedersen et al. 2011).
In this article, we propose an expanded version of the spatiotemporal sequentialpattern to directly represent the underlying collective behavioral states and the sequen-tial modes of migratory animals, called Continuous Behavior Pattern (CB-Pattern). TheCB-Pattern is derived from multiple migration trajectories that are similar in the space
2 Y. WANG ET AL.
Dow
nloa
ded
by [
Uni
vers
ity o
f O
klah
oma
Lib
rari
es]
at 0
8:05
06
Oct
ober
201
5

and time dimensions throughout the life span of the pattern. Moreover, the CB-Patternis a spatiotemporal representation of popular migration behavior sequences shared bymultiple individuals. Each element in such a pattern is composed of the commonunderlying behaviors in multiple individuals during migrations and corresponds to aspecific life phase. These behaviors are characterized by representative spots with spaceand stay duration properties. The behavioral state (e.g., breeding, wintering, molting,and stopover) of each element can be inferred from the spatiotemporal description ofindividual behaviors. Hence, the CB-Pattern can help biologists identify similar indivi-duals and popular migration routes, understand animal behavioral modes and thephases of migration life, and guide regional conservation efforts directed at preservinganimal populations during specific phases of annual animal requirements.
To discover the CB-Patterns from raw migration movement data (trajectory data), wedevelop a Candidate Generation and Refinement (CGAR) framework. We first define therepresentative spot as a relaxed continuous segment in the trajectory. This segmentcorresponds to a single migration behavior. We then extract the sequence of represen-tative spots with space and stay duration properties from the trajectory. Similar migra-tion behaviors are often exhibited in almost-identical locations and at like durations.Given the spatiotemporal proximity of representative spots, we utilize clustering tech-nology (Ester et al. 1996) to identify similar representative spots, which reveal specificand significant life states during migration. We then connect the relaxed continuousclusters of spots to form candidate CB-Patterns based on a traditional sequential patternmining paradigm according to the sequential relationships among the spots in timedimension. When the continuity constraint is relaxed, the CB-Pattern contains closelylinked sequential behaviors, and tolerates slight divergences or disturbances in real-life,homogeneous individual movements. The candidates are then refined by removing thespots from the movements that are inconsistent with the patterns in certain phases, andby updating the clustering structure at each phase of the pattern. Moreover, we proposea simple but efficient processing strategy to accelerate the refinement procedure of thisframework.
Extensive simulated experiments are conducted on real GPS location and largesynthetic datasets to validate our proposed approaches as well as to facilitate a com-prehensive analysis of the experimental results. This analysis demonstrates the inter-pretability of the patterns discovered (Wang et al. 2014). In this article, we simplify thedefinition of the cluster, thereby redefining the proposed animal behavior pattern, andfurther improving on the framework for pattern discovery. We also conduct a newanalysis on the ecological values of the pattern discovery problem and on the experi-ments performed within this new framework.
2. Problem definition
In this section, we state the related concepts. The main notations used throughout thisarticle are listed in Table 1.
Definition 2.1: A trajectory T is a series of points hp1; p2; . . . ; pni arranged in ascend-ing order of time. These points are collected from an animal and each point possessesspatial coordinate and time stamp properties.
INTERNATIONAL JOURNAL OF GEOGRAPHICAL INFORMATION SCIENCE 3
Dow
nloa
ded
by [
Uni
vers
ity o
f O
klah
oma
Lib
rari
es]
at 0
8:05
06
Oct
ober
201
5

In this article, behavior refers to a specific behavior or annual cycle phase, such asbreeding, molting, stopover, and flyover. To identify behavior-related patterns, we mustconsider how potential migration behaviors can be derived from raw trajectories. Inaddition to the geographic locations visited by animals, the temporal context is impor-tant for understanding underlying behavioral states. For example, a region can be usedby various migratory birds or different populations of the same species (e.g., bar-headedgoose, Anser indicus, Takekawa et al. 2009) as a breeding, molting, or stopover site, aswith the Qinghai Lake region in China. The residence of bar-headed geese within thisregion for approximately 1 month after the spring migration indicates potential breed-ing behavior; an extended stay until the autumn migration can reflect a molting phase; astay for only several days may correspond to a stopover event during which these birdsrest and refuel for continued migration (Takekawa et al. 2009, Cui et al. 2011). Hence,important cues to understanding and defining recorded underlying behaviors are thelocation in which behaviors are observed, the duration of these behaviors, and thetiming related to the annual life history strategies of species. We apply the representa-tive spot notion to characterize potential behavior in terms of location and duration. Thespot is defined as a movement segment in a trajectory as follows.
Definition 2.2: Given trajectory T ¼ hp1; p2; . . . ; pni, distance threshold δD, and gapthreshold δG, a representative spot (hereafter spot) sp consists of maximal (possibly non-consecutive) subsequence pk1 ; pk2 ; :::; pkmh i of T , where 0<ki � ki�1 � δG (1 < i � m) anddistðpki ; sp:cÞ � δD (1 � i � m). The starting and ending times are defined as the timestamps of the first and the final points in the subsequence, and the interval length of thesubsequence reflects spot duration.
The spot suggests that an animal remains in a spatial extent for a period andindicates potential significant behavior for a specific life need. The concept of the spotis similar to that of potential stop as proposed by Trasarti et al. (2011) and that of staypoint as presented by Li et al. (2008). Nonetheless, two important differences areobserved. First, the points in a potential stop or a stay point must be strictly continuous.Noise in the trajectories can be attributed to the occasional failures of GPS devices andother interferences. In this case, the previously developed approaches split a completebehavior into several segments. Second, these methods consider only the places atwhich an animal stays for a sufficiently long period of time, and ignore short-intervalmigration phases such as stopovers, which are also important in investigating animalmigration dynamics. We consider the distance to the center instead of the first point in
Table 1. List of notations used in this article.Notation Explanation Notation Explanation
T; Ti; Tj Trajectories sp:d,sp:c Duration and center of spTDB Trajectory dataset EPS Spatiotemporal radiusp; pi; pj Points in trajectories MinPts Density threshold in clusteringsp; spi; spj Representative spots NerDðspÞ Neighborhood of sp in the spot set DS; Si; Sj Spot sequences MaxI Time interval threshold in the CB-PatternSDB Set of spot sequences δG; δD Gap and distance thresholds for spotsC; Ci; Cj The spot clusters MinL Minimum length of a CB-PatternP; Pi; Pj CB-Patterns distðpi; pjÞ Spatial distance between pi and pjP:L Length of P SjP Projection of S with respect to Psp:s; sp:e Starting time and ending time of sp SDBjP Projection dataset with respect to P
4 Y. WANG ET AL.
Dow
nloa
ded
by [
Uni
vers
ity o
f O
klah
oma
Lib
rari
es]
at 0
8:05
06
Oct
ober
201
5
the behavior because animals often display a pendulum-like movement relative to anest site during breeding season.
According to Definition 2.2, a spot may be generated from individual randommovements. If multiple individuals generate spots that are similar in location and timedimensions, these spots should indicate a special type of significant common behavioralstate. Hence, we apply clustering technology to identify these like spots and capture thecommon behaviors shared by multiple animals. To determine the cluster exhibiting aspatiotemporal extent of arbitrary shape, we extend the notion of density-based cluster-ing (Ester et al. 1996) to the spatiotemporal context (called ST-DBSCAN) by employingthe following spatiotemporal neighborhood definition. Let EPS be a spatiotemporalradius with spatial component EPS:d and time component EPS:t while MinPts is a densitythreshold. The neighborhood of spot sp is defined as the set of spots whose spatialdistance to sp is no greater than EPS:d, and the difference in terms of the duration is nomore significant than EPS:t. A spot is a core if the size of its neighborhood reachesMinPts. Spot spj is directly density-reachable from spi if O is a core and spj is in theneighborhood of spi. Spot spj is density-reachable from spi, if there is a chain of spotsspk1 ; spk2 ; ::: ; spkm (spj ¼ spk1 , spi ¼ spkm ) such that spkl is directly density-reachable fromspklþ1 ("1 � l < m). Furthermore, spi and spj are density-connected to each other, ifthere is spk such that both spi and spj are density-reachable from spk . Finally, a spotcluster (hereafter cluster) C is a non-empty set of spots such that any two spi; spj in C aredensity-connected.
A cluster is a rough spatiotemporal outline of certain common behaviors. In theinitial clustering stage, the clusters identified on all spots may contain many occasionalspots that originate from the random movements of many individuals and do notactually exhibit underlying unified behaviors. However, if multiple individuals display asimilar spot sequence over a long period, then these individuals display categoricallysimilar behavioral states in each phase of this period. In addition, certain closely linkedsequential behavioral states are repeated over the course of the life span of a particularspecies or population (Pedersen et al. 2011). For example, a breeding state is oftenclosely followed by a molting state in waterfowl. Hence, we aim to identify the long-term sequential multiple behaviors that are observed occur in the movements of multi-ple individuals. The CB-Pattern contains a sequence of clusters to represent this type ofreoccurring behavior.
Definition 2.3: Let MaxI be the time interval and T be a trajectory from an individual.A spot sequence is a sequence of spots from T , which is denoted asS ¼ hsp1; sp2; . . . ; spni. In this equation, spi:e < spiþ1:s. If spj:s� spi:e � MaxI for the spiand spj in S, then spj is a linked successor of spi. Let S0 ¼ hspk1 ; spk2 ; . . . ; spkmi be a
(possibly non-consecutive) subsequence of S. S0is a continuous spot sequence if spklþ1 is a
linked successor of spkl for 1 � l < m.
Definition 2.4: A CB-Pattern with length L (L � MinL and MinL is the pattern lengththreshold) is denoted by a sequence of spot clusters P ¼ hC1; C2; . . . ; CLi, which areformed by a set of spot sequences (called instances of P). The CB-Pattern satisfies thefollowing criteria: (1) each instance is a continuous spot sequence with L spots under the
INTERNATIONAL JOURNAL OF GEOGRAPHICAL INFORMATION SCIENCE 5
Dow
nloa
ded
by [
Uni
vers
ity o
f O
klah
oma
Lib
rari
es]
at 0
8:05
06
Oct
ober
201
5

threshold MaxI; (2) each Cl is the set of the l-th spots of all instances, and the set is a spotcluster with respect to parameters EPSand MinPts; (3) if there is a continuous spotsequence hspk1 ; spk2 ; . . . ; spkLi such that Cl [ spkl ("1 � l � L) is a cluster, then spkl 2 Cland hspk1 ; spk2 ; . . . ; spkLi is an instance of P (i.e., P contains as many instances aspossible).
The spots in cluster Cl of the CB-Pattern P should be density-connected to oneanother without the aid of the spots beyond Cl. Thus, the initial clusters on the set are alloriginal spots that can include many occasional spots from animals whose movementsaccidentally intersect with the pattern. In the CB-Pattern, we eliminate the interferenceof these occasional spots, and aim to derive accurate spatiotemporal descriptions of theunderlying behavior sequence as well as individual movements that comply with theentire pattern. In Definition 2.4, the CB-Pattern can tolerate frequent slight divergencesor disturbances in real-life similar movements because of the application of relaxedcontinuity constraint MaxI. In the following paragraph, we present the projection-relatedconcept that is extended from the projection-based sequential pattern mining algorithmPrefixSpan (Pei et al. 2001) and applied to the pattern discovery framework.
Definition 2.5: Given animal spot sequence S ¼ hsp1; sp2; . . . ; spni and CB-Pattern P,we assume that the subsequence S0 ¼ hspk1 ; spk2 ; . . . ; spkLi in S is an instance of P andthat the last spot spkL in S0 is the i-th spot spi in. The subsequent sequence in S, i.e.,hspiþ1; spiþ2; . . . ; spni, is a projection of S with respect to P. If there is no instance of P in S,then the projection of S with respect to P is empty. If multiple instance are detected in S,then multiple projections of Sare generated. The projection set of S with respect to P iswritten as SjP. The projection set of all animal spot sequences with respect to P isexpressed as SDBjP.
We provide a simple example of the projection as follows. Assume that MaxI ¼ 3, thecurrent CB-Pattern P ¼ ha; bi (a and b are the cluster identifiers), and a spot sequence Sis hða; 1; 3Þ, ðb; 5; 8Þ, ðc; 9; 10Þ, ðd; 11; 12Þ, ða; 14; 17Þ, ðe; 18; 18Þ, ðb; 19; 21Þ, ðb; 23; 24Þi. Inthis example, a triple indicates a spot which contains the cluster identifier, the startingtime and ending time of the spot. Then, SjP ¼ fhðc; 9; 10Þ, ðd; 11; 12Þ, ða; 14; 17Þ,ðe; 18; 18Þ, ðb; 19; 21Þ, ðb; 23; 24Þi, hðb; 23; 24Þig.
3. Pattern discovery framework
In this section, we present a CGAR framework for discovering all CB-Patterns, andpropose an ordered processing strategy to accelerate this framework (CGAR using theOrdered processing strategy OS is called CGAR_OS). The CB-Pattern is built on theconcept of representative spots. Therefore, we first present the algorithm to extractthe spot sequence (Algorithm 1). According to Definition 2.2, two or more spots fromthe same trajectory may coexist and overlap in the time dimension. To avoid thissituation, we adopt an early selection principle (Palma et al. 2008). Algorithm 1 scansthe raw trajectory once and returns a spot sequence in which each spot has thefollowing attributes: center, starting time, ending time, and duration time. The settingsof parameters δG and δD depend on the specific application scenario. For example, whenwe consider the movement of migratory birds, δD may be set to several tens of kilo-meters and δG to a small integer.
6 Y. WANG ET AL.
Dow
nloa
ded
by [
Uni
vers
ity o
f O
klah
oma
Lib
rari
es]
at 0
8:05
06
Oct
ober
201
5

Algorithm 1: Spot extraction
Input: A trajectory T , δG, δDOutput: A spot sequence S1: i ¼ 0, S ¼ <>;2: while i < lengthðTÞ do3: j ¼ i þ 1; skipped ¼ 0; lastIndex ¼ i;4: sp ¼ pih i; // start a new spot5: while j < lengthðTÞ do6: if skipped � δG then // end of the current spot7: setStartEndTimeðspÞ;8: S:AppendðspÞ;9: break;10: else if dist p; sp:cð Þ � δD then11: sp:AppendðpjÞ;12: lastIndex ¼ lastIndex þ 1; // reset the number of point skipped continuously13: else // the current point is consider as the noise14: skipped ¼ skipped þ 1;15: end if16: j ¼ j þ 1;17: end while18: i ¼ lastIndex þ 1;19: end while20: return S
The CGAR framework is presented in Algorithm 2. CGAR consists of the spot extrac-tion phase and two intertwined phases, namely, candidate generation and candidaterefinement. The candidate generation phase (Lines 6 ~ 15) follows the pattern-growthstrategy in the PrefixSpan algorithm (Pei et al. 2001), where candidate CB-Patterns (i.e., asequence of clusters) are generated incrementally. We extend the current CB-Pattern Pto a long candidate Pcand using the clusters identified on the linked successor spots ofthe final spots in the current instances of P. That is, we extend the current instances withlinked successor spots. In Line 15, some current instances cannot be extended and arethus inconsistent with Pcand; consequently, these spots are removed. Upon eliminatingthe interference of these occasional spots, the clustering structures of the changedclusters in Pcand may be altered. One initial cluster in P may evolve into either anaccurate cluster or several separable clusters. Hence, we refine the candidates to derivetrue CB-Patterns in the candidate refinement phase (Line 16).
Algorithm 2: The Candidate Generation and Refinement Framework (CGAR)Input: A set of trajectory TDB, δG δD,, EPS, MinPts, MaxI and MinLOutput: A set of CB-Patterns R1: SDB ¼ ;; // initialize a set of spot sequences2: for each T 2 TDB do
INTERNATIONAL JOURNAL OF GEOGRAPHICAL INFORMATION SCIENCE 7
Dow
nloa
ded
by [
Uni
vers
ity o
f O
klah
oma
Lib
rari
es]
at 0
8:05
06
Oct
ober
201
5
3: S ¼ extractSpots(T ; δG; δD); //extract the spot sequence
4: SDB ¼ SDB [ S;5: end for6: Q ¼ fð<>; SDBÞg; // initialize a candidate P ¼ hi with length 0 and SDB as its projectiondataset, and use a queue Q to store the pairs7: while Q � ; do8: ðP; SDBjPÞ ¼ Q:DeQueueðÞ;9: if P:L � MinL then10: R ¼ R [ P;11: end if12: SPnext ¼ collectSuccessors ðSDBjP; MaxIÞ;13: CS ¼ ST DBSCAN(SPnext; EPS; MinPts); // cluster the spots using the modifiedDBSCAN algorithm14: for each C 2 CS do15: Pcand ¼ extendInstancesðP; CÞ.; // generate a candidate by appending the spotsin to the instances of P16: PS ¼ refineðPcand; EPS; MinPtsÞ; // PS is the set of true CB-Patterns derivedfrom Pcand17: for each Pnext 2 PS do18: SDBjPnext ¼ projectingðPnextÞ;19: Q:EnQueueððPnext; SDBjPnextÞÞ; // add the new pair to Q20: end for21: end for22: return R;
In the candidate generation phase of Algorithm 2, the subsequent clusters for extendingP are identified on the projection dataset with respect to P. Here, we employ the pseudo-projection technique (Pei et al. 2001) to reduce the cost of projection; that is, we use thepointer referring to the spot sequence and the offset the final spot of the pattern instance inthe sequence instead of storing the true projection subsequence. In the functioncollectSuccessors (Line 12 in Algorithm 2), we obtain all linked successors of the last spotsin the instances of P. Then, we cluster these spots using the ST_DBSCAN clustering algo-rithmmentioned in Section 2. We append the spots in each cluster to the instances of P, andgenerate a new candidate Pcand in the process (Line 13 in Algorithm 1).
If certain spots are removed from the l-th (1 � l � P:L) cluster when P is extended to Pcand,then the refinement procedure is conducted (Line 14 in Algorithm 1). The steps of refinementprocedure are shown in Algorithm 3, which updates candidate Pcand and may divide it intoseveral CB-Patterns. If the l-th spot set Cl changes after the final clustering process performedon it, we examine whether or not the remaining spots in Cl still constitute a cluster. If spot setCl is divided into several clusters, then a new candidate is generated with respect to eachnewly generated cluster (Line 8 in Algorithm 3), and the refinement procedure is recursivelyexecuted on each new candidate(Line 9 in Algorithm 3). Each candidate either evolves into aCB-Pattern or is abandoned if any of the sets no longer contains a cluster.
8 Y. WANG ET AL.
Dow
nloa
ded
by [
Uni
vers
ity o
f O
klah
oma
Lib
rari
es]
at 0
8:05
06
Oct
ober
201
5

Algorithm 3: Refine
Input: A candidate CB-Pattern.Pcand., EPS, MinPtsOutput: A set of CB-Patterns1: for Ci 2 Pcand do2: if isChangedðCiÞ ¼ false then // Ci is unchanged3: continue;4: end if5: CS ¼ ST DBSCAN Ci; EPS;MinPtsð Þ;6: if CS � Ci then // the clustering structure on Ci has changed7: for C 2 CS do8: P
0cand ¼ SplitWith Pcand; Cð Þ; // Retain the instances associated with the spot in C
9: PS0 ¼ RefineðPcand; EPS; MinSupÞ;10: PS ¼ PS [ PS0;11: end for12: end if13: return PS;14:end for15:if i > Pcand:L then // each spot set in Pcand is a cluster16: return fPcandg;17:end if
The clustering algorithm ST_DBSCAN is used frequently in the CGAR framework. Duringthe clustering process, for a spot we must scan the spot set to retrieve its neighborhood. Ittakes Oðn2Þ time for n spots without a spatial index. Maintaining a spatial index, such asR-tree, leads to a high cost of processing time because the set of spots always changes(Tang et al. 2013). This, we employ a simple three-dimensional (i.e., latitude, longitude andtime) grid structure as the index by partitioning time and space into cubes with widthsEPS:d and EPS:t in the space and time dimensions, respectively. We then directly retrievethe spots located in adjacent cells and filter these spots as the neighborhood during theneighborhood search for a spot. The grid can be maintained in OðnÞ time.
During the refinement procedure, we examine all spot sets sequentially, as shown inAlgorithm 3. We can accelerate this procedure through heuristic strategies. In the refine-ment phase, we can determine the change in each spot set since the previous clustering onthis set, i.e., we can detect the numbers removed from this set. The number of spotsremoved is often unequal to the number of instances eliminated, and the numbers maybe inconsistent for different sets of one candidate pattern. On the basis of the number ofspots removed from each set, we design an ordered processing strategy to acceleratecandidate refinement. In the employed strategy, the cluster structures of the sets areexamined in the descending order of the numbers of elements removed from the sets. Asignificant change in a set may lead to greater shrinkage of the cluster, and therefore, moreinterrelated spots in the candidate are removed. Hence, the candidate can be updatedmorequickly and evolves into one ormore true patterns, or is abandoned once any of its sets doesnot contain a cluster. The CGAR framework that use the Ordered processing Strategy iscalled CGAR_OS, as mentioned previously.
INTERNATIONAL JOURNAL OF GEOGRAPHICAL INFORMATION SCIENCE 9
Dow
nloa
ded
by [
Uni
vers
ity o
f O
klah
oma
Lib
rari
es]
at 0
8:05
06
Oct
ober
201
5

4. Experiments
In this section, we present the results of our proposed CB-Pattern given real trajectorydatasets of wild birds. Specifically, we design a trajectory generator to generate largesynthetic datasets and to systematically evaluate the running cost of the framework. Allthe algorithms used in these experiments are implemented in Java and are executed ona single machine with Intel Core(TM) 2 Quad 2.66 GHz CPU and 4 GB memory.
4.1. Datasets
We obtained three real trajectory datasets from three separate satellite tracking projectscomprised ofmultiple deployments for wild birds marked in China, India, andMongolia. Thetracking projects in China were deployed in 2007 and 2008. They generated 55 trajectoriesfrom 29 bar-headed geese and 26 ruddy shelducks. The tracking projects in India weredeployed from 2005 to 2011, and resulted in 36 trajectories of bar-headed geese and 14trajectories of ruddy shelducks. The tracking project in Mongolia was deployed in 2008 andresulted in 38 bar-headed geese. In summary, the aggregate datasets contained 143trajectories of wild birds for use in this analysis. The two monitored species, bar-headedgoose and ruddy shelduck, migrate along the migration corridors in Central Asia. Thesebirds were equipped with solar-powered, GPS-accuracy Platform Terminal Transmitters. Thelocations were estimated either through GPS or with the Argos system when a GPS-fixcannot be obtained. These datasets are available for visualization on the website of U.S.Geological Survey.1 We sampled the location data at a frequency of one per day. Theavailable length of a generated trajectory for an individual bird varies from several days to3 years, and the total number of location records is 31,324. An overview of the dataset isshown in Figure 1(a).
In addition to the real dataset, we designed a trajectory generator that synthesizesnew trajectories based on the real trajectory dataset. Data generation is controlled bythe following parameters: number N of trajectories, average length L of trajectories, ratio
Figure 1. Overview of the trajectory datasets. Each colored polyline indicates a trajectory. (a) Realtrajectory datasets of wild birds. (b) Example of synthetic datasets generated with the developedtrajectory generator.
10 Y. WANG ET AL.
Dow
nloa
ded
by [
Uni
vers
ity o
f O
klah
oma
Lib
rari
es]
at 0
8:05
06
Oct
ober
201
5
α of noisy trajectories, spatial standard deviation γ and temporal standard deviation ε toadd perturbations to the reference spot, standard deviation σ of random movementsrelative to the spot, the possibility β that an object changes its reference trajectoryduring movement, and agility λ of the movement among consecutive reference spots. Inthe generation process, we applied the real spot sequences of the birds as references. Togenerate a trajectory, we randomly select the spot sequence of an animal as thereference sequence and utilize its initial spot as the reference spot. We introduced thevariance by perturbing the spot through bivariate Gaussian distribution with standarddeviations γ and ε. In addition, we further randomly generate trajectory points relative tothe perturbed spot via Gaussian distribution with standard deviation α. Then, the objectmoves to the next spot along the reference sequence. During this iteration, we generatein-between locations in a random direction under the control of agility threshold λ. Theagility threshold λ denotes the maximum deviation between actual movement directionand the linear direction from the current location to the destination spot. The referencetrajectory of an object can change during the generation process with possibility β, andalters changes its movement patterns thereafter. During the change, we randomly selecta spot associated with other animals according to the bivariate Gaussian distribution onthe current spot with spatial standard deviation γ and temporal standard deviation ε.The associated sequence is regarded as new reference and the next spot as the newreference spot. The dataset contains α� N random trajectories which are randomlygenerated with arbitrary spots. The default parameters of the data generator used inthese experiments are as follows: N ¼ 2000, L ¼ 800, α ¼ 0:1, .γ ¼ 25. km, ε ¼ 5 days,σ ¼ 15 km, β ¼ 0:1, and λ ¼ 45
�. Hence, the default size of the synthetic GPS dataset is
1,600,000. An example of the synthetic dataset is also presented in Figure 1(b).
4.2. Results
We first present the experimental results for the three real datasets. All the birds in thedatasets are located in the migration corridors of Central Asia from Mongolia to Indiaand their trajectories intersect partially. Thus, we apply the CGAR framework to thesedatasets simultaneously and report the corresponding results. On the basis of therelated ecological study on the home ranges of these wild birds (Cui et al. 2011), weset δD as 30 km and δG as 3. Moreover, we set MinPts as 3, MaxI as 15 days, MinL as 1,EPS:d as 80 km, and EPS:t as 15 days.
We present five typical CB-Patterns derived from the bird dataset in Figure 2. Thesepatterns are consistent with those highlighted in ecological research studies conductedin this region (Takekawa et al. 2009, Prosser et al. 2011), and cover the main migrationroutes of bar-headed geese and ruddy shelduck in Central Asia. These underlyingbehavioral states are inferred according to the location semantics and the time periodsin which the clusters exist, as well as the close sequential relationship among theclusters in a pattern. For example, the longest pattern P1 = 1, 2, 3, 4, 5, 6, 7, 8 of length8 with the duration sequence <51 ~ 60, 1 ~ 3, 2 ~ 23, 1 ~ 13, 7 ~ 20, 1 ~ 13, 1 ~ 8, 1 ~ 9>(the green path in Figure 2) indicates that the corresponding birds breed in Region 1 for51 ~ 60 days (Terkhiin Tsagaan Lake, Mongolia, 48:1629oN,99:6909oE), and then stop-over in Regions 2 ~ 8 (Khangai Nuruu National Park, northeast of Hala Lake, east of Hala
INTERNATIONAL JOURNAL OF GEOGRAPHICAL INFORMATION SCIENCE 11
Dow
nloa
ded
by [
Uni
vers
ity o
f O
klah
oma
Lib
rari
es]
at 0
8:05
06
Oct
ober
201
5

Lake, Zhaling Lake, Zhiduo County, Zhamucuo Wetland, and Selincuo BNC NR) succes-sively. Pattern P2 (the blue one in Figure 2) denotes a successive stopover sequence fromHala Lake (38:65�N,98:09�E), Qinghai Province, to Selincuo BNC NR (31:86�N,88:98�E).Pattern P3 = 14, 15, 16, 17, 18, 19 with the duration sequence 145 ~ 170, 1 ~ 6, 1 ~ 4,25 ~ 46, 1 ~ 10, 1 ~ 12 suggests some birds breed and molt in the Qinghai Lake region,and then continue to migrate south continuously. Pattern P4 = 20, 21, 22, 23, 24, 25 withthe duration sequence 20 ~ 42, 1 ~ 1, 6 ~ 19, 126 ~ 138, 1 ~ 2, 6 ~ 19 in Figure 2 showsthat a flock of birds remains at Zhaling Lake before the start of autumn migration, passesZhamucuo Wetland and Selincuo BNC NR, winters in Tibet River Valley (Region 16) formore than 126 days, and then migrates back to Namucuo Lake and then to ZhamucuoWetland. Pattern P5 = 26, 27, 28, 29 with the duration sequence 1 ~ 27, 1 ~ 12, 1 ~ 7,116 ~ 136 in Figure 2 denotes a northward migration from Shannan Prefecture of TibetAutonomous Region (29:26�N,91:76�E) in China during spring, before settling at theQinghai Lake region in the breeding and molting periods.
By observing the individuals involved in these CB-Patterns, we detect significantdifferences that between the birds marked in Mongolia and those marked in China interms of the selection of breeding sites. We also noted a slight variation between thesetwo types of birds with regard to the migration routes taken. The birds marked in Chinabred at Qinghai Lake, China, whereas the majority of those marked in Mongolia fly overHala Lake (northwest of Qinghai Lake) to Mongolia to breed. The birds marked in Indiaare similar to those marked in Mongolia with regard to their behavior sequences. A fewbirds marked in India intersect with the birds marked in China: the spatial and temporaloverlaps are concentrated in the migration periods. Consider the examples of CB-Patterns in Figure 2. P1 is formed by the birds marked with GPS devices in Mongolia,whereas P3 and P4 are generated by the birds marked in Qinghai Lake, China. Thisphenomenon reveals the high discriminating power of CB-Patterns on different
Figure 2. Examples of CB-Patterns derived from the wild bird satellite telemetry datasets. Eachcluster in a CB-Pattern is represented by a polygon (convex hull is used here), and its identifier ismarked near the polygon. Each directed path that connects the clusters denotes a CB-Pattern. Eachpath and the associated clusters are marked in a distinctive color. (a) Three CB-Patterns and (b) twoCB-Patterns.
12 Y. WANG ET AL.
Dow
nloa
ded
by [
Uni
vers
ity o
f O
klah
oma
Lib
rari
es]
at 0
8:05
06
Oct
ober
201
5

migration dynamics. P5 is attributed to the birds marked in India and in Qinghai Lake,China, whereas P2 involves the birds marked in Mongolia and India. This findingsuggests the similarities and intersections among the birds marked in India and thosefrom Mongolia and China.
Figure 3 shows the numbers of CB-Patterns derived from the wild bird datasets withrespect to time interval threshold MaxI between two consecutive behaviors in thesepatterns. When MaxI is set to 1, no gap is allowed in the pattern. Many interestingpatterns such as P1~P5 in Figure 2 can be identified by implementing the loose continuityconstraint. This constraint facilitates the robustness of the CB-Pattern in the event of themissing or noisy data and the tolerance of the pattern for slight divergences in actuallysimilar individual behaviors, and in the tracking data. Figure 4 presents the maximum,minimum, and average life spans of the patterns with respect to the pattern length. Here,we define pattern life span as the duration time from the start of a pattern to its end.Many significant, long-term similarities are observed in the movements of these birds.
4.3. Cost analysis
On the basis of the synthetic datasets, we studied the running cost of our proposedCGAR framework on CB-Pattern discovery. In particular, we measure the runtime costand memory requirement of CGAR given different parameter settings and assess the
Figure 3. Number and length of CB-Patterns derived from the real datasets with respect to MaxI.
Figure 4. Life spans of the patterns with respect to the pattern length.
INTERNATIONAL JOURNAL OF GEOGRAPHICAL INFORMATION SCIENCE 13
Dow
nloa
ded
by [
Uni
vers
ity o
f O
klah
oma
Lib
rari
es]
at 0
8:05
06
Oct
ober
201
5
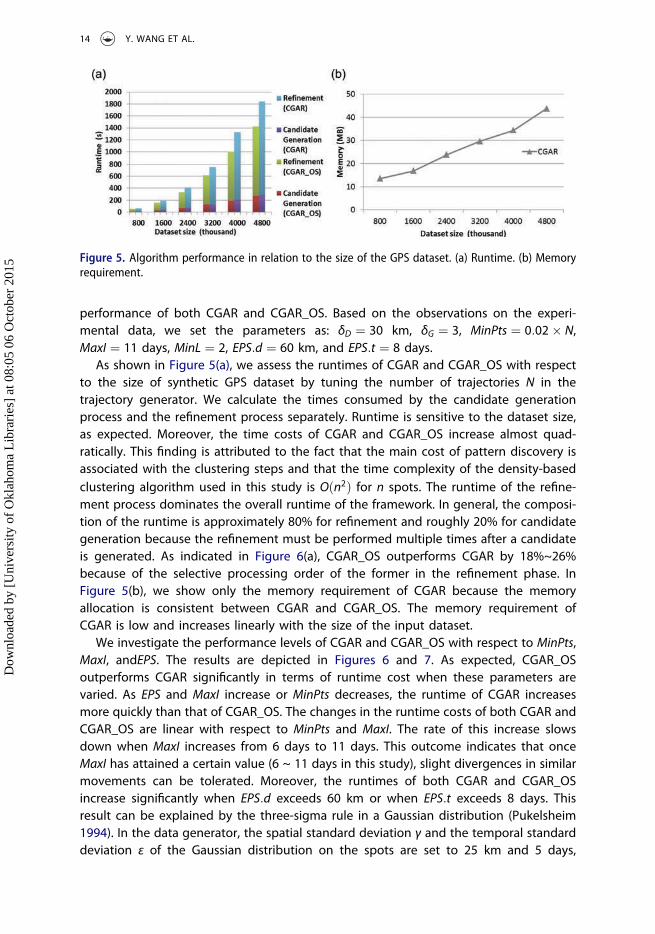
performance of both CGAR and CGAR_OS. Based on the observations on the experi-mental data, we set the parameters as: δD ¼ 30 km, δG ¼ 3, MinPts ¼ 0:02� N,MaxI ¼ 11 days, MinL ¼ 2, EPS:d ¼ 60 km, and EPS:t ¼ 8 days.
As shown in Figure 5(a), we assess the runtimes of CGAR and CGAR_OS with respectto the size of synthetic GPS dataset by tuning the number of trajectories N in thetrajectory generator. We calculate the times consumed by the candidate generationprocess and the refinement process separately. Runtime is sensitive to the dataset size,as expected. Moreover, the time costs of CGAR and CGAR_OS increase almost quad-ratically. This finding is attributed to the fact that the main cost of pattern discovery isassociated with the clustering steps and that the time complexity of the density-basedclustering algorithm used in this study is Oðn2Þ for n spots. The runtime of the refine-ment process dominates the overall runtime of the framework. In general, the composi-tion of the runtime is approximately 80% for refinement and roughly 20% for candidategeneration because the refinement must be performed multiple times after a candidateis generated. As indicated in Figure 6(a), CGAR_OS outperforms CGAR by 18%~26%because of the selective processing order of the former in the refinement phase. InFigure 5(b), we show only the memory requirement of CGAR because the memoryallocation is consistent between CGAR and CGAR_OS. The memory requirement ofCGAR is low and increases linearly with the size of the input dataset.
We investigate the performance levels of CGAR and CGAR_OS with respect to MinPts,MaxI, andEPS. The results are depicted in Figures 6 and 7. As expected, CGAR_OSoutperforms CGAR significantly in terms of runtime cost when these parameters arevaried. As EPS and MaxI increase or MinPts decreases, the runtime of CGAR increasesmore quickly than that of CGAR_OS. The changes in the runtime costs of both CGAR andCGAR_OS are linear with respect to MinPts and MaxI. The rate of this increase slowsdown when MaxI increases from 6 days to 11 days. This outcome indicates that onceMaxI has attained a certain value (6 ~ 11 days in this study), slight divergences in similarmovements can be tolerated. Moreover, the runtimes of both CGAR and CGAR_OSincrease significantly when EPS:d exceeds 60 km or when EPS:t exceeds 8 days. Thisresult can be explained by the three-sigma rule in a Gaussian distribution (Pukelsheim1994). In the data generator, the spatial standard deviation γ and the temporal standarddeviation ε of the Gaussian distribution on the spots are set to 25 km and 5 days,
Figure 5. Algorithm performance in relation to the size of the GPS dataset. (a) Runtime. (b) Memoryrequirement.
14 Y. WANG ET AL.
Dow
nloa
ded
by [
Uni
vers
ity o
f O
klah
oma
Lib
rari
es]
at 0
8:05
06
Oct
ober
201
5

respectively. When the distance threshold exceeds several times the standard deviation,many of the elements mixed into the current cluster that are actually unrelated to thiscluster. As a result, the clustering cost increases rapidly. As per Figure 8, the memoryrequirement is always low under different settings, and the change trend of thisrequirement is similar to that of runtime cost.
Figure 6. Runtime in relation to (a) MinPts, (b) MaxI, (c) EPS.d, and (d) EPS.t.
Figure 7. Memory requirement in relation to (a) MinPts, (b) MaxI, (c) EPS.d, and (d) EPS.t.
INTERNATIONAL JOURNAL OF GEOGRAPHICAL INFORMATION SCIENCE 15
Dow
nloa
ded
by [
Uni
vers
ity o
f O
klah
oma
Lib
rari
es]
at 0
8:05
06
Oct
ober
201
5

Furthermore, we analyze the numbers of CB-Patterns discovered in the syntheticdataset under different parameter settings, as shown in Figure 8. The number of theCB-Patterns is maximized at approximately EPS:d ¼ 60 km and EPS:t ¼ 16 days. WhenEPS:d increases further, the number of patterns decreases considerably; this numberchanges only slightly when EPS:t varies from 12 days to 16 days. This outcome indicatesthat a desirable EPS:d value is roughly 60 km and that a suitable setting for EPS:t isapproximately 12 days. Therefore, our results are consistent with the spatiotemporalGaussian distribution in the data generator.
5. Discussion
In this article, we investigated the application of the proposed CB-Pattern through thesequential behaviors exhibited by animals during migration. This pattern is an extensionof the spatiotemporal sequential pattern: regular and repeated migration behaviors arederived in the context of their spatiotemporal attributes through the described auto-mated process. In addition, similarities are detected in multiple individual movementsand the process of translating these similarities into population-level patterns is deter-mined. As illustrated through the wild bird and synthesized datasets, the CB-Pattern cantolerate a certain degree of divergence and perturbation among real-life similar migra-tion behaviors. On the basis of such patterns, we can infer the behavioral states ofspecific species, and of different functional areas for the various stages of animal life.
As a particular species transitions between distinct annual life cycle states, general-ized patterns of movement and behavior are recognizable, and therefore may bedistinguishable based on these patterns. These patterns can also be extended to specialtracking scenarios in which regional movements are a result of behavior states. Thefundamental definition of representative spot permits two or more spots to coexist andoverlap in time. These spots are combined to represent a generalized behavioral stateowing to the adoption of the early selection principle (Palma et al. 2008) in the CGARframework. Continuous movements between two areas for foraging and feeding are
Figure 8. Number of CB-Patterns in relation to MinPts, MaxI, EPS:d, and EPS:t.
16 Y. WANG ET AL.
Dow
nloa
ded
by [
Uni
vers
ity o
f O
klah
oma
Lib
rari
es]
at 0
8:05
06
Oct
ober
201
5

extracted as a common spot in CGAR. If necessary, we can retain multiple overlappedspots by modifying the spot extraction process in CGAR and applying the distance to thefirst point in the spot as the distance constraint. We can also consider these moves to bemultiple repeating spots by tuning gap threshold δG in the spot definition. Behavioralstates for sufficient duration can also be implemented by incorporating an additionalconstraint into the spot definition.
The five typical CB-Pattern sequences for bar-headed geese and ruddy shelducks inthe Tibetan Plateau region highlighted the ecological requirements for multiple stop-over and staging areas as sought by species during migration periods and for thelinkage of breeding and wintering grounds during both migration stages. Likewise,the confluence of the two breeding populations from Qinghai Lake and Mongolia wasclearly identified in this process, thus highlighting a region of potential populationexchange and potential bottleneck to the species if environmental conditions resultedin a density-independent impact to survival (Takekawa et al. 2009, Prosser et al. 2011).Finally, the collective analysis conducted across marked individuals through the applica-tion of the CB-Pattern process on high-frequency and high-accuracy datasets may helphighlight and identify the movement differences among individuals to the populationlevel. Perhaps more importantly, by generating an inventory of sites identified by theCB-Pattern, the current analysis creates baseline information for future comparison todetect changes in annual site fidelity patterns or in habitat availability at certain sites asa result of environmental or anthropogenic influences. This information can guidespecific conservation efforts in different areas, different life stages, and for differentspecies.
6. Conclusion
In this article, we propose a notion of continuous behavior patterns to model theunderlying common sequential behaviors during animal migrations. The continuousbehavior pattern is defined as a sequence of common behaviors shared by multipleindividuals, and is derived from individual similar movement fragments. Common beha-viors are identified based on the spatiotemporal clustering of movement phases. Thebehavioral states of the overall pattern can be inferred depending on the spatiotemporaland sequential contexts. We also design a CGAR framework to derive all continuousbehavior patterns from a raw trajectory dataset, and further propose an intuitivelyprocessing strategy to improve the framework performance. The results of experimentsperformed on three datasets comprising wild birds that migrate internationally showthat our approaches are practical for discovering and portraying the spatiotemporalsemantics of collective animal migration behaviors. Finally, we assess the running cost ofthe pattern discovery framework by conducting extensive experiments and a compre-hensive analysis based on synthetic datasets. This work aids biologists in understandingcollective animal activities, in determining the similarities among individuals or popula-tions, and in identifying different behavioral stages and associated functional areas in anecologically insightful manner. This article also presents a potential approach for thestudy of the relationships among animals according to trajectories collected duringdifferent periods. Finally, this study can provide useful information to guide specificconservation efforts in different areas, life stages, and for different species.
INTERNATIONAL JOURNAL OF GEOGRAPHICAL INFORMATION SCIENCE 17
Dow
nloa
ded
by [
Uni
vers
ity o
f O
klah
oma
Lib
rari
es]
at 0
8:05
06
Oct
ober
201
5

Note
1. http://www.werc.usgs.gov/ResearchTopicPage.aspx?id=17.
Acknowledgments
The authors thank Movebank (https://www.movebank.org) that serves as a data repository fortracking information collected by the joint FAO and USGS project on the Role of Wild Birds inhighly pathogenic avian influenza H5N1. The use of trade, product, or firm names in this publica-tion is for descriptive purposes only and does not imply endorsement by the U.S. Government.
Disclosure statement
No potential conflict of interest was reported by the authors.
Funding
Funding was provided by the Natural Science Foundation of China under Grant No. 61361126011,No. 90912006; the Special Project of Informatization of Chinese Academy of Sciences in ‘theTwelfth Five-Year Plan’ under Grant No. XXH12504-1-06; The National R&D Infrastructure andFacility Development Program of China under Grant No. BSDN2009-18; Five Top Priorities of‘One-Three-Five’ Strategic Planning, CNIC under Grant No. CNIC_PY-1408, No. CNIC_PY-1409;United States Geological Survey (Patuxent Wildlife Research Center, Western Ecological ResearchCenter, Alaska Science Center, and Avian Influenza Program); the United Nations FAO, AnimalProduction and Health Division, EMPRES Wildlife Unit; National Science Foundation Small Grantsfor Exploratory Research [No. 0713027].
References
Alerstam, T. and Lindström, Å., 1990. Optimal bird migration: the relative importance of time,energy, and safety. In: E. Gwinner, ed. Bird migration. Berlin: Springer, 331–351.
Altizer, S., Bartel, R., and Han, B.A., 2011. Animal migration and infectious disease risk. Science, 331(6015), 296–302. doi:10.1126/science.1194694
Benkert, M., et al., 2008. Reporting flock patterns. Computational Geometry, 41 (3), 111–125.doi:10.1016/j.comgeo.2007.10.003
Black, J.M., Prop, J., and Larsson, K., 2007. Wild goose dilemmas: population consequences ofindividual decisions in barnacle geese. Groningen: Branta Press.
Bridge, E.S., et al., 2011. Technology on the move: recent and forthcoming innovations for trackingmigratory birds. BioScience, 61 (9), 689–698. doi:10.1525/bio.2011.61.9.7
Cao, H., Mamoulis, N., and Cheung, D.W., 2005. Mining frequent spatio-temporal sequential patterns.In: Proceedings of the fifth IEEE international conference on data mining. Houston, TX: IEEE.
Cui, P., et al., 2011. Movement patterns of bar-headed geese Anser indicus during breeding andpost-breeding periods at Qinghai Lake, China. Journal of Ornithology, 152 (1), 83–92.doi:10.1007/s10336-010-0552-6
Drent, R., et al., 2003. Pay-offs and penalties of competing migratory schedules. Oikos, 103, 274–292. doi:10.1034/j.1600-0706.2003.12274.x
Ester, M., et al., 1996. A density-based algorithm for discovering clusters in large spatial databases withnoise. In: Proceedings of the 2nd international conference on knowledge discovery and data mining.Menlo Park, CA: AAAI Press.
Faaborg, J., et al., 2010. Conserving migratory land birds in the new world: do we know enough?Ecological Applications, 20 (2), 398–418. doi:10.1890/09-0397.1
18 Y. WANG ET AL.
Dow
nloa
ded
by [
Uni
vers
ity o
f O
klah
oma
Lib
rari
es]
at 0
8:05
06
Oct
ober
201
5

Fretwell, S.D. and Lucas, H.L., 1969. On territorial behavior and other factors influencing habitatdistribution in birds. Acta Biotheoretica, 19, 16–36. doi:10.1007/BF01601953
Giannotti, F., et al., 2007. Trajectory pattern mining. In: Proceedings of the 13th ACM SIGKDDinternational conference on knowledge discovery and data mining. New York: ACM.
Jeung, H., et al., 2008. Discovery of convoys in trajectory databases. Proceedings of the VLDBEndowment, 1 (1), 1068–1080. doi:10.14778/1453856
Johnson, D.H., 1980. The comparison of usage and availability measurements for evaluatingresource preference. Ecology, 61, 65–71. doi:10.2307/1937156
Li, Q., et al., 2008. Mining user similarity based on location history. In: Proceedings of the 16th ACMSIGSPATIAL international conference on advances in geographic information systems. New York:ACM.
Li, Z., et al., 2011. MoveMine: mining moving object data for discovery of animal movementpatterns. ACM Transactions on Intelligent Systems and Technology (TIST), 2 (4), 37.
Newton, I., 2008. The migration ecology of birds. London: Academic Press.Owen, M., 1980. Wild geese of the world: their life history and ecology. London: B.T. Batsford.Palma, A.T., et al., 2008. A clustering-based approach for discovering interesting places in trajec-
tories. In: Proceedings of the 2008 ACM symposium on applied computing. Fortaleza: ACM.Pedersen, M.W., et al., 2011. Estimating animal behavior and residency from movement data. Oikos,
120 (9), 1281–1290. doi:10.1111/more.2011.120.issue-9Pei, J., et al., 2001. Prefixspan: mining sequential patterns efficiently by prefix-projected pattern
growth. In: Proceedings of the 17th international conference on data engineering (ICDE 2001).Heidelberg: IEEE Computer Society.
Prop, J., Black, J.M., and Shimmings, P., 2003. Travel schedules to the high arctic: barnacle geesetrade-off the timing of migration with accumulation of fat deposits. Oikos, 103, 403–414.doi:10.1034/j.1600-0706.2003.12042.x
Prosser, D.J., et al., 2011. Wild bird migration across the Qinghai-Tibetan plateau: a transmissionroute for highly pathogenic H5N1. Plos One, 6 (3), e17622. doi:10.1371/journal.pone.0017622
Prosser, D.J., et al., 2009. Satellite-marked waterfowl reveal migratory connection between H5N1outbreak areas in China and Mongolia. Ibis, 151 (3), 568–576. doi:10.1111/j.1474-919X.2009.00932.x
Pukelsheim, F., 1994. The three sigma rule. The American Statistician, 48 (2), 88–91.Takekawa, J., et al., 2009. Geographic variation in bar-headed geese Anser indicus: connectivity of
wintering areas and breeding grounds across a broad front. Wildfowl, 59 (59), 100–123.Takekawa, J.Y., et al., 2010. Victims and vectors: highly pathogenic avian influenza H5N1 and the
ecology of wild birds. Avian Biology Research, 3 (2), 51–73. doi:10.3184/175815510X12737339356701
Tang, L.-A., et al., 2013. A framework of traveling companion discovery on trajectory data streams.ACM Transactions on Intelligent Systems and Technology (TIST), 5 (1), 3.
Trasarti, R., et al., 2011. Mining mobility user profiles for car pooling. In: Proceedings of the 17th ACMSIGKDD international conference on knowledge discovery and data mining. San Diego, CA: ACM.
Wang, Y., et al., 2014. Mining continuous activity patterns from animal trajectory data. In: Advanceddata mining and applications. Guilin: Springer, 239–252.
Zhang, X., et al., 2004. Fast mining of spatial collocations. In: Proceedings of the tenth ACM SIGKDDinternational conference on knowledge discovery and data mining. Seattle, WA: ACM.
INTERNATIONAL JOURNAL OF GEOGRAPHICAL INFORMATION SCIENCE 19
Dow
nloa
ded
by [
Uni
vers
ity o
f O
klah
oma
Lib
rari
es]
at 0
8:05
06
Oct
ober
201
5