a new method for assessing the sustainability of land-use systems (i): identifying the relevant...
TRANSCRIPT

E C O L O G I C A L E C O N O M I C S 6 8 ( 2 0 0 9 ) 1 2 7 5 – 1 2 8 7
ava i l ab l e a t www.sc i enced i rec t . com
www.e l sev i e r. com/ l oca te /eco l econ
METHODS
A new method for assessing the sustainability of land-usesystems (I): Identifying the relevant issues
Christof Waltera,⁎, Hartmut Stützelb
aUnilever Colworth, Colworth Park, Sharnbrook, UKbInstitute of Vegetable and Fruit Science, Natural Sciences, University of Hanover, Germany
A R T I C L E D A T A
⁎ Corresponding author. Unilever Colworth, SE-mail address: [email protected]
0921-8009/$ – see front matter © 2008 Elsevidoi:10.1016/j.ecolecon.2008.11.016
A B S T R A C T
Article history:Received 21 November 2005Received in revised form22 November 2008Accepted 23 November 2008Available online 20 January 2009
Definitions of sustainability abound. However, they tend to be abstract and thus open todiverging interpretations. Conversely, scientists need concrete guidance to developquantitative measures of the sustainability of agricultural systems, such as sustainabilityindicators. Bridging this gap between what policy provides and what scientists needinvolves strong normative elements.Many publications on sustainable agriculture suggest bridging the gap through participatorystakeholder processes. However, participatory stakeholder involvement is not alwayspracticable, due to the high cost and time required. In addition, the outcome of suchprocesses can lack transparency and validity to outsiders.In this paper (the first of a series of two, [Walter, C. and Stützel, H., 2009-this issue. A newmethod for assessing the sustainability of land-use systems (II): Evaluating impactindicators. Ecological Economics]), we introduce an alternative method for concretisingsustainability within a given context. It is based on a systematic inventory of potentialissues through a structured literature review, and then uses a simple and transparentcriterion to decide which of these potential issues is actually relevant within the givencontext.This approach yields a set of concrete issues against which to test the impact ofagricultural production systems. It also makes transparent the normative and descriptiveelements of the process, which helps to control value-driven biases. We demonstrate thepractical applicability of this approach by testing it for an agricultural area in NorthwestGermany.
© 2008 Elsevier B.V. All rights reserved.
Keywords:Sustainable agricultureIndicatorsSustainability assessmentLife cycle assessmentSeverity ratios
1. Introduction
Agriculture ishumanity'spredominant interfacewithnature. It isour prevailing source of income and livelihood and shapes mostof Earth's surface directly or indirectly (FAO, 2001; Tilman et al.,2001). Whilst markedly influencing global energy and matter
ustainable Agriculture, Com (C. Walter).
er B.V. All rights reserved
cycles (Matson et al., 1997; Vitousek et al., 1997), the success ofagriculture is highlydependentonclimate, natural cycles and thefunctioning of ecosystems. Ensuring that agriculture is compa-tible with and sustained by Earth's life support systems is thus acore concern of sustainable development. (In this paper we usethe terms ‘sustainable development’ and ‘sustainability’ syno-
lworth Park, Sharnbrook, MK44 1LB, UK. Tel.: +44 1234 222 465.
.

1276 E C O L O G I C A L E C O N O M I C S 6 8 ( 2 0 0 9 ) 1 2 7 5 – 1 2 8 7
nymously and regard sustainable agriculture as the agriculturalaspect of sustainable development).
1.1. The normative gap
Unlike sustainable development, which has been canonicallydefined by the Brundtland Commission (WCED, 1987), there isno single most common definition of sustainable agriculture.Typically, definitions state that, to be sustainable, agriculturemust
▪ supply humanity with food and fibre of sufficient quantityand quality;
▪ not endanger Earth's life support systems (such as theclimate system and the functioning of ecosystems) ornatural resources (including biotic and abiotic resources,soils and biodiversity);
▪ allow producers to make a secure livelihood;▪ contribute to rural development and the enhancement ofrural communities;
▪ ensure the health of workers, rural populations andconsumers;
▪ be equitable, just and produce in a socially accepted way.
For a detailed review of definitions of sustainable agricul-ture see Christen (1996, 1999). As an illustrative example, wecite the following three definitions of sustainable agriculture:
The American Society of Agronomy (ASA, 1989): “Asustainable agriculture is one that, over the long term,enhances environmental quality and the resource base onwhich agriculture depends, provides for basic human foodand fibre needs, is economically viable, and enhances thequality of life for farmers and society as a whole.”
International Working Group for the development of aFramework for Evaluation of Sustainable Land Manage-ment (as cited by Smyth and Dumanski, 1995): “Sustainableland management combines technologies, policies andactivities aimed at integrating socio-economic principleswith environmental concerns so as to simultaneously:
▪ maintain or enhance production/services (Productivity);▪ reduce the level of production risk (Security);▪ protect the quality/potential of natural resources andprevent soil and water degradation (Protection);
▪ be economically viable (Viability);▪ be socially acceptable (Acceptability).”
Unilever (2002): “Sustainable agriculture is productive,competitive and efficient while at the same time protect-ing and improving the natural environment and condi-tions of the local communities.”
While such definitions are helpful for setting policy agendasand generating consensus between diverse societal groups(Jamieson, 1998), they remain empirically empty: They allowfor a broad range of different interpretations by using openwords like ‘sufficient’ or ‘healthy’; and, while encompassingmultiple goals, do not clarify how to deal with possible trade-
offs between these goals. Conversely, if we want to measuresustainability, we need concrete guidance on what to measure(e.g. what indicators to use) and what the priorities are.
There is thus a ‘normative gap’ between what policyprovides and what researchers need for developing measuresof sustainability.
1.2. Bridging the normative gap
This gap is conventionally bridged either by author appraisal(e.g. Taylor et al., 1993; Diepenbrock et al., 1999; Bockstallerand Girardin, 2000; Sands and Podmore, 2000; Reganold et al.,2001; Rigby et al., 2001); or by participatory stakeholderdecision (Norgaard, 1988; Lélé and Norgaard, 1996; Bosshard,1997; Röling andWagemakers, 1998; Bell andMorse, 1999; Iyer-Raniga and Treloar, 2000).
Author appraisal is obviously the least favourablesolution, because scientists are not objective when itcomes to value-laden decisions. They are influenced bytheir own conscious or unconscious agendas (such as beingaffected by the topic as a citizen, emotional attachment tothe object of inquiry, concerns for funding, the enticementof political influence, etc.); and by culture (Lélé andNorgaard, 1996). Although author appraisal is the quickestand easiest way of concretising sustainability, it lackstransparency and inter-subjective validity: It remainsunclear as to what the normative (‘subjective’) and thedescriptive (‘objective’) elements are.
Participatory approaches are in line with current thinkingon dealing with normative issues in science (Funtowicz andRavetz, 1993; O'Hara, 1996; Tacconi, 1998; Nowotny et al.,2001). They may, however, not always be appropriate, as theyhave practical and theoretical drawbacks: Participatory stake-holder groups are relatively costly to set up and decisionprocesses take time, whereas research budgets are limited andpolicy decisions on sustainability are often urgent (Costanza,1993, Fixdal, 1997).
Theoretical reservations against participatory approachesstem from their lack of transparency and replicability, pairedwith the fact that they are more suitable as mechanisms forattaining social and political consensus than for deciding onthemerits of an issue. In fact, by their definition, stakeholderspursue individual or institutional agendas (Fixdal, 1997).Concretising sustainability through stakeholder participationis therefore bound to reflect the agendas of the involvedstakeholders, but it is not bound to be factual: Again,normative and descriptive decisions cannot easily be toldapart.
This paper introduces a novel approach to bridging thenormative gap between broad policy statements on sustain-ability and researchers' requirements for measuring sustain-ability. It is highly transparent, because it is systematic and itseparates descriptive and normative elements explicitly.However, before describing the method, we need to clarifyexactly what to concretise.
1.3. Defining what to define
Bridging the normative gap can be facilitated by adoptinga different perspective on sustainability and looking at

1277E C O L O G I C A L E C O N O M I C S 6 8 ( 2 0 0 9 ) 1 2 7 5 – 1 2 8 7
unsustainability rather than at sustainability. In fact, thereare practical, historical and epistemological arguments forthis perspective.
The practical argument: Everyday experience shows usthat it is often easier to agree on what we do not want than toagree on what we want. (For instance, most people wouldagree that they do not want to starve, but a daily diet would bemuch harder to agree on). Likewise, political and societal goalsfor sustainability are often unavailable or highly controversial(cf. UBA, 2001), but there seems to be broad agreement onwhatthe issues are, i.e. what is to be avoided. Christen (2000) arguesthat the core issues in sustainable agriculture are neithernovel nor specific and, in many cases, solutions are alreadyavailable. Consequently, many authors claim that it is mucheasier to assess unsustainability than sustainability (e.g.Stockle et al., 1994; Syers et al., 1995; Jamieson, 1998; Smithand McDonald, 1998).
The historical argument: In part, this might beexplained by the fact that sustainability is, historically,an issue-driven concept: It was borne by the notion thatcontemporary patterns of development should not serveas a blueprint for the future, as they would destroy theEarth's life support systems (Becker, 1997; Sum and Hills,1998). Both the initial emphasis on dwindling fossil fuelreserves (Meadows et al., 1972), and the more recentemphasis on concerns about the limited capacity of theenvironment to absorb the exhausts of human activitiesand fresh water availability, have been driven by today'sissues. ‘Sustainable development’ is the vision of a worldfree from some of mankind's very real pressing problems,present or anticipated. It is not about the presence of animaginary desired state.
The epistemological argument: Our knowledge of the func-tioning of natural, social and economic systems, and of thecomplexity of their interactions, is far from being complete (infact, it is intrinsically incomplete; Gell-Mann, 1994; Oreskes et al.,1994). Ignorance and complexity, in combination with the longtime spans we are looking at in sustainability, lead to a situationwhere our capacity to predict the temporal evolution of thesesystems (andeven to testourmodelsof them;Oreskeset al., 1994;Lange, 1999) must appear rather myopic. It is thus virtuallyimpossible to substantiate scientifically any claims that a system(or its development path) is sustainable. As in the Popperianasymmetry between verification and falsification (Popper, 1963)it is, conversely, simple to prove that a system is unsustainable if,in a single instance, its unsustainability is already manifest.Bossel (1999), starting from a systems–theoretical background,follows a similar argument: Violations of critical functionalrequirements of systems can be taken as a clear indication ofunsustainability, while non-violationmay not be a guarantee fortheir sustainability.
Hence, there are a series of arguments for defining‘sustainability’ as the absence of certain issues, rather than afunction of reaching certain goals.
2. Method description
We here propose a method that concretises sustainability in aformal and structured way. It bridges the ‘normative gap’
between broad sustainability definitions and the concretestarting points that researchers need to quantitatively assesssustainability. This method takes an issue-driven perspective,based on identifying unsustainability, rather than sustain-ability. Furthermore it separates descriptive and normativeelements of the process. It comprises of two steps:
1. identifying all potential sustainability issues, by structuredliterature analysis. We shall call this the issue inventorystep; and
2. testingwhich ones of the potential sustainability issues areactually relevant within a given context, by using a simpleand transparent decision criterion. We shall call this thecontextualisation step.
2.1. The inventory step: what are the potential problems?
An inventory of potential sustainability issues can be madethrough a systematic evaluation of the literature, ideallysupported by a survey among local stakeholders. A range oftechniques exist for accessing and structuring publishedinformation and stakeholder input, including techniquesused in Environmental Impact Assessments (EIA) and Partici-patory Impact Assessments etc. The literature reviewedshould include scientific publications as well as publicationsby other actors engaged in the sustainability discourse, suchas intergovernmental organisations, governments and gov-ernment agencies, NGOs, unions, industry, farmers associa-tions and others.
In order to determine the amount of ‘samples’ (referencesto sustainability) that need to be analysed, standard ecologicalcensus methodology can be used: Sampling should continueuntil the curve of the total number of issues found, plottedagainst the number of samples, levels off. This assumes thatthe amount of issues discussed in the sustainability discourseis finite. An alternative assumption would be that the numberof issues discussed is infinite. In this case, we would expectthe plot to describe a logarithmic curve — the likelihood ofdiscovering a ‘new’ issue decreases steadily with the numberof issues already found. The decisionwhen to stop sampling inthis case would be cost–benefit driven: Stop when the numberof samples that need to be taken to discover a ‘new’ issueexceeds a certain value.
2.2. The contextualisation step: which issues areactually relevant?
Within a given context, not all of the potential sustainabilityissues will be relevant. In order to decide which ones arerelevant, a decision criterion is needed. Borrowing from LifeCycle Assessment (LCA), we propose that the ‘distance-to-target’ concept (Müller-Wenk, 1996; Brentrup et al., 2006) couldprovide such a criterion.
The distance-to-target is the ratio between an actual levelof an environmental impact and a critical level for that effect,which must not be exceeded. This concept could be used as asimple, transparent criterion to decide whether or not asustainability issue is relevant within a particular context: Adistance-to-target ratio greater than one indicates the issue isrelevant, because the actual impact exceeds the critical one.

1278 E C O L O G I C A L E C O N O M I C S 6 8 ( 2 0 0 9 ) 1 2 7 5 – 1 2 8 7
Conversely, there is not a problem if the actual impact level isbelow the critical one, i.e. if the ratio is less than one.
As it is the quotient of, not the difference between, theactual and the target level that we are concerned with, theterm ‘distance’ to target is misleading. Hence, we will use theterm ‘Severity Ratio’ instead. It is
SRi =aici
ð1Þ
with
ai actual impact level of sustainability issue ici critical impact level of sustainability issue i.
Issues in sustainable agriculture often emerge at differentspatial scales (Niu et al., 1993; Dumanski et al., 1998; Smith andMcDonald, 1998), so integrating them is a problem in manyapproaches to sustainability assessment. However, SeverityRatios allow for different spatial scales, both mathematicallyand conceptually, because they are quotients of twonumbers ofthe same unit and therefore dimensionless. Different SeverityRatios can thus be directly compared with one another.
The most ‘appropriate’ spatial scale is that at which thephenomenon or pattern under investigation is most pro-nounced (Wiens, 1987) and is normally given by the scientificdiscipline concerned with a particular issue. For example, thedynamics of N2O are global and affect the global climatesystem while eco-toxicological effects of pesticides arenormally confined to a local scale. Other than footprintingmethodologies – which convert a range of different impactsinto a single ‘currency’, such as area (Wackernagel et al., 2002)or entropy (Steinborn and Sviezhev, 2000) – this method dealswith different impacts by calculating comparable dimension-less indices.
Obviously it is important how the critical value is set. It caneither be policy-based (e.g. international conventions) orscience-based (e.g. critical load concepts). Policy-based criticalvalues are adequate if targets are, at least to some degree,negotiable. This is normally the case in the social andeconomic dimension of sustainability. Policy-based criticalvalues are, however, not adequate where bio-physical realitiesare involved that are not negotiable, as with most environ-mental sustainability issues.
Thus science-based critical values should be used wher-ever available. If unavailable, policy-based critical values maybe taken as a substitute, but this should bemarked explicitly inorder to ensure transparency.
3. Case study: what does agriculturalsustainability mean for Borken, Germany?
We applied the method described above to concretise‘sustainable agriculture’ for the County of Borken in northwestGermany, close to the Dutch border. It is an area of intensiveagricultural production with high livestock densities. Theclimate is temperate oceanic, with a mean temperature of9.7 °C and mild winters, the annual precipitation is 700 to800 mm. Soils are sands and loamy sands, mostly situated ondrained and ameliorated wetland, with 1.7% soil organic
carbon. The soil pH ranges from 5.5 to 6.5. Farms are typicallyfamily businesses, and encompass 40 to 80 ha of arable land,pasture and woodland. Maize is the dominant crop inrotations (40–50%). Farmers also grow vegetables (mainlyspinach) for a local frozen food factory, which allows themto diversify rotations and income sources. The rotationassumed here was the average of three typical four-yearrotations (see Supplementary material). For further details onmanagement and local conditions refer to Walter (2005).
3.1. Method and data
The two-step method described above was applied to createan inventory of sustainable agriculture issues. Although thiswas done for the German context, much of the literature usedwas not regionally specific and the inventory would probablylook very similar for other temperate farming systems indeveloped countries.
The inventory of potential sustainability issues was basedon a review of 44 references on sustainable agriculturepublished before 2003 (Tables 1a and 1b for physical andsocial issues, respectively). The review included 30 scientificpublications (papers published in reviewed journals, proceed-ings and books), seven publications from internationalstakeholders of sustainable agriculture and seven fromnational organisations (e.g. NGOs, unions and farmers asso-ciations, industry associations, government and intergovern-mental organisations, churches and others). This scientificliterature was a subset of a large pool of publications found bysearching for ‘sustainable agriculture’ in CAB AgriculturalAbstracts. The references in the reviewed sample wereselected on the basis of their originality, with considerationgiven to representing different schools of thought.
The 44 references were analysed by a modified QualitativeContents Analysis (Mayring, 1993): First, all items that theauthors of a reference appraised as a threat or a constraint tosustainability were recorded in the original wording. Second,similar and identical items were grouped together and para-phrased to match, where possible, existing and commonscientific concepts (e.g. ‘eutrophication’ to denote nitrogenand phosphate losses to water courses). These groups of itemsare referred to as ‘issues’ in the following andwere grouped intobroader thematic categories (e.g. ‘resource related issues’).
This procedure was carried out separately for issues in thephysical and the social dimensions of sustainability, where‘physical dimension’ and ‘social dimension’ areused in awidersense (Conrad, 1999), referring to the physical environment(geo–bio–chemical) and the social environment (economic,political, social), respectively. A range of local stakeholderswere finally asked to check the list of issues that wereidentified through literature analysis for completeness.
Based on roughly 240 single items named in the originalliterature, nearly 30 issues were identified in each of thephysical and social dimensions (Tables 1a and 1b).
Some problems were assumed to be ‘secondary issues’,caused by a range of ‘primary issues’ already listed. Thesewere:
■ Loss of biodiversity (named in 48% of the references) –assumed to be a consequence of (Sala et al., 2000): land

Table 1a – Inventory of potential issues in the physical dimension (encompassing ecological and bio–geo–chemical issues) ofsustainable agriculture in Germany
Code Issues Listed in reference nos. arabic: scientific literature lowercase roman:internat. stakeholders uppercase roman: national stakeholders
% of totalrefs. (n=44)
A Soil fertility related issues 1–12, 14, 19–21, 24–27, 29, i–vii, I–VII 80A. 1 Degradation of biophysical
properties1–3, 7–13, 15, 19, 24, 27, 28, iii–vii, I, III, IV, VI 55
A. 1. 1 Soil loss 1–3, 7, 10–13, 15, 19, 24, 27, 28, iii–vii, I, III, IV, VI 50A. 1. 2 Damage to soil structure 1, 3, 7–10, 12, 13, 15, 24, v–vii, I, VI, III 34A. 2 Degradation of biochemical soil
properties1–3, 7–13, 15, 24, 26, 27, i, iii–vii, I, IV–VII 57
A. 2. 1 Salinisation 1, 2, 8, 13, 24, v 14A. 2. 2 Acidification/alkalinisation 1, 3, 8, 10, 13, iii, iv, v, vii, VII 23A. 2. 3 Contamination 9, 13, 15, vi, vii, IV, V 16A. 2. 4 Depletion of soil organic matter 3, 7, 10, 12, 13, 15, 24, 27, I, VI 23A. 2. 5 Nutrient depletion 8, 10, 24, 27, iii, iv, v, 16A. 3 Soil hygienic degradation 11, 12, 26, 27, i 11A. 3. 1 Build-up of pathogen potential 11, 12, 26, 27, i 11
B Resource related issues 1, 2, 4, 7–10, 12–16, 19, 21, 23–25, 28, 29, i–vii, I, III, IV, VI, VII 70B. 1 Consumption of non-
renewable resources2, 4, 8–10, 12, 13, 15, 16, 19, 21, 23, 25, 28, 29, iv, vii, IV, VII 43
B. 1. 1 Fossil fuel 2, 8–10, 12, 13, 15, 19, 23, 25, 29, III, IV, VI 32B. 1. 2 Minerals (phosphate, potassium
and limestone)2, 9, 15, 19 9
B. 2 Occupancy of limitedrenewable resources
4, 7, 12–15, 19, 21, 24, 29, ii–v, vii, 32
B. 2. 1 Land 1, 4, 13 7B. 2. 2 Water 1, 7, 12–15, 19, 24, 29, ii–v, vii, 30
C Emission related issues 1–10, 12–16, 19, 20–23, 25–30, i–vii, I–VII 91C. 1 Emission of climate relevant
gases2, 3, 9, 10, 12, 14, 15, 19, 20, 22, 26, i, vii, II, IV–VI 39
C. 1. 1 Greenhouse gases 3, 10, 14, i, vii, II, IV–VI 20C. 1. 2 Stratospheric ozone depleters 20 2C. 1. 3 Summer smog/ground level
ozone9, 14 5
C. 2 Emissions that affect otherecosystems negatively
1–10, 12–16, 20–23, 25–30, ii–vii, I–VII 89
C. 2. 1 Acidifying substances 3–5, 7, 9, 10, 12, 14, 21, 22, 26, 27, ii–vii, IV, VI, VII 48C. 2. 2 Eutrophying substances 2–5, 7, 9, 10, 12–15, 21–23, 26, 27, ii–vii, I–VII 68C. 2. 3 Pesticides 2–4, 6, 7, 9, 10, 12, 13, 15, 21, 27, ii–vii, I–VII 59C. 3 Other emissions 7, 13, 26, ii, v, vi, I 16C. 3. 1 Odours & noise 13 2C. 3. 2 Waste 26, ii, I 7C. 3. 3 Sediments 7, 13, v, vi 9
D Complex ecological issues 1–4, 8, 10–15, 20, 24–26, 28–30, i–vii, I–VII 73D. 1 Human health risks 1, 4, 8, 12, 13, 28–30, iii, v–vii, I, V, VII 34D. 1. 1 Consumer health 4, 8, 12, 13, 30, iii, vi, vii, I, V, VII 25D. 1. 2 Producer health 4, 8, 12, 13, 29, 30, I, V, VII 20D. 1. 3 Local people/neighbours 12 2D. 2 Impacts on species communities
in ecosystems1–2, 3, 10, 12–15, 20, 24–26, 28, i–vii, I–VII 61
D. 2. 1 Habitat destruction 1–3, 10, 12, 13, 15, 20, 25, 26, 28, ii–v, vii, I–VII 50D. 2. 2 Formation of pesticide resistances 2, 11, 24, iii 9D. 2. 3 Undesired ecological effects
of GM cropsii, iii 5
Refer to text for details.1 Eswaran et al., 1994; 2 Ruttan, 1994; 3 v. Münchhausen & Nieberg, 1997; 4 Hansen, 1996; 5 Smyth & Dumanski, 1995; 6 Smith & McDonald, 1998;7 Sands & Podmore, 2000; 8 Reganold et al., 2001; 9 Halberg, 1999; 10 Eckert et al., 2000; 11 Lefroy et al., 2000; 12 van Mansvelt & van der Lubbe, 1999;13 Stockle et al., 1994; 14 Lewandowski et al., 1999; 15 Bockstaller et al., 1997; 16 Christen, 1996; 17 Roberts, 1995 (as cited by Christen, 1996); 18 Allenet al., 1991; 19Miller&Wali, 1995; 20 Zinck& Farshad, 1995; 21 Farshad& Zinck, 1993; 22 Addiscott, 1995; 23 Steinborn& Svirezhev, 2000, 24Wenz, 1999;25 Dunlap et al., 1992; 26 Cornforth, 1999; 27 Taylor et al., 1993; 28 Becker, 1998; 29 Abelson, 1995; 30 Weil, 1990.i Becker, 1997; ii IFAP/Via Campesina, 2000; iii NGOs at CSD8, 2000; iv International Agri-Food Network, 2000; v OECD, 2000; vi OECD, 1995; vii EU, 1999.I DBV, 2000; II Hagedorn, 1997; III UBA, 1997; IV Loske, 1996; V RNE, 2002; VI Enquete-Kommission, 1994; VII SRU, 1994.
1279E C O L O G I C A L E C O N O M I C S 6 8 ( 2 0 0 9 ) 1 2 7 5 – 1 2 8 7

Table 1b – Inventory of potential issues in the social dimension (also encompassing political and economic issues) ofsustainable agriculture in Germany
Code Issues Listed in reference nos. arabic: scientific literaturelowercase roman: internat. stakeholders uppercase
roman: national stakeholders
% of totalrefs. (n=44)
D Society related issues 1–16, 18–21, 24–30, i–vii, I–VII 93D. 1 Non-compliance with societal expectations 1, 3, 4, 6–10, 12–16, 18–21, 24–26, 28–30, i, ii, iv–vii, I–VII 82D. 1. 1 Use of socially not accepted production techniques
(e.g. agrochemicals, GM crops)1, 6–10, 12, 14, 25, 26, i, ii, iv, v, I–IV, VI, VII 45
D. 1. 2 Socially not accepted production intensity(e.g. ‘industrialised agriculture’)
12, 18, 19, ii, iv, vii 14
D. 1. 3 Alteration of traditional landscapes and landuse systems
3, 9, 10, 12, 13, 15, ii, vi, I, V–VII 27
D. 1. 4 Alteration of valued rural structures (socialand economic )
4, 16, 25, 29, 30, ii, I, V, VI, VII 23
D. 1. 5 Lacking transparency of food production 25, i, V 7D. 1. 6 Dependency on inequitable social structures
(exploitative working relations, land tenure)1, 4, 6, 16, 18, 19–21, 24, 28, i, ii 27
D. 1. 7 Disregard of animal welfare 12, 29, I, III, V 11D. 2 Conflicting resources uses (external effects) 1–16, 19, 21, 24–30, i–vii, I–VII 89D. 2. 1 Degrading soil use, overexploitation of marginal land 1–15, 19, 21, 24–27, 29, i–vii, I–VII 86D. 2. 2 Land/soil surface occupancy 1, 12, 13, 25, 28–30, ii, iv, v 23D. 2. 3 Deforestation/land clearing for agriculture 1, 2, 20 7D. 2. 4 Water consumption 1, 7, 12, 14, 15, 19, 20, 24, ii, iv, v 25D. 2. 5 Water pollution 1–3, 5–7, 9, 12, 14, 15, 20, 21, 28, 29, ii–vii, I–VII 64D. 2. 6 Adverse impacts on hydrology (e.g. water table,
salinisation, sedimentation)7, 13, 24, iv–vii 16
D. 2. 7 Air pollution 3, 7, 9, 10, 12, 13, 15, 20, i, v–vii, II, IV–VI 39D. 2. 8 Consumption of non-renewable or scarce resources 2, 4, 5, 9, 12, 15, 20, 21, 25, 29, i, iii, vii 30D. 2. 9 Negative impact on biodiversity 1, 3, 9, 10, 12, 13–16, 25, 29, 30, ii, iii, v–vii, I–III, V, VI 50D. 2. 10 Negative impact on quality of life in rural areas 4, 13, 25, ii 9
E Business related issues 1, 2, 4–6, 8–19, 21, 25, 26, 28–30, i–vii, I–VII 84E. 1 Insufficient proceeds 1, 2, 4–6, 8–19, 21, 25, 26, 28–30, i–vii, I–VII 84E. 1. 1 Low productivity 5, 6, 8, 10–14, 16, 17, 19, 21, 25, 26, 28–30, i, ii, iv, I, III, IV, VI 55E. 1. 2 Poor product quality 4, 5, 8, 12, 13, 16, 26, ii–iv, vi, V 27E. 1. 3 Lacking profitability, high cost and labour demand 1, 5, 6, 8, 11–13, 16–18, 21, 25, 30, V 32E. 1. 4 High production risk 1, 5, 11, 13, 25, iv 14E. 1. 5 Insufficient satisfaction of producers' spiritual goals 21, 30 5E. 2 Lacking farm autonomy 4, 26 5E. 2. 1 Dependency on dwindling resources 9, 12, 15, 16, 19, 26, ii, v, vi, III, IV, VI, VII 30E. 2. 2 Dependency on single/few income sources 11, 28, iv 7E. 2. 3 Dependency on subsidies or other external support 2, 12, 19, 28, ii, III, V–VII 20E. 2. 4 Dependency on purchased inputs 21, 25, III, IV, VI, VII 14
F Market related issues 8–10, 12, 13, 17, 24, 28, iii–v, I, III–VII 39F. 1 Inefficient resource use, poor allocation 8–10, 12, 13, 17, 24, 28, iii–v, I, III–VII 39F. 2 Overproduction/contribution to supply in
over-saturated commodity marketsiii 2
Refer to text for details, footnotes as in Table 1a.
1280 E C O L O G I C A L E C O N O M I C S 6 8 ( 2 0 0 9 ) 1 2 7 5 – 1 2 8 7
use (B.2.1), eutrophication (C.2.2), acidification (C.2.1) andpesticide use (C.2.3);
■ Decline of soil biological activity (named in 11% of thereferences) – considered to be caused by: soil nutrientstatus (A.2.5), pH (A.2.2), organic matter status (A.2.4),salinity (A.2.1), soil structure (A.1.2) and pesticide use(C.2.3) (Syers and Springett, 1984; Buckerfield et al., 1997;Bandick and Dick, 1999; Haynes and Tregurtha, 1999).
■ Decline of soil cation exchange capacity – assumed to be afunction of soil pH (A.2.2), organic matter content (A.2.4)and soil texture (Helling et al., 1964; Yuan et al., 1966).
Note that issues may appear in both the physical and thesocial dimension, but differ in perspective: E.g. ‘water con-sumption’ in the physical dimension is concerned withaltering the hydrology of natural ecosystems while in thesocial dimension it is concerned with competition for alter-native human uses.
The analysis was stopped after 44 references, becauseplotting the number of issues found against the number ofreferences analysed described a levelling curve for bothphysical and social issues (Fig. 1). Logarithmic functionscould be fitted to both curves (r2N0.96), suggesting that

Fig. 1 –Cumulated number of sustainability issues plottedagainst the number of samples (references) analysed (seetext for details). Solid symbols (●): physical dimension, opensymbols (○): social dimension. Logarithmic functions fit thecurvewell (r2=0.97 and r2=0.98, respectively). References 1 to30 equal refs. 1–30 in Table 1a, references 31 to 37 equal refs.I–vii and references 38 to 44 equal refs. I–VII.
1281E C O L O G I C A L E C O N O M I C S 6 8 ( 2 0 0 9 ) 1 2 7 5 – 1 2 8 7
continued sampling would lead to the discovery of furtherissues, but at a decreasing rate. As the first 11 referencescontained 80% of all issues identified and the last 12references analysed did not contain any new issues, samplingwas stopped. The results are context-specific, but are likely tolook very similar for other arable farming systems intemperate developed countries. The list of potential issuescollated in Tables 1a and 1b could thus be used as a startingpoint for other studies. The list could then be updated andamended (e.g. through stakeholder consultation and/or litera-ture research) to account for new issues and local specifics.
The contextualisation step was carried out for the physicaldimension only, because of the scope of this research project,but the methodology can be applied analogously to issues inthe social dimension. Results are shown in Table 2.
Explanation of Table 2: The table lists the issues derivedfrom the analysis of Table 1a. The following columns show atwhich scale individual issues were assumed to have an effecton the environment; which environmental goal they affectand at what level the environmental goal was assumed to bemet. The ‘Indicator’ column shows the indicators used tomeasure the issues and whether target levels for the under-lying issues are met. The ‘Severity ratio’ column shows thenumerical actual values and target values, their unit (the samefor actual and target) and the ratio of actual to target. Detailednotes on how the indicator values were calculated are givenin the Supplementary Material. The ‘Relevant’ column thensimply shows issues with a Severity Ratio≥1 as relevant(= ‘yes’ in the table) and those with a Severity Ratiob1 as notrelevant (= ‘no’). Question marks denote missing data whereno evaluation was made. Finally, the uncertainty of theSeverity Ratios was assessed using the NUSAP notationscheme for data quality (Costanza et al., 1992), with entriesunder ‘pedigree’ referring to (1) the theoretical quality, (2) theempirical quality and (3) the social quality, as described inTable 3.
We used standard indicators and approaches for quantify-ing the potential issues, as used within the scientificdisciplines normally dealing with these issues. It wasassumed that the appropriate spatial scale for assessment,
and the critical values (ci's in Eq. (1)), are also set by thepertinent disciplines. Data were, wherever possible, takenfrom the public domain or official statistics. Science-basedcritical values were prioritised. If unavailable, policy-basedvalues were used as a proxy. For some potential issues, it wasnot possible to compute Severity Ratios:
■ Concepts and methods were lacking for Odours and noise(C.3.1), Waste production (C.3.2), Emission of sediments(C.3.3) and Formation of pesticide resistances (D.2.2).
■ Data on actual and/or critical values were lacking forToxicity of pesticides to humans (D.1.2 and D.1.3) andHabitat destruction (D.2.1). Sedimentation (C.3.3) wasjudged to be irrelevant based on local expert appraisal(local water supplier, local water conservation board andecological research station). For another six cases a decisionabout relevance could not be made.
Science-based critical values for Marine eutrophication (C.2.2 b)and Emission of pesticides (C.2.3) were unavailable and substitutedwith policy-based ones (see Supplementarymaterial). Finally, Soilsalinisation (A.2.1) andSoil alkalinisation (A.2.2) were not consideredrisks in the area (humid temperate climate, acidic sandy soils).Likewise Risks due to genetically modified crops (D.2.3), as no GMvarieties are grown in the region.
Themethodological and epistemological uncertainty of theSeverity Ratios was described using the ‘Assessment Grade’ ofthe NUSAP notation scheme for data quality (Funtowicz andRavetz, 1990, as modified by Costanza et al., 1992). TheAssessment Grade is a semi-quantitative measure of anumber's quality, assessed by three criteria, as shown inTable 3: (1) theoretical quality (how well does the modelexplain the phenomenon under investigation?); (2) empiricalquality (how good are the data? howwere they gathered?); and(3) degree of acceptance (how well established is the under-lying theory in the scientific community?). Each of thesecriteria is scored on an ordinal scale from 0 to 4, as shown inTable 3. The Assessment Grade is the average of these scores,divided by four to yield a number between zero and one, where1 denotes the lowest and 0 the highest uncertainty.
3.2. Results
Fig. 2 shows the Severity Factors computed for sustainableagriculture in our case study area in the County of Borken. Thefive issues with the highest Severity Ratios (i.e. those thatexceed the critical values by the greatest margin) are: Heavymetal contamination of soils (A.2.3)NGround level ozone (C.1.3)NWater consumption (B.2.2)NEmission of greenhouse gases (C.1.1)NTerrestrial eutrophication (C.2.2 a). In total, thirteen of thepotential issueswere identified as being relevant. Six potentialissues were identified as irrelevant for the study area, namelyNutrient depletion (A.2.5), Build-up of soil pathogen potential (A.3.1),Contribution to ozone depletion (C.1.2), Emission of acidifyingsubstances (C.2.1), Pesticide use (C.2.3) and Consumer health risks(D.1.1). No decision could be made for seven potential issuesdue to lacking methods or data and two potential issues wereclassified as irrelevant on the basis of expert appraisal.
The physical dimension of sustainable agriculture in theCounty of Borken can thus be defined through the thirteen
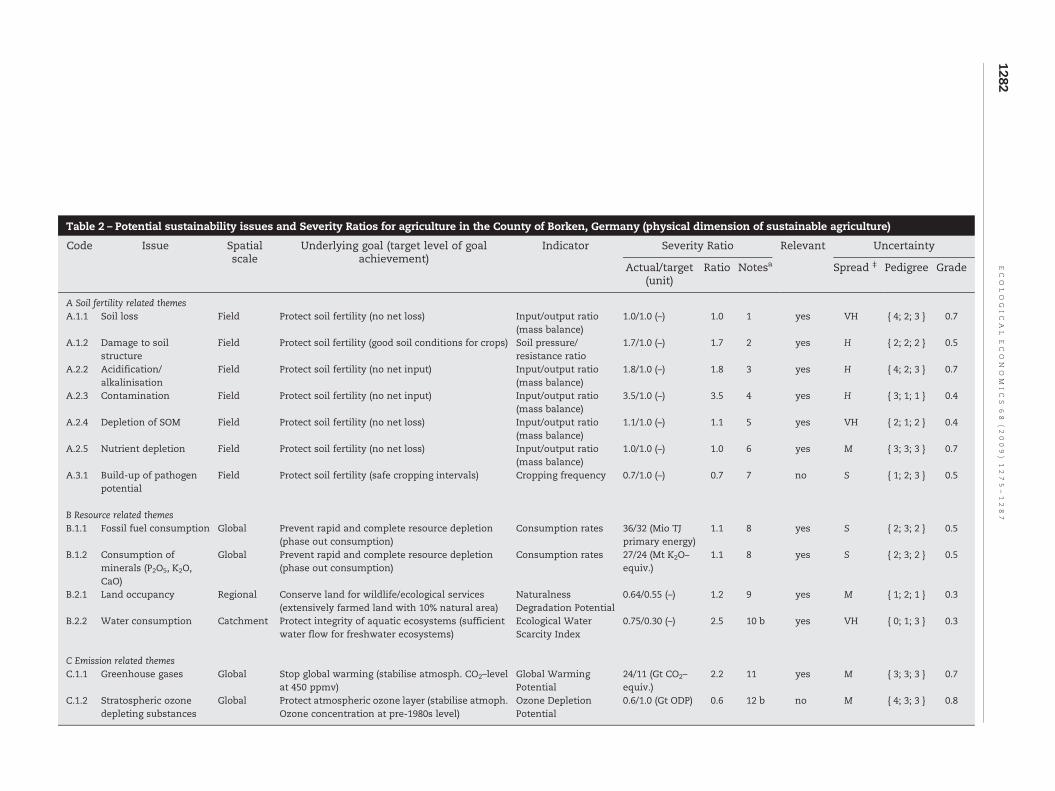
Table 2 – Potential sustainability issues and Severity Ratios for agriculture in the County of Borken, Germany (physical dimension of sustainable agriculture)
Code Issue Spatialscale
Underlying goal (target level of goalachievement)
Indicator Severity Ratio Relevant Uncertainty
Actual/target(unit)
Ratio Notesa Spread ‡ Pedigree Grade
A Soil fertility related themesA.1.1 Soil loss Field Protect soil fertility (no net loss) Input/output ratio
(mass balance)1.0/1.0 (–) 1.0 1 yes VH { 4; 2; 3 } 0.7
A.1.2 Damage to soilstructure
Field Protect soil fertility (good soil conditions for crops) Soil pressure/resistance ratio
1.7/1.0 (–) 1.7 2 yes H { 2; 2; 2 } 0.5
A.2.2 Acidification/alkalinisation
Field Protect soil fertility (no net input) Input/output ratio(mass balance)
1.8/1.0 (–) 1.8 3 yes H { 4; 2; 3 } 0.7
A.2.3 Contamination Field Protect soil fertility (no net input) Input/output ratio(mass balance)
3.5/1.0 (–) 3.5 4 yes H { 3; 1; 1 } 0.4
A.2.4 Depletion of SOM Field Protect soil fertility (no net loss) Input/output ratio(mass balance)
1.1/1.0 (–) 1.1 5 yes VH { 2; 1; 2 } 0.4
A.2.5 Nutrient depletion Field Protect soil fertility (no net loss) Input/output ratio(mass balance)
1.0/1.0 (–) 1.0 6 yes M { 3; 3; 3 } 0.7
A.3.1 Build-up of pathogenpotential
Field Protect soil fertility (safe cropping intervals) Cropping frequency 0.7/1.0 (–) 0.7 7 no S { 1; 2; 3 } 0.5
B Resource related themesB.1.1 Fossil fuel consumption Global Prevent rapid and complete resource depletion
(phase out consumption)Consumption rates 36/32 (Mio TJ
primary energy)1.1 8 yes S { 2; 3; 2 } 0.5
B.1.2 Consumption ofminerals (P2O5, K2O,CaO)
Global Prevent rapid and complete resource depletion(phase out consumption)
Consumption rates 27/24 (Mt K2O–equiv.)
1.1 8 yes S { 2; 3; 2 } 0.5
B.2.1 Land occupancy Regional Conserve land for wildlife/ecological services(extensively farmed land with 10% natural area)
NaturalnessDegradation Potential
0.64/0.55 (–) 1.2 9 yes M { 1; 2; 1 } 0.3
B.2.2 Water consumption Catchment Protect integrity of aquatic ecosystems (sufficientwater flow for freshwater ecosystems)
Ecological WaterScarcity Index
0.75/0.30 (–) 2.5 10 b yes VH { 0; 1; 3 } 0.3
C Emission related themesC.1.1 Greenhouse gases Global Stop global warming (stabilise atmosph. CO2–level
at 450 ppmv)Global WarmingPotential
24/11 (Gt CO2–equiv.)
2.2 11 yes M { 3; 3; 3 } 0.7
C.1.2 Stratospheric ozonedepleting substances
Global Protect atmospheric ozone layer (stabilise atmoph.Ozone concentration at pre-1980s level)
Ozone DepletionPotential
0.6/1.0 (Gt ODP) 0.6 12 b no M { 4; 3; 3 } 0.8
1282EC
OLO
GIC
AL
EC
ON
OM
IC
S68
(2009)
1275–1287

C.1.3 Summer smog/ground-level ozone precursors
Continental Protect human health; prevent damage tovegetation (stay below critical exposure levels)
Modelled ground-level ozoneconcentrations
16.8/5.8(Mt NM VOC)
2.9 13 yes M { 2; 3; 3 } 0.6
C.2.1 Acidifying substances Continental Conserve sensitive (semi-) natural ecosystems(stay below critical loads for N95% of ecosystems)
AcidificationPotential
36/44(Gt SO2– equiv.)
0.8 14 no M { 3; 3; 3 } 0.7
C.2.2a Eutrophying substances(terrestrial)
Continental Conserve sensitive (semi-) natural ecosystems(stay below critical loads for N95% of ecosystems)
TerrestrialEutrophicationPotential
45/22(Gt NOx– equiv.)
2.0 15 yes M { 3; 3; 2 } 0.6
C.2.2b Eutrophying substances(marine)
Catchment Conserve sensitive (semi-) natural ecosystems(stay below critical loads for N95% of ecosystems)
AquaticEutrophicationPotential
0.65/0.58(Gt PO4– equiv.)
1.1 16 yes VH { 2; 2; 2 } 0.5
C.2.3 Pesticides (eco-tox) Regional Conserve sensitive (semi-) natural ecosystems(potential ambient concentrations below NOELs⁎)
NormalisedTreatment Index
2.4/4.6 (–) 0.5 17 no VH { 1; 3; 2 } 0.5
C.3.1 Odours & noise Field/regional
Protect human health and well-being NA† ? –
C.3.2 Production of waste Region–global
Protect human health & ecological functions NA† ? –
C.3.3 Emission of sediments Regional Conserve water bodies for wildlife/hydrologicalfunctions
NA† b1 b no – { 0; 1; 3 } 0.3
D Complex ecological themesD.1.1 Consumer health National Protect human health (exposure below NOELs⁎) Pot. exposure (risk
assessment)96/100(%exceedances)
1.0 18 yes M { 1; 3; 1 } 0.4
D.1.2 Producer health Regional Protect human health (exposure below NOELs⁎) Potential exposure(risk assessment)
NA† ? –
D.1.3 Local people/neighbours
Regional Protect human health (exposure below NOELs⁎) Potential exposure(risk assessment)
NA† ? –
D.2.1 Habitat destruction Regional Conserve biodiversity and species communities Level offragmentation
NA† ? – { 1; 2; 1 } 0.3
D.2.2 Pesticide resistances Region–global
Food security/availability of control mechanisms NA† ? –
See text for explanation. If not indicated otherwise, all data are for 2000.aNumbers refer to detailed Notes in Supplementary material.bAppraised not to be relevant, based on expert opinion (see text for details).‡Uncertainty estimate for Severity Ratio: L=low (10%); M=medium (50%); H=high (100%); VH=very high (N100%).⁎ NOEL=No-Observed-Effect-Level ‡.† NA=not available.
1283EC
OLO
GIC
AL
EC
ON
OM
IC
S68
(2009)
1275–1287

Table 3 – Numerical estimate pedigree matrix for qualitative assessment of data uncertainty (adopted from Costanza et al.,1992)
Score Theoretical, quality of model Empirical, quality of data Social, degree of acceptance
4 Established theory Experimental data TotalMany validation tests Statistically valid samples All but cranksCausal mechanisms understood Controlled experiments
3 Theoretical model Historical/field data HighFew validation tests Some direct measurements All but rebelsCausal mechanisms hypothesized Uncontrolled experiments
2 Computational mode Calculated data MediumEngineering approximation Indirect measurements Competing schoolsCausal mechanisms approximated Handbook estimates
1 Statistical processing Educated guesses LowSimple correlations Very indirect approximations Embryonic fieldNo causal mechanisms “Rule of thumb” estimates
0 Definitions/assertions Pure guesses None
1284 E C O L O G I C A L E C O N O M I C S 6 8 ( 2 0 0 9 ) 1 2 7 5 – 1 2 8 7
relevant issues, which make up the local constraint envelope(O'Neill et al., 1989) of sustainable agriculture.
The next step of sustainability assessment would then beto investigate whether or not the sustainability of anagricultural production system is constrained by these thir-teen issues, i.e. if and to what degree a system contributes tothe impacts causing these issues. This step will be addressedin another paper.
4. Summary and discussion
Most definitions of sustainability are unsuitable as a basis forscientific inquiry because they lack concreteness. We there-fore proposed a structured and systematic approach toconstructing context-specific sustainability conceptions.
Our approach breaks the task of ‘defining’ sustainabilitydown to two questions that can be addressed in a systematicway: (1) What are the potential issues? and (2) which potential
Fig. 2 –Severity Ratios for potential issues in sustainableagriculture calculated for the County of Borken, NorthwestGermany (physical dimension; some potential issues notassessed due to lack of methodology or data; see text). ASeverity Ratio greater than one (black section of bars) indicatethat an issue is relevant within the study area, ratios lessthan one (white bars) indicates it is not relevant.
issues are actually relevant within the specific context? Inanswering these questions we can obtain the constraintenvelope of sustainable agriculture for a particular location,i.e. the set of factors that potentially threaten the sustain-ability of any system in that location. Quantifying the actualimpacts of a particular system and comparing them againstthe constraint envelope is the next step of sustainabilityassessment, which will be addressed in another paper, part IIof this series (Walter and Stützel, 2009-this issue).
We outlined here a systematic and transparent approach toanswering the two questions above. This approach concep-tually separates normative and descriptive elements. How-ever, normativity inevitably enters the process through anumber of choices.
For example. in the Inventory of potential issues, the first ofthe two steps, choices affect the way references are sampledand issues are paraphrased. Likewise, the choice of spatialscales, methods, data and data processing introduces under-lying value judgements and assumptions. Note that thesechoices are inevitable. They can, however, be made explicit inorder to control biases.
In this paper we applied a number ofmechanisms to controlbiases, e.g. determine the necessary ‘sample size’ of references;use existing concepts and methods from the disciplinesnormally concernedwith a particular issue, rather than ‘invent’our own approach; use publicly available data. A further usefulmeans of controlling biases due to methodological choices (orconceptual ‘pedigree’) is the NUSAP notation scheme (Costanzaet al., 1992), as used in the above case study example.
One important implicit assumption is that the literatureprovides an accurate and comprehensive picture of the sustain-abilitydiscourse.Althoughmuchof thisdiscoursedoes takeplaceinwriting, or isdocumented inawritten form(e.g.meetingsof theWCED and UN-CSD), one may argue that not all opinions haveequitable access to publication. Groups such as farmers, localinitiatives, or small special interest groups, may have less accessto publishing their opinion. It is therefore important to checkresults from the literature with local stakeholders.
For the second step of the process, the Contextualisation, theway in which critical values are determined is obviouslyimportant. We argued above for using science-based criticalvalues, although theyare, of course,neither free fromvaluesnor
1285E C O L O G I C A L E C O N O M I C S 6 8 ( 2 0 0 9 ) 1 2 7 5 – 1 2 8 7
‘objective’. However, they root in a broader disciplinarydiscourse and are subject to standard mechanisms of scientificquality control (such as peer reviewing). They have thereforebeen aligned with the paradigm of the pertinent discipline(s).This makes inevitable choices and value judgements moretransparent and defendable. At the same time it prevents thoseinvolved in sustainability projects from constructing their ‘own’epistemology that is not shared outside their group.
Apart from transparency, our method is also more flexiblethan methods using pre-defined indicator sets (e.g. Tayloret al., 1993; Diepenbrock et al., 1999; Halberg, 1999; Bockstallerand Girardin, 2000; Eckert et al., 2000; Sands and Podmore,2000; Lefroy et al., 2000; Reganold et al., 2001; Rigby et al., 2001;Julius et al., 2003). Such methods are limited to productionsystems similar to the one they were originally designed for.Also, they cannot easily cope with new upcoming issues.Conversely, the method developed here can easily integrateadditional indicators, delete obsolete ones or replace themwith better ones.
As the case study showed, Severity Ratios can be computedfrom publicly available data for most sustainability issues.More work is needed, though, where Severity Ratios cannot becomputed due to the lack of ready-to-use methods or datasets(in this example odours and noise, waste, siltation of surfacewaters due to erosion and formation of pesticide resistances).Building in safety buffers to reflect uncertainty and variabilityin natural systems could further refine this approach.
Another major advantage is their potential to integrateissues at different spatial scales, because the division opera-tion eliminates units' different spatial extents. DifferentSeverity Ratios can thus be directly compared with oneanother. This makes it very attractive for sustainable agricul-ture assessments, because sustainability issues emerge at anumber of different scales (Niu et al., 1993; Dumanski et al.,1998; Smith and McDonald, 1998). However, it is importantthat a genuine weighting step can be introduced to reflect thefact that a society may value certain goods more highly thanothers (paper II goes into further detail).
One could argue that Severity Ratios are too one-dimen-sional as a criterion for deciding whether an issue matters forsustainability or not. Indeed, Severity Ratios do not account fora range of other factors that are relevant for policy decisions inthe field of sustainability, such as the number of peopleaffected by an issue or its reversibility. More complex criteriacould arguably account for such factors. However, this wouldcome at the price of being less transparent and more value-laden than the simple Severity Ratios proposed here.
Acknowledgements
This work was funded through the Unilever SustainableAgriculture Programme, with in-kind support from theHorticultural Extension Service of the Chamber of AgricultureNorthrhine-Westphalia.
The authors would like to thank Olaf Christen, Paul Hoynin-gen-Huene, Robert Costanza and Hartmut Bossel for inspiringdiscussions and useful comments on an earlier version of thispaper. We would also like to thank Vanessa J. King and RachaelA. Durrant for proof reading and checking the English.
Appendix A. Supplementary data
Supplementary data associated with this article can be found,in the online version, at doi:10.1016/j.ecolecon.2008.11.016.
R E F E R E N C E S
Abelson, P.H., 1995. Sustainable agriculture and the 1995 farm bill.Nature 267, 943.
Addiscott, T.M., 1995. Entropy and sustainability. EuropeanJournal of Soil Science 46, 161–168.
Allen, P., Van Dusen, D., Lundy, J., Gliessman, S., 1991. Expandingthe definition of sustainable agriculture. Journal of AlternativeAgriculture 6, 34–39.
ASA, 1989. Decision reached on sustainable agriculture. AmericanSociety of Agronomy (ASA). AgronomyNews, January 1989, p. 15.
Bandick, A.K., Dick, R.P., 1999. Field management effects on soilenzyme activities. Soil Biology and Biochemistry 31, 1471–1479.
Becker, B., 1997. Sustainability assessment: a review of values,concepts, and methodological approaches. Consultative Groupon International Agricultural Research (CGIAR). Issues inAgriculture, vol. 10. The World Bank, Washington, DC.
Becker, J., 1998. Sustainable development for local land uses.International Journal of Sustainable Development and WorldEcology 5, 59–69.
Bell, S., Morse, S., 1999. Sustainability Indicators: Measuring theImmeasurable. Earthscan, London.
Bockstaller, C., Girardin, P., 2000. Agro-ecologicalindicators — instruments to assess sustainability inagriculture. In: Härdtlein, M., Kaltschmitt, M., Lewandowski, I.,Wurl, H. (Eds.), Nachhaltigkeit in der Landwirtschaft. ErichSchmidt, Berlin, pp. 69–83.
Bockstaller, C., Girardin, P., van der Werf, H.M.G., 1997. Use ofagro-ecological indicators for the evaluation of farmingsystems. European Journal of Agronomy 7, 261–270.
Bossel, H., 1999. Indicators for Sustainable Development: Theory,Method, Applications. IISD, Winnipeg.
Bosshard, A., 1997. What does objectivity mean for analysis,valuation, and implementation in agricultural landscapeplanning? A practical and epistemological approach to theresearch for sustainability in ‘agri-culture’. Agriculture,Ecosystems and Environment 63, 133–143.
Brentrup, F., Küsters, J., Lammel, J., Kuhlmann, H., 2004.Environmental impact assessment of agricultural productionsystems using the life cycle assessment methodology: Part I:Theoretical concept of a LCAmethod tailored to cropproduction.European Journal of Agronomy 20, 247–264.
Buckerfield, J.C., Lee, K.E., Davoren, C.W., Hannay, J.N., 1997.Earthworms as indicators of sustainable production in drylandcropping in southern Australia. Soil Biology and Biochemistry29, 547–554.
Christen, O., 1996. Nachhaltige Landwirtschaft (‘Sustainableagriculture’) (in German, with English summary). Berichte überLandwirtschaft 74, 66–86.
Christen, O., 1999. Sustainable agriculture — from the history ofideas to practical application. Institut für Landwirtschaft undUmwelt (ilu), Bonn.
Christen, O., 2000. Nachhaltige Landwirtschaft — Neue Leitbildoder altbekanntePrinzipien? (inGerman).VDLUFA–Schriftenreihe55 (Kongreßband 2000). Darmstadt, pp. 14–23.
Conrad, J., 1999. Nachhaltige Entwicklung: einige begrifflichePräzisierungen oder der heroische Versuch, einen Pudding andie Wand zu nageln (in German, with English summary). FFUReport 00–07, Forschungsstelle für Umweltpolitik, FreieUniversität Berlin.
1286 E C O L O G I C A L E C O N O M I C S 6 8 ( 2 0 0 9 ) 1 2 7 5 – 1 2 8 7
Costanza, R., 1993. Developing ecological research that is relevantfor achieving sustainability. Ecological Applications 3, 579–581.
Costanza, R., Funtowicz, S.O., Ravetz, J.R., 1992. Assessing andcommunicating data quality in policy-relevant research.Environmental Management 16, 121–131.
Cornforth, I.S., 1999. Selecting indicators for assessing sustainableland management. Journal of Environmental Management 56,173–179.
DBV, 2000.Grünbuch für eineNachhaltigeLand-undForstwirtschaft(inGerman). Deutscher Bauernverband (DBV). agrar-press, Bonn.
Diepenbrock, W., Rost, D., Hülsbergen, K.-J., Abraham, J., Deimer,C., Dubsky, G., Heine, M., Heinrich, J., Meyer, D., Pasler, U.,Werner, S., 1999. Reports on the research projects “Entwicklungeiner Methode zur ökologisch-ökonomischen Analyse undBewertung landwirtschaftlicher Bewirtschaftungssysteme”and “Überführung und Weiterentwicklung der im ModellREPRO enthaltenen wissenschaftlichen Methoden undKoeffizienten zur landwirtschaftlichen Stoff- undEnergiebilanzierung in eine praxisanwendbare Software” (inGerman). Martin-Luther University Halle-Wittenberg, Institutfür Acker- und Pflanzenbau/Institut für Agrarökonomie undAgrarraumgestaltung, Halle.
Dumanski, J., Pettapiece, W.W., McGregor, R.J., 1998. Relevance ofscale dependent approaches for intergarting biophysical andsocio-economic information of agroecological indicators.Nutrient Cycling in Agroecosystems 50, 13–22.
Dunlap, R.E., Beus, C.E., Howell, R.E., Waud, J., 1992. What issustainable agriculture? An empirical examination of facultyand farmerdefinitions. Journal of SustainableAgriculture 3, 5–39.
Eckert, H., Breitschuh, G., Sauerbeck, D.R., 2000. Criteria andstandards for sustainable agriculture. Journal of Plant Nutritionand Soil Science 163, 337–351.
Enquete-Kommission, 1994. Schutz der GrünenErde — Klimaschutz durch umweltgerechte Landwirtschaftund Erhalt der Wälder (in German). Enquete KommissionSchutz der Erdatmosphäre des Bundestages, EcomomicaVerlag, Bonn.
Eswaran, H., Pushparajah, E., Ofori, C., 1994. Indicators and theirutilization in a framework for evaluation of sustainable landmanagement. In: Wood, R.C., Dumanski, J. (Eds.), Proceedingsof the International Workshop on Sustainable LandManagement in the 21st Century, Vol. 2: Plenary Papers. TheOrganizing Committee. International Workshop onSustainable Land Management. Agricultural Institute ofCanada, Ottatwa, ON, pp. 205–225.
EU, 1999. Directions Towards Sustainable Agriculture.Commission of the European Communities, Brussels. COM(1999) 22 final.
FAO,2001. FAOSTAT:FAOStatisticalDatabases. FoodandAgricultureOrganisation of the United Nations (FAO), Rome. (available athttp://www.fao.org/waicent/portal/statistics_en.asp).
Farshad, A., Zinck, J.A., 1993. Seeking agricultural sustainability.Agriculture, Ecosystems and Environment 47, 1–12.
Fixdal, J., 1997. Consensus conferences as ‘extended peer groups’.Science and Public Policy 24, 366–376.
Funtowicz, S.O., Ravetz, J.R., 1990. Uncertainty and Quality inScience for Policy. Kluwer Academic Press, Dordrecht.
Funtowicz, S.O., Ravetz, J.R., 1993. Science for the post-normal age.Futures 25, 739–755.
Gell-Mann, M., 1994. The Quark and the Jaguar — Adventures inthe Simple and the Complex. Freeman, New York.
Hagedorn, K., 1997. Agriculture in Germany: some considerationson economic, political and environmental sustainability.Ambio 26, 456–461.
Halberg, N., 1999. Indicators of resource use and environmentalimpact for use in a decision aid for Danish livestock farmers.Agriculture, Ecosystems and Environment 76, 17–30.
Hansen, J.W., 1996. Is agricultural sustainability a useful concept?Agricultural Systems 5, 117–143.
Haynes, R.J., Tregurtha, R., 1999. Effects of increasing periodsunder intensive arable vegetable production on biological,chemical and physical indices of soil quality. Biology andFertility of Soils 28, 259–266.
Helling, C.S., Chesters, G., Corey, R.B., 1964. Contribution of organicmatter and clay to soil cation-exchange capacity as affected bythe pH of the saturating solution. Soil Science Society ofAmerica Proceedings 28, 517–520.
IFAP/Via Campesina, 2000. CSD eighth session, 24 April–5 May2000: Secretary-General's note for the multi-stakeholderdialogue on sustainable agriculture. Addendum 2: Discussionpaper prepared by the International Federation of AgriculturalProducers (IFAP) and Via Campesina. UN Commission onSustainable Development (CSD), New York.
InternationalAgri-FoodNetwork, 2000.CSDeighthsession, 24April–5May 2000: Secretary-General's note for the multi-stakeholderdialogue on sustainable agriculture. Addendum 1: Discussionpaper contributed by the International Agri-Food Network. UNCommission on Sustainable Development (CSD), New York.
Iyer-Raniga, U., Treloar, G., 2000. A context for participation insustainable development. Environmental Management 26,349–361.
Jamieson, D., 1998. Sustainability and beyond. EcologicalEconomics 24, 183–192.
Julius, C., Møller, C., Osterburg, B., Sieber, S., 2003. Indikatoreneiner nachhaltigen Landwirtschaft im RegionalisiertenAgrar- undUmweltinformationssystem für die BundesrepublikDeutschland (RAUMIS) (in German, with English abstract).Agrarwirtschaft 52, 185–194.
Lange, H., 1999. Are ecosystems dynamical systems? InternationalJournal of Computing Anticipatory Systems 3, 169–186.
Lefroy, R.D.B., Bechstedt, H.-D., Rais, M., 2000. Indicators forsustainable land management based on farmer surveys inVietnam, Indonesia, and Thailand. Agriculture, Ecosystemsand Environment 81, 137–146.
Lélé, S., Norgaard, R.B., 1996. Sustainability and the scientist'sburden. Conservation Biology 10, 354–365.
Lewandowski, I., Härdtlein, M., Kaltschmitt, M., 1999. Sustainablecrop production: definition and methodological approach forassessing and implementing sustainability. Crop Science 39,184–193.
Loske,R. (Ed.), 1996.ZukunftsfähigesDeutschland: einBeitragzueinerglobal nachhaltigen Entwicklung (in German). Birkhäuser, Basel.
Matson, P.A., Parton, W.J., Power, A.G., Swift, M.J., 1997.Agricultural intensification and ecosystem properties. Science277, 504–509.
Mayring, P., 1993. Qualitative Inhaltsanalyse (in German).Deutscher Studienverlag, Weinheim.
Meadows, D.L., Meadows, D.H., Randers, J., Behrens, W.W.I., 1972.The Limits to Growths. Universe Books, New York.
Miller, F.P., Wali, M.K., 1995. Soils, land use and sustainableagriculture: a review.Canadian Journal of Soil Science 75, 413–422.
Müller-Wenk, R., 1996. Political and scientific targets indistance-to-target valuation methods. In: Braunschweig, A.,Förster, R., Hofstetter, P., Müller-Wenk, R. (Eds.), Developmentsin LCA Valuation. IWÖ-Diskussionsbeitrag 32. Institut fürWirtschaft und Ökologie, St. Gallen.
Münchhausen, H.v., Nieberg, H., 1997. Agrar-Umweltindikatoren:Grundlage, Verwendungs-möglichkeiten und Ergebnisse einerExpertenbefragung (in German). In: Diepenbrock, W. (Ed.),Umweltverträgliche Pflanzenproduktion: Indikatoren,Bilanzierungsansätze und ihre Ein-bindung in Ökobilanzen.Deutsche Bundesstiftung Umwelt, Osnabrück, pp. 13–29.
NGOs at CSD8, 2000. CSD eighth session, 24 April–5 May 2000:Secretary-General's note for the multi-stakeholderdialogue on sustainable agriculture. Addendum 4: Discussionpaper contributed by the Non-Governmental Organizations.UN Commission on Sustainable Development (CSD),New York.

1287E C O L O G I C A L E C O N O M I C S 6 8 ( 2 0 0 9 ) 1 2 7 5 – 1 2 8 7
Niu, W.-Y., Lu, J.J., Khan, A.A., 1993. Spatial systems approach tosustainable development: a conceptual framework.Environmental Management 17, 179–186.
Norgaard, R.B., 1988. Sustainable development: a co-evolutionaryview. Futures 20, 606–620.
Nowotny, H., Scott, P., Gibbons, M., 2001. Re-thinking Science:Knowledge and the Public in the Age of Uncertainty. PolityPress, Cambridge.
OECD, 1995. Sustainable agriculture. Concepts, issues and policiesin OECD countries. Organisation for Economic Co-operationand Development (OECD), Paris.
OECD, 2000. Environmental indicators for agriculture. Methodsand results. Organisation for Economic Co-operation andDevelopment (OECD), Paris.
O'Hara, S.U., 1996. Discursive ethics in ecosystems valuation andenvironmental policy. Ecological Economics 16, 95–107.
O'Neill, R.V., Johnson, A.R., King, A.W., 1989. A hierarchicalframework for the analysis of scale. Landscape Ecology 3,193–205.
Oreskes, N., Schrader-Frechette, K., Belitz, K., 1994. Verification,validation, and confirmation of numerical models in earthscience. Science 263, 641–646.
Popper, K., 1963. Conjectures and Refutations: The Growth ofScientific Knowledge. Routledge, London.
Reganold, J.P., Glover, J.D., Andrews, P.K., Hinman, H.R., 2001.Sustainability of three apple production systems. Nature 410,926–929.
Rigby, D., Woodhouse, P., Young, T., Burton, M., 2001. Constructinga farm level indicator of sustainable agricultural practice.Ecological Economics 39, 463–478.
RNE, 2002. Goals for sustainable development in Germany—mainpoints of emphasis. Dialogue Paper of the German Council forSustainable Development (RNE).(http://www.nachhaltigkeitsrat.de/n_strategy/dialogue_paper/index.html).
Roberts, B., 1995. The Quest for Sustainable Agriculture and LandUse. UNSW Press, Sydney.
Röling, N.G., Wagemakers, M.A.E. (Eds.), 1998. FacilitatingSustainable Agriculture: Participatory, Learning and AdaptiveManagement in Times of Environmental Uncertainty.Cambridge University Press, Cambridge.
Ruttan, V., 1994. Constrains on the design of sustainable systemsof agricultural production. Ecological Economics 10, 209–219.
Sala, O.E., Chapin, F.S.I., Armestos, J.J., Berlow, E., Bloomfield, J.,Dirzo, R., Huber-Sanwald, E., Huenneke, L.F., Jackson, R.B.,Kinzig, A., Leemans, R., Lodge, D.M., Mooney, H.A., Oesterheld,M., Poff, N.L., Sykes, M.T., Walker, B.H., Walker, M., Wall, D.H.,2000. Global biodiversity scenarios for the year 2100. Science 287,1770–1774.
Sands, G.R., Podmore, T.H., 2000. A generalized environmentalsustainability index for agricultural systems. Agriculture,Ecosystems and Environment 79, 29–41.
Smith, C.S., McDonald, G.T., 1998. Assessing the sustainability ofagriculture at the planning stage. Journal of EnvironmentalManagement 52, 12–37.
Smyth, A.J., Dumanski, J., 1995. A framework for evaluatingsustainable land management. Canadian Journal of SoilScience 75, 401–406.
SRU, 1994. Umweltgutachten 1994 des Rates vonSachverständigen für Umweltfragen: Für einedauerhaft-umweltgerechte Entwicklung (in German, Englishexcerpts published as SRU: Envrionmental report 1994: Inpursuit of sustainable environmentally sound developmentMetzler-Poeschel, Stuttgart. available viahttp://www.umweltrat.de).
Steinborn, W., Svirezhev, Y., 2000. Entropy as an indicator ofsustainability in agro-ecosystems: North Germany case study.Ecological Modelling 133, 247–257.
Stockle, C.O., Papendick, R.I., Saxton, K.E., Campbell, G.S., vanEvert, F.K., 1994. A framework for evaluating the sustainabilityof agricultural production systems. American Journal ofAlternative Agriculture 9, 45–50.
Sum, M.C., Hills, P., 1998. Interpreting sustainable development.Journal of Environmental Science 10, 129–143.
Syers, J.K., Springett, J.A., 1984. Earthworms and soil fertility. Plantand Soil 76, 93–104.
Syers, J.K., Hamblin, A., Pushparajah, E., 1995. Indicators andthresholds for the evaluation of sustainable landmanagement.Canadian Journal of Soil Science 75, 423–428.
Tacconi, L., 1998. Scientific methodology for ecological economics.Ecological Economics 27, 91–105.
Taylor, D.C., Mohamed, Z.A., Shamsudin, M.N., Mohayidin, M.G.,Chiew, E.F.C., 1993. Creating a farmer sustainability index: aMalaysian case study. American Journal of AlternativeAgriculture 8, 175–184.
Tilman, D., Reich, B.P., Knops, J., Wedin, D., Mielke, T., Lehman, C.,2001. Diversity and productivity in a long-term grasslandexperiment. Science 294, 843–845.
UBA (Ed.), 1997. Nachhaltiges Deutschland — Wege zu einerdauerhaft-umweltgerechten Entwicklung (in German).Umweltbundesamt (UBA). Erich Schmidt Verlag, Berlin.
UBA, 2001. Ziele für die Umweltqualität — EineBestandsaufnahme (in German). Erich Schmidt Verlag, Berlin.
Unilever, 2002. Growing for the Future II — Unilever andSustainable Agriculture. Unilever, Rotterdam. (also available atwww.growingforthefuture.com).
van Mansvelt, J.D., van der Lubbe, M.J., 1999. Checklist forSustainable Landscape Management. Elsevier, Amsterdam.
Vitousek, P.M., Mooney, H.A., Lubchenco, J., Melillo, J.M., 1997.Human domination of earth's ecosystems. Science 277, 494–499.
Wackernagel, M., Schulz, N.B., Deumling, D., Callejas Linares, A.,Jenkins, M., Kapos, V., Monfreda, C., Loh, J., Myers, N., Norgaard,R., Randers, J., 2002. Tracking the ecological overshoot of thehuman economy. Proceedings of the Academy of Science 99(14), 9266–9271.
Walter, C. 2005. Sustainability assessment of land use systems.PhD Dissertation. Institute of Vegetable and Fruit Science,Natural Sciences, University of Hanover, Germany. Availableonline at: http://www.gartenbau.uni-hannover.de/gem/Literatur/index_veroeff.htm.
Walter, C., Stützel, H., 2009e. A new method for assessing thesustainability of land-use systems (II): Evaluating impactindicators. Ecological Economics 68, 1288–1300 (this issue).
WCED, 1987. Our common future. The World Commission onEnvironment and Development (WCED). Oxford UniversityPress, Oxford.
Weil, R.R., 1990. Defining and using the concept of sustainableagriculture. Journal of Agronomic Education 19, 126–130.
Wenz, P.S., 1999. Pragmatism in practice: the efficiency ofsustainable agriculture. Environmental Ethics 21, 391–410.
Wiens, J.A., 1987. Spatial scaling in ecology. Functional Ecology 3,385–397.
Yuan, T.L., Gammon, N.J., Leighty, R.G., 1966. Relative contributionof organic and clay fractions to cation-exchange capacity ofsandy soils from several soil groups. Soil Science 104, 123–128.
Zinck, J.A., Farshad, A., 1995. Issues of sustainability and landmanagement. Canadian Journal of Soil Science 75, 407–412.