identifying environmental determinants relevant to health
TRANSCRIPT
International Journal of
Environmental Research
and Public Health
Review
Identifying Environmental Determinants Relevant to Healthand Wellbeing in Remote Australian Indigenous Communities:A Scoping Review of Grey Literature
Amal Chakraborty 1,2,* , Mark Daniel 1,3,4 , Natasha J. Howard 1,5,6 , Alwin Chong 7, Nicola Slavin 8,Alex Brown 1,5,6 and Margaret Cargo 1,3
�����������������
Citation: Chakraborty, A.; Daniel,
M.; Howard, N.J.; Chong, A.; Slavin,
N.; Brown, A.; Cargo, M. Identifying
Environmental Determinants
Relevant to Health and Wellbeing in
Remote Australian Indigenous
Communities: A Scoping Review of
Grey Literature. Int. J. Environ. Res.
Public Health 2021, 18, 4167. https://
doi.org/10.3390/ijerph18084167
Academic Editor: Paul Tchounwou
Received: 17 March 2021
Accepted: 13 April 2021
Published: 15 April 2021
Publisher’s Note: MDPI stays neutral
with regard to jurisdictional claims in
published maps and institutional affil-
iations.
Copyright: © 2021 by the authors.
Licensee MDPI, Basel, Switzerland.
This article is an open access article
distributed under the terms and
conditions of the Creative Commons
Attribution (CC BY) license (https://
creativecommons.org/licenses/by/
4.0/).
1 School of Health Sciences, University of South Australia, Adelaide, SA 5001, Australia;[email protected] (M.D.); [email protected] (N.J.H.); [email protected] (A.B.);[email protected] (M.C.)
2 Research Centre for Palliative Care, Death and Dying, College of Nursing and Health Sciences,Flinders University, Bedford Park, SA 5042, Australia
3 Health Research Institute, Faculty of Health, University of Canberra, Bruce, ACT 2601, Australia4 South Australian Health and Medical Research Institute, Adelaide, SA 5000, Australia5 Wardliparingga Aboriginal Health Equity, South Australian Health and Medical Research Institute,
Adelaide, SA 5000, Australia6 Adelaide Medical School, Faculty of Health and Medical Sciences, University of Adelaide,
Adelaide, SA 5000, Australia7 Australian Centre for Child Protection, University of South Australia, Adelaide, SA 5001, Australia;
[email protected] Environmental Health Branch, Department of Health, Northern Territory Government,
Casuarina, NT 0810, Australia; [email protected]* Correspondence: [email protected]; Tel.: +61-(0)-422-473-881
Abstract: The high prevalence of preventable infectious and chronic diseases in Australian Indige-nous populations is a major public health concern. Existing research has rarely examined the role ofbuilt and socio-political environmental factors relating to remote Indigenous health and wellbeing.This research identified built and socio-political environmental indicators from publicly availablegrey literature documents locally-relevant to remote Indigenous communities in the Northern Terri-tory (NT), Australia. Existing planning documents with evidence of community input were used toreduce the response burden on Indigenous communities. A scoping review of community-focusedplanning documents resulted in the identification of 1120 built and 2215 socio-political environmentalindicators. Indicators were systematically classified using an Indigenous indicator classificationsystem (IICS). Applying the IICS yielded indicators prominently featuring the “community infras-tructure” domain within the built environment, and the “community capacity” domain within thesocio-political environment. This research demonstrates the utility of utilizing existing planningdocuments and a culturally appropriate systematic classification system to consolidate environmentaldeterminants that influence health and disease occurrence. The findings also support understandingof which features of community-level built and socio-political environments amenable to publichealth and social policy actions might be targeted to help reduce the prevalence of infectious andchronic diseases in Indigenous communities.
Keywords: indigenous; public health; environmental health; built environment; social planning; pub-lic policy; community infrastructure; community capacity; environmental indicators; grey literature
1. Introduction
The quality of the places where people live and the opportunities places provide formaking healthy choices shape people’s health behavior and their risk factors for healthand disease [1]. The World Health Organization (WHO) estimates about 22% of the globalburden of disease, and 23% of all deaths are attributable to modifiable environmental
Int. J. Environ. Res. Public Health 2021, 18, 4167. https://doi.org/10.3390/ijerph18084167 https://www.mdpi.com/journal/ijerph

Int. J. Environ. Res. Public Health 2021, 18, 4167 2 of 19
factors [2]. Built and social environmental factors are key contributors to health andwellbeing via different biological, behavioral, and psychosocial pathways in Indigenouspopulations [3,4]. For example, the features of local community contexts (e.g., conditionsof living, health enabling resource availability) can directly influence the life course of anindividual and lead to variations in people’s behavioral practices, psychosocial factors,stress axes, and inflammation [4]. Despite Australia being ranked second on the globalHuman Development Index preceded by Norway [5], Aboriginal and Torres Strait IslanderAustralians (hereafter respectfully referred to as “Indigenous Australians”) have the lowestlife expectancy when compared with Indigenous populations in other developed nationssuch as Canada, USA, and New Zealand [6]. Causes of this disparity are complex, butthe continuing effect of colonization, social and political oppression, and dispossessionof lands and resources to-date have contributed to significant health and socio-economicinequities implicating substantial health indices in Australian Indigenous populations [7].
Indigenous Australians living in remote areas experience a greater burden of diseaseand higher mortality rates compared to Indigenous people living in rural and metropolitanareas [8]. Moreover, Indigenous people living in remote and very remote areas of theNorthern Territory (NT) are disproportionately disadvantaged compared to all otherAustralian states and territories [9–11]. The gaps in life expectancy, mortality, and diseaseburden between Indigenous and non-Indigenous Australians are primarily driven bypreventable infectious and chronic diseases [12–14]. These health inequalities are notlimited to poverty only but are also influenced by broader social determinants of health,such as education, training, and skills development; employment status; access to andimprovement in health care systems including technological innovation; transportation andfood; conditions of homes and workplaces; social support; and gender and ethnicity [15,16].Therefore, in addition to solely addressing biomedical challenges, it is imperative toreduce structural inequities in society through a more equitable distribution of communityinfrastructure resources, income, goods, and services for the holistic health and wellbeingof its people [15,17,18]. Many of these social determinants are fundamental to health andare associated with Indigenous people’s health and wellbeing [19,20]. There is concern thatfinancial investments in Indigenous health are focused on behavior change rather thanchanging the environment and are not leading to improvements in health indicators [21].
Commonwealth, state, and territory governments in Australia fund strategic pro-grams and services to improve the living conditions in Indigenous communities to reducethe disparities in health outcomes. As part of the “Closing the Gap” strategy, all levelsof government use a range of indicators to monitor and evaluate the performance andfunctioning of essential services and community infrastructure. These indicators provideinsight into population-related health and wellbeing and help set priorities for programand service delivery within the health and social service system [22,23]. Addressing thecommunity determinants of health and wellbeing may improve community health andreduce the financial burden on the health care system.
Despite an emphasis on evidence-informed policy and accountability [24], the basisfor the selection of indicators by government to monitor improvements in Indigenoushealth and wellbeing and the local relevance of these indicators is not always clear [25,26].A system-wide approach to identify indicators for transparent priority setting and engage-ment with Indigenous community stakeholders is also lacking [24]. To generate policy-and practice-relevant evidence, a scoping review was conducted to identify community-informed built and socio-political environmental factors relevant to remote Indigenouscommunity health and wellbeing, inclusive of infectious and chronic diseases. A scopingreview methodology was chosen as it allows key concepts and evidence from diversesources to be summarized and consolidated to inform policy and practice and guide fu-ture research [27]. Scoping reviews often include stakeholder consultation to validateresearch findings [28] and make recommendations for future research [29]. Althoughscoping reviews have been adopted in various disciplines and fields to answer a range ofresearch questions [27,30], a recent review found that out of 344 scoping reviews, 58.7%
Int. J. Environ. Res. Public Health 2021, 18, 4167 3 of 19
addressed a health-related topic [31]. Most of these reviews rely on peer reviewed literaturesources [32,33]. This scoping review study is novel for systematically reviewing publiclyavailable grey literature [34]. The grey literature pertains to a range of print and electronicdocuments produced by government, not-for-profit, academic, business, and industrysources that are not controlled by commercial publishers [34]. This scoping review utilizedpolicy and planning-related documents to achieve the following research objectives:
1. identify and characterize the key characteristics of publicly available planning, policy,and reporting documents relevant to remote Indigenous communities in the NT;
2. classify community-level built and socio-political environmental indicators using anIndigenous indicator classification system (IICS).
2. Study Context
This scoping review was supported by an Australian National Health and MedicalResearch Council (NHMRC) funded project grant titled Environments and Remote Indige-nous Cardiometabolic Health (EnRICH). The EnRICH Project aimed to characterize remoteIndigenous communities in the NT according to their social, built, and physical environ-mental characteristics in relation to community-level cardiometabolic disease outcomes.This scoping review used the initial pool of EnRICH-identified 51 remote communities ofthe NT as the basis for its study sample.
This review applied an integrated knowledge translation (iKT) approach [35,36].Decision makers, including policy officers, senior administrators, and members of thepublic and environmental health workforce in the NT were engaged throughout the scopingreview process. These workforce members were considered to have expert knowledge onlocal living conditions based on their experiences living and working in remote Indigenouscommunities in the NT. The stakeholder organizations identified a need to investigate howcommunity-level environmental living conditions related to both infectious and chronicdiseases, rather than focusing solely on chronic disease. The review responded to identifiedstakeholder concerns and was expanded to include infectious disease. Discussions withstakeholders then lead to a re-framing of the review to health and wellbeing. From anIndigenous perspective, “health and wellbeing” is inclusive of chronic and infectiousdiseases outcomes [37].
To ensure cultural integrity of the study, two Indigenous cultural mentors wereengaged. Indigenous cultural mentors provided cultural oversight at the early stage inframing the scoping review protocol and in subsequent stages of the review process. Thestated aim of this scoping review reflects the input from stakeholder organizations andIndigenous cultural mentors.
3. Materials and Methods
This scoping review followed Arksey and O’Malley’s six-stage methodological frame-work [28] and Levac’s enhancement recommendations [38]. Each stage is identified belowwith the relevant enhancements.
Stage 1: Identify research questionGuided by a conceptual framework of Indigenous place and health [4], the scoping
review addressed the following research question: For Indigenous people living in remotecommunities in the Northern Territory, what local community-level built and socio-political envi-ronmental indicators are available and relevant to the health and wellbeing, inclusive of chronicdisease and infectious disease, from Indigenous community members’ perspectives?
Stage 2: Identify relevant studies (literature)A robust search was undertaken to identify relevant grey literature documents pub-
lished online.The final selection of documents was distilled from data sources, including Indigenous
databases, which were most likely to house peer reviewed and non-peer reviewed literaturerelevant to Indigenous populations. Data sources were websites of local, regional, andstate/territory governments; websites of community-controlled health organizations; and

Int. J. Environ. Res. Public Health 2021, 18, 4167 4 of 19
electronic databases of research repositories such as the Australian National Library (i.e.,TROVE), and the Aboriginal and Torres Strait Islander Health Bibliography. The searchwas limited to literature published between 2001 and 2015. The following search termswere used to identify relevant literature:
• Indigenous Australian OR Aboriginal OR Torres Strait Islander AND;• community AND;• environment AND;• plan OR policy OR report AND;• Northern Territory OR NT.
Stakeholder organizations suggested the following document types as the startingpoint to identify community-level environmental indicators: (i) strategic plans, (ii) localimplementation plans, (iii) community plans, (iv) corporate plans, (v) operational plans,(vi) annual reports, and (vii) evaluation reports.
Stage 3: Study selectionA two-stage study selection process was applied. First, the following three criteria
were used to identify organizations as data sources relevant to the review question:
• The organization is responsible for the delivery of community health and environ-mental programs to Indigenous people specific to one or more remote communities inthe NT;
• the organization publishes community-level policy, reporting, evaluation, strategicplanning, or local planning documents with a focus relevant to health and wellbeing,including preventable infectious disease and chronic disease; and
• the organization is a member of a peak body in the NT.
To be eligible for selection, the organizations needed to satisfy all three criteria.Second, the documents were selected based on a set of six inclusion criteria and
decision rules (see Table 1). All six criteria were required to be met for a document to beincluded in the review.
Table 1. Inclusion criteria used for identification and selection of relevant studies.
Criterion No. Descriptions
1. Specific to Indigenous people living in one or more remotecommunities identified for the EnRICH Project in the NT, Australia.
2.Represent policy, reporting, evaluation, strategic planning, or localplanning documents with a focus relevant to health and wellbeing,including preventable chronic disease and/or infectious disease.
3.Must contain one or more identifiable community-level objective orsubjective built and socio-political environmental indicators relevant tothe social determinants of health.
4.
Show evidence of consultation (e.g., provide details on whoparticipated, venue, date, and nature of input provided and not merelyrefer to “the community was consulted”) with Indigenous communitymembers, representatives, or frontline professionals working in theareas of public and environmental health.1
5.Publicly available online or in other formats published by governmentand non-government organizations in the most recent year but notearlier than 2001.
6.Regional and state or territory level documents were included if theyhad relevance to one or more communities identified for the EnRICHProject in the NT, Australia.
1 Instances where insufficient detail of the community consultation was provided in a document, the firstauthor investigated the source organization’s website for evidence of community consultation pertaining tothat document (e.g., regional council and local authority meeting agenda and minutes where participantshave workshopped for community priorities and discussed draft regional plans with stakeholders; photos ofconsultations).

Int. J. Environ. Res. Public Health 2021, 18, 4167 5 of 19
Stage 4: Charting the dataA “data charting tool” was used to extract information (data) from the included
planning documents. It comprised two distinct components: (1) extraction of descriptiveinformation (e.g., title, source, year published), and (2) extraction and classification ofindicators. The second component integrated a culturally-relevant Indigenous indicatorclassification system (IICS) [39]. Indicators were classified according to its four hierarchicallevels: (i) Subject Grouping, (ii) Domain, (iii) Goal Dimension, and (iv) Indicator Group.Each of the charted indicators was assigned to a numeric sub-dimension number (1, 2, 3,etc.) for identification purposes.
Stage 5: Collating, summarizing, and reporting the resultsExtracted data were collated and analyzed using SPSS [40]. Descriptive statistics, i.e.,
percentage, mean, median, and interquartile range were computed, as appropriate. Theanalyses were stratified according to: regional area (i.e., Northern, Central, Big Rivers);IICS classification level (i.e., subject group, domain, goal dimension, indicator group); levelof governance (i.e., local, regional); and document type (i.e., local implementation plan,community plan, local authority plan, regional plan).
Stage 6: Consultation exerciseThis study engaged Indigenous and non-Indigenous frontline workers, as well as
managerial and policy-level staff members, who worked in, or had responsibility to provide,environmental and/or public health services in one or more of the identified communitiesin the NT. The engagement of these stakeholders in a working group meeting setting waskey to consolidating and synthesizing the built environmental indicators generated fromthe scoping review.
4. Results
The planning documents were distilled from an initial pool of 1722 records (throughdatabase searching and other sources) that included both academic journal articles andgrey literature documents. After deduplication, 1586 records were screened and assessedagainst the eligibility criteria. The eligibility assessment identified 39 planning documentsfor inclusion in the review (see Figure 1).
Of the included documents, 31 were community-level plans classified as local imple-mentation plans (n = 13), community plans (n = 10), and local authority plans (n = 8). Theremaining eight documents were community-focused regional-level plans classified asregional plans. The timeframes for the documents ranged from 1 to 3 years (median = 1.0,interquartile range 1.0, 3.0) for the community-level plans, and 1 to 4 years (median = 1.0,interquartile range 1.0, 1.0) for the regional-level plans. The number of pages ranged from1 to 62 (median = 27.5, interquartile range 3.5, 52.0) for community-level plans, and from31 to 147 (median = 81.5, interquartile range 42.3, 125.8) for regional-level plans.
A total of 2481 indicator statements were identified from the included planningdocuments. Overall, the number of indicator statements per document ranged from6 to 163 (median = 66.0, interquartile range 24.0, 99.0) statements. Approximately 77%(n = 1913/2481) of the indicator statements, were classified as relevant to the built or socio-political environment and were eligible for extraction. The remaining indicator statements(23%) were aligned with socio-economic, socio-demographic, and cultural environmentsthat were outside the scope of this study. Table 2 shows the characteristics of selectedindicator statements related to socio-political and built environments by type of planningdocument. Results are further presented according to hierarchical classification levels ofthe IICS (see Supplementary File, Table S1).

Int. J. Environ. Res. Public Health 2021, 18, 4167 6 of 19
Int. J. Environ. Res. Public Health 2021, 18, x FOR PEER REVIEW 6 of 19
political environment and were eligible for extraction. The remaining indicator statements
(23%) were aligned with socio-economic, socio-demographic, and cultural environments
that were outside the scope of this study. Table 2 shows the characteristics of selected
indicator statements related to socio-political and built environments by type of planning
document. Results are further presented according to hierarchical classification levels of
the IICS (see Supplementary File, Table S1).
Figure 1. Process of identifying and selecting primary documents.
Table 2. Descriptive characteristics of unique indicator statements related to socio-political and
built environments according to type of planning document.
Types of Documents Descriptive Statistics
No. of Unique Indicator
Statements
Included Excluded
Community-level plan
(n = 31)
N (number of indicator state-
ments) 1458 276
Mean 47.0 8.9
SD 35.1 7.3
Median 46.0 8.0
1st Qtl (0.25) 16.0 2.0
3rd Qtl (0.75) 72.5 13.0
Min 5 0
Max 120 30
Records identified through database searching
(n = 1129)
Scre
enin
g In
clu
ded
El
igib
ility
Id
enti
fica
tio
n Additional records identified
through other sources (including regional council websites)
(n = 593)
Records after duplicates removed (n = 1586)
Records screened (n = 1586)
Records excluded for not meeting any eligibility
criteria (n =1403)
Full text assessed for eligibility (n = 183)
Records excluded - not meeting criteria of (a)
evidence of community consultation, or (b)
stakeholder organisation (n = 144)
Studies included in the scoping review (n = 39)
Duplicates removed (n = 136)
Figure 1. Process of identifying and selecting primary documents.
Subject Group levelOn average, each indicator statement represented more than one element of the built
and/or socio-political environment. Disaggregating the multiple elements from the initialpool of 1913 indicator statements resulted in 3335 distinct indicators. The majority of thesedistinct indicators were related to the socio-political environment subject group (66.4%);the remaining indicators were related to the built environment subject group (33.6%).
Indicator statements within the socio-political subject group were more prominentthan indicator statements within the built environment subject group for all three regionsof the NT, namely Northern (73.3%, n = 1025), Big Rivers (64.0%, n = 529), and CentralAustralia (59.6%, n = 661); and for the document types of local implementation plans(73.1%, n = 1480) and regional plans (70.1%, n = 469).

Int. J. Environ. Res. Public Health 2021, 18, 4167 7 of 19
Table 2. Descriptive characteristics of unique indicator statements related to socio-political and builtenvironments according to type of planning document.
Types of Documents DescriptiveStatistics
No. of Unique Indicator StatementsIncluded Excluded
Community-level plan(n = 31)
N (number ofindicator statements) 1458 276
Mean 47.0 8.9SD 35.1 7.3
Median 46.0 8.01st Qtl (0.25) 16.0 2.03rd Qtl (0.75) 72.5 13.0
Min 5 0Max 120 30
Regional-level plan (n = 8)
N (number ofindicator statements) 455 265
Mean 56.9 33.1SD 33.0 22.8
Median 58.5 42.01st Qtl (0.25) 32.7 11.53rd Qtl (0.75) 79.25 47.0
Min 9 3Max 99 62
Domain LevelThe indicator statements were classified into 15 domains; 8 of these domains were
aligned with the socio-political environment subject group and 7 domains with the builtenvironment subject group, as illustrated in Figure 2. Within the socio-political subjectgroup, the majority indicators (Figure 2a) were related to the community capacity (81.6%,n = 1808), followed by the public safety and crime (10.4%, n = 230), and labor market andworking conditions (4.0%, n = 88) domains. Within the built subject group, the majorityindicators (Figure 2b) were related to the community infrastructure (58.1%, n = 651), followedby the housing (10.7%, n = 120), transportation (9.6%, n = 108), health (8.5%, n = 95), andeducation (6.7%, n = 75) domains.
At the socio-political environmental domain level, components of community ca-pacity include aspects of community governing structure and processes, and social andinter-organizational networks. Community capacity also involves opportunities for skillsdevelopment training, community members’ abilities to participate in advocacy and mobi-lization, and community economic and social capital. The public safety and crime domainpertains to the availability of resources for community protection (e.g., legal protection)and emergency preparedness, and policies on public and environmental health practices.Labor market and working conditions reflect that within communities there are existingstable employment and reemployment opportunities available, and that those who are notemployed are provided with social assistance support.
At the built environmental domain level, components of community infrastructurerepresent local-level infrastructure resourcing and social programming. The housingdomain involves all aspects of housing. The transportation domain consists of transportfacilities (e.g., bus, bus stop, train station). The health domain includes all facilities related tohealth services. Finally, the education domain includes available education and communitycenters within the community.
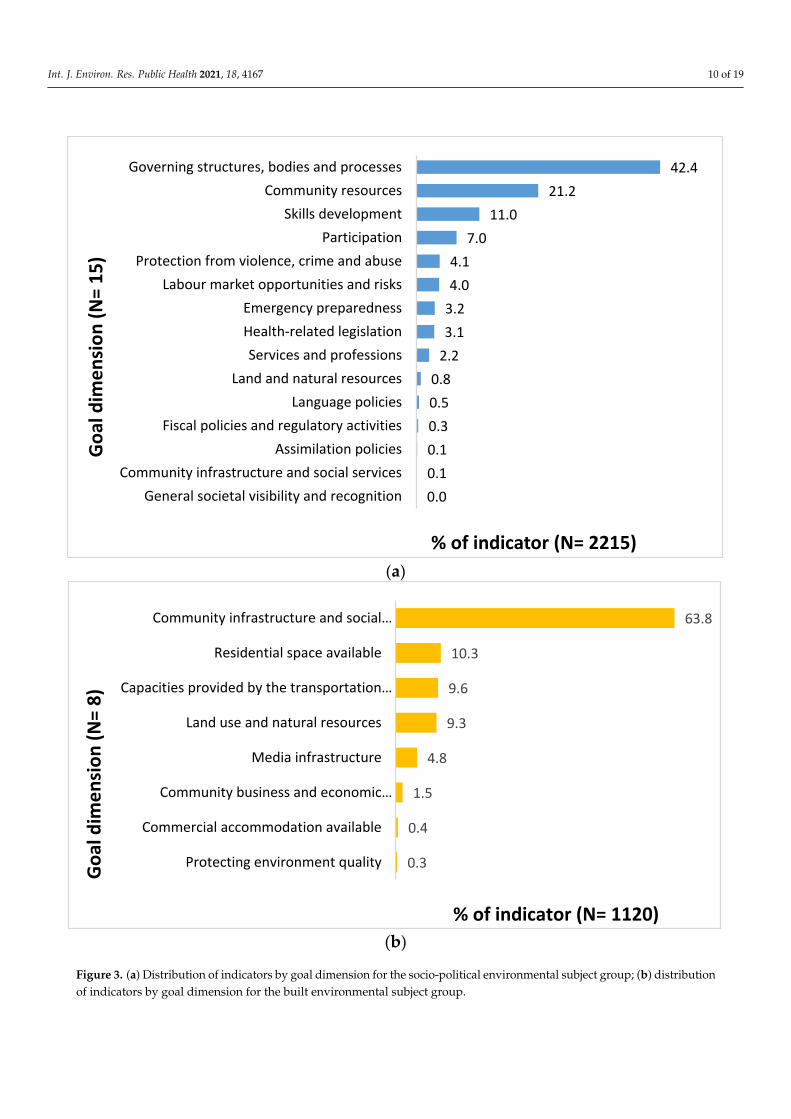
Goal Dimension LevelThe indicator statements were further classified into 23 goal dimensions; 15 of these
goal dimensions were relevant to the socio-political environment subject group and 8to the built environment subject group, as illustrated in Figure 3. The majority of socio-political indicators (Figure 3a) were classified to the goal dimensions of governing structures,bodies and processes (42.4%, n = 940), followed by community resources (21.2%, n = 470),skills development (11.0%, n = 243), and participation (7.0%, n = 155). The majority of built

Int. J. Environ. Res. Public Health 2021, 18, 4167 8 of 19
indicators (Figure 3b) were classified to the goal dimensions of community infrastructure andsocial programming (63.8%, n = 714), followed by residential space available (10.3%, n = 115),capacities provided by the transportation system (9.6%, n = 108), land use and natural resources(9.3%, n = 104), and media infrastructure (4.8%, n = 54).
At the socio-political environmental goal dimension level, the governing structures,bodies, and processes reflect opportunities and resources available for communities toestablish their own governing bodies (e.g., a community elder’s council), the ability toundertake planning and policy development work, and the establishment and functioningof a network of organizations to support program and service delivery. The communityresources goal dimension involves the establishment of community-based organizationsfor sustainable programs and service delivery, and the availability of program and orga-nizational funding. The skills development goal dimension reflects a process wherebycommunity members have the opportunity to improve their skills through training andeducation. Participation, on the other hand, involves community members’ engagementwithin internal community public affairs, engagement with external public affairs, andparticipation in the political arena.
At the built environmental goal dimension level, community infrastructure and socialprogramming consists of essential facilities and services that are required for communityfunctioning. This includes facilities such as a community center, sports and recreationalfacilities, water and power supply infrastructure, and waste disposal facilities and services.The goal dimension pertaining to residential space available refers to spaces and infras-tructure where people can live, specifically residential dwellings, common communitydwellings (e.g., staff quarters), and incomplete residential building infrastructure. Ca-pacities provided by the transportation system primarily involve existing transportationfacilities including access and availability of buses, trains, and water transportation facili-ties complemented by a road network. The land use and natural resources goal dimensionincludes features of environments such as land development, vegetation, landscaping,and natural resources including sea, minerals, and waterbodies. The media infrastructuregoal dimension represents facilities and services for communication including print andelectronic media, telephone and mobile networks, and advanced community facilities suchas internet.
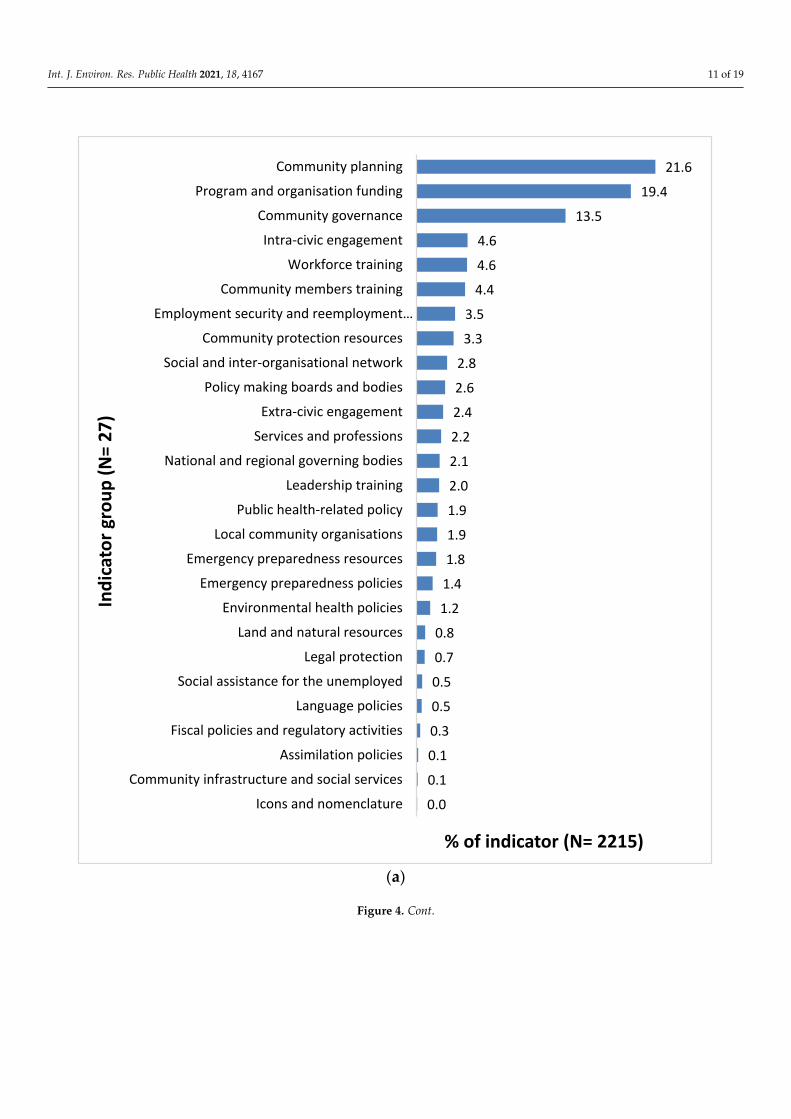
Indicator Group LevelThe indicators were then classified into 51 indicator groups, of which 27 were relevant
to socio-political environments and 24 were relevant to built environments, as illustratedin Figure 4. The majority of socio-political environmental indicators (Figure 4a) wereclassified into the indicator groups of community planning (21.6%, n = 478), followed byprogram and organization funding (19.4%, n = 429), and community governance (13.5%, n = 298),while the majority of built environmental indicators (Figure 4b) were classified into theindicator groups of general community infrastructure (17.0%, n = 190), sports and recreationalfacilities (11.6%, n = 130), land use and green space management (9.3%, n = 104), health servicesfacilities (8.5%, n = 95), community service facilities (7.2%, n = 81), and residential dwelling(7.0%, n = 78).
At the socio-political indicator group level, indicators related to community planninginvolved the community’s ability to undertake short- and long-term planning processes indiverse settings. These included a plan identifying the community priority for program andservice delivery, for example, to develop an economic and opportunities profile. Indicatorsrelated to program and organizational funding refer to a broad range of programs andservices implemented at the community-level and funding provided by federal, state,and regional governments. Indicators relevant to community governance often includedestablishment of groups or committees to oversee programs and services (e.g., establish aschool attendance working group).

Int. J. Environ. Res. Public Health 2021, 18, 4167 9 of 19
Int. J. Environ. Res. Public Health 2021, 18, x FOR PEER REVIEW 7 of 19
Regional-level plan (n = 8)
N (number of indicator state-
ments) 455 265
Mean 56.9 33.1
SD 33.0 22.8
Median 58.5 42.0
1st Qtl (0.25) 32.7 11.5
3rd Qtl (0.75) 79.25 47.0
Min 9 3
Max 99 62
Subject Group level
On average, each indicator statement represented more than one element of the built
and/or socio-political environment. Disaggregating the multiple elements from the initial
pool of 1913 indicator statements resulted in 3335 distinct indicators. The majority of these
distinct indicators were related to the socio-political environment subject group (66.4%);
the remaining indicators were related to the built environment subject group (33.6%).
Indicator statements within the socio-political subject group were more prominent
than indicator statements within the built environment subject group for all three regions
of the NT, namely Northern (73.3%, n = 1025), Big Rivers (64.0%, n = 529), and Central
Australia (59.6%, n = 661); and for the document types of local implementation plans
(73.1%, n = 1480) and regional plans (70.1%, n = 469).
Domain Level
The indicator statements were classified into 15 domains; 8 of these domains were
aligned with the socio-political environment subject group and 7 domains with the built
environment subject group, as illustrated in Figure 2. Within the socio-political subject
group, the majority indicators (Figure 2a) were related to the community capacity (81.6%, n
= 1808), followed by the public safety and crime (10.4%, n = 230), and labor market and working
conditions (4.0%, n = 88) domains. Within the built subject group, the majority indicators
(Figure 2b) were related to the community infrastructure (58.1%, n = 651), followed by the
housing (10.7%, n = 120), transportation (9.6%, n = 108), health (8.5%, n = 95), and education
(6.7%, n = 75) domains.
(a)
0.1
0.4
0.5
0.8
2.3
4.0
10.4
81.6
Background and History
Indigenous Self-Government and Autonomy
Language and literacy
Community economic resources
Indigenous Visibility and Representation
Labour Market and Working Conditions
Public Safety and Crime
Community Capacity
% of indicator (N=2215)
Do
mai
n (
N=
8)
Int. J. Environ. Res. Public Health 2021, 18, x FOR PEER REVIEW 8 of 19
(b)
Figure 2. (a) Distribution of indicators by domain for the socio-political environmental subject
group; (b) distribution of indicators by domain for the built environmental subject group.
At the socio-political environmental domain level, components of community capac-
ity include aspects of community governing structure and processes, and social and inter-
organizational networks. Community capacity also involves opportunities for skills de-
velopment training, community members’ abilities to participate in advocacy and mobi-
lization, and community economic and social capital. The public safety and crime domain
pertains to the availability of resources for community protection (e.g., legal protection)
and emergency preparedness, and policies on public and environmental health practices.
Labor market and working conditions reflect that within communities there are existing
stable employment and reemployment opportunities available, and that those who are
not employed are provided with social assistance support.
At the built environmental domain level, components of community infrastructure
represent local-level infrastructure resourcing and social programming. The housing do-
main involves all aspects of housing. The transportation domain consists of transport fa-
cilities (e.g., bus, bus stop, train station). The health domain includes all facilities related
to health services. Finally, the education domain includes available education and com-
munity centers within the community.
Goal Dimension Level
The indicator statements were further classified into 23 goal dimensions; 15 of these
goal dimensions were relevant to the socio-political environment subject group and 8 to
the built environment subject group, as illustrated in Figure 3. The majority of socio-po-
litical indicators (Figure 3a) were classified to the goal dimensions of governing structures,
bodies and processes (42.4%, n = 940), followed by community resources (21.2%, n = 470), skills
development (11.0%, n = 243), and participation (7.0%, n = 155). The majority of built indica-
tors (Figure 3b) were classified to the goal dimensions of community infrastructure and social
programming (63.8%, n = 714), followed by residential space available (10.3%, n = 115), capac-
ities provided by the transportation system (9.6%, n = 108), land use and natural resources (9.3%,
n = 104), and media infrastructure (4.8%, n = 54).
1.5
4.8
6.7
8.5
9.6
10.7
58.1
Community economic resources
Leisure and Media Consumption
Education
Health
Transportation
Housing
Community infrastructure
% of indicator (N= 1120)
Do
mai
n (
N=7
)
Figure 2. (a) Distribution of indicators by domain for the socio-political environmental subject group; (b) distribution ofindicators by domain for the built environmental subject group.
Int. J. Environ. Res. Public Health 2021, 18, 4167 10 of 19Int. J. Environ. Res. Public Health 2021, 18, x FOR PEER REVIEW 9 of 19
(a)
(b)
Figure 3. (a) Distribution of indicators by goal dimension for the socio-political environmental
subject group; (b) distribution of indicators by goal dimension for the built environmental subject
group.
At the socio-political environmental goal dimension level, the governing structures,
bodies, and processes reflect opportunities and resources available for communities to
establish their own governing bodies (e.g., a community elder’s council), the ability to
undertake planning and policy development work, and the establishment and function-
ing of a network of organizations to support program and service delivery. The commu-
nity resources goal dimension involves the establishment of community-based organiza-
tions for sustainable programs and service delivery, and the availability of program and
organizational funding. The skills development goal dimension reflects a process
whereby community members have the opportunity to improve their skills through train-
ing and education. Participation, on the other hand, involves community members’ en-
gagement within internal community public affairs, engagement with external public af-
fairs, and participation in the political arena.
0.0
0.1
0.1
0.3
0.5
0.8
2.2
3.1
3.2
4.0
4.1
7.0
11.0
21.2
42.4
General societal visibility and recognition
Community infrastructure and social services
Assimilation policies
Fiscal policies and regulatory activities
Language policies
Land and natural resources
Services and professions
Health-related legislation
Emergency preparedness
Labour market opportunities and risks
Protection from violence, crime and abuse
Participation
Skills development
Community resources
Governing structures, bodies and processes
% of indicator (N= 2215)
Go
al d
ime
nsi
on
(N
= 1
5)
0.3
0.4
1.5
4.8
9.3
9.6
10.3
63.8
Protecting environment quality
Commercial accommodation available
Community business and economic…
Media infrastructure
Land use and natural resources
Capacities provided by the transportation…
Residential space available
Community infrastructure and social…
% of indicator (N= 1120)
Go
al d
ime
nsi
on
(N
= 8
)
Figure 3. (a) Distribution of indicators by goal dimension for the socio-political environmental subject group; (b) distributionof indicators by goal dimension for the built environmental subject group.
Int. J. Environ. Res. Public Health 2021, 18, 4167 11 of 19Int. J. Environ. Res. Public Health 2021, 18, x FOR PEER REVIEW 11 of 19
(a)
0.0
0.1
0.1
0.3
0.5
0.5
0.7
0.8
1.2
1.4
1.8
1.9
1.9
2.0
2.1
2.2
2.4
2.6
2.8
3.3
3.5
4.4
4.6
4.6
13.5
19.4
21.6
Icons and nomenclature
Community infrastructure and social services
Assimilation policies
Fiscal policies and regulatory activities
Language policies
Social assistance for the unemployed
Legal protection
Land and natural resources
Environmental health policies
Emergency preparedness policies
Emergency preparedness resources
Local community organisations
Public health-related policy
Leadership training
National and regional governing bodies
Services and professions
Extra-civic engagement
Policy making boards and bodies
Social and inter-organisational network
Community protection resources
Employment security and reemployment…
Community members training
Workforce training
Intra-civic engagement
Community governance
Program and organisation funding
Community planning
% of indicator (N= 2215)
Ind
icat
or
gro
up
(N
= 2
7)
Figure 4. Cont.

Int. J. Environ. Res. Public Health 2021, 18, 4167 12 of 19Int. J. Environ. Res. Public Health 2021, 18, x FOR PEER REVIEW 12 of 19
(b)
Figure 4. (a) Distribution of indicators by indicator group for the socio-political environmental
subject group; (b) distribution of indicators by indicator groups for the built environmental subject
group.
5. Discussion
This scoping review aimed to capture built and socio-political community-level en-
vironmental indicators relevant to the health and wellbeing of remote Indigenous com-
munities in the NT Australia. The review was guided by an iKT approach with environ-
mental and public health stakeholder organizations in the NT shaping the review scope
and suggesting the use of community and regional planning documents developed
through community inputs as a way forward for the review. This scoping review provides
an illustrative example for utilizing grey literature planning documents to inform policy
and practice and to guide future research.
The review found that a greater proportion of indicators in the planning documents
were related to the socio-political environment. This finding may reflect communities’
higher perceived needs related to the influence of local socio-political environments on
community health and wellbeing, than the influence of built environments.
Within the socio-political environment, indicators related to the community capacity
domain were most prominent and reflected community governing structure and pro-
cesses, as well as social and inter-organizational networks. This domain also features op-
portunities for skills development training, community members’ abilities to participate
0.1
0.3
0.4
0.4
0.4
0.4
0.4
0.4
0.6
1.0
2.1
3.3
3.8
4.5
4.7
4.9
5.3
6.7
7.0
7.2
8.5
9.3
11.6
17.0
Agricultural
Protecting environment quality
Industrial
Mining extraction
Commercial retail facilities
Food retail facilities
Commercial accommodation
Basic telecommunication facility
Basic print and electronic media facility
Power supply
Water supply
Community dwelling
Advanced communication facility
Community and cultural centres
Road network
Transport facilities
Solid waste disposal
Education and training centres
Residential dwelling
Community service facilties
Health service facilities
Land use and green space management
Sports and recreational facilities
General community infrastructure
% of indicator (N= 1120)
Ind
icat
or
gro
up
(N
= 2
4)
Figure 4. (a) Distribution of indicators by indicator group for the socio-political environmental subject group; (b) distributionof indicators by indicator groups for the built environmental subject group.
At the built environmental indicator group level, general community infrastructureincludes facilities and infrastructure that are not otherwise catalogued into relativelylarger infrastructure (e.g., community hall), such as public toilets, shed, drainage and footpaths, cemetery, etc. Indicators related to sports and recreational facilities include spaceswhere people can participate in sports and leisure activities (e.g., ovals, basketball courts,swimming pool). Indicators related to land use and greenspace management comprisethe development and management of parks and reserves, vegetation, furniture, and waterfountains in parks. Indicators relevant to health services include facilities and services toprovide primary and tertiary health care including community health center, aged care
Int. J. Environ. Res. Public Health 2021, 18, 4167 13 of 19
facility, pharmacy, hospital, morgue, and pest control/animal management. Communityservices facilities, on the other hand, include facilities such as laundry, garage/auto service,repairs and maintenance service, postal and financial services, government business center,and council office, whereas residential dwelling comprises residential housing facilitiesincluding free standing homes, units, and apartments.
5. Discussion
This scoping review aimed to capture built and socio-political community-level envi-ronmental indicators relevant to the health and wellbeing of remote Indigenous communi-ties in the NT Australia. The review was guided by an iKT approach with environmentaland public health stakeholder organizations in the NT shaping the review scope andsuggesting the use of community and regional planning documents developed throughcommunity inputs as a way forward for the review. This scoping review provides anillustrative example for utilizing grey literature planning documents to inform policy andpractice and to guide future research.
The review found that a greater proportion of indicators in the planning documentswere related to the socio-political environment. This finding may reflect communities’higher perceived needs related to the influence of local socio-political environments oncommunity health and wellbeing, than the influence of built environments.
Within the socio-political environment, indicators related to the community capacitydomain were most prominent and reflected community governing structure and processes,as well as social and inter-organizational networks. This domain also features opportunitiesfor skills development training, community members’ abilities to participate in advocacyand mobilization, and economic and social capital—conceivably pre-requisites for Indige-nous community self-determination. Prominence of the community capacity domainsupports Indigenous peoples’ right to make decisions on issues that affect them [41,42]. Ina changing policy landscape, and to ensure application of effective use of scarce resourcesin servicing Indigenous communities, it is essential that individual, community, and orga-nizational capacity is strengthened to enable priority setting and appropriate responses tolocal needs [42–44].
Within the built environment, indicators related to community infrastructure werefeatured prominently in the review. Community infrastructure generally consists of es-sential facilities such as the following: community center, sports and recreational facilities,water and power supply infrastructure, waste disposal facilities, and services that arerequired for adequate community functioning. These essential facilities are relevant tothe health and wellbeing of remote Indigenous communities. For example, communityinfrastructure relevant to residential housing has long been associated with health andwellbeing, inclusive of infectious and chronic diseases in remote Australian Indigenouscommunities [45–47]. Non-housing related features of community infrastructure such assports and recreational facilities can also impact infectious and chronic diseases through di-rect and indirect (mediational) pathways [3,4]. However, the non-housing-related featuresidentified in this review have rarely been empirically assessed in the remote IndigenousAustralian context. Most studies of this nature have been conducted in non-Indigenousand non-remote contexts [48].
Although the overall proportion of indicators related to the built environment foundin the review was lower than the proportion of socio-political indicators, this does notimply that perceived community needs for built environments were less important. Itmay be that features of community-level built environments were adequate, or compara-tively better addressed, than the community’s socio-political circumstances preceding theplanning period.
Interface between community capacity and community infrastructureCommunity capacity, as an aspect of the socio-political environment, and community
infrastructure, as an aspect of the built environment, complement each other in their in-fluence on collective health and wellbeing. For example, communities may continue to

Int. J. Environ. Res. Public Health 2021, 18, 4167 14 of 19
grapple with the burden of infectious and chronic diseases if features of “community infras-tructure” such as inadequate quality housing (e.g., non-functional sanitation and hygienefacilities), and features of “community capacity” such as unavailability of ongoing housingrepairs and maintenance services persist [46,47]. This evidence is supported by the notionthat the availability of community health infrastructure, and community capacity to man-age such infrastructure, can impact health service delivery and program sustainability [49].Further, the success and sustainability of a community-based health center, for instance,often depends on its capacity to develop inter-organizational networks to continue servicedelivery once funding ceases. Likewise, opportunities for social engagement within publicspaces (e.g., cultural centers, churches, recreational facilities) can influence communitymembers’ capacity to build networks and advocate for improved community-level builtinfrastructures [48].
Nevertheless, caution must be taken when considering the interplay between commu-nity capacity and community infrastructure, and their influence on health and wellbeing.An expectation that the community should solve their own problems by doing somethingabout deficient community infrastructure, without adequate support and resourcing, istantamount to “victim-blaming” and can reinforce disempowerment [50,51]. Health out-comes may vary between and within communities not only due to favorable existing healthhardware, but also due to multifaceted factors including continuation of organizationalfunding, a stable workforce, and skilled local community members. Such variations inhealth outcomes could in turn influence the variations in existing community capacity andcommunity infrastructure that require closer scrutiny.
Differences according to geographic region and planning document typeThe distribution of built and socio-political environmental indicators in the documents
varied according to the three regions of the NT. This finding suggests differences in theunderlying social dynamics and infrastructure needs in communities within the regions.The socio-political environmental indicators frequently endorsed for the Northern regionhighlights communities’ greater aspirations for participation in governance, control ofcommunity resources, and strengthening skills to self-manage community-level builtinfrastructure. Therefore, needs for community governance and control, and strengtheningskills to self-manage infrastructures in Northern region are likely to be greater than theCentral and Big Rivers regions. In contrast, the built indicators frequently endorsed forthe Central Australia region may reflect greater built infrastructure needs for CentralAustralia compared to the Northern and Big Rivers regions. This may be due to climaticconditions that will likely require new design specifications for community infrastructure(e.g., improved insulation and household air conditioning, stable electricity poles) to matchlocalized extreme weather patterns in Central Australia [52].
Our findings show the distribution of socio-political environmental indicators weremore prominent within the local implementation plan and regional plan documents,whereas the distribution of built environmental indicators were relatively higher in thecommunity plan document compared to other document types. This difference maysuggest diversity in the planning focus, and the roles and responsibilities involved inthe establishment and maintenance of local level infrastructure. For example, typicallyregional-level planning documents have a strategic focus with a longer-term duration (e.g.,4 years), covering large areas and numbers of communities that fall within the structure ofa regional government council. This is in contrast to community-level planning documents,which are based on short term (e.g., 1–2 years) local-level priority setting that complementsregional-level strategic plans [53]. Community-level planning documents generally guideand inform a regional council’s service delivery responsibilities, including budgetaryallocations towards its communities, on a year-by-year basis. Conversely, regional plansare used as a strategic framework to identify community-level needs and work out detailimplementation over time.
Utility of grey literature use

Int. J. Environ. Res. Public Health 2021, 18, 4167 15 of 19
A novel aspect of this scoping review was the use of grey literature, specificallyplanning documents. There is a growing recognition of the importance of grey literatureto inform evidence-based decision making [54]. Although the methodologies used ingrey literature may not be as robust as those appearing in peer-reviewed journals, greyliterature is produced by practitioners, service providers, and community members whoare local knowledge holders [54,55]. Grey literature often provides useful informationrelevant to applied settings such as assessment and innovation in public health practiceon what place-based interventions are effective, why, and for whom [56,57]. Moreover,grey literature encapsulates policy and planning documents that are outside the realm ofresearch and are generated by different levels of government to guide policy, practice, andservice delivery. Relevant community and regional-level planning documents pertainingto built and socio-political environments were therefore thought to primarily be availablein a broad range of grey literature information sources.
The key findings of this study must be interpreted in the context of a number ofstrengths and limitations.
StrengthsThis study had three notable strengths. First, a key strength and unique characteristic
of this scoping review was its use of the culturally-relevant IICS [39,58]. The IICS wasadapted to guide the classification of environmental indicators as “perceived needs” of thecommunity in a systematic approach. The structured framework of the IICS also enabledindicators classified at different hierarchical levels to be explored by region, which may behelpful in understanding differences in indicator distribution due to contextual differenceswithin the regions.
Second, Indigenous communities are over-researched and burdened with consulta-tions by external stakeholder organizations soliciting the same type of information, and yettangible benefits to the community from the research are often absent [59,60]. This scop-ing review explicitly prioritized privileging and acknowledging community perspectivesin the selection, extraction, and classification of indicators by using existing documentsdeveloped with community consultation, to reduce community response burden. Thisapproach provided a more compelling platform to engage key stakeholder organizationsin interpreting the results.
Third, this study was additionally novel for informing two subsequent practice- andpolicy-relevant investigations. The synthesized built environmental indicators distilledfrom the scoping review were further refined by the working group and informed a secondconcepting mapping study to prioritize built environment indicators in relation to theirinfluence on infectious and chronic diseases in the same remote region. Highly rankedand prioritized built environment indicators were then selected for a third epidemiologicalstudy examining associations between the built environment and infectious diseases inremote NT communities.
LimitationsThis study also had two notable limitations. First, it was a time-bound study. Due to
time limitations, it was not possible to expand the search to include more than the 100 hits inGoogle. Presumably, the top 100 hits from the worldwide web were the most topic-relevant.Given the limited peer-reviewed literature on the socio-political and built environment inrelation to the health and wellbeing of Indigenous communities in developed countries,including Australia [58], it is likely that few published studies relating to remote andIndigenous communities in the NT would have been identified. Therefore, this projectrelied on grey literature documents available through relevant stakeholder organizationsand community websites. The list of included documents was reviewed by key governmentstakeholders and deemed to reflect relevant planning documents for these regions andcommunities. However, it is possible that some key documents may have been missed inthe search process.
Second, although “evidence of community consultation” was one of the most im-portant document selection criteria, it is possible that some documents were included

Int. J. Environ. Res. Public Health 2021, 18, 4167 16 of 19
that reflected tokenistic participation, and that some documents were excluded due topoor reporting in relation to level of community consultations. The reviewed documentscould have been more explicit in how community members were involved in the planningprocess. Specifically, as suggested by Kenny et al. [61], more information could have beenprovided on how the community consultations were done, the nature of the outputs, andhow the community was represented.
6. Conclusions
This review was an innovative first effort to identify and classify social-political andbuilt environment indicators from community-level planning documents (“grey literature”)relevant to remote Indigenous communities in the NT, Australia. This review demonstratedthe utility of adopting an iKT approach to respond to stakeholder organizations’ issuesand concerns. To privilege community member perspectives and to avoid burdening com-munity members with requests for information that they had already provided, this studyincluded documents in the review that demonstrated evidence of community engagement.The use of a structured culturally-relevant indicator classification system (i.e., the IICS)was advantageous for systematically classifying the indicators.
The embodiment of a classification system, such as the IICS, into public and envi-ronmental health practice may increase the scope for governments to coordinate servicedelivery in a uniform and consistent manner and could be used to inform priority setting forresource allocation as well as monitoring progress in service delivery in the NT, Australia.Future research should utilize participatory (action) research and the IICS to guide thestructure and format of community-level planning processes. This would ensure greaterconsistency between planning and reporting documents and facilitate the comparisonof performance monitoring based on indicator groups and domains. There is a growingcall by population and public health researchers that future research on the disparities inIndigenous health should target community-level social environments as units of analy-sis [4,62]. The findings of this scoping review, specifically that 66% of extracted indicatorswere classified into the socio-political environment subject grouping compared to the builtenvironment subject grouping, support this research focus.
From a policy and practice perspective, to maintain a healthful community living envi-ronment, it is important for communities to have access to supportive social and economicenvironments. Components of supportive environments may include adequate levels ofincome and employment opportunities and participation of the community in local deci-sion making. Findings from this scoping review support this need. The review identifiedthat the most common socio-political environmental indicators relevant to “communitycapacity” were “community control in planning and governance”, and “opportunitiesfor employment, education, and training”. Therefore, systematically selected built andsocial environmental indicators generated in the scoping review, may support stakeholdersfrom the environmental and public health sectors to identify priority indicators that canbe actioned in the shorter and longer term. The built environmental indicators identifiedin this research may also contribute to a stronger evidence base to address local-levelenvironmental health issues and strengthen the capacity of public and environmentalhealth practice in the NT.
Supplementary Materials: The following are available online at https://www.mdpi.com/article/10.3390/ijerph18084167/s1, Table S1: Built and socio-political environmental indicator classificationframework: title: Identifying environmental determinants relevant to health and wellbeing in remoteAustralian Indigenous communities: a scoping review of grey literature.
Author Contributions: A.C. (Amal Chakraborty), M.D., N.J.H. and M.C., designed the study;A.C. (Amal Chakraborty) collected and managed the data and conducted all analysis; A.C. (AmalChakraborty), M.D., N.J.H., A.C. (Alwin Chong), N.S., A.B. and M.C. contributed to the interpretationof findings; A.C. (Amal Chakraborty) drafted the manuscript. All authors contributed to the revisionof manuscript and approved final version for submission. All authors have read and agreed to thepublished version of the manuscript.

Int. J. Environ. Res. Public Health 2021, 18, 4167 17 of 19
Funding: Funding for Amal Chakraborty was supported by the Australian Government ResearchTraining Program Scholarship. This research was additionally supported by funding from theNational Health and Medical Research Council (NHMRC) Project Grant (GNT1051824) awardedto Mark Daniel. Amal Chakraborty also gratefully acknowledges receiving a University of SouthAustralia School of Health Sciences Conference Scholarship; Konrad Jamrozik Student Scholarship,Public Health Association of Australia, South Australia Branch; and SA State Population HealthStudent Scholarship, Australian Health Promotion Association, South Australia Branch.
Institutional Review Board Statement: Not applicable.
Informed Consent Statement: Not applicable.
Acknowledgments: The authors also thank and gratefully acknowledge Lynette O’Donoghue forproviding Indigenous cultural oversight at the initial stage of framing the research protocol.
Conflicts of Interest: The authors declare no conflict of interest.
References1. Rose, G. Sick individuals and sick populations. Int. J. Epidemiol. 2001, 30, 427–432. [CrossRef] [PubMed]2. Prüss-Üstün, A.; Wolf, J.; Corvalán, C.; Bos, R.; Neira, M. Preventing Disease through Healthy Environments: A Global Assessment of
the Burden of Disease from Environmental Risks; World Health Organization: Geneva, Switzerland, 2016.3. Daniel, M.; Lekkas, P.; Cargo, M. Environments and Cardiometabolic Diseases in Aboriginal Populations. Heart Lung Circ. 2010,
19, 306–315. [CrossRef] [PubMed]4. Daniel, M.; Lekkas, P.; Cargo, M.; Stankov, I.; Brown, A. Environmental Risk Conditions and Pathways to Cardiometabolic
Diseases in Indigenous Populations. Annu. Rev. Public Health 2011, 32, 327–347. [CrossRef] [PubMed]5. United Nations Development Programme. Human Development Report 2015: Work for Human Development; UNDP: New York, NY,
USA, 2015; ISBN 978-92-1-057615-4.6. Anderson, I.; Robson, B.; Connolly, M.; Al-Yaman, F.; Bjertness, E.; King, A.; Tynan, M.; Madden, R.; Bang, A.;
Coimbra, C.E.A.; et al. Indigenous and tribal peoples’ health (The Lancet–Lowitja Institute Global Collaboration): A populationstudy. Lancet 2016, 388, 131–157. [CrossRef]
7. Gracey, M.; King, M. Indigenous health part 1: Determinants and disease patterns. Lancet 2009, 374, 65–75. [CrossRef]8. AIHW. Mortality Inequalities in Australia 2009–2011; Bulletin No. 124; Australian Institute of Health and Welfare: Canberra,
Australia, 2014.9. Zhao, Y.; Dempsey, K. Causes of inequality in life expectancy between Indigenous and non-Indigenous people in the Northern
Territory, 1981–2000: A decomposition analysis. Med. J. Aust. 2006, 184, 490–494. [CrossRef]10. Zhao, Y.; You, J.; Wright, J.; Guthridge, S.L.; Lee, A.H. Health inequity in the Northern Territory, Australia. Int. J. Equity Health
2013, 12, 79. [CrossRef] [PubMed]11. Gibney, K.B.; Cheng, A.C.; Hall, R.; Leder, K. Sociodemographic and geographical inequalities in notifiable infectious diseases in
Australia: A retrospective analysis of 21 years of national disease surveillance data. Lancet Infect. Dis. 2017, 17, 86–97. [CrossRef]12. AHMAC. Aboriginal and Torres Strait Islander Health Performance Framework 2014 Report; Australian Health Ministers’ Advisory
Council: Canberra, Australia, 2015.13. AIHW. Australian Burden of Disease Study: Impact and Causes of Illness and Death in Aboriginal and Torres Strait Islander People
2011; Australian Burden of Disease Study Series No. 6. Cat. No. BOD 7; Australian Institute of Health and Welfare: Canberra,Australia, 2016.
14. Vos, T.; Barker, B.; Begg, S.; Stanley, L.; Lopez, A.D. Burden of disease and injury in Aboriginal and Torres Strait Islander Peoples:The Indigenous health gap. Int. J. Epidemiol. 2008, 38, 470–477. [CrossRef]
15. Marmot, M.; Friel, S.; Bell, R.; Houweling, T.A.J.; Taylor, S.; Commission on Social Determinants of Health. Closing the gap in ageneration: Health equity through action on the social determinants of health. Lancet 2008, 372, 1661–1669. [CrossRef]
16. Raghavan, A.; Demircioglu, M.A.; Taeihagh, A.; Health, P. Public Health Innovation through Cloud Adoption: A ComparativeAnalysis of Drivers and Barriers in Japan, South Korea, and Singapore. Int. J. Environ. Res. Public Health 2021, 18, 334.[CrossRef] [PubMed]
17. Carson, B.; Dunbar, T.; Chenhall, R.D.; Bailie, R. Social Determinants of Indigenous Health; Allen & Unwin: Crow’s Nest, Sydney,Australia, 2007.
18. Øversveen, E.; Eikemo, T.A. Reducing Social Inequalities in Health: Moving from the ‘Causes of the Causes’ to the ‘Causes of theStructures’; Sage Publications: London, UK, 2018.
19. King, M.; Smith, A.; Gracey, M. Indigenous health part 2: The underlying causes of the health gap. Lancet 2009, 374,76–85. [CrossRef]
20. Marmot, M. Social determinants and the health of Indigenous Australians. Med. J. Aust. 2011, 194, 512–513. [CrossRef] [PubMed]21. Bond, C.J.; Singh, D. More than a refresh required for closing the gap of Indigenous health inequality. Med. J. Aust. 2020, 212,
198–199.e1. [CrossRef]

Int. J. Environ. Res. Public Health 2021, 18, 4167 18 of 19
22. AIHW. Towards National Indicators of Safety and Quality in Health Care; Australian Institute of Health and Welfare: Canberra,Australia, 2009.
23. Josif, D. Universal Core Service Framework, Performance Indicators and Workforce Implications; Department of Health: Darwin,Australia, 2011.
24. Productivity Commission. Indigenous Evaluation Strategy (Draft); Australian Government: Canberra, Australia, 2020.25. Harwood, S.; Wensing, E.; Ensign, P.C. Place-Based Planning in Remote Regions: Cape York Peninsula, Australia and Nunavut, Canada:
Remote Human Settlements in Developed Nations; Edward Elgar Publishing: Cheltenham, UK, 2016; p. 124.26. Lane, M.B.; Corbett, T. The Tyranny of localism: Indigenous participation in community-based environmental management. J.
Environ. Policy Plan. 2005, 7, 141–159. [CrossRef]27. Colquhoun, H.L.; Levac, D.; O’Brien, K.K.; Straus, S.; Tricco, A.C.; Perrier, L.; Kastner, M.; Moher, D. Scoping reviews: Time for
clarity in definition, methods, and reporting. J. Clin. Epidemiol. 2014, 67, 1291–1294. [CrossRef] [PubMed]28. Arksey, H.; O’Malley, L. Scoping studies: Towards a methodological framework. Int. J. Soc. Res. Methodol. 2005, 8,
19–32. [CrossRef]29. Peters, M.D.; Godfrey, C.M.; Khalil, H.; McInerney, P.; Parker, D.; Soares, C.B. Guidance for conducting systematic scoping
reviews. Int. J. Evid. Based Health 2015, 13, 141–146. [CrossRef]30. Anderson, S.; Allen, P.; Peckham, S.; Goodwin, N. Asking the right questions: Scoping studies in the commissioning of research
on the organisation and delivery of health services. Health Res. Policy Syst. 2008, 6, 7. [CrossRef]31. Pham, M.T.; Rajic, A.; Greig, J.D.; Sargeant, J.M.; Papadopoulos, A.; McEwen, S.A. A scoping review of scoping reviews:
Advancing the approach and enhancing the consistency. Res. Synth. Methods 2014, 5, 371–385. [CrossRef]32. Hetrick, S.E.; Parker, A.G.; Callahan, P.; Purcell, R. Evidence mapping: Illustrating an emerging methodology to improve
evidence-based practice in youth mental health. J. Eval. Clin. Pr. 2010, 16, 1025–1030. [CrossRef]33. Gentles, S.J.; Lokker, C.; McKibbon, K.A. Health Information Technology to Facilitate Communication Involving Health Care
Providers, Caregivers, and Pediatric Patients: A Scoping Review. J. Med. Internet Res. 2010, 12, e22. [CrossRef] [PubMed]34. Schöpfel, J. Towards a Prague Definition of Grey Literature. Grey J. (TGJ) 2011, 7, 5–18.35. Graham, I.D.; Kothari, A.; McCutcheon, C.; Angus, D. Moving knowledge into action for more effective practice, programmes and
policy: Protocol for a research programme on integrated knowledge translation. Implement. Sci. 2018, 13, 22. [CrossRef] [PubMed]36. Kothari, A.; McCutcheon, C.; Graham, I.D. Defining Integrated Knowledge Translation and Moving Forward: A Response to
Recent Commentaries. Int. J. Health Policy Manag. 2017, 6, 299–300. [CrossRef] [PubMed]37. Department of Health. National Aboriginal and Torres Strait Islander Health Plan 2013–2023; Australian Government: Canberra,
Australia, 2013.38. Levac, D.; Colquhoun, H.; O’Brien, K.K. Scoping studies: Advancing the methodology. Implement. Sci. 2010, 5, 1–9.
[CrossRef] [PubMed]39. Marks, E.; Cargo, M.D.; Daniel, M. Constructing a health and social indicator framework for indigenous community health
research. Soc. Indic. Res. 2006, 82, 93–110. [CrossRef]40. IBM Corp. IBM SPSS Statistics for Windows; Version 21.0; IBM Corp.: Armonk, NY, USA, 2012.41. Tsey, K.; Whiteside, M.; Haswell-Elkins, M.; Bainbridge, R.; Cadet-James, Y.; Wilson, A. Empowerment and Indigenous Australian
health: A synthesis of findings from Family Wellbeing formative research. Health Soc. Care Community 2010, 18, 169–179.[CrossRef] [PubMed]
42. Otim, M.E.; Jayasinha, R.; Kelaher, M.; Houston, E.S.; Anderson, I.P.; Jan, S. Priority setting in Indigenous health: Why we needan explicit decision making approach. Int. Indig. Policy J. 2015, 6, 8. [CrossRef]
43. Chino, M.; Debruyn, L. Building True Capacity: Indigenous Models for Indigenous Communities. Am. J. Public Health 2006, 96,596–599. [CrossRef]
44. Lavarack, G.; Hill, K.; Akenson, L.; Corrie, R. Building capacity towards health leadership in remote Indigenous communities inCape York. Aust. Indig. Health Bull. 2009, 9, 1–11.
45. Le Gal, C.; Dale, M.J.; Cargo, M.; Daniel, M. Built Environments and Cardiometabolic Morbidity and Mortality in RemoteIndigenous Communities in the Northern Territory, Australia. Int. J. Environ. Res. Public Health 2020, 17, 769. [CrossRef] [PubMed]
46. Price Waterhouse Coopers. Indigenous Housing: Findings of the Review of the Community Housing and Infrastructure Programme;Department of Families, Community Services and Indigenous Affairs: Canberra, Australia, 2007.
47. Pholeros, P.; Lea, T.; Rainow, S.; Sowerbutts, T.; Torzillo, P.J. Improving the state of health hardware in Australian Indigenoushousing: Building more houses is not the only answer. Int. J. Circumpolar Health 2013, 72. [CrossRef] [PubMed]
48. Diez Roux, A.V.; Mair, C. Neighborhoods and health. Ann. N. Y. Acad. Sci. 2010, 1186, 125–145. [CrossRef] [PubMed]49. Labonte, R.; Laverack, G. Capacity building in health promotion, Part 1: For whom? And for what purpose? Crit. Public Health
2001, 11, 111–127. [CrossRef]50. Calma, T.; Priday, E. Putting Indigenous Human Rights into Social Work Practice. Aust. Soc. Work. 2011, 64, 147–155. [CrossRef]51. Oetzel, J.; Wallerstein, N.; Solimon, A.; Garcia, B.; Siemon, M.; Adeky, S.; Apachito, G.; Caston, E.; Finster, C.; Belone, L.; et al.
Creating an Instrument to Measure People’s Perception of Community Capacity in American Indian Communities. Health Educ.Behav. 2011, 38, 301–310. [CrossRef] [PubMed]

Int. J. Environ. Res. Public Health 2021, 18, 4167 19 of 19
52. Addison, J. Impact of Climate Change on Health and Wellbeing in Remote Australian Communities: A Review of Literature and Scoping ofAdaptation Options; Report No.: CRC-REP Working Paper CW014; Contract No.: CRC-REP; Working Paper CW014; Ninti OneLimited: Alice Springs, Australia, 2013.
53. Bass, M. Integrated Long-Term Planning: An Information and Resource Manual for Rural-Remote and Indigenous Councils; AustralianCentre of Excellence for Local Government, University of Technology: Sydney, Australia, 2014; ISSN 1838-2525.
54. Pappas, C.; Williams, I. Grey Literature: Its Emerging Importance. J. Hosp. Libr. 2011, 11, 228–234. [CrossRef]55. McGrath, Y.; Sumnall, H.; Edmonds, K.; McVeigh, J.; Bellis, M. Review of Grey Literature on Drug Prevention among Young People;
National Institute for Health and Clinical Excellence: London, UK, 2006.56. Adams, J.; Hillier-Brown, F.C.; Moore, H.J.; Lake, A.A.; Araujo-Soares, V.; White, M.; Summerbell, C. Searching and synthesising
‘grey literature’ and ‘grey information’ in public health: Critical reflections on three case studies. Syst. Rev. 2016, 5, 164.[CrossRef] [PubMed]
57. Waheed, F.; Ferguson, G.M.; Ollson, C.A.; MacLellan, J.I.; McCallum, L.C.; Cole, D.C. Health Impact Assessment of transportationprojects, plans and policies: A scoping review. Environ. Impact Assess. Rev. 2018, 71, 17–25. [CrossRef]
58. Daniel, M.; Cargo, M.; Marks, E.; Paquet, C.; Simmons, D.; Williams, M.; Rowley, K.; O’Dea, K. Rating Health and SocialIndicators for Use with Indigenous Communities: A Tool for Balancing Cultural and Scientific Utility. Soc. Indic. Res. 2008, 94,241–256. [CrossRef]
59. Bainbridge, R.; Tsey, K.; McCalman, J.; Kinchin, I.; Saunders, V.; Lui, F.W.; Cadet-James, Y.; Miller, A.; Lawson, K. No one’sdiscussing the elephant in the room: Contemplating questions of research impact and benefit in Aboriginal and Torres StraitIslander Australian health research. BMC Public Health 2015, 15, 1–10. [CrossRef] [PubMed]
60. Thomas, D.P.; Bainbridge, R.; Tsey, K. Changing discourses in Aboriginal and Torres Strait Islander health research, 1914. Med. J.Aust. 2014, 201, S15–S18. [CrossRef] [PubMed]
61. Kenny, A.; Farmer, J.; Dickson-Swift, V.; Hyett, N. Community participation for rural health: A review of challenges. HealthExpect. 2015, 18, 1906–1917. [CrossRef] [PubMed]
62. Yen, I.H.; Syme, S.L. The Social Environment and Health: A Discussion of the Epidemiologic Literature. Annu. Rev. Public Health1999, 20, 287–308. [CrossRef] [PubMed]