a new approach to measuring cementation factor...
TRANSCRIPT

Iranian Journal of Oil & Gas Science and Technology, Vol. 2 (2013), No. 4, pp. 39-53 http://ijogst.put.ac.ir
A New Approach to Measuring Cementation Factor by Using an Intelligent System
Hamid Heydari1, Jamshid Moghadasi*2, and Reza Motafakkerfard3
1 Department of Reservoir Engineering, Petroleum University of Technology, Abadan, Iran 2 Department of Reservoir Engineering, Petroleum University of Technology, Ahwaz, Iran
3 Department of Exploration Engineering, Petroleum University of Technology, Abadan, Iran
Received: July 19, 2013; revised: October 20, 2013; accepted: November 07, 2013
Abstract
Cementation factor is a critical parameter, which affects water saturation calculation. In carbonate rocks, due to the sensitivity of this parameter to pore type, water saturation estimation has associated with high inaccuracy. Hence developing a reliable mathematical strategy to determine these properties accurately is of crucial importance. To this end, genetic algorithm pattern search is employed to find accurate cementation factor by using formation resistivity factor and the porosity obtained from laboratory core analyses with considering the assumption that tortuosity factor is not unity. Subsequently, particle swarm optimization (PSO) fuzzy inference system (FIS) was used for the classification of cementation factor according to the predominated rock pore type by using the input variables such as cementation factor, porosity, and permeability to classify the core samples in three groups, namely fractured, interparticle, and vuggy pore system. Then, the experimental data which was collected from Sarvak formation located in one of the Iran southwestern oil fields was applied to the proposed model. Next, for each class, a cementation factor-porosity correlation was created and the results were used to calculate cementation factor and water saturation profile for the studied well. The results showed that the constructed model could predict cementation factor with high accuracy. The comparison between the model presented herein and the conventional method demonstrated that the proposed model provided a more accurate result with a mean square error (MSE) of around 0.024 and led to an R2 value of 0.603 in calculating the water saturation.
Keywords: Cementation Factor, Carbonate Reservoir, Genetic Algorithm, Particle Swarm Optimization, Fuzzy Logic
1. Introduction
In order to determine the total hydrocarbon content of oil and gas reservoirs and to characterize reservoir during field-development planning, water saturation (Sw) is known to be a key parameter. The accurate estimation of the Sw is a critical issue in reservoir studies and has almost a high uncertainty especially in carbonate reservoirs. Archie (1942) derived a formula between the porosity and electrical resistivity properties of the formation, which was obtained from well logs and water saturation; the correlation was later modified by Winsauer, et al. (1952) as follows:
* Corresponding Author:
Email: [email protected]

40 Iranian Journal of Oil & Gas Science and Technology, Vol. 2 (2013), No. 4
1
t
nw
w m
aRS
Rϕ
=
(1)
where, Rw and Rt are the resistivity of brine and virgin portion of the formation respectively. Uncertainty analysis offers that m has a high impact on Sw calculation compared to the other parameters (Hamada et al., 2013). The conventional method to measure the parameter m is the slope calculation of the best straight line fitting the log-log plot of formation resistivity factor (FRF) vs. porosity (Archie, 1942). In the forced fitting method, it is assumed that the tortuosity factor is constant and equal to one, while the best fit method (in which the tortuosity factor is variable) gives more realistic values of water saturation (Hassanzadeh, et al. 2008). For carbonate rocks, due to complexity and heterogeneity in pore geometry and also owing to the existence of fractures and vugs, m may vary over a wide range related to the rock properties. The determination of m from core samples for the whole depth of borehole in core laboratory is known as a very tedious and expensive process. To this end, as reported in literature, many authors have worked on obtaining substitute methods for estimating it (Mute et al., 1992; Saha and Asquith, 1993; Hamada and Assal, 1996). Many researchers (e.g. Borai, 1987; Lucia, 1999; Ragland, 2002) have corroborated that m is altered by changing the amount of porosity and can be considered to be a function of it. Therefore, they established some equations between m and φ which was obtained from porosity logs. In all of these equations, the authors posited that the tortuosity factor was one (force fitting). Towel (1962) concluded that m is sensitive to the shape of the pores and interconnection between them. Therefore, the variety of pore type could have a high effect on cementation factor (Focke and Munn, 1987). Therefore, it is really required to group data to recognize the pattern of variations of cementation factor value. Data mining is a set of intelligent techniques and machine learning tools to discover the pattern that is hidden through the available data set. In this study, a genetic algorithm method is employed to construct a precise m predictor, and afterward, a particle swarm optimization fuzzy system as a data mining tool could be employed for the clustering analysis of data to cluster data based on similar properties linked them together.
2. Genetic algorithm
Genetic algorithm was first described by John Holand (1970) as an optimization technique based on a parallel search using Darwin’s theory of evolution. Darwin believed that the survival of organisms depended on their compatibility (fitness) with the environment, in a way that the probability of survival increases by increasing the degree of compatibility. In GA, a population of individuals consists of a set of candidate solutions to a problem to be evaluated, and is created randomly by a uniform probability distribution function. In each generation, after some individuals were selected as parents based on their fitness degree for mating and then spawning, offspring are merged, evaluated by fitness function, sorted, and then selected to generate a new population. Crossover and mutation processes are operators of GA. Crossover plays a role of reproduction and transforms the chromosomes (characteristics) to offspring, and mutation is employed to make random change in the chromosomes of the parent. The goal of crossover and mutation processes in every generation is the creation of a better solution set compared with the previous one. This loop is continued until some stopping criteria of algorithm such as maximum number of allowed iterations is satisfied. Pc and Pm are respectively the probability of crossover and mutation which could determine how many individuals should be selected for crossover and mutation processes. There are a lot of selection
H. Heydari et al. / A New Approach to Measuring Cementation Factor … 41
methods such as roulette wheel selection method. In this method, the potential selection of each individual is directly related to its fitness. Another widely used selection method is tournament selection. In this method, an individual is selected as a parent by choosing the best individuals from a subgroup of individuals. For the selection of k individuals, k subgroup must be selected randomly (Sivaraj et al., 2011). In this work, three types of selection method, namely roulette wheel selection, tournament selection, and random selection were used to select parents. Since the genetic algorithm is an accelerated search of the feasible solution space, defining some constrains can improve the behavior of the technique by limiting the space to be searched. Two runs with different random initial populations will generally produce different detailed behavior; this is because of the random generation of the initial population. A hybrid function is a function to improve GA’s results and is used after the GA run to minimize error function. The hybrid function uses the best solution of GA in the final iteration as a start point for minimization. fmincon function of Mathworks Matlab software package, which is a constrained nonlinear programming multivariable function and starts at an initial estimate, was used as a minimization function in this study. The values of the upper and lower limits of variables in fmincon are similar to the constraints introduced in GA.
3. Particle swarm optimization
Particle swarm optimization (PSO), as an evolutionary optimization technique, was first introduced by Kennedy and Eberhart (1995). The PSO idea was taken from the social behavior of bird flocking and fish schooling. In the description of PSO algorithm, the swarm is made up of some candidate solutions called particles, which move in the search space of an optimization problem called objective function to reach the best solution. Generally, the objective function maps the search space to problem space. Swarm size is a user-defined parameter which depends on problem and is generally kept in 20 and 50 (Eberhart, 1995). First, it starts by generating random position and velocity for a certain number of particles. In the main loop of PSO, for any iteration, each particle searches for better positions in the D-dimensional search space by fine-tuning its velocity according to rules originally stimulated from social interaction behavior of birds and fishes until a stopping criterion such as maximum iteration occurs. At any iteration, all particles move to find the global optimal solution. In these systems, particles are independent of each other and their movements are governed by a set of rules. Compared with other optimization methods, PSO has a superior search performance in many hard optimization problems with faster and stabler convergence rates (Ling, et al. 2011). The velocity and position of particle can be updated using the current velocity and the distance from personal experience (pbest) to the best experience of the whole group (gbest) location as follows:
( ) ( )11 1 2 2(0,1)k k k k
id id id id idV V c rand pbest x c rand gbest xω+ = + − + − (2) 1 1k k k
id id idx x V+ += + (3)
The basic concept of PSO lies in accelerating of particles to pbest and gbest location by random weighted acceleration c1 (cognitive acceleration) and c2 (social acceleration) that pull particles towards pbest and gbest position at each iteration. c1 and c2 affect the convergence speed of PSO and, also, can effectively avoid the occurrence of premature phenomenon (Huang, 2013). The amount of velocity is very critical to finding the global optimum. ω is a parameter called inertia weight which is used to control the impact of the previous velocities on the current one (Shi and Eberhart, 1998). The suitable selection of ω provides a balance between global exploration, and local exploration reduces the total number of iterations (Khare et al., 2013).
The inertia weighting function is usually utilized in velocity update and is given by:

42 Iranian Journal of Oil & Gas Science and Technology, Vol. 2 (2013), No. 4
( )max
Max Min
Maxiter
iterω ωω ω
− × = − (4)
where, ωMin and ωMax are the initial and final weight respectively. These parameters are defined by the user ahead of run.
4. Particle swarm optimization fuzzy logic system
Fuzzy logic is a logic system which uses fuzziness and assigns objects into fuzzy sets which are labeled by linguistic variables. The meaning of fuzzy set was first introduced by Zadeh (1965) as a class of objects with continuum grades of membership function. Such a set is characterized by a membership function, which assigns a grade of membership ranging between zero and one to each objective. Fuzzy inference system (FIS) is an intelligent system used to map an input to an output by using fuzzy logic. FIS is introduced by creating a set of rules which include logical operators (AND, OR, and NOT), and the membership functions are introduced by human experts. Rules are the heart of fuzzy logic system and can be expressed as linguistic conditional sentences, namely IF-THEN, where IF-part of the rules is called antecedent, and the THEN-part of the rules is called consequent. The general form of fuzzy rule is as “IF X is A THEN Y is B”, where A and B are the set of propositions containing linguistic variables such as low, medium, and high. The FIS consists of three sequential stages: fuzzification, engine inference, and defuzzificaion. Briefly, an engine inference is made based on a set of rules and combines them to give a mapping from the input set to the output set. Fuzzification is an operator which assigns a degree of membership into a member of fuzzy set, while defuzzificaion converts the fuzzy output determined by the inference engine to the crisp value. Two more applicable and famous types of FIS are Mamdani (Mamdani and Assilian, 1975) and Takagi-Sugeno (1985). A major different between those methods is the output type. In a Mamdani FIS, the output is expressed by a set of MF’s, while in a Takagi-Sugeno, FIS is introduced by a linear relation. Mamdani FIS is the most commonly successful fuzzy methodology in industry and is extensively employed for clustering multi-variable data set. The determination of the best fitting MF’s makes significant impacts on the final performance of FIS. It is not usually easy to derive exact MF properties for a FIS variable; hence many approaches such as GA (Cordon et al., 2001; Zhang et al., 2009) and PSO (Allauoa et al., 2008; Turanoglu et al., 2011; Omizegba and Adebayo, 2009) have recently been proposed to tune MF’s automatically from the training patterns of the classification problem (Chen, 2006; Elragal, 2010; Demirkol, 2005). Particle swarm optimization has better computational efficiency, because it needs less memory space and CPU performance and has a fewer number of parameters to adjust (Khare, 2013). In this paper, a PSO algorithm was used for the optimization of fuzzy model performance to obtain the optimal adjustment of the membership function from the available data. PSO is used to obtain the properties of MF’s of a multi-input single output (MISO) system with n number of inputs in which all rules are defined by human expert. The goal of this algorithm is to find a high quality fuzzy to predict the class of input parent correctly. For model formulation, we made some assumptions. First, the number of inputs and outputs of MF’s were fixed; Gaussian and two-side Gaussian combination functions were used to represent vague, linguistic terms of variables. Gaussian function is given by:
( )2
2( ) exp
2i
Aii
c xxµ
σ − = −
(5)
Gaussian curve does not have an asymmetric property; therefore, a composite of the two different Gaussian curves is used. The first function determines the shape of the left-most curve and the second determines its right-most curve. Both of this membership functions have the advantage of being

H. Heydari et al. / A New Approach to Measuring Cementation Factor … 43
smooth and nonzero at all points. The parameters of a Gaussian function and two-sided Gaussian combination function are considered as particles of PSO and searching for the global best solution (gbest). A Gaussian MF is represented by two parameters (c and σ) and a two-sided Gaussian MF is identified by four parameters (c1, c2, σ1, and σ2). The second assumption is that the complete rule base is considered and created in FIS. This means that all the possible relation between inputs and outputs are formed by the combination of their MF’s. Moreover, all the shapes of MF’s are previously determined to be Gaussian or two-sided Gaussian MF. The particle dimensions represent fuzzy membership function parameter number (Khosala et al., 2006). For each variable of FIS with three linguistic levels (low, medium, and high), two Gaussian MF’s were assumed to be first (low) and last (high) MF, and a two-sided Gaussian combination was applied as the middle MF (medium) (Figure 1). The number of all the parameters of MF’s which are supposed to be optimized by PSO will be 7. Each particle in PSO first gives a random position and velocity in a 7-dimension search space, and then, by using the relationship introduced in the previous section, the particle tries to find the best solution. To evaluate the potential of a particle to determine its ability to find the best solution, an objective function must be defined. The defined fitness function of the model calculates the MSE of the FIS model represented by each particle of swarm after every iteration. The purpose of the proposed PSO model is to approach the total MSE to zero as close as possible. To begin searching in the search space to find the best solution, some random locations and velocities for particles equaling the number of swarm size should be generated. It is of significant importance to control the particles to be confined to search-space and a feasible solution. Furthermore, it is required to ensure that the MF parameters for all the variables (the inputs and the outputs) could satisfy the constraints (Khosala et al., 2006).
Figure 1 Membership functions of variables and the parameters of FIS which should be optimized.
5. Case study
The Sarvak formation, as a member of Bangestan group located in the Southwest of Iran, is a main upper Cretaceous (upper Albian to upper Turonian) oil-bearing carbonate. Sarvak is generally composed of limestone that is partially dolomitized. Since gamma ray log reveal negligible values in this formation, the effect of shale on reservoir evaluation can be eliminated. The whole depth of Sarvak formation on the basis of petrography and depositional environment is divided into 7 subzones. Three subzones (zone 1, 2, and 3) are classified as oil zones. Zone 1 consisting of porous pelletoidal grainstone and packstone with fine- to medium- grained foraminifera has the highest
44 Iranian Journal of Oil & Gas Science and Technology, Vol. 2 (2013), No. 4
production rate (Masoudi et al., 2012). In some intervals of this zone, fracture and vuggy porosity could be observed. In the bottom of zone 1 and the top of zone 2, evidence shows good extension of isolated vugs. Zone 2 mostly contains dense packstone-grainstone which is strongly cemented especially in the bottom intervals. Moreover, zone 3 has a good reservoir and is mostly formed of wackestone-packstone and locally grainstone.
5.1. Data preparation
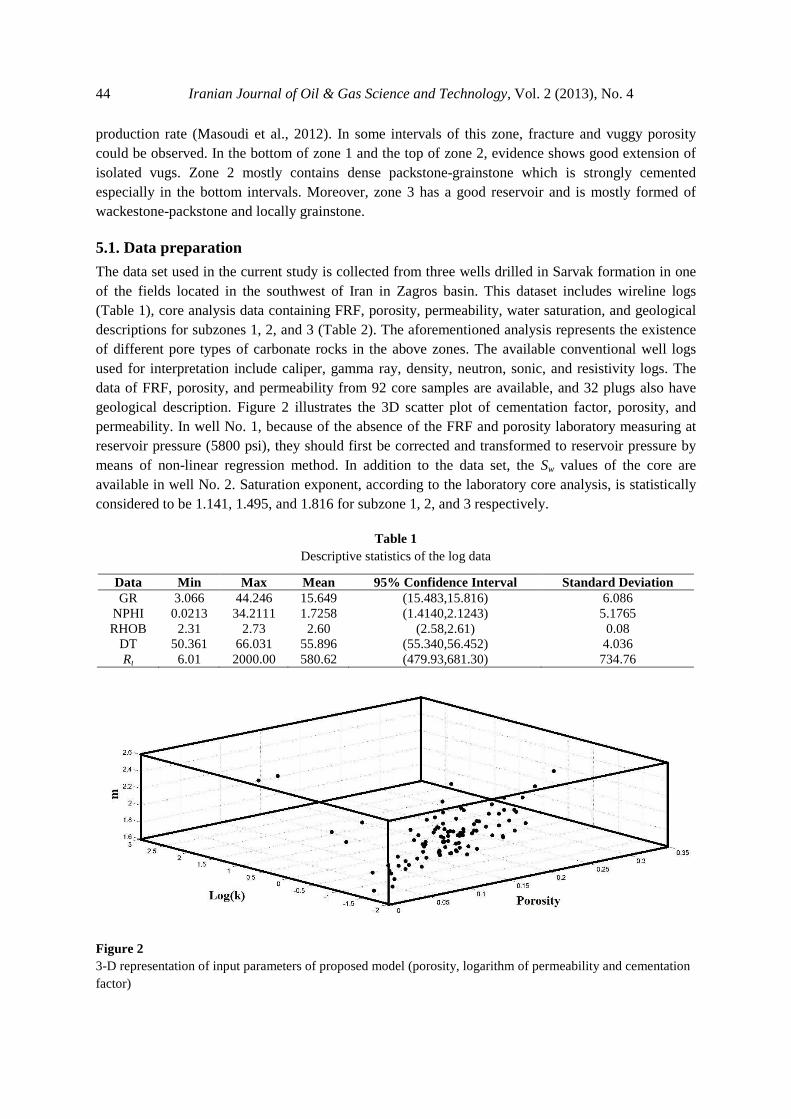
The data set used in the current study is collected from three wells drilled in Sarvak formation in one of the fields located in the southwest of Iran in Zagros basin. This dataset includes wireline logs (Table 1), core analysis data containing FRF, porosity, permeability, water saturation, and geological descriptions for subzones 1, 2, and 3 (Table 2). The aforementioned analysis represents the existence of different pore types of carbonate rocks in the above zones. The available conventional well logs used for interpretation include caliper, gamma ray, density, neutron, sonic, and resistivity logs. The data of FRF, porosity, and permeability from 92 core samples are available, and 32 plugs also have geological description. Figure 2 illustrates the 3D scatter plot of cementation factor, porosity, and permeability. In well No. 1, because of the absence of the FRF and porosity laboratory measuring at reservoir pressure (5800 psi), they should first be corrected and transformed to reservoir pressure by means of non-linear regression method. In addition to the data set, the Sw values of the core are available in well No. 2. Saturation exponent, according to the laboratory core analysis, is statistically considered to be 1.141, 1.495, and 1.816 for subzone 1, 2, and 3 respectively.
Table 1 Descriptive statistics of the log data
Data Min Max Mean 95% Confidence Interval Standard Deviation GR 3.066 44.246 15.649 (15.483,15.816) 6.086
NPHI 0.0213 34.2111 1.7258 (1.4140,2.1243) 5.1765 RHOB 2.31 2.73 2.60 (2.58,2.61) 0.08
DT 50.361 66.031 55.896 (55.340,56.452) 4.036 Rt 6.01 2000.00 580.62 (479.93,681.30) 734.76
Figure 2 3-D representation of input parameters of proposed model (porosity, logarithm of permeability and cementation factor)

H. Heydari et al. / A New Approach to Measuring Cementation Factor … 45
Table 2 Statistical description of the core data
Data Data No. Min Max Mean 95% Confidence Interval Standard Deviation FRF 92 27.177 947.8428 90.9581 (78.1018,107.2307) 252.2534 φ 92 0.0164 0.2660 0.1179 (0.1086,0.1273) 0.0485
k 92 0.0213 34.2111 1.7258 (1.4140,2.1243) 5.1765
Sw 203 0.037 0.605 0.158 (0.144,0.171) 0.096
n 17 0.81 3.12 1.3518 (1.2402,1.4634) 0.8146
6. Modeling, results and discussion
In this work, GA was first used for minimizing least square error (LSE) to calculate the best value of m as the desired variable with the assumption that a is not unity. According to definition of LSE, the objective function can read:
2
1i
ni
imi i
aObjFun FRF
ϕ=
= −
∑ (6)
where, i is core sample index, and φ and FRF have been measured from the core analysis. The parameters used for the genetic algorithm is described in Table 3.
Table 3 GA and PSO algorithm parameters
Parameters of GA Value Parameter of PSO Value
Variable number 2 Dimension of variables 25
Population size 50 Swarm size 30
Maximum iteration 150 Iteration 500
Crossover percentage (pc) 0.6 Cognitive acceleration 1
Mutation percentage (pm) 0.2 Social acceleration 3
Mutation rate 0.03 Initially velocity weight 0.95
Hybrid function Fmincon Finally velocity weight 0.4
Selection pressure parameter 8 Maximum velocity step 100
The GA optimization of LS is performed by three selection methods, namely roulette wheel, tournament, and random selections. The best solution according to the lowest value of error function (LSE) is considered as the output of the model. Figure 3 depicts the variation of the best solution for each iteration for sample IV from well No. 1; it shows how individuals find the global minimum in the search space. At the end, when the gradient of fmincon remains unchanged, the algorithm stops and the results are the best optimized value of m and a. It is seen that the tournament selection method has a good performance compared to the two other methods. The results show that the genetic algorithm is able to predict a and m with an error of around 5.08768×10⁻¹³ (LSE). The mean and the standard deviation of tortuosity factor are respectively 1.0074 and 0.0225 for all the data samples and the 95% confidence level for mean is between 1.0023 and 1.0125. This value is very close to one, and it does not lead to inexactitude if one assumes a is equal to one for carbonate rocks.

46 Iranian Journal of Oil & Gas Science and Technology, Vol. 2 (2013), No. 4
Figure 3 Best position of individuals during iterations
The statistical description of cementation factor demonstrates a bi- or multi-modal distribution as shown in Figure 4. A multimodal distribution most commonly arises as a mixture of several different unimodal distributions, and it can be better described by two or more unimodal distributions. Without the classification of m data to a unimodal distribution, it is impossible to recognize the pattern of the variation of this parameter. Figure 5 is a cross plot of cementation factor versus porosity showing that there is not a visible relationship between the m and φ.
Figure 4 Histogram of cementation factor for all the data set
Figure 5 Scatter plot cementation factor vs. porosity for all the data point

H. Heydari et al. / A New Approach to Measuring Cementation Factor … 47
By using the permeability, porosity, and cementation factor of the core data, a classifier was created for clustering the samples into three certain groups: fractured with good pore connection, inerparticle with mediate pore connection, and vuggy with a poor connection between pores. By using a PSO-FIS, a classifier system was made for cementation factor classification. For this purpose, a Mamdani FIS was constructed with three variables k, φ, and m as the inputs and an output called the degree of connectivity between pores, which identifies the pore-type of the samples. In this system, 32 core samples, which had geological description, were taken as the training data. The initial MF parameters of the inputs and output before optimization were generated by a uniform random function. All the MF’s were Gaussian and two-sided Gaussian type, and the dimension of each particle in the PSO was set to 25. The rule base of FIS is as follows:
1. IF (m is low), and (φ is low), and (k is medium), THEN (pore-type) is fractured. 2. IF (m is low), and (φ is low), and (k is high), THEN (pore-type) is fractured. 3. IF (m is low), and (φ is high), and (k is high), THEN (pore-type) is fractured. 4. IF (m is medium), and (φ is medium), and (k is medium), THEN (pore-type) is inerparticle. 5. IF (m is medium), and (φ is medium), and (k is high), THEN (pore-type) is interparticle. 6. IF (m is medium), and (φ is medium), and (k is low), THEN (pore-type) is interparticle. 7. IF (m is high), and (φ is medium), and (k is low), THEN (pore-type) is vuggy. 8. IF (m is high), and (φ is medium), and (k is low), THEN (pore-type) is vuggy. 9. IF (m is high), and (φ is high), and (k is low), THEN (pore-type) is vuggy. 10. IF (m is high), and (φ is high), and (k is medium), THEN (pore-type) is vuggy.
To evaluate the merit of each fuzzy controller, the mean square error (MSE) of target and output is used as the performance criteria. The details of PSO algorithm for creating MF parameters of the three variables m, φ, and k and the output variables are given in Table 3. When the number of iteration reaches the defined maximum iteration (500), the algorithm stops. After the stopping criterion is satisfied, the MF’s is properly tuned to minimized control error. Figure 6 presents the best possible MF’s of both inputs and output variables.
Figure 6 (a) Cementation factor, (b) porosity, (c) permeability, and (d) pore-type MF’s tuned after optimization by PSO algorithm

48 Iranian Journal of Oil & Gas Science and Technology, Vol. 2 (2013), No. 4
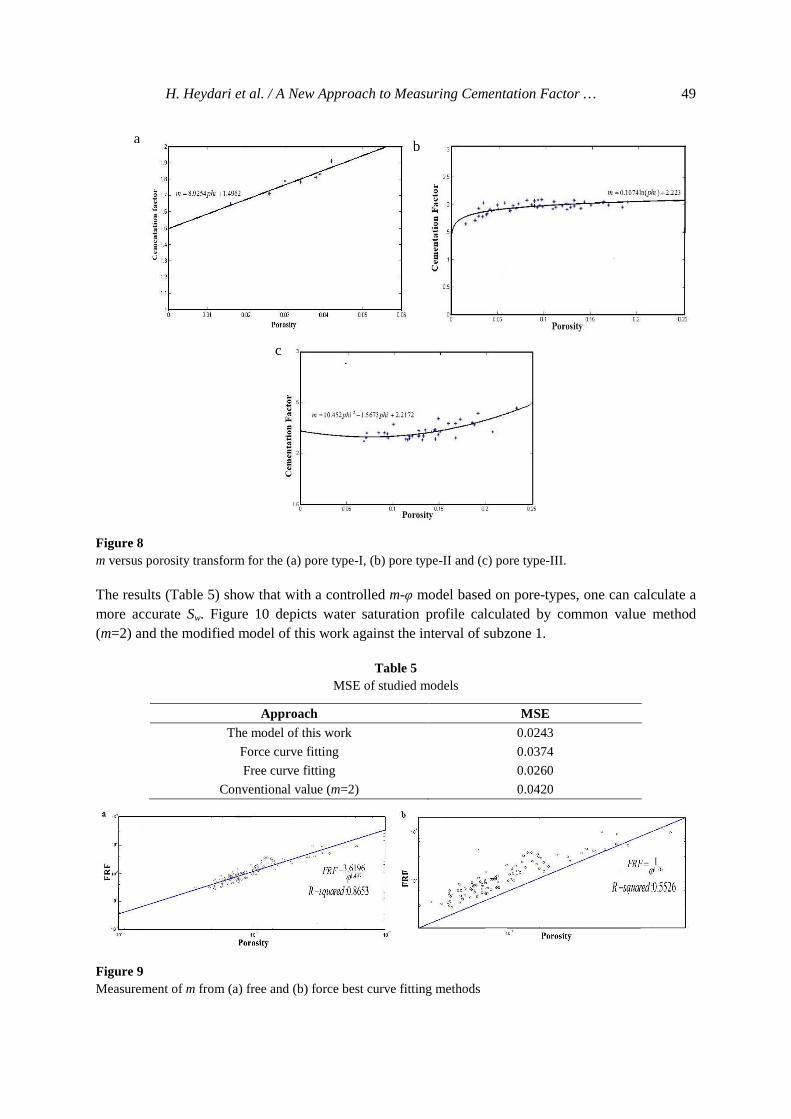
When FIS is made by PSO, all the data points containing three parameters m, φ, and k imported to the model were classified to the three classes, namely fractured, interconnected, and vuggy. Table 4 shows the statistical reviews of the three classes, and the histograms of their m values are plotted separately in Figure 7. A good correlation between the cementation factor and the porosity of these classes is observed and an m-φ transform could be established by curve fitting with the highest R2 (Figure 8). Therefore, at each depth, for any types of porosity, m can be calculated by the porosity estimated from neutron, density, and sonic log data. For type I, a linear trend is observed, but, because the available sampled cores are collected from low porosity intervals, this linear relation between the m and φ is not applicable to fractured intervals with high porosity values (higher than 0.05%); its mean is used for low porosity intervals, in which fractures are deployed, and for high porosity zones. The proposed models for estimating cementation factor for fracture, interparticle, and vuggy pore-types are given in Equations 7, 8 and 9 respectively. Fracture pore-system 8.9254 1.4962m ϕ= + (7) Interparticle pore-system 0.1074ln( ) 2.223m ϕ= + (8) Vuggy pore-system 210.452 1.5673 2.2172m ϕ ϕ= − + (9) According to available geologically description and pore-type classification of well No. 2, zone 1 is subdivided into 7 subzones, zone 2 is subdivided into two subzones, and zone 3 is subdivided into three subzones. For the estimation of Sw of well No 2, m is calculated from the suitable modified model. For best curve fitting method, two approaches, namely force fitting (a=1) and free fitting (a≠1), are used to calculate m by plotting FRF and porosity in a log-log plot as shown in Figure 9. By the curve fitting toolbox of Mathworks Matlab 7, R2 for free and forced method is respectively 0.8653 and 0.5526, but the MSE of Sw for the free approach is as low as that of the forced approach as presented in Table 5.
Figure 7 Histogram of cementation factor for (a) type I, (b) type II, and (c) type III
H. Heydari et al. / A New Approach to Measuring Cementation Factor … 49
Figure 8 m versus porosity transform for the (a) pore type-I, (b) pore type-II and (c) pore type-III.
The results (Table 5) show that with a controlled m-φ model based on pore-types, one can calculate a more accurate Sw. Figure 10 depicts water saturation profile calculated by common value method (m=2) and the modified model of this work against the interval of subzone 1.
Table 5 MSE of studied models
Approach MSE
The model of this work 0.0243
Force curve fitting 0.0374
Free curve fitting 0.0260
Conventional value (m=2) 0.0420
Figure 9 Measurement of m from (a) free and (b) force best curve fitting methods
a b
c

50 Iranian Journal of Oil & Gas Science and Technology, Vol. 2 (2013), No. 4
Figure 10 Water saturation profile for zone 2

H. Heydari et al. / A New Approach to Measuring Cementation Factor … 51
6. Conclusions
The results demonstrate the successful application of intelligence systems to predicting cementation factor from porosity obtained from wireline logs in carbonate formations based on the type of pore-system. The use of intelligent systems including parallel search algorithms and fuzzy logic for predicting m has many advantages over the conventional methods used in the industry. An exact estimation of m improves the accuracy of the quantitative estimation of water saturation. Using a stochastic optimization algorithm like GA is recommended for obtaining the m values from FRF core analysis data with the assumption that the tortuosity factor is not constant in carbonates. Since the cementation factor is affected by changing the porosity systems in carbonate rocks, it is necessary to distinguish m values based on their pore types. Therefore, three different porosity types, by employing a supervised classification approach (PSO-Mamdani FIS), have been identified to be applied to the Sarvak formation in one of the Iran southwestern oil fields; a model was also established for any porosity classes. The comparison between the predicted and measured core water saturations demonstrates a significant improvement over using a single m value for carbonate reservoirs.
Nomenclature
a Tortuosity factor FIS Fuzzy inference system FRF Formation resistivity factor GA Genetic algorithm k Permeability LS Least square m Cementation factor MF Membership function MSE Mean square error PSO Particle swarm optimization Sw Water saturation Greek Symbols φ Porosity
Acknowledgments
The authors would like to thank the Nationality Iranian South Oil Company (NISOC) for providing us with the core analysis reports and well logging data and giving the permission to publish the data.
References
Allaoua, B., Adberrahmani, A., Gasbaoui, B., and Nasri, A., The Efficiency of Particle Swarm Optimization Applied on Fuzzy Logic DC Motor Speed Control, Serbian Journal of Electrical Engineering, Vol. 5, No. 2, November, p. 247-262, 2008.
Archie, G. E., The Electrical Resistivity Log as an Aid in Determining Some Reservoir Characteristics, Transactions of AIME 146, p. 54-62, 1941.
Borai, A. M., A New Correlation for the Cementation Factor in Low-porosity Carbonates, SPE Formation Evaluation, p. 495-499, 1987.
Chen, Ch., Design of PSO-based Fuzzy Classification Systems, Tamkang Journal of Science and Engineering, Vol. 9, No. 1, p. 63-70, 2006.
Cordon, O., Herrera, F., Hoffman. F., and Magdalena, L., Genetic Fuzzy Systems, World Scientific, 2001.

52 Iranian Journal of Oil & Gas Science and Technology, Vol. 2 (2013), No. 4
Demirkol, A., Demir, Z., and Emre, E., A New Classification Approach Using Discriminant Functions, Information Science and Engineering Vol. 21, p. 819-828, 2005.
Doveton. J. H., Basic of Oil and Gas Log Analysis, Kansas Geological Survey, 1999. Dullien, F. A. L., Porous Media, Fluid Transport and Pore Structure, Academic Press, 1992. Eberhart, R., A New Optimizer Using Particle Swarm Theory, Sixth International Symposium on
Micro Machine and Human Science, IEEE, p. 39-44, 1995. Elargal, H. M., Using Swarm Intelligence for Improving Accuracy of Fuzzy Classifiers, International
Journal of Electrical and Computer Engineering, Vol. 5, No. 2, p. 105-112, 2010. Focke, J. W., Cementation Exponent in Middle Eastern Carbonate Reservoirs, SPE Formation
Evaluation, p. 155-167, June, 1987. Hamada, G. M., Almajed. A. A., and Okasha, T. M., Uncertainty Analysis of Archie’s Parameters
Determination Techniques in Carbonate Reservoirs, J Petrol Prod Technol, Vol. 3, p. 1-10, 2013.
Hamada, G. M. and Assal, A. M., Improved Technique to Determine Archie’s Parameters and Consequent Impact on the Exactness of Hydrocarbon Saturation Values, SCA Conference Paper Number 9623, 1996.
Hassani-giv, M. and Rahimi, M., New Correlations for Porosity Exponent in Carbonate Reservoirs of Oil Fields in Zagros Basin, JUST, Vol. 34, No. 2, p. 1-7, 2008.
Hassanzadeh, J., Javaherian, A., Pishvaie, M. R., and Nabi-Bidhendi, M., An Approach to Defining Tortuosity and Cementation Factor in Carbonate Reservoir Rocks, Journal of Petroleum Science and Engineering, Vol. 60, p. 125-131, 2008.
Huang, Z., A Fast Quantum-behaved Particle Swarm Optimization Based on Accelerating Factor, Journal of Theoretical and Applied Information Technology, Vol.48, No.2, p.1109-1114, 2013.
Khare, A. and Rangnekar, S., A Review of Particle Swarm Optimization and its Applications in Solar Photovolatic System, Applied Soft Computing, Vol. 13, p. 2997-3006, 2013.
Khosla, A., Kumar, Sh., Aggrwal, K. K., and Singh, J., Design Optimization Models through Particle Swarm Optimization, Integrated Intelligence System for Engineering Design, p.43-62, 2006.
Ling, S. H., Jiang, F., Nguyen, H. T., and Chan, K. Y., Hybrid Fuzzy Logic-based Particle Swarm Optimization for Flow Shop Scheduling Problem, International Journal of computational Intelligence and Application, Vol. 10, No. 3, p. 335-3356, 2011.
Lucia. J., Rock-fabric/Petrophysical Classification of Carbonate Pore Space for Reservoir Characterization, APPG Bulletin, Vol. 79, No. 9, p. 1275-1300, 1995.
Lucia. J., Carbonate Reservoir Characterization. p. 266, 1999. Mamdani, E. H. and Assilian, S., An Experiment in Linguistic Synthesis with a Fuzzy Logic
Controller, International Journal of Man-machine Studies, Vol. 7, No. 1, p. 1-13, 1975. Masoudi, P., Tokhmechi, B., Bashari, A., and Jafari, M. A., Identifying Production Zones of the
Sarvak Formation by Integrating Outputs of Different Classification Methods, Journal of Geophysics and Engineering Vol.9, p. 282-290, 2012.
Maute, R. E., Lyle, W. D., and Eve, S., Improved Data-analysis Method Determines Archie Parameters from Core Data. JPT, January, p. 103-107, 1992.
Omizegba, E. E. and Adebayo, G. E., Optimizing Fuzzy Membership Functions Using Particle Swarm Optimization, IEEE International Conference on Systems, Man and Cybernetics, p.3866-3870, 2009.
Padhy, G. S., Ioannidis, M. A., Lamaire, C., and Coniglio, M., Measurement and Interpretation of Non-Archie Resistivity Behavior in Model and Real Vuggy Carbonate, Proceedings of the Annual Symposium of the Society of Core Analysts, SCA2006-11, Trondheim, Norway, 2006.

H. Heydari et al. / A New Approach to Measuring Cementation Factor … 53
Ragland, D. A., Trends in Cementation Exponents (m) for Carbonate Pore Systems, Petrophysics. Vol. 43, p. 434-446, 2002.
Saha, S. and Asquith, G. B., A New Approach to Estimating Sw in Carbonate Reservoirs, The Log Analysis, p. 20-25, May, 1993.
Shi, Y. and Eberhart, R. C., Parameter Selection in Particle Swarm Optimization, Proceeding of 7th International Conference on Computation Programming, 1998.
Sivaraj, R., A Review of Selection Methods in Genetic Algorithm, International Journal of Engineering Science and Technology (IJEST), Vol. 3 No. 5, p. 3792-3797, 2011.
Towel, G., An Analysis of the Formation Resistivity Factor-porosity Relationship of Some Assumed Pore Geometries, Proceeding of the 3rd Annual Logging Symposium Transactions, SPWLA, 1962.
Turanoglu, E., Ozceylan, E., and Kiran, M. S., Particle Swarm Optimization and Artificial Bee Colony Approaches to Optimize of Single Input-output Membership Functions, Proceeding of the 41st International Conference on Computers and Industrial Engineering, p. 254-257, 2011.
Winsauer, W. O. et al., Resistivity of Brine-saturated Sands in Relation to Pore Geometry, AAPG Bulletin Vol. 36, No. 2, p.253-77, 1952.
Zadeh. L. A., Fuzzy Sets, Information and Controls, Vol. 8, p. 338-353, 1965. Zhang, H. X., Wang, F., and Zhang, B., Genetic Optimization of Fuzzy Membership Functions,
Proceedings of the International Conference on Wavelet Analysis and Pattern Recognition, p. 465-470, 2009.