a new approach to bioaerosol monitoring in ireland new approach to... · the implementation of...
TRANSCRIPT

A New Approach to Bioaerosol Monitoring in Ireland
Climate Change Research Programme (CCRP) 2007-2013Report Series No. 18
Environment, Community and Local GovernmentComhshaol, Pobal agus Rialtas Áitiúil

Environmental Protection Agency
The Environmental Protection Agency (EPA) isa statutory body responsible for protectingthe environment in Ireland. We regulate andpolice activities that might otherwise causepollution. We ensure there is solidinformation on environmental trends so thatnecessary actions are taken. Our priorities areprotecting the Irish environment andensuring that development is sustainable.
The EPA is an independent public bodyestablished in July 1993 under theEnvironmental Protection Agency Act, 1992.Its sponsor in Government is the Departmentof the Environment, Community and LocalGovernment.
OUR RESPONSIBILITIESLICENSING
We license the following to ensure that their emissionsdo not endanger human health or harm the environment:
n waste facilities (e.g., landfills, incinerators,waste transfer stations);
n large scale industrial activities (e.g., pharmaceuticalmanufacturing, cement manufacturing, powerplants);
n intensive agriculture;
n the contained use and controlled release ofGenetically Modified Organisms (GMOs);
n large petrol storage facilities;
n waste water discharges.
NATIONAL ENVIRONMENTAL ENFORCEMENT
n Conducting over 2,000 audits and inspections ofEPA licensed facilities every year.
n Overseeing local authorities’ environmentalprotection responsibilities in the areas of - air,noise, waste, waste-water and water quality.
n Working with local authorities and the Gardaí tostamp out illegal waste activity by co-ordinating anational enforcement network, targeting offenders,conducting investigations and overseeingremediation.
n Prosecuting those who flout environmental law anddamage the environment as a result of their actions.
MONITORING, ANALYSING AND REPORTING ON THEENVIRONMENT
n Monitoring air quality and the quality of rivers,lakes, tidal waters and ground waters; measuringwater levels and river flows.
n Independent reporting to inform decision making bynational and local government.
REGULATING IRELAND’S GREENHOUSE GAS EMISSIONS
n Quantifying Ireland’s emissions of greenhouse gasesin the context of our Kyoto commitments.
n Implementing the Emissions Trading Directive,involving over 100 companies who are majorgenerators of carbon dioxide in Ireland.
ENVIRONMENTAL RESEARCH AND DEVELOPMENT
n Co-ordinating research on environmental issues(including air and water quality, climate change,biodiversity, environmental technologies).
STRATEGIC ENVIRONMENTAL ASSESSMENT
n Assessing the impact of plans and programmes onthe Irish environment (such as waste managementand development plans).
ENVIRONMENTAL PLANNING, EDUCATION ANDGUIDANCE n Providing guidance to the public and to industry on
various environmental topics (including licenceapplications, waste prevention and environmentalregulations).
n Generating greater environmental awareness(through environmental television programmes andprimary and secondary schools’ resource packs).
PROACTIVE WASTE MANAGEMENT
n Promoting waste prevention and minimisationprojects through the co-ordination of the NationalWaste Prevention Programme, including input intothe implementation of Producer ResponsibilityInitiatives.
n Enforcing Regulations such as Waste Electrical andElectronic Equipment (WEEE) and Restriction ofHazardous Substances (RoHS) and substances thatdeplete the ozone layer.
n Developing a National Hazardous Waste ManagementPlan to prevent and manage hazardous waste.
MANAGEMENT AND STRUCTURE OF THE EPA
The organisation is managed by a full time Board,consisting of a Director General and four Directors.
The work of the EPA is carried out across four offices:
n Office of Climate, Licensing and Resource Use
n Office of Environmental Enforcement
n Office of Environmental Assessment
n Office of Communications and Corporate Services
The EPA is assisted by an Advisory Committee of twelvemembers who meet several times a year to discussissues of concern and offer advice to the Board.
EPA Inside Pages NEW_Blue Text 31/08/2011 15:24 Page 1
EPA Climate Change Research Programme 2007-2013
A New Approach to Bioaerosol Monitoring in Ireland
Analyses of the Development and Occurrence of Biological and Chemical Aerosols (BioCheA)
(2007 CCRP Project 4.4.6.b)
CCRP Synthesis Report
End of Project Report available for download on http://erc.epa.ie/safer/reports
Prepared for the Environmental Protection Agency
by
University College Cork
Authors:
David A. Healy, David J. O’Connor, Paul O’Driscoll, Ian P. O’Connor,
and John R. Sodeau
ENVIRONMENTAL PROTECTION AGENCYAn Ghníomhaireacht um Chaomhnú Comhshaoil
PO Box 3000, Johnstown Castle, Co.Wexford, Ireland
Telephone: +353 53 916 0600 Fax: +353 53 916 0699 Email: [email protected] Website: www.epa.ie
ii
© Environmental Protection Agency 2012
ACKNOWLEDGEMENTSThis report is published as part of the Climate Change Research Programme 2007–2013. The programme is financed by the Interdepartmental Committee for Strategy for Science, Technology and Innovation and the Department of Environment, Heritage and Local Government. It is administered on behalf of the Department of the Environment, Heritage and Local Government by the Environmental Protection Agency which has the statutory function of co-ordinating and promoting environmental research.
Firstly, the project team would like to thank David Dodd of the Environmental Protection Agency (EPA). We also would like to thank the Steering Committee (Prof. Paul Kaye, Dr Warren Stanley, Prof. Don Clarke and Micheál O’Dwyer) for guidance and constructive comments throughout the project. The project team acknowledges the National Parks and Wildlife Services of Ireland, Port of Cork, and Denis and Evelyn Healy for providing successful sampling sites; the Department of Biogeochemistry, Max Planck Institute for Chemistry, Mainz, Germany for supplying a UV-APS instrument; the National Pollen and Aerobiology Research Unit (Beverly Adams-Groom) for project team training and initial SporeWatch data analysis. Dr J. Alex Huffman is acknowledged for UV-APS setup in Killarney, valuable discussions and IGOR software support. Thanks go also to Dr Alison Donnelly and Hazel Proctor, Trinity College Dublin, and finally to Dr Pat Whelan, Dr Marcel Jansen, Dr Robert Healy, Dr Nathan Steveson, Lina Hacker, Dr Arnaud Allanic and Dr John Wenger for useful discussions during the project.
DISCLAIMER Although every effort has been made to ensure the accuracy of the material contained in this publication, complete accuracy cannot be guaranteed. Neither the Environmental Protection Agency nor the author(s) accept any responsibility whatsoever for loss or damage occasioned or claimed to have been occasioned, in part or in full, as a consequence of any person acting, or refraining from acting, as a result of a matter contained in this publication. All or part of this publication may be reproduced without further permission, provided the source is acknowledged. The EPA STRIVE Programme addresses the need for research in Ireland to inform policymakers and other stakeholders on a range of questions in relation to environmental protection. These reports are intended as contributions to the necessary debate on the protection of the environment.
EPA STRIVE PROGRAMME 2007–2013
Published by the Environmental Protection Agency, Ireland
ISBN: 978-1-84095-454-8
Price: Free Online version

iii
David A. Healy (Project Co-ordinator)Centre for Research into Atmospheric ChemistryUniversity College CorkCorkIrelandTel.: +353 21 490 3526Email: [email protected]
John Sodeau (Principal Investigator)Centre for Research into Atmospheric ChemistryUniversity College CorkCorkIrelandTel.: +353 21 490 2680Email: [email protected]
David J. O’ConnorCentre for Research into Atmospheric ChemistryUniversity College CorkCorkIrelandTel.: +353 21 490 3526Email: [email protected]
Details of Project Partners
Paul O’DriscollCentre for Research into Atmospheric ChemistryUniversity College CorkCorkIrelandTel.: +353 21 490 3526Email: [email protected]
Stig HellebustTyndall National InstituteCorkIrelandTel.: +353 21 490 4177Email: [email protected]
Ian O’ConnorCentre for Research into Atmospheric ChemistryUniversity College CorkCorkIrelandTel.: +353 21 490 3526Email: [email protected]

Table of Contents
Acknowledgements ii
Disclaimer ii
Details of Project Partners iii
Executive Summary vii
1 Introduction 1
1.1 Bioaerosol Detection: Traditional Methods 1
1.2 Bioaerosol Detection: Real-time Methods 2
1.3 Bioaerosol Detection in Ireland 2
1.4 Project BioCheA 3
1.5 Strategies and Objectives 3
2 Methodology 4
2.1 Sampling Sites 4
2.2 Overview of Instrumentation and Operating Principles 6
3 WIBS-4 Performance Assessment 9
3.1 Introduction 9
3.2 WIBS-4 Laboratory Assessment: Lower Counting Efficiency Curve and Size
Calibration 9
3.3 Laboratory Assessment of WIBS-4 using Test Primary Biological Aerosol
Particles Samples of Pollen and Fungal Material 9
4 WIBS-4: Field-Based Assessment 13
4.1 Introduction 13
4.2 Killarney National Park 13
4.3 Tivoli Docks Industrial Estate 20
4.4 PM10 and NOx Monitoring Programme (Tivoli Docks Industrial Estate) 30
4.5 Pollen Detection in Killarney National Park 39

5 Conclusions from Project BioCheA 44
6 Recommendations for the Future 45
References 46
Acronyms and Annotations 48

vii
Executive Summary
This research project report presents a description of field and laboratory studies related to the application of a new approach for monitoring bioaerosols in Ireland. The core of the scientific programme exploits a recently developed spectroscopic technique designed to detect, characterise and quantify biological particulate matter in real-time. The data acquired are compared to results obtained from traditional offline techniques. Coincident measurements of PM10 and NOx for the Cork Harbour region are also made and reported.
The study was based on four main objectives:
1 To commission a novel spectrometer capable of monitoring bioaerosols in real-time (the Waveband Integrated Bioaerosol Sensor [WIBS-4]). WIBS-4 is an instrument that measures the (i) size, (ii) approximate shape and (iii) intrinsic fluorescence intensity characteristics (across two spectral ranges) of individual airborne particles. Studies were initially performed within a controlled laboratory setting for the detection and quantification of certain primary biological aerosol particles (PBAPs) that are expected to be present in the ambient Irish atmosphere.
2 To deploy the WIBS-4 and related air-monitoring instrumentation (including NOx and PM detectors) in various outdoor locations during 2009–2011 in order to comparatively evaluate the WIBS-4’s performance in the field. Campaigns were mounted in both natural (‘pristine’) and industrial environments.
3 To develop reliable methods of analysis for the treatment of data obtained by use of WIBS-4.
4 To provide specific comparisons for PBAP detection using the WIBS-4 approach and the traditional, impaction method used throughout Europe for pollen/spore analysis, such as the Hirst volumetric trap (‘SporeWatch’) for collection followed by optical microscopy identification.
These objectives have all been achieved and the following conclusions can be made about the fundamental methodology:
● The WIBS-4 approach for detecting PBAP (such as pollen, fungal spores and hyphae fragments) can be employed routinely and reliably in the laboratory and field. Both real-time and high time-resolution data can be obtained, although appropriate size calibrations should be performed and instrumental gain-settings should be carefully chosen for optimum performance.
● Fungal spores can be readily distinguished from pollen and non-bioaerosols chemicals using the WIBS-4 data matrices that are obtained.
● Releases of fungal spores can be related to meteorological data – for example, % relative humidity (RH) with great precision using WIBS-4.
● Good agreement between the multi-wavelength, WIBS-4 data and a laser-based, commercially available, device termed the UV-APS (Ultra-violet Aerosol Particle Size Spectrometer) was found. However, it was determined that the latter instrument appears to be ‘blind’ to some PBAP because of its single-wavelength approach.
A number of important observations were also made regarding PBAP in the Irish atmosphere:
● PBAPs (i.e. those that demonstrated a measurable level of fluorescence) can contribute up to a maximum ~64% to ambient particle loading (1–12 µm) in rural Killarney National Park compared to ~4% in a selected Cork urban industrial site during late and early summer respectively when considering one single fluorescence channel of WIBS-4, that is FL3 (WIBS-4 Fluorescence Channel 3).
● Combining the WIBS-4 spectroscopic technique with the traditional offline SporeWatch/microscopy technique proved to be a very powerful combination for bioaerosol identification and quantification. For example, real-time, ambient WIBS-4 data was collected for Yew pollen (Taxus baccata) with millisecond time resolution and coincided with SporeWatch/optical microscopy information collected with much longer (2 h) time resolution. However, the WIBS-4 was found to count pollen
viii
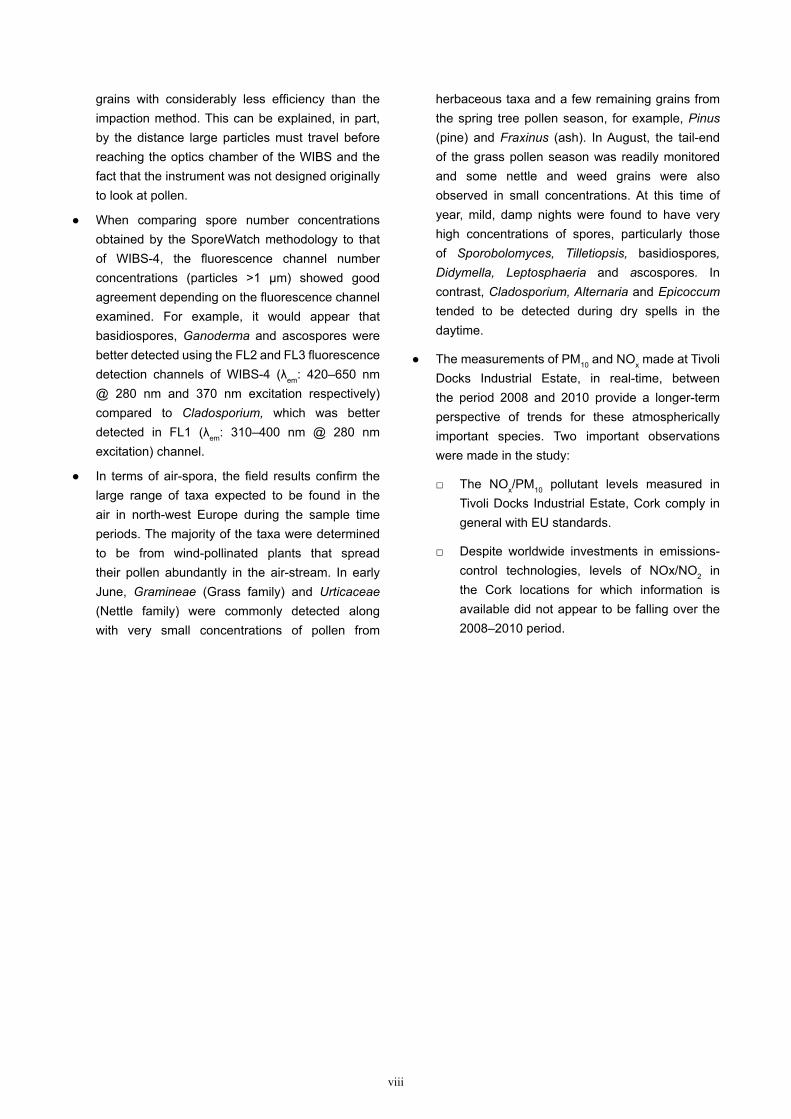
grains with considerably less efficiency than the impaction method. This can be explained, in part, by the distance large particles must travel before reaching the optics chamber of the WIBS and the fact that the instrument was not designed originally to look at pollen.
● When comparing spore number concentrations obtained by the SporeWatch methodology to that of WIBS-4, the fluorescence channel number concentrations (particles >1 µm) showed good agreement depending on the fluorescence channel examined. For example, it would appear that basidiospores, Ganoderma and ascospores were better detected using the FL2 and FL3 fluorescence detection channels of WIBS-4 (λem: 420–650 nm @ 280 nm and 370 nm excitation respectively) compared to Cladosporium, which was better detected in FL1 (λem: 310–400 nm @ 280 nm excitation) channel.
● In terms of air-spora, the field results confirm the large range of taxa expected to be found in the air in north-west Europe during the sample time periods. The majority of the taxa were determined to be from wind-pollinated plants that spread their pollen abundantly in the air-stream. In early June, Gramineae (Grass family) and Urticaceae (Nettle family) were commonly detected along with very small concentrations of pollen from
herbaceous taxa and a few remaining grains from the spring tree pollen season, for example, Pinus (pine) and Fraxinus (ash). In August, the tail-end of the grass pollen season was readily monitored and some nettle and weed grains were also observed in small concentrations. At this time of year, mild, damp nights were found to have very high concentrations of spores, particularly those of Sporobolomyces, Tilletiopsis, basidiospores, Didymella, Leptosphaeria and ascospores. In contrast, Cladosporium, Alternaria and Epicoccum tended to be detected during dry spells in the daytime.
● The measurements of PM10 and NOx made at Tivoli Docks Industrial Estate, in real-time, between the period 2008 and 2010 provide a longer-term perspective of trends for these atmospherically important species. Two important observations were made in the study:
□ The NOx/PM10 pollutant levels measured in Tivoli Docks Industrial Estate, Cork comply in general with EU standards.
□ Despite worldwide investments in emissions-control technologies, levels of NOx/NO2 in the Cork locations for which information is available did not appear to be falling over the 2008–2010 period.
1
D. A. Healy et al. (2007 CCRP Project 4.4.6.b)
1 Introduction
Primary biological aerosol particles (PBAPs) are fragments of biological material emitted or suspended directly from the biosphere to the atmosphere. PBAPs represent a significant fraction of the total aerosol burden; the different types can include viruses (0.01–0.3 μm), bacteria (0.1–10 μm), fungal and fern spores (1–30 μm), plant pollen (5–100 μm) and fragments of animal and plant matter (Huffman et al., 2010, Jaenicke, 2005, Wiedinmyer et al., 2009). All human activity is affected in some way by such viruses, bacteria, spores and pollen: well-known adverse effects include the promotion of health allergies, the spreading of diseases to humans or agricultural crops, and their roles as agents of terrorism. In modern times the detection and suppression of bioaerosols emanating from landfill sites or individual activities have become increasingly difficult issues for waste remediation and environmental agencies.
Indeed, the welfare effects associated with PBAPs can be extensive – ranging from crop and livestock damage to economic effects related to their health effects. Such effects were demonstrated in Irish history in the middle of the nineteenth century in the event known as the Irish Potato Famine. Over the course of a number of years, the fungus, Phytophthora infestans, decimated the potato crop of Ireland, leading to a famine that claimed the lives of an estimated one million people. Another two million people are thought to have left the country because of the resulting social circumstances. This fungus single-handedly altered the course of Irish history.
PBAPs can also play important roles in climate change through the operation of various atmospheric chemical and physical processes. For example, laboratory studies suggest that some mineral dusts and PBAPs (bacteria, pollen and fungi) can act as ice nuclei (Möhler et al., 2007). Ice nuclei (IN) can initiate ice-crystal formation in clouds, thereby affecting precipitation and the global hydrological cycle (Lohmann and Feichter, 2005). If pollen, for example, can act as cloud condensation nuclei (CCN), their effect would be sufficiently large to provide a disproportionate contribution to the development of precipitation within clouds by acting as ‘giant’ CCN (Johnson, 1982). Therefore, by acting as
a CCN, PBAPs can indirectly contribute to and perturb the radiative balance in the Earth System.
1.1 Bioaerosol Detection: Traditional Methods
A review of suitable techniques for the detection of bioaerosols in ambient air is beyond the scope of the current report but available methodologies have been outlined elsewhere (Brown et al., 2009, Xu et al., 2011). Methods of bioaerosol detection can be generally classified into two categories: (i) offline (ii) and online. A non-exhaustive outline of a selection of techniques is given below.
The traditional method for determining ambient concentrations of PBAPs has been manual counting using an optical microscope. Traditional sampling methods include both gravitational- and volumetric-based techniques. Several sedimentation sampling methods have been developed for pollen analysis: the Durham microscope slide, hanging slides, flags, passive impactor rods, sticky cylinders, etc. A number of aerobiological monitoring stations employ volumetric methods such as the Hirst, Buckard and Kramer-Collins traps. A disadvantage of these traps is that they are not isokinetic and wind-speed variations have some effect on the catch. However, counts are sufficient to provide pollen-information services. In Europe, a mechanical wind-up Hirst volumetric trap has been employed widely, with the latest electronic version of the instrument marketed as ‘SporeWatch’ (Buckard Scientific, UK) (Hirst, 1952). Other techniques used elsewhere include the Durham sampler which is a traditional and representative method for collecting airborne pollen. Indeed, because of its ease of use, this methodology has become the standard collection approach in Japan (Durham, 1946). Other volumetric and even isokinetic methods have been developed but all possess disadvantages – for example, lack of operational continuity, overload problems, difficulties in the elution of particles, complicated preparation, etc. More importantly, traditional methods for measuring PBAPs are laborious and time consuming and, as noted above, typically involve counting using a

2
A New Approach to Bioaerosol Monitoring in Ireland
microscope. The result is that successful quantitative outcomes depend on both operator skill and concentration level, features which reduce the practicality of sampling with high time resolution. However, all of the techniques have the advantage of being reliable when year-long datasets have been collected. Currently, for the health and climate reasons cited above, increased reliability for the monitoring of PBAPs, especially in real-time, is required. This is a large and complex task. Certainly, Matthias-Maser and Jaenicke (2000) suggest that the proportion of the total airborne particulate by volume made up by biological material in (i) remote continental, (ii) populated continental and (iii) remote maritime environments is respectively 28%, 22% and 10% (Matthias-Maser and Jaenicke, 2000).
1.2 Bioaerosol Detection: Real-time Methods
Monitoring PBAPs with high time resolution is a recent technological development that has largely stemmed from military-led research into the detection of biological warfare agents (BWA). This work has led to the construction of online, real-time instrumentation that exploits laser/light induced fluorescence (LIF). Two examples of such devices are (i) the commercially available ultraviolet aerodynamic particle sizer (UV-APS) and (ii) the Waveband Integrated Bioaerosol Sensor (WIBS; note that previous models are referred to as Wide Issue Bioaerosol Sensor). The UV-APS provides aerodynamic particle sizing and fluorescence information using single-wavelength LIF excitation with a pulsed Nd:YAG laser (355 nm excitation; 420 nm–575 nm emission) (Hairston et al., 1997). The WIBS technique provides optical particle sizing, an index of particle shape or ‘asymmetry’ and fluorescence collections based on sequential dual wavelength LIF using Xe-flashlamps (280 nm & 370 nm excitations; 310 nm–400 nm and 420 nm–650 nm emissions) (Kaye et al., 2005a, Kaye et al., 2004, Kaye et al., 2005b). It can be argued that the UV-APS provides only limited bioparticle discrimination since it offers only a single wavelength fluorescence excitation with either one or two fluorescence detection wavebands. However, its reliability and good performance have been routinely demonstrated in the literature (Agranovski et al., 2003a, b and 2005, Huffman et al., 2010). In contrast, WIBS-4 offers dual excitation and detection across two wavebands coupled with a laser scattering method to
determine both particle size and an asymmetry index of particle shape.
To date, throughout the world, there have been few real-time collections of PBAP dynamical data obtained to aid our understanding of sub-diurnal boundary layer transport processes and cloud formation, despite their potential importance to climate studies etc. (Gabey et al., 2011, Huffman et al., 2010). As highlighted by Stanley et al. (2011), one reason for such a lack of information is that, until recently, there have been few suitable instruments available to reliably detect and characterise airborne biological particles in situ and in real-time.
1.3 Bioaerosol Detection in Ireland
Numerous studies have measured the concentrations of outdoor airborne fungal spores in urban areas in the UK, USA and elsewhere using offline techniques (e.g. Millington and Corden, 2005, Mitakakis et al., 1997, Shelton et al., 2002). However, there is little information regarding outdoor (ambient) PBAP levels in Ireland: only a few studies have been published. One of these was based on air sampling conducted in Galway (McDonald and O’Driscoll, 1980). The resulting survey compared pollen and fungal spore counts obtained during the summers of 1977 and 1978 using a Hirst volumetric spore trap, and also provided concentrations of Cladosporium and basidiospores. More recently, Gorman et al. (2008) have examined temporal and spatial variations in airborne spore concentrations for selected allergenic and pathogenic fungi sampled in Dublin, Ireland during 2005. Cladosporium, Penicillium, Aspergillus and Alternaria spores were found to be constantly present in the Dublin atmosphere, representing >20% of the total culturable spore count (O’Gorman et al., 2008). A characterisation of background bioaerosol levels was attempted at Macehead, Ireland in the 1990s using a glass cyclone sampler followed by subsequent fluorescence analysis in the laboratory (Jennings et al., 1996). More recently, a literature evaluation of bioaerosols with specific reference to composting (Prasad et al., 2004) concluded that research on bioaerosols from composting should be conducted to develop baselines in Ireland, as no such information was found to be available. The study also highlighted the potential health risk associated with composting to workers.
3
D. A. Healy et al. (2007 CCRP Project 4.4.6.b)
1.4 Project BioCheA
The study presented in this report – project BioCheA – is the first of its kind in Ireland to provide PBAP measurements of airborne pollen and spores distributed in contrasting environments using both traditional offline techniques and novel real-time instrumentation (online). It represents a new approach to the detection of bioaerosols in Ireland.
The primary aim of BioCheA was to evaluate the potential of the online auto-fluorescence instrument, WIBS-4, for gathering reliable real-time data on ambient PBAPs in Ireland so that predictive models for epidemiology and climate change can be improved.
To achieve this aim, a WIBS-4 instrument was initially commissioned and tested in the laboratory to provide optimum operating conditions for its future deployment in the field. A series of field campaigns was held subsequently during 2009–2011 using a whole suite of additional instrumentation, including a SporeWatch, meteorological equipment, NOx and particulate matter (PM) detectors to allow the PBAP results to be assessed in a fuller atmospheric context. The real-time PBAP results obtained by WIBS-4 were also compared to those obtained by use of the alternate, UV-APS approach during one of the BioCheA sampling campaigns.
1.5 Strategies and Objectives
The main strategy employed to achieve the aim of the BioCheA research project was to develop a complementary laboratory and field-based measurement programme for PBAPs in Ireland using the WIBS-4. The results obtained were duly compared
with those obtained using more traditional and fully commercially available techniques, for example SporeWatch and UV-APS. Hence, a ‘benchmark’ approach was used to assess the performance of WIBS-4 for regular deployment in the environment so that reliable data on ambient pollen and spores could be obtained in the future. The objectives set to reach a successful outcome for the research included:
● To commission a novel real-time spectrometer for subsequent use in Irish field campaigns, i.e, the use of the WIBS-4 in a controlled laboratory setting for the detection of expected individual PBAPs.
● To deploy WIBS-4 (and related instrumentation) in various ambient settings, mainly during 2010, and evaluate their performance in the field. For this purpose, measurements were made using WIBS-4 in an industrialised urban site and a rural forested region.
● To develop methods of analysis for the treatment of data obtained from WIBS-4.
● To provide a specific comparison between the WIBS-4 approach and the traditional impaction method used for pollen/spore counting, that is the ‘SporeWatch’ instrument (Buckard Scientific, UK) and to assess the implications of such comparisons.
● To nurture much needed national expertise and capacity in the area of bioaerosol research for the Irish Environmental Protection Agency (EPA) and other interested parties.
● To perform a continuous NOx (real-time) and PM10
monitoring programme within the Cork Harbour region, Ireland over a number of years.
● To provide a scientific platform for post-graduate student development in the Environmental Sciences at University College Cork.
4
A New Approach to Bioaerosol Monitoring in Ireland
2 Methodology
2.1 Sampling Sites
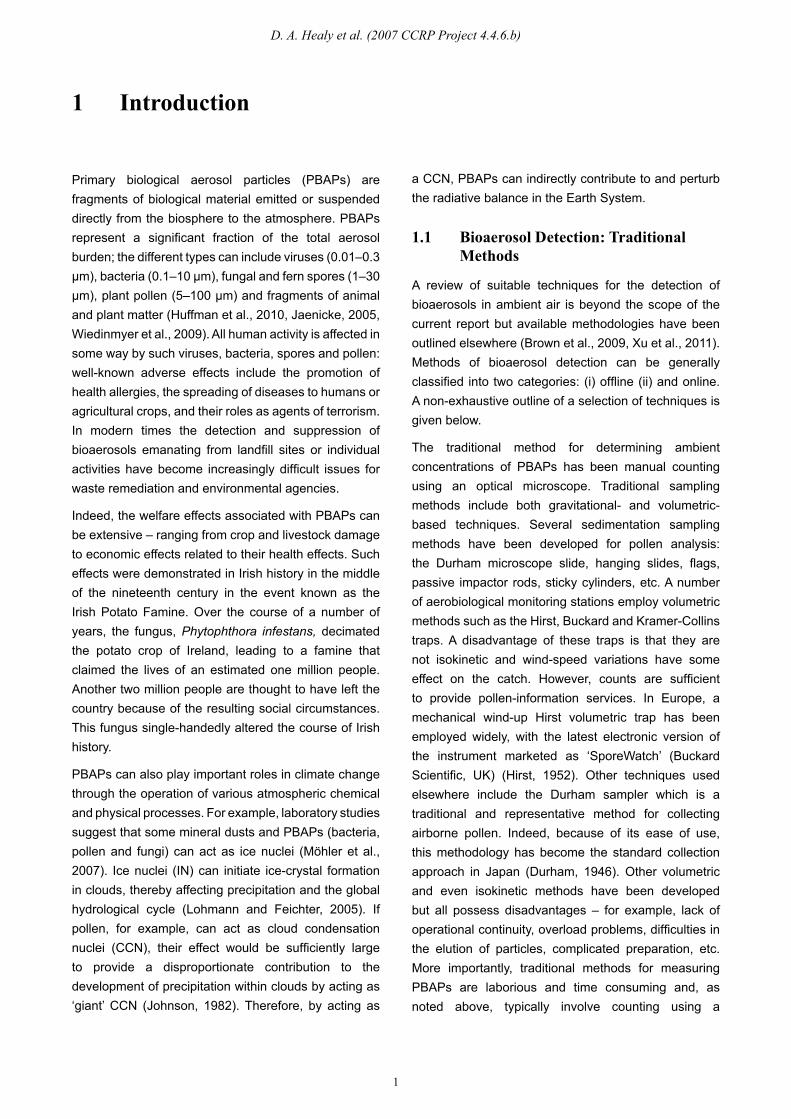
2.1.1 Killarney National ParkSampling was performed in Killarney National Park, Kerry, Ireland (N 52°01.263, W 09°30.553), towards the eastern perimeter of Reenadinna woods (Fig. 2.1) during two separate campaigns: 23/02/10–10/03/10 and 02/08/2010–02/09/2010. The Reenadinna woods area is the largest location for Yew wood in Ireland, covering approximately 60 acres (25 hectares). The canopy in this stand is typically strongly dominated by Taxus baccata (Yew) with Corylus avellana (common Hazel), IIex aquifolium (European Holly) and Fraxinus excelsior (Ash). The floor of this wood is generally covered by an extensive bryophyte carpet and is species poor in terms of vascular plants. A list of typical species found in Reenadinna woods is outlined elsewhere (Kelly, 1981).
There are no landfills, road traffic, animal housing or waste-treatment plants in the vicinity of the sampling site.
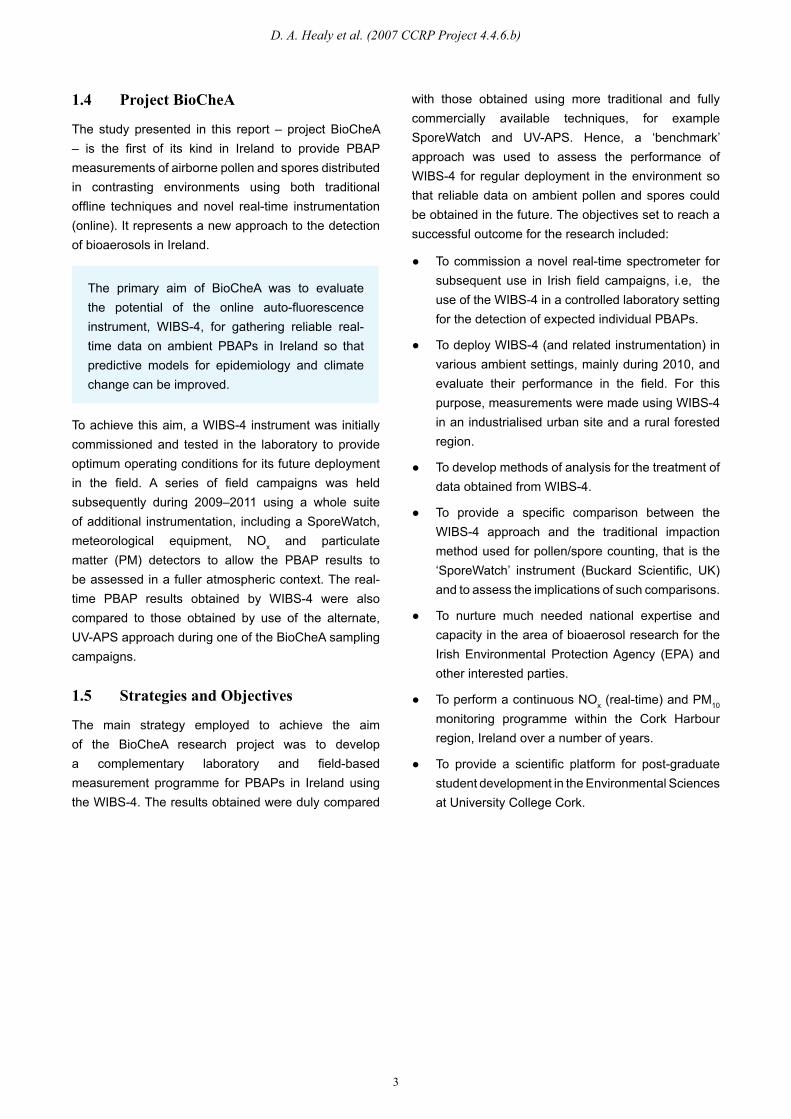
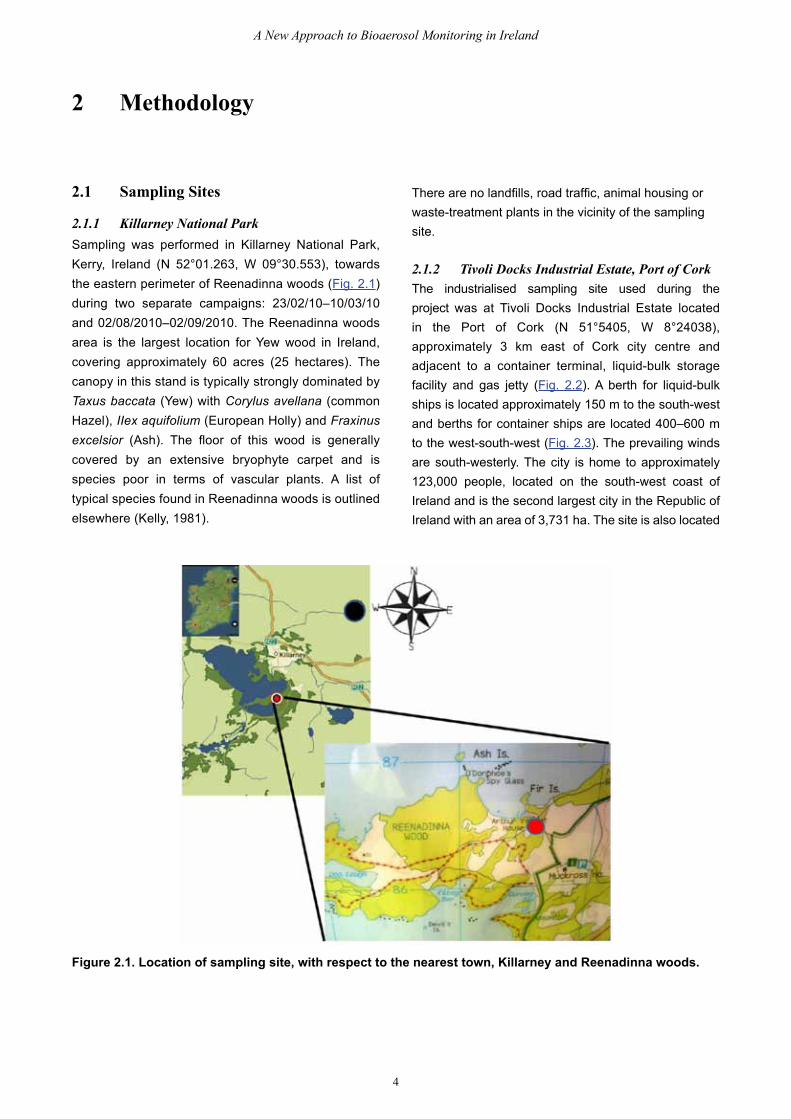
2.1.2 Tivoli Docks Industrial Estate, Port of CorkThe industrialised sampling site used during the project was at Tivoli Docks Industrial Estate located in the Port of Cork (N 51°5405, W 8°24038), approximately 3 km east of Cork city centre and adjacent to a container terminal, liquid-bulk storage facility and gas jetty (Fig. 2.2). A berth for liquid-bulk ships is located approximately 150 m to the south-west and berths for container ships are located 400–600 m to the west-south-west (Fig. 2.3). The prevailing winds are south-westerly. The city is home to approximately 123,000 people, located on the south-west coast of Ireland and is the second largest city in the Republic of Ireland with an area of 3,731 ha. The site is also located
Figure 2.1. Location of sampling site, with respect to the nearest town, Killarney and Reenadinna woods.
5
D. A. Healy et al. (2007 CCRP Project 4.4.6.b)
Figure 2.2. Location of industrialised urban site used in relation to Tivoli Docks Industrial Estate and Cork city (Image: maps.google.com).
Figure 2.3. Location of sampling site and adjacent shipping berths at Tivoli Docks Industrial Estate, Port of Cork. Approximately 3 km west of the site is the city centre which is located to the left in picture.
near a main road (N25) as seen on the Fig. 2.2 map and is close to where the ships dock. Hence, all air samples and results gathered from this site are relevant to the inhabitants of Cork city and some of its suburbs.
at which to sample the ambient biological content in
the harbour region of Cork while also being relatively
clean of anthropogenic pollution (Fig. 2.4). The
SporeWatch instrument was situated in Raffeen
hill from 01/02/2010–31/07/2010; the deployment
represents the first continuous pollen and spore-
monitor station in the Cork region.
2.1.3 Raffeen Hill sampling siteThe Raffeen Hill sampling site serves well as a ‘background harbour site’ and offered a safe location

6
A New Approach to Bioaerosol Monitoring in Ireland
2.2 Overview of Instrumentation and Operating Principles
2.2.1 WIBS-4 operating principles and size calibration
The WIBS-4 is the latest version of a series of real-time biological particle sensors developed recently at the University of Hertfordshire (Foot et al., 2008, Kaye et al., 2004, Kaye et al., 2005a, Kaye et al., 2005b, Stanley et al., 2011). The WIBS-4, illustrated in Fig. 2.5, employs a central optical chamber, around which are arranged: (i) a continuous-wave 635 nm diode laser used for the initial detection of particles and the determination of size (optical particle size); (ii) a scattering quadrant photomultiplier used in the determination of particle size and shape; (iii) two pulsed xenon UV lamps emitting at different wavebands along with two fluorescence detection channels which detect intrinsic particle fluorescence across two wavebands. The excitation wavelengths, centered on 280 nm and 370 nm respectively, are selected to excite biofluorophores such as tryptophan and NAD(P)H (Nicotinamide adenine dinucleotide, phosphate derivative) in the particles. It is of note that excitation at 370 nm produces fluorescence from not just NAD(P)H but also flavins and, to a lesser extent, other proteins and amino acids (as well as a small contribution from tryptophan). Ultimately for each particle, three fluorescence measurements are made: (i) emission: 310–400 nm excited at 280 nm (FL1);
(ii) emission: 420–650 nm excited at 280 nm (FL2); (iii) emission: 420–650 nm excited at 370 nm (FL3). (Note that the terms FL1, FL2 and FL3 are used throughout as notation for WIBS-4 Fluorescence Channel 1, 2 or 3, respectively.) Determinations of particle size and ‘shape’ are obtained by measuring optical scattering intensities from the 635 nm laser beam. Table 2.1 provides a summary of the operating principles of WIBS-4.
Figure 2.5. Waveband Integrated Bioaerosol Sensor model number 4 (WIBS-4).
Fluorescent non-PBAP materials are also present in the atmosphere and some demonstrate similar fluorescent characteristics to those of PBAPs. For example, soot, polycyclic aromatic hydrocarbons (PAHs), oil droplets and cigarette smoke exhibit fluorescence signals that could potentially alter particulate counting (Pan et al., 2008). However, to overcome this issue and minimise the impact of any such interferences by non-PBAPs, sub-micron particles <1 μm are excluded when calculating integral particle number concentrations, i.e. NF,c. A full, detailed discussion on
Figure 2.4. Location of sampling site at Raffeen Hill, Cork in relation to Cork Harbour and surrounding satellite towns.

7
D. A. Healy et al. (2007 CCRP Project 4.4.6.b)
2.2.4 Weather stationWind speed, wind direction, temperature, humidity, sunshine and rainfall were monitored using a Casella NOMAD weather station.
2.2.5 NOx monitoring NO and NOx ambient concentrations were monitored using a conventional, chemiluminescence instrument (Thermo Electron 42i-TL Trace Level NOx Analyser).
2.2.6 PM10 gravimetric monitoringA Tapered Element Oscillating Microbalance (TEOM), (Thermo Electron model 1400a), was used to measure PM10 ambient mass concentrations (averaged every 30 min).
2.2.7 Data processingThe WIBS-4 data output was recorded in millisecond time resolution during experiments. However, number-size distributions of the aerosol particles, for each pre-calculated size bin of fluorescent aerosol particles (dNF/dlogDo) and total aerosol particles (dNT/dlogDo) were calculated at the desired time resolution, e.g. 30 s, 1 min, 5 min or 1 h time
2.2.2 WIBS-4: Laboratory studies methodologyDetailed descriptions of the laboratory experimental setups, PBAP samples and methodology used are given in Section 2.3 of the Final Project Report (available for download on http://erc.epa.ie/safer/reports).
2.2.3 SporeWatchA volumetric spore trap was used to capture and measure airborne pollen and spores during the project. The SporeWatch Sampler (Burkard Scientific, UK), which is the latest electronic version of the Hirst volumetric trap (Hirst, 1952), operates by drawing air in through an orifice at a constant rate (~10 L min-1), allowing any pollen and spores present in the air to impact onto a paraffin-coated tape (Melinex) placed on a rotating drum. The tapes are mounted on microscope slides and manual counts are converted into atmospheric concentrations and expressed as pollen or spore counts per cubic metre of air.
Table 2.1. A summary of the operating principles of WIBS-4.
Overview Measures optical size, Do; shape (asymmetry) and intrinsic fluorescence from individual particles when excited sequentially at two ultraviolet (UV) wavebands. Potential sampling time resolution: milliseconds
Size (Mie Theory) (based on PSL calibration, ref. index = 1.58)
Do: High gain: ~0.5 µm to 12 μm; Low gain: ~3 µm to 31 μm
Shape WIBS-4 records the forward angle scatter intensity values received by each quadrant of a quadrant PMT detector and determines the root-mean-square variation around the mean value to yield an asymmetry factor value (AF). The result is scaled such that a perfect sphere would correspond to AF = 0 and a high aspect ratio fibre to an AF approaching 100.
UV source used to excite intrinsic fluorescence
UV xenon flash-lamps centred upon 280 nm and 370 nm tuned for exciting biofluorophores such as tryptophan and NAD(P)H, respectively
Fluorescence • Fluorescence (~310–400 nm) with 280 nm excitation (FL1)
• Fluorescence (~420–650 nm) with 280 nm excitation (FL2)
• Fluorescence (~420–650 nm) with 370 nm excitation (FL3)
Aerosol sample flow rate: (flow containing particles that are examined)
~230 ml min-1
Flow rate at inlet: ( = sample flow + sheath flow)
~2.4 L min-1
Do: optical size. NAD(P)H: Nicotinamide adenine dinucleotide, phosphate derivative.
the influence of particulate chemical interferents on online fluorescence PBAP detection techniques is given in greater detail elsewhere (Gabey et al., 2011, Huffman et al., 2010).

8
A New Approach to Bioaerosol Monitoring in Ireland
averages. Particles were considered to be ‘fluorescent’
when the fluorescence values recorded exceeded
a defined lower limit for each channel, i.e. above
the WIBS-4 instrumental baseline for fluorescence
intensity measurement according to each channel.
This calculation is similar to that employed by Gabey et al. (2010).
Data manipulations and plotting were performed using IGOR Pro 6.1 (Wavemetrics, USA), SOLO (Eigenvector, USA) and Microsoft Office 2010 Excel.

9
D. A. Healy et al. (2007 CCRP Project 4.4.6.b)
3.1 Introduction
WIBS-4 is effectively a prototype bioaerosol sensing instrument and therefore an assessment of its performance in a controlled laboratory setting was a prerequisite of its field deployment. To do so, a laboratory commissioning stage was initiated and a bioaerosol sensor commissioning chamber (BSCC) designed to allow the introduction of PBAP samples on a single aerosol basis to the WIBS-4. The BSCC was also used to size calibrate the instrument. Details of the BSCC system can be found in Section 2 of the Final Project Report.
3.2 WIBS-4 Laboratory Assessment: Lower Counting Efficiency Curve and Size Calibration
3.2.1 Introduction The particle lower-end counting efficiency curve is defined by comparing WIBS-4 particle counts to those made using a commercially available condensation particle counter (CPC) (TSI model 3010). Determining the upper-end counting efficiency was unachievable because of the unavailability of a reference counting instrument. A detailed description of the experimental work carried out is available in Sections 2.3 and 3.1 of the Final Project Report. Therefore, only a summary is provided here for the purpose of the Synthesis Report.
3.2.2 Summary of key findingsThe lower-end counting efficiency curve was defined. The data indicates that the counting efficiency of WIBS-4 depends on the diameter of the particle studied. For particles ≤690 nm a correction to the number concentration is necessary. The results show that the WIBS-4 has a lower D50 of approximately 489 nm, where D50 defines the diameter of particles with a number concentration ratio for WIBS4/CPC equalling 50% in terms of counting efficiency. D100 (690 nm) is defined analogously.
For particles ≥690 nm, the results indicate that WIBS-4 possesses a higher counting efficiency than the CPC instrument, which was used for reference. Using PSL
(polystyrene latex spheres) with 0.7, 0.9 and 1.3 µm diameters, the WIBS-4 exhibited a higher counting efficiency compared to the CPC and reached a maximum value of 21% greater than that of the CPC for PSL 1.3 µm.
3.2.3 ConclusionThe counting efficiency for WIBS-4 was 50% for PSL spheres with diameters equal to 489 nm and was 100% for those with diameters of 690 nm. The conclusion from this data is that the data in the particle regime ≤ 690 nm (0.69 µm) must be adjusted for its counting efficiency in order to determine or state accurate particle size distributions and concentrations with the WIBS-4.
3.3 Laboratory Assessment of WIBS-4 using Test Primary Biological Aerosol Particles Samples of Pollen and Fungal Material
3.3.1 IntroductionWIBS-4 was used to record a multi-parameter ‘signature’ from a number of PBAP samples known to be present in ambient air (for a list of samples and further detail, see Section 2.3.2 of Final Project Report). The monitored variables were based on their size, ‘shape’ and auto-fluorescence. Using this information, investigations were made into the ability of WIBS-4 to distinguish between differing types of PBAPs. The capability of WIBS-4 to distinguish between PBAP samples originating from two different kingdoms, Plantae and Fungi, was the main experimental aim of the current work and a summary of the results are presented here. Full details are given in the Final Project Report, Section 3.2.
3.3.2 Summary of key findingsNaturally occurring PBAP samples were introduced to the WIBS-4 on an individual basis and data analysis performed on the generated representative matrices (based on light scattering and fluorescence in a detailed statistical manner). The working hypothesis behind the approach was to test whether individual PBAP types – for instance, fungal spore material and pollen – could be distinguished fully from each other (or, at least,
3 WIBS-4 Performance Assessment
10
A New Approach to Bioaerosol Monitoring in Ireland
demonstrate a degree of separation from each other) when their respective light-scattering patterns and auto-fluorescence signals were characterised.
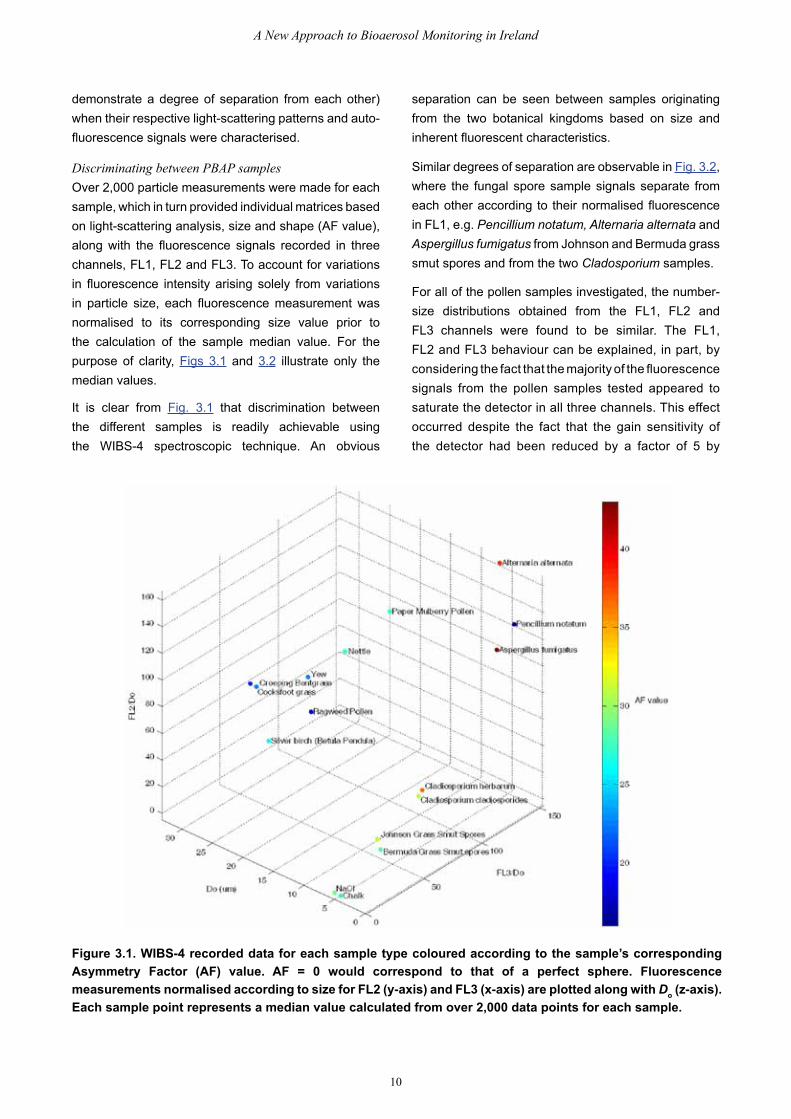
Discriminating between PBAP samplesOver 2,000 particle measurements were made for each sample, which in turn provided individual matrices based on light-scattering analysis, size and shape (AF value), along with the fluorescence signals recorded in three channels, FL1, FL2 and FL3. To account for variations in fluorescence intensity arising solely from variations in particle size, each fluorescence measurement was normalised to its corresponding size value prior to the calculation of the sample median value. For the purpose of clarity, Figs 3.1 and 3.2 illustrate only the median values.
It is clear from Fig. 3.1 that discrimination between the different samples is readily achievable using the WIBS-4 spectroscopic technique. An obvious
Similar degrees of separation are observable in Fig. 3.2, where the fungal spore sample signals separate from each other according to their normalised fluorescence in FL1, e.g. Pencillium notatum, Alternaria alternata and Aspergillus fumigatus from Johnson and Bermuda grass smut spores and from the two Cladosporium samples.
Figure 3.1. WIBS-4 recorded data for each sample type coloured according to the sample’s corresponding Asymmetry Factor (AF) value. AF = 0 would correspond to that of a perfect sphere. Fluorescence measurements normalised according to size for FL2 (y-axis) and FL3 (x-axis) are plotted along with Do (z-axis). Each sample point represents a median value calculated from over 2,000 data points for each sample.
separation can be seen between samples originating from the two botanical kingdoms based on size and inherent fluorescent characteristics.
For all of the pollen samples investigated, the number-size distributions obtained from the FL1, FL2 and FL3 channels were found to be similar. The FL1, FL2 and FL3 behaviour can be explained, in part, by considering the fact that the majority of the fluorescence signals from the pollen samples tested appeared to saturate the detector in all three channels. This effect occurred despite the fact that the gain sensitivity of the detector had been reduced by a factor of 5 by

11
D. A. Healy et al. (2007 CCRP Project 4.4.6.b)
the manufacturer in order to examine the potential of WIBS-4 to detect pollen. However, it is clear that the sensitivity would need to be reduced even further to bring all such fluorescence measurements of pollen grains into range, which in theory could be achievable. However, the WIBS-4 was found to demonstrate the ability to successfully size pollen samples where Do ≤31 µm. In addition, when median fluorescence signals were normalised to size, each pollen sample demonstrated a degree of separation across each fluorescent channel.
3.3.3 DiscussionRecently, Pan et al. (2011) used principal component analysis (PCA) to demonstrate that fluorescence spectra and elastic scattering may be useful for real-time discrimination between a variety of airborne pollen, fungal materials and other airborne particles.
In that study, a highly expensive experimental setup that is not commercially available was used whereby two UV lasers were employed for sample excitation (emitting pulses at 263 nm and 351 nm).
The results obtained in project BioCheA, with relatively cheap light sources (xenon-flash lamps: 280 nm and 370 nm), within a portable field-ready instrument are in agreement with those obtained by Pan et al. (2011). All the results suggest that dual wavelength excitation coupled with light-scattering analysis provides unique information which can be used to discriminate between differing PBAP sample types such as pollen and fungal material/spores. In future, it may prove for some analyses that the additional layer of information provided by the WIBS technique (i.e. an index of particle shape, the AF value) may allow biological particle discrimination that is not possible with other techniques.
Figure 3.2. WIBS-4 recorded data for each sample type coloured according to the sample’s corresponding Asymmetry Factor (AF) value. AF = 0 would correspond to that of a perfect sphere. Fluorescence measurements normalised according to size for FL1 (y-axis) and FL3 (x-axis) are plotted along with Do (z-axis). Each sample point represents a median value calculated from over 2,000 data points for each sample.
12
A New Approach to Bioaerosol Monitoring in Ireland
3.3.4 ConclusionsThe key objective – to commission a novel, real-time spectrometer (WIBS-4) for subsequent use in Irish field campaigns in a controlled laboratory setting for detection of expected individual PBAPs – was achieved.
The work demonstrated the ability of WIBS to detect pollen, i.e. to size them correctly and provide an index of shape for highly fluorescent particles ( ≤31 µm) and similar to fungal spores and hyphal fragments in real-time and high time resolution. For pollen analyses, further modification to the instrument would be necessary (such as reducing the gain setting on the fluorescence detector by a factor greater than 5) in order to exploit the full potential of the instrument and bring all of the fluorescence measurements made by WIBS-4 into range for pollen grain samples. However,
it is of note that WIBS-4 was not originally designed to examine PBAPs larger than 12 µm, e.g. pollen samples used here and therefore the above experiments serve to demonstrate the potential ability of the WIBS-4 spectroscopic technique to detect and measure ambient pollen. Furthermore, the above study represented a necessary prelude to deploying WIBS-4 in the field in order to assess its use for bioaerosol detection relevant to environmental science.
A method in which the user of WIBS-4 could readily pre-define ‘the fluorescence measuring window’ of the instrument, i.e. adjust the sensitivity of the fluorescence detector, may prove to be a useful addition to the WIBS design. This would prove very useful where highly fluorescent PBAPs were evident, e.g. pollen samples.
13
D. A. Healy et al. (2007 CCRP Project 4.4.6.b)
4.1 Introduction
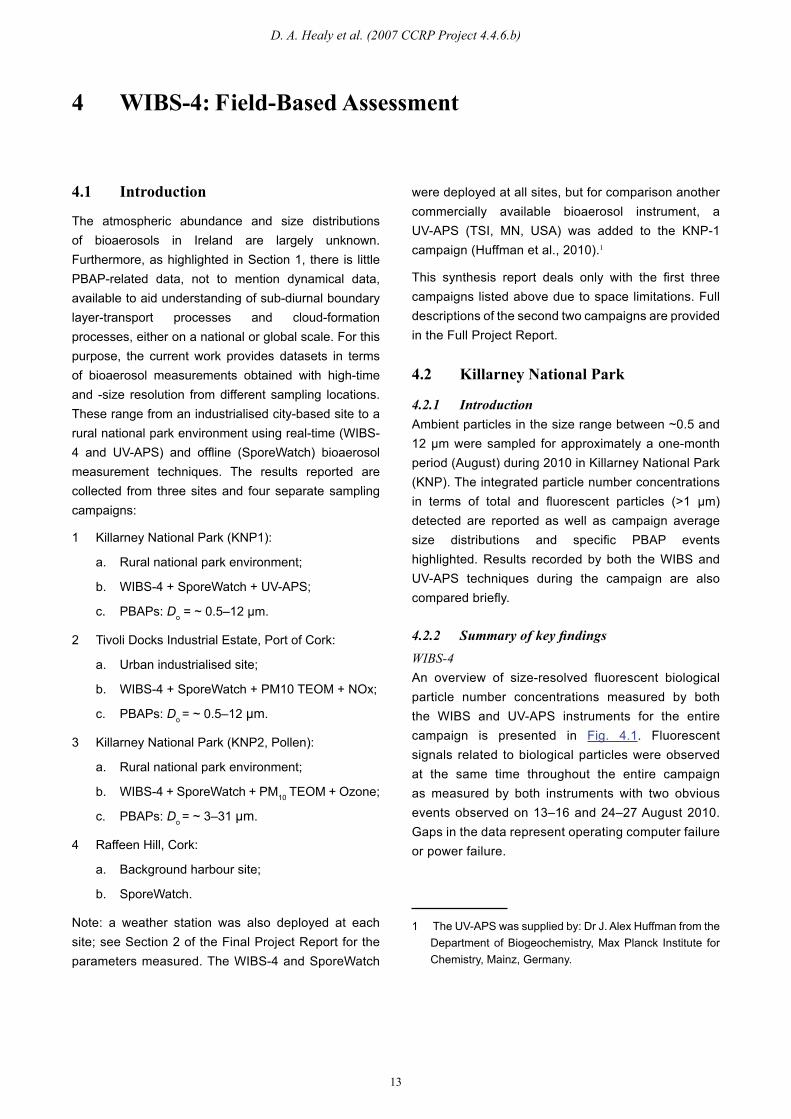
The atmospheric abundance and size distributions of bioaerosols in Ireland are largely unknown. Furthermore, as highlighted in Section 1, there is little PBAP-related data, not to mention dynamical data, available to aid understanding of sub-diurnal boundary layer-transport processes and cloud-formation processes, either on a national or global scale. For this purpose, the current work provides datasets in terms of bioaerosol measurements obtained with high-time and -size resolution from different sampling locations. These range from an industrialised city-based site to a rural national park environment using real-time (WIBS-4 and UV-APS) and offline (SporeWatch) bioaerosol measurement techniques. The results reported are collected from three sites and four separate sampling campaigns:
1 Killarney National Park (KNP1):
a. Rural national park environment;
b. WIBS-4 + SporeWatch + UV-APS;
c. PBAPs: Do = ~ 0.5–12 µm.
2 Tivoli Docks Industrial Estate, Port of Cork:
a. Urban industrialised site;
b. WIBS-4 + SporeWatch + PM10 TEOM + NOx;
c. PBAPs: Do = ~ 0.5–12 µm.
3 Killarney National Park (KNP2, Pollen):
a. Rural national park environment;
b. WIBS-4 + SporeWatch + PM10 TEOM + Ozone;
c. PBAPs: Do = ~ 3–31 µm.
4 Raffeen Hill, Cork:
a. Background harbour site;
b. SporeWatch.
Note: a weather station was also deployed at each site; see Section 2 of the Final Project Report for the parameters measured. The WIBS-4 and SporeWatch
were deployed at all sites, but for comparison another commercially available bioaerosol instrument, a UV-APS (TSI, MN, USA) was added to the KNP-1 campaign (Huffman et al., 2010).1
This synthesis report deals only with the first three campaigns listed above due to space limitations. Full descriptions of the second two campaigns are provided in the Full Project Report.
4.2 Killarney National Park
4.2.1 IntroductionAmbient particles in the size range between ~0.5 and 12 µm were sampled for approximately a one-month period (August) during 2010 in Killarney National Park (KNP). The integrated particle number concentrations in terms of total and fluorescent particles (>1 µm) detected are reported as well as campaign average size distributions and specific PBAP events highlighted. Results recorded by both the WIBS and UV-APS techniques during the campaign are also compared briefly.
4.2.2 Summary of key findingsWIBS-4An overview of size-resolved fluorescent biological particle number concentrations measured by both the WIBS and UV-APS instruments for the entire campaign is presented in Fig. 4.1. Fluorescent signals related to biological particles were observed at the same time throughout the entire campaign as measured by both instruments with two obvious events observed on 13–16 and 24–27 August 2010. Gaps in the data represent operating computer failure or power failure.
1 The UV-APS was supplied by: Dr J. Alex Huffman from the Department of Biogeochemistry, Max Planck Institute for Chemistry, Mainz, Germany.
4 WIBS-4: Field-Based Assessment

14
A New Approach to Bioaerosol Monitoring in Ireland
Figure 4.1. Overview of entire campaign: Fluorescent particle number concentration-time (NF) profiles as determined by WIBS-4 for all FL1, FL2 and FL3 channels (top 3 panels) and UV-APS (bottom panel) for particles in the comparable size range of 0.6 µm–13 µm (size-resolved measurements, coloured to dNF/dlogDo [cm-3]). Note that for WIBS-4: Do and UV-APS: Da data are reported as 5-min averages. UV-APS data courtesy of Dr J. Alex Huffman.
An overview of the fluorescent coarse particle number concentrations (NF,C) measured in the FL1, 2 and 3 channels of WIBS-4 for the entire campaign is presented in Fig. 4.2. Generally, FL3 indicated the higher number concentrations followed by FL1 and FL2 during the campaign. Throughout the entire measurement period
a circadian rhythm was evident in all three channels. However, a more obvious rhythm is noted for coarse particle concentration levels in channels FL2 and FL3 during the fluorescent biological particle events observed between the periods 13–17 August 2010 and 24–27 August 2010 (Fig. 4.2).
Figure 4.2. Integrated fluorescent coarse particle number concentration-time (Nf,c) profiles as determined by WIBS-4 for all FL channels FL1: (λex: 280nm, λem: ~310 nm–400 nm), FL2: (λex: 280 nm, λem: ~420 nm–650 nm) and FL3: (λex: 370nm, λem: ~420 nm–650 nm) illustrating the difference in magnitude between number of fluorescent particles detected by each channel.
15
D. A. Healy et al. (2007 CCRP Project 4.4.6.b)
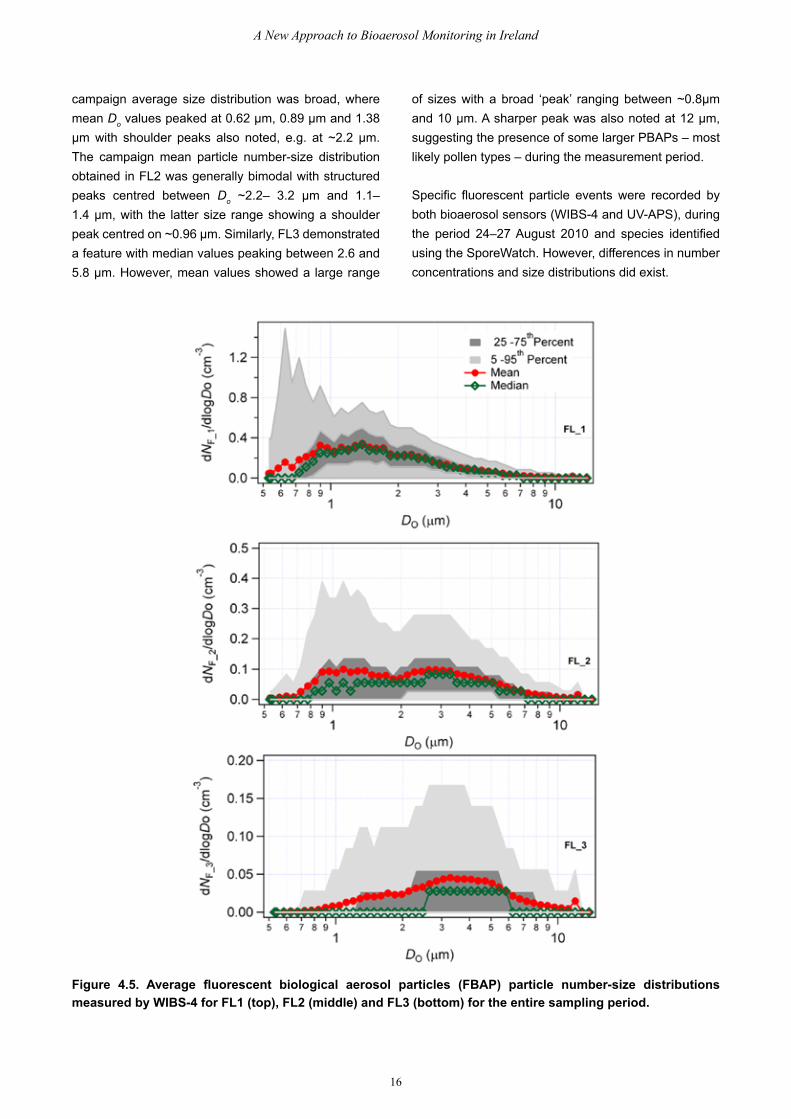
The entire campaign average size distributions obtained for the fluorescent particles, dNF/dlogDo are presented in Fig. 4.5 for each of the three channels, FL1 (top), FL2 (middle) and FL3 (bottom). For FL1, its
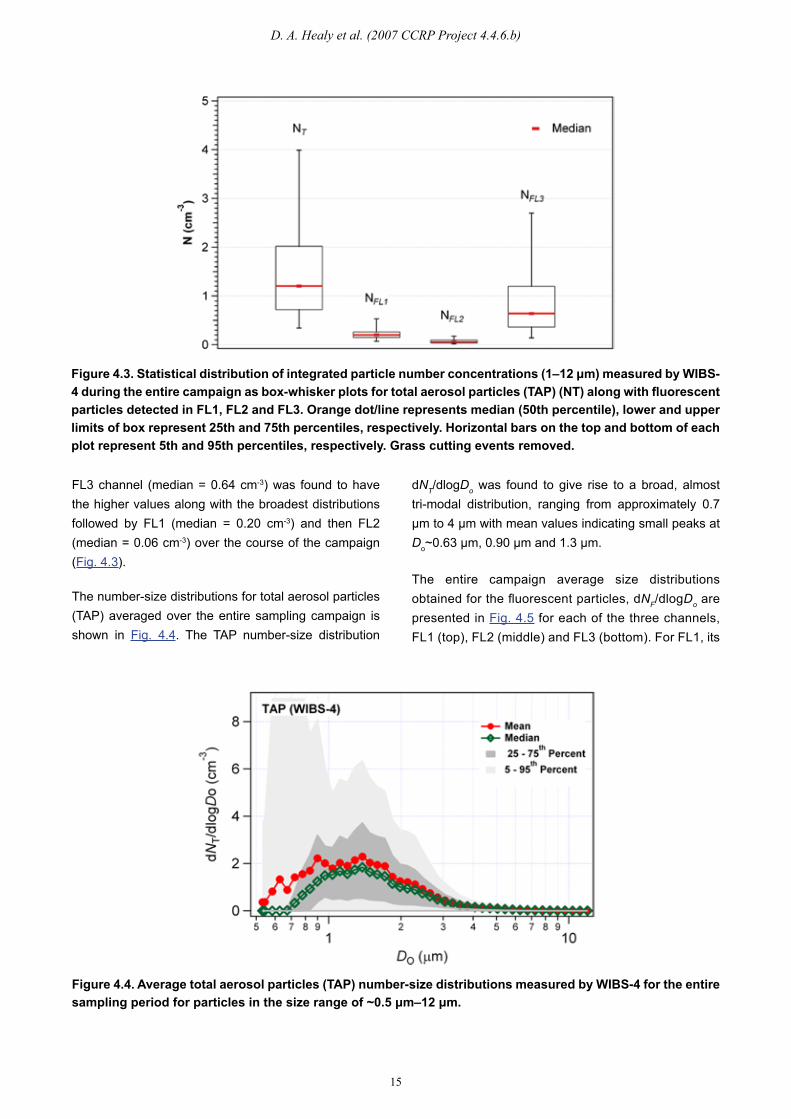
Figure 4.3. Statistical distribution of integrated particle number concentrations (1–12 μm) measured by WIBS-4 during the entire campaign as box-whisker plots for total aerosol particles (TAP) (NT) along with fluorescent particles detected in FL1, FL2 and FL3. Orange dot/line represents median (50th percentile), lower and upper limits of box represent 25th and 75th percentiles, respectively. Horizontal bars on the top and bottom of each plot represent 5th and 95th percentiles, respectively. Grass cutting events removed.
FL3 channel (median = 0.64 cm-3) was found to have the higher values along with the broadest distributions followed by FL1 (median = 0.20 cm-3) and then FL2 (median = 0.06 cm-3) over the course of the campaign (Fig. 4.3).
dNT/dlogDo was found to give rise to a broad, almost tri-modal distribution, ranging from approximately 0.7 μm to 4 μm with mean values indicating small peaks at Do~0.63 μm, 0.90 μm and 1.3 μm.
Figure 4.4. Average total aerosol particles (TAP) number-size distributions measured by WIBS-4 for the entire sampling period for particles in the size range of ~0.5 μm–12 μm.
The number-size distributions for total aerosol particles (TAP) averaged over the entire sampling campaign is shown in Fig. 4.4. The TAP number-size distribution
16
A New Approach to Bioaerosol Monitoring in Ireland
campaign average size distribution was broad, where mean Do values peaked at 0.62 μm, 0.89 μm and 1.38 μm with shoulder peaks also noted, e.g. at ~2.2 μm. The campaign mean particle number-size distribution obtained in FL2 was generally bimodal with structured peaks centred between Do ~2.2– 3.2 μm and 1.1–1.4 μm, with the latter size range showing a shoulder peak centred on ~0.96 μm. Similarly, FL3 demonstrated a feature with median values peaking between 2.6 and 5.8 μm. However, mean values showed a large range
Figure 4.5. Average fluorescent biological aerosol particles (FBAP) particle number-size distributions measured by WIBS-4 for FL1 (top), FL2 (middle) and FL3 (bottom) for the entire sampling period.
Specific fluorescent particle events were recorded by both bioaerosol sensors (WIBS-4 and UV-APS), during the period 24–27 August 2010 and species identified using the SporeWatch. However, differences in number concentrations and size distributions did exist.
of sizes with a broad ‘peak’ ranging between ~0.8μm and 10 μm. A sharper peak was also noted at 12 μm, suggesting the presence of some larger PBAPs – most likely pollen types – during the measurement period.
17
D. A. Healy et al. (2007 CCRP Project 4.4.6.b)
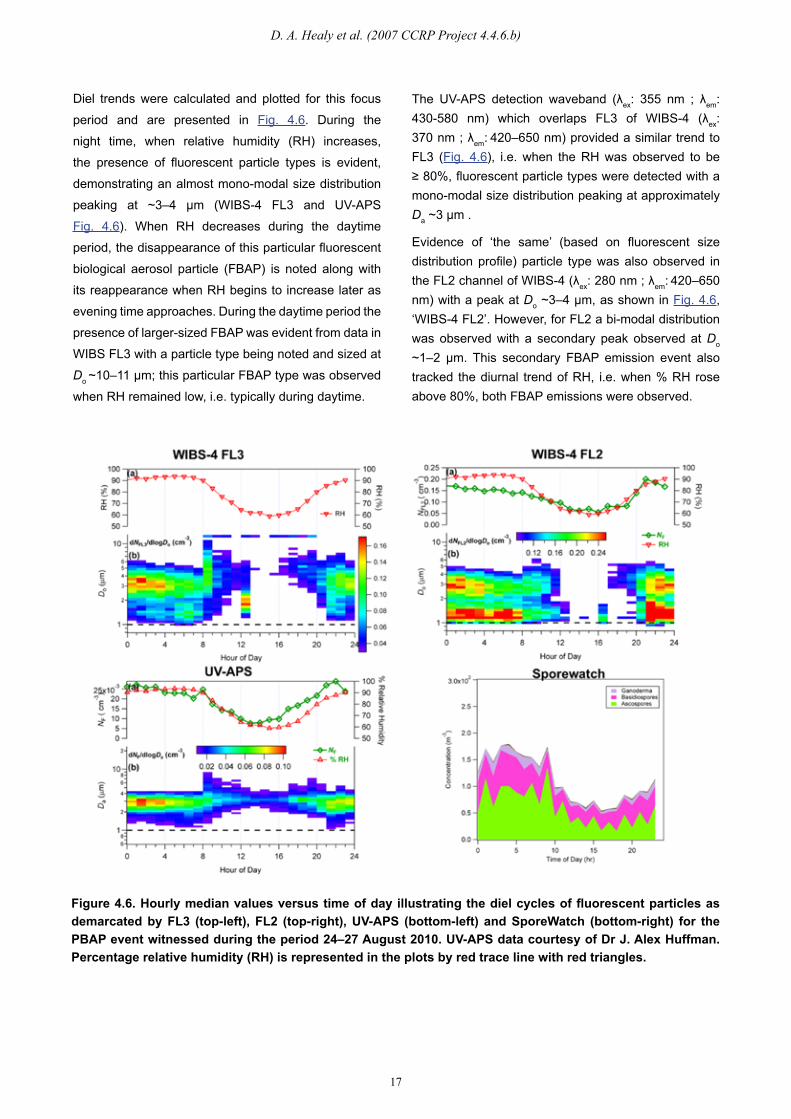
Figure 4.6. Hourly median values versus time of day illustrating the diel cycles of fluorescent particles as demarcated by FL3 (top-left), FL2 (top-right), UV-APS (bottom-left) and SporeWatch (bottom-right) for the PBAP event witnessed during the period 24–27 August 2010. UV-APS data courtesy of Dr J. Alex Huffman. Percentage relative humidity (RH) is represented in the plots by red trace line with red triangles.
Diel trends were calculated and plotted for this focus
period and are presented in Fig. 4.6. During the
night time, when relative humidity (RH) increases,
the presence of fluorescent particle types is evident,
demonstrating an almost mono-modal size distribution
peaking at ~3–4 µm (WIBS-4 FL3 and UV-APS
Fig. 4.6). When RH decreases during the daytime
period, the disappearance of this particular fluorescent
biological aerosol particle (FBAP) is noted along with
its reappearance when RH begins to increase later as
evening time approaches. During the daytime period the
presence of larger-sized FBAP was evident from data in
WIBS FL3 with a particle type being noted and sized at
Do ~10–11 µm; this particular FBAP type was observed
when RH remained low, i.e. typically during daytime.
The UV-APS detection waveband (λex: 355 nm ; λem:
430-580 nm) which overlaps FL3 of WIBS-4 (λex: 370 nm ; λem: 420–650 nm) provided a similar trend to FL3 (Fig. 4.6), i.e. when the RH was observed to be ≥ 80%, fluorescent particle types were detected with a mono-modal size distribution peaking at approximately Da ~3 µm .
Evidence of ‘the same’ (based on fluorescent size distribution profile) particle type was also observed in the FL2 channel of WIBS-4 (λex: 280 nm ; λem: 420–650 nm) with a peak at Do ~3–4 µm, as shown in Fig. 4.6, ‘WIBS-4 FL2’. However, for FL2 a bi-modal distribution was observed with a secondary peak observed at Do ~1–2 µm. This secondary FBAP emission event also tracked the diurnal trend of RH, i.e. when % RH rose above 80%, both FBAP emissions were observed.
18
A New Approach to Bioaerosol Monitoring in Ireland
The FBAP species observed by WIBS (FL2 & FL3) and the UV-APS were identified by exploiting the SporeWatch/Optical Microscopy technique as: ascospores, basidiospores and Ganoderma (Fig. 4.6), ‘SporeWatch’. These species were the only ones examined (out of a total of 12) that tracked a similar trend as % RH. The results suggest, based on an assessment of the correlation coefficients (see Final Project Report) obtained, that the specie evident in the WIBS FL3 channel and the UV-APS data were basidiospores or Ganoderma while the second specie observed only in WIBS FL2 could be ascospores.
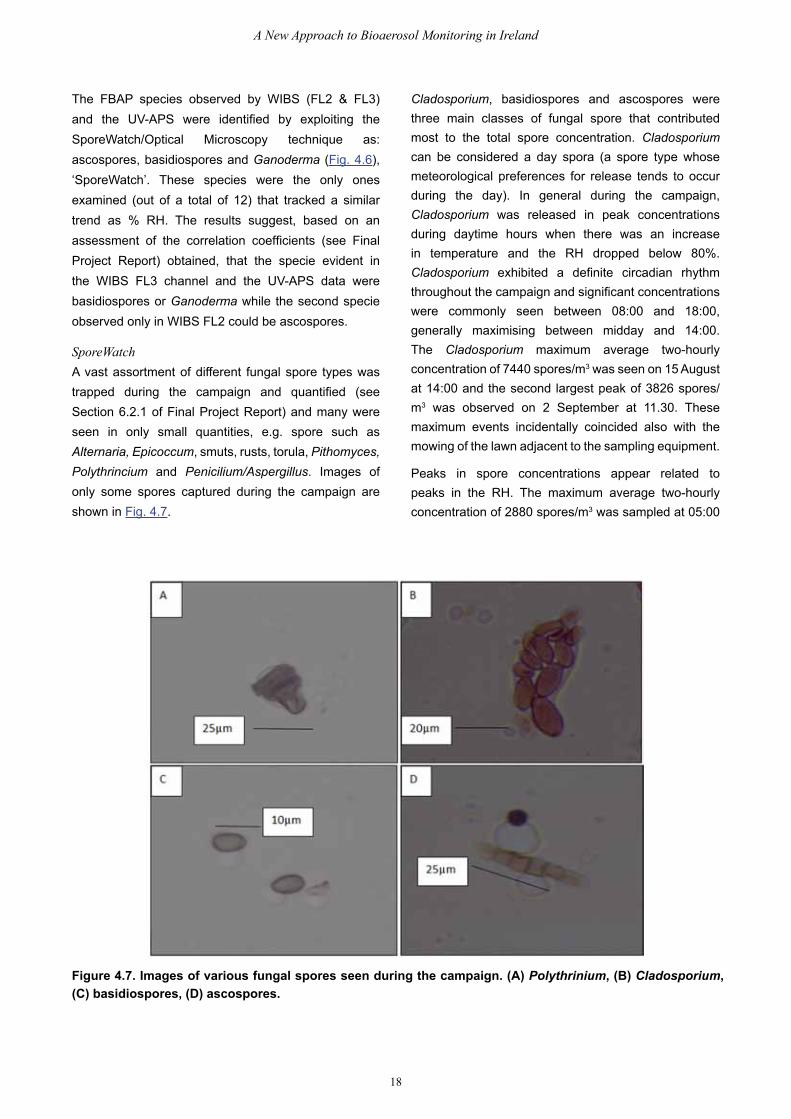
SporeWatchA vast assortment of different fungal spore types was trapped during the campaign and quantified (see Section 6.2.1 of Final Project Report) and many were seen in only small quantities, e.g. spore such as Alternaria, Epicoccum, smuts, rusts, torula, Pithomyces, Polythrincium and Penicilium/Aspergillus. Images of only some spores captured during the campaign are shown in Fig. 4.7.
Cladosporium, basidiospores and ascospores were three main classes of fungal spore that contributed most to the total spore concentration. Cladosporium can be considered a day spora (a spore type whose meteorological preferences for release tends to occur during the day). In general during the campaign, Cladosporium was released in peak concentrations during daytime hours when there was an increase in temperature and the RH dropped below 80%. Cladosporium exhibited a definite circadian rhythm throughout the campaign and significant concentrations were commonly seen between 08:00 and 18:00, generally maximising between midday and 14:00. The Cladosporium maximum average two-hourly concentration of 7440 spores/m3 was seen on 15 August at 14:00 and the second largest peak of 3826 spores/m3 was observed on 2 September at 11.30. These maximum events incidentally coincided also with the mowing of the lawn adjacent to the sampling equipment.
Peaks in spore concentrations appear related to peaks in the RH. The maximum average two-hourly concentration of 2880 spores/m3 was sampled at 05:00
Figure 4.7. Images of various fungal spores seen during the campaign. (A) Polythrinium, (B) Cladosporium, (C) basidiospores, (D) ascospores.
19
D. A. Healy et al. (2007 CCRP Project 4.4.6.b)
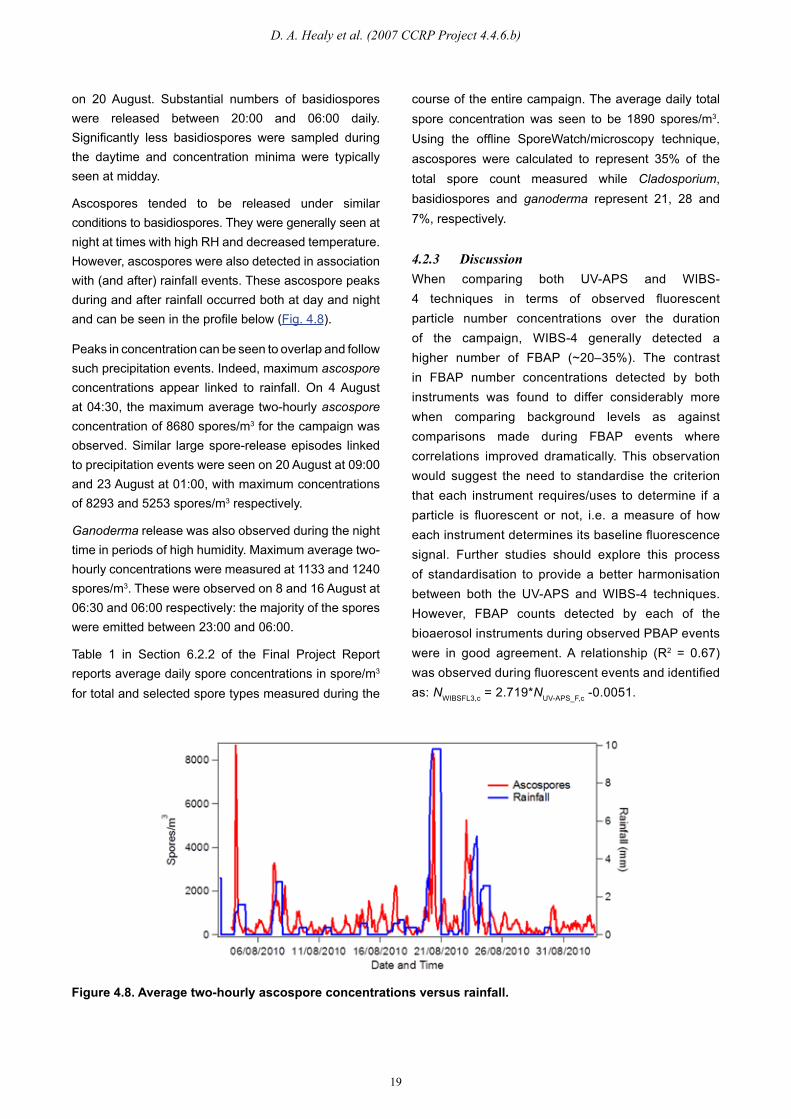
Figure 4.8. Average two-hourly ascospore concentrations versus rainfall.
on 20 August. Substantial numbers of basidiospores were released between 20:00 and 06:00 daily. Significantly less basidiospores were sampled during the daytime and concentration minima were typically seen at midday.
Ascospores tended to be released under similar conditions to basidiospores. They were generally seen at night at times with high RH and decreased temperature. However, ascospores were also detected in association with (and after) rainfall events. These ascospore peaks during and after rainfall occurred both at day and night and can be seen in the profile below (Fig. 4.8).
course of the entire campaign. The average daily total spore concentration was seen to be 1890 spores/m3. Using the offline SporeWatch/microscopy technique, ascospores were calculated to represent 35% of the total spore count measured while Cladosporium, basidiospores and ganoderma represent 21, 28 and 7%, respectively.
4.2.3 DiscussionWhen comparing both UV-APS and WIBS-4 techniques in terms of observed fluorescent particle number concentrations over the duration of the campaign, WIBS-4 generally detected a higher number of FBAP (~20–35%). The contrast in FBAP number concentrations detected by both instruments was found to differ considerably more when comparing background levels as against comparisons made during FBAP events where correlations improved dramatically. This observation would suggest the need to standardise the criterion that each instrument requires/uses to determine if a particle is fluorescent or not, i.e. a measure of how each instrument determines its baseline fluorescence signal. Further studies should explore this process of standardisation to provide a better harmonisation between both the UV-APS and WIBS-4 techniques. However, FBAP counts detected by each of the bioaerosol instruments during observed PBAP events were in good agreement. A relationship (R2 = 0.67) was observed during fluorescent events and identified as: NWIBSFL3,c = 2.719*NUV-APS_F,c -0.0051.
Peaks in concentration can be seen to overlap and follow such precipitation events. Indeed, maximum ascospore concentrations appear linked to rainfall. On 4 August at 04:30, the maximum average two-hourly ascospore concentration of 8680 spores/m3 for the campaign was observed. Similar large spore-release episodes linked to precipitation events were seen on 20 August at 09:00 and 23 August at 01:00, with maximum concentrations of 8293 and 5253 spores/m3 respectively.
Ganoderma release was also observed during the night time in periods of high humidity. Maximum average two-hourly concentrations were measured at 1133 and 1240 spores/m3. These were observed on 8 and 16 August at 06:30 and 06:00 respectively: the majority of the spores were emitted between 23:00 and 06:00.
Table 1 in Section 6.2.2 of the Final Project Report reports average daily spore concentrations in spore/m3 for total and selected spore types measured during the
20
A New Approach to Bioaerosol Monitoring in Ireland
4.2.4 ConclusionsThe WIBS-4 can be successfully deployed in a field environment that is rich in PBAP. The results obtained show a clear ability to detect fungal spores when compared to the use of traditional, long time-scale techniques and to relate such releases to meteorological data such as % RH. WIBS-4 data was found to demonstrate very good agreement with the UV-APS results during FBAP events where the emission wavebands overlapped, i.e. FL3 for WIBS. However, the UV-APS does appear to be blind to some PBAP species that the WIBS-4 with its multi-wavelength approach can register. For example, this finding was demonstrated during the FBAP events monitored on 24–27 August 2010 in KNP when WIBS FL2 channel data were considered and indicated that PBAP in two size ranges could be detected, both of which could be identified as known fungal species.
Fluorescent biological aerosol particles (FBAPs) in the size range (1–12 μm) according to FL1, FL2 and FL3 were found to account for 15%, 5% and 64%, respectively at KNP, which represents an Irish rural national park environment with very low contributions from human activity (except lawn maintenance).
Overall, the results in terms of particle numbers indicate that there was a background contribution of FBAP in the size range 1–12 μm, which was found to be present during the entire campaign.
4.3 Tivoli Docks Industrial Estate
4.3.1 IntroductionCertain particles exist in the atmosphere that possess similar fluorescence properties to PBAPs. For example, soot is one material that contains fluorescent PAHs. This increases the likelihood of Ultra Violet-Light/Laser Induced Fluorescence (UV-LIF) techniques reporting potentially false positives under certain environmental influences. To investigate the potential effects of such interferents on the WIBS spectroscopic technique, WIBS-4 was deployed in an industrial urban site (Tivoli) located approximately 3 km east of Cork city. The duration of the measurement campaign was 29 May–25 June
2009. As noted above, Tivoli Docks Industrial Estate is directly influenced by shipping, heavy goods and other industrial related emissions. Only a skeletal form of the results are presented in the current Synthesis Report and therefore reference to the Final Project Report should be made where further clarity and detail are needed.
A summary of the results is presented in terms of the observed ambient particle numbers concentration levels, trends, local events and also variability between super- and sub-micron size fractions. A necessary comparison is also made between the super-micron fluorescent particle number concentrations observed at this heavily industrialised site, and those witnessed in KNP, which, as noted above, has a very low anthropogenic contribution.
4.3.2 Summary of key findingsWIBS-4The maximum integrated coarse number concentrations reached in FL1, FL2 and FL3 were found to be 4.5 cm-3, 10.7 cm-3 and 2.4 cm-3 respectively with background levels dropping to <0.03 cm-3, <0.09 cm-3, <0.02 cm-3, respectively for each FL channel.
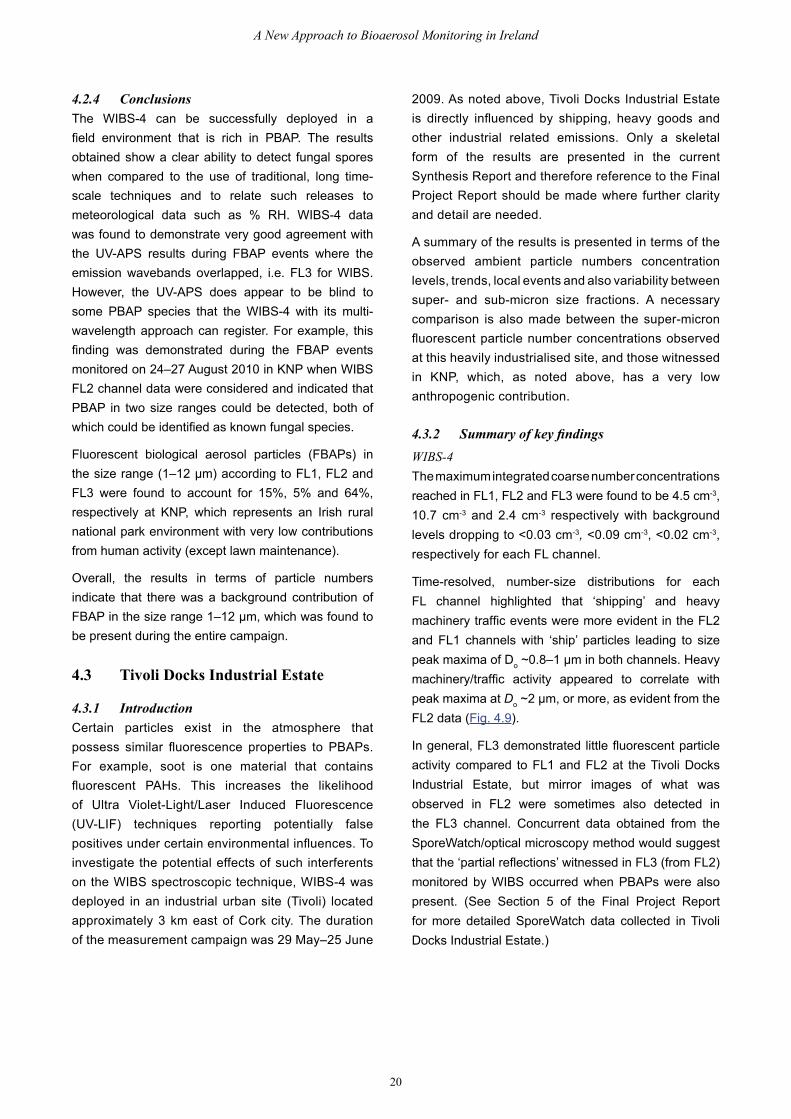
Time-resolved, number-size distributions for each FL channel highlighted that ‘shipping’ and heavy machinery traffic events were more evident in the FL2 and FL1 channels with ‘ship’ particles leading to size peak maxima of Do ~0.8–1 µm in both channels. Heavy machinery/traffic activity appeared to correlate with peak maxima at Do ~2 µm, or more, as evident from the FL2 data (Fig. 4.9).
In general, FL3 demonstrated little fluorescent particle activity compared to FL1 and FL2 at the Tivoli Docks Industrial Estate, but mirror images of what was observed in FL2 were sometimes also detected in the FL3 channel. Concurrent data obtained from the SporeWatch/optical microscopy method would suggest that the ‘partial reflections’ witnessed in FL3 (from FL2) monitored by WIBS occurred when PBAPs were also present. (See Section 5 of the Final Project Report for more detailed SporeWatch data collected in Tivoli Docks Industrial Estate.)
21
D. A. Healy et al. (2007 CCRP Project 4.4.6.b)
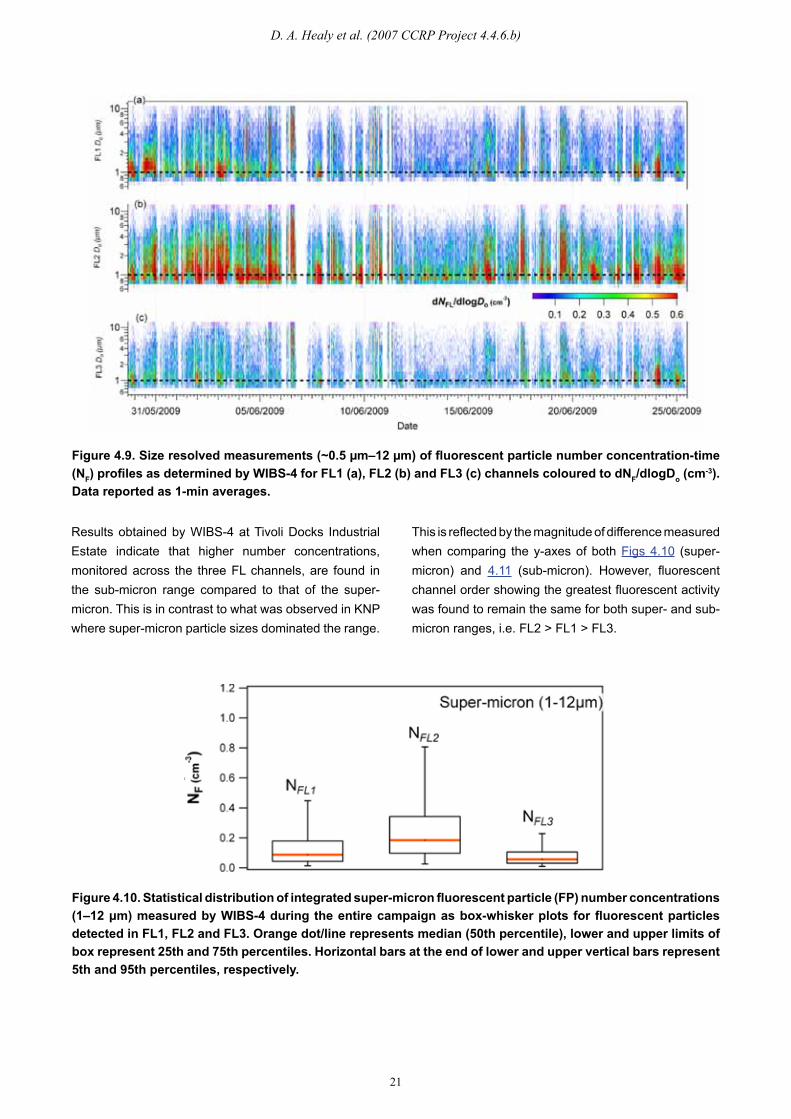
Results obtained by WIBS-4 at Tivoli Docks Industrial Estate indicate that higher number concentrations, monitored across the three FL channels, are found in the sub-micron range compared to that of the super-micron. This is in contrast to what was observed in KNP where super-micron particle sizes dominated the range.
Figure 4.9. Size resolved measurements (~0.5 µm–12 µm) of fluorescent particle number concentration-time (NF) profiles as determined by WIBS-4 for FL1 (a), FL2 (b) and FL3 (c) channels coloured to dNF/dlogDo (cm-3). Data reported as 1-min averages.
This is reflected by the magnitude of difference measured when comparing the y-axes of both Figs 4.10 (super-micron) and 4.11 (sub-micron). However, fluorescent channel order showing the greatest fluorescent activity was found to remain the same for both super- and sub-micron ranges, i.e. FL2 > FL1 > FL3.
Figure 4.10. Statistical distribution of integrated super-micron fluorescent particle (FP) number concentrations (1–12 μm) measured by WIBS-4 during the entire campaign as box-whisker plots for fluorescent particles detected in FL1, FL2 and FL3. Orange dot/line represents median (50th percentile), lower and upper limits of box represent 25th and 75th percentiles. Horizontal bars at the end of lower and upper vertical bars represent 5th and 95th percentiles, respectively.

22
A New Approach to Bioaerosol Monitoring in Ireland
Figure 4.11. Statistical distribution of integrated sub-micron fluorescent particle (FP) number concentrations (~0.5–1 μm) measured by WIBS-4 during the entire campaign at Tivoli Docks Industrial Estate, as box-whisker plots for fluorescent particles detected in FL1, FL2 and FL3.
Figure 4.12. Statistical distribution of integrated total aerosol particle (TAP) number concentrations of both sub- (~0.5–1 μm) and super-micron (1–12 μm) measured by WIBS-4 during the entire campaign at Tivoli Docks Industrial Estate box-whisker plots. Orange dot/line represents median (50th percentile), lower and upper limits of box represent 25th and 75th percentiles. Horizontal bars at the end of lower and upper vertical bars represent 5th and 95th percentiles, respectively.
Sub-micron particles were found to show not only higher median NT values, but also higher relative variability, as reflected in the size of the 5–95th percentile bars in Fig. 4.12.
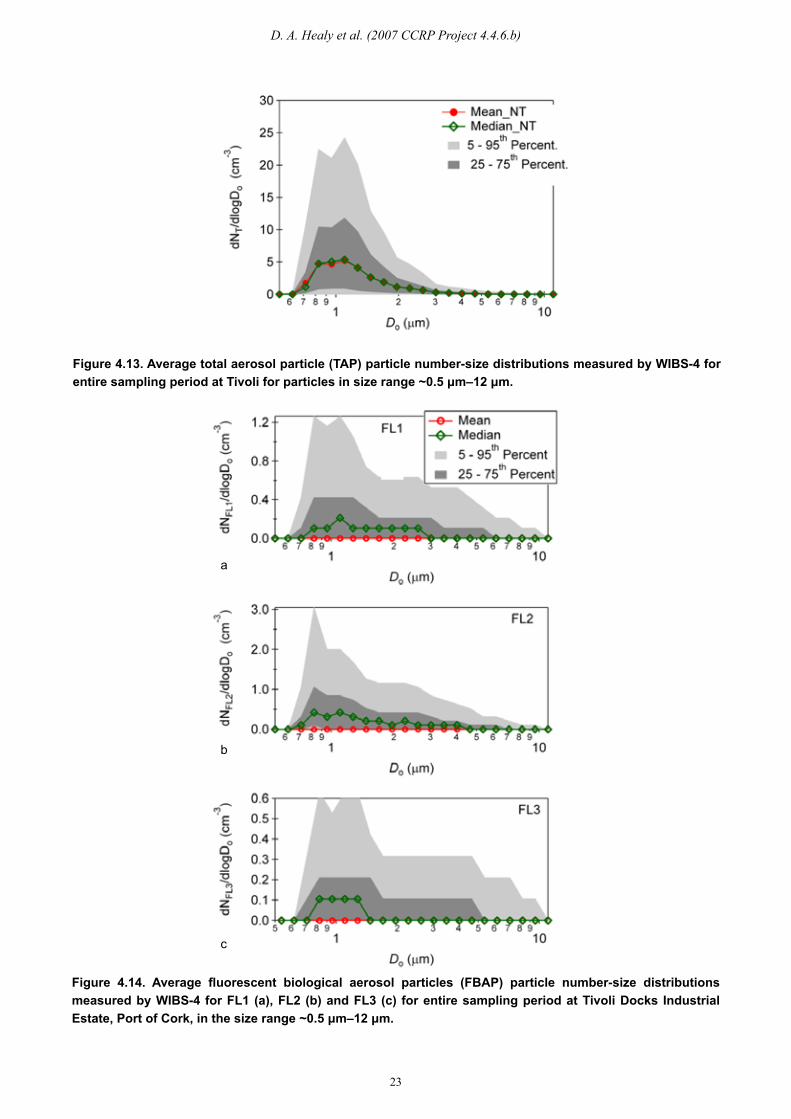
The number-size distribution for TAP averaged over the entire sampling campaign at Tivoli is shown in Fig. 4.13. The TAP number-size distribution dNT/dlogDo was found to demonstrate an almost bimodal distribution, showing peaks at approximately Do ~0.83 µm and 1.2 µm. The lower end of the distribution (lower size bins ≤0.67 µm) is more than likely representative of the WIBS’ decreased detection sensitivity for small particles at Do ≤0.67 µm. Therefore, it should be emphasised that the results do not indicate few or no particles present at Do <0.67 µm.
For FL2, the campaign average number-size distribution showed a positive skew with peaks noted (median) at Do ~0.8 µm, 1.1 µm and 2.3 µm. FL3 indicated a more structured almost bimodal distribution, with the most obvious peak ranging between Do ~0.7 µm and 1.5 µm.
The campaign average number-size distributions of fluorescent particles, dNF/dlogDo for each of the three fluorescent channels, FL1 (top) , FL2 (middle) and FL3 (bottom) are presented in Fig. 4.14. The campaign average number-size distribution for FL1 demonstrated a broad distribution (Do ~0.7 µm–3 µm) according to median values, with a peak noted at Do ~1.1 µm.
23
D. A. Healy et al. (2007 CCRP Project 4.4.6.b)
Figure 4.13. Average total aerosol particle (TAP) particle number-size distributions measured by WIBS-4 for entire sampling period at Tivoli for particles in size range ~0.5 μm–12 μm.
Figure 4.14. Average fluorescent biological aerosol particles (FBAP) particle number-size distributions measured by WIBS-4 for FL1 (a), FL2 (b) and FL3 (c) for entire sampling period at Tivoli Docks Industrial Estate, Port of Cork, in the size range ~0.5 μm–12 μm.
a
b
c

24
A New Approach to Bioaerosol Monitoring in Ireland
During the measurement campaign at the Tivoli Docks site, the total particle number concentration, NT, exhibited highly variable large spikes and strong day-to-day variations. Throughout the campaign a typical weekend particle type emission was registered in NT but not in FLs 1–3. A similar weekend ‘phenomenon’ was also witnessed in PM10 and NOx data reported in Section 4.3 of the current report, the analysis of which is based on year-long data collections compared to one month of data as presented here. A characteristic TAP size resolved particle number profile pattern was detected by WIBS-4 at the Tivoli sampling site (Fig. 4.15). Highest NTs were reached typically around midnight during the weekend (Friday–Monday), as shown in Fig. 4.15 (a). This characteristic weekend particle emission was found only in the TAP results and was not observed in any of the FL channels of WIBS-4, indicating that the particle type being emitted was not fluorescent in the two emission wavebands utilised by the WIBS spectroscopic technique. Furthermore, the emission particle type discussed here was most obvious when the wind direction was south-westerly, as found for example on the 12–15 June 2009 (Fig. 4.15). It is of note that, in a direction south-west to the receptor site, is the location of the Marina Industrial Estate where, for example, the Electricity Supply Board’s Marina Generating Station is located, amongst other industries.
SporeWatchThe SporeWatch instrument was deployed at the Tivoli site between the dates of 3–8 June and 4–8 August 2009. A visual example of the particle types typically collected at Tivoli during morning rush-hour time period are presented in Fig. 4.16. Images such as those in Fig. 4.16 are not observed at any time of day except rush hour. Mineral dust is far more prevalent throughout the day and can be seen in most images taken, regardless of the time. This finding can be explained, in part, by the harbour location of the site and the re-suspension of PM by vehicular movements.
Figure 4.16. Image of combustion products and mineral dust from Tivoli Docks sampling campaign.
Figure 4.15. Characteristic total aerosol particle (TAP) number-size distribution patterns observed during weekend (Friday–Monday) period throughout measurement campaign (left); where (a) one minute averages of TAP (number concentration [NT]), black trace. (b) TAP size distribution with optical diameter on y-axis and coloured according to dNT/dlogDo. Data is representative of one-minute averages. Period chosen for demonstration above is 12–15 June 2009. Dependence of the TAP number concentration detected by WIBS-4 on wind direction with a temporal resolution of 1 min during the ‘weekend particle event’ observed during the campaign, right.
(b)
25
D. A. Healy et al. (2007 CCRP Project 4.4.6.b)
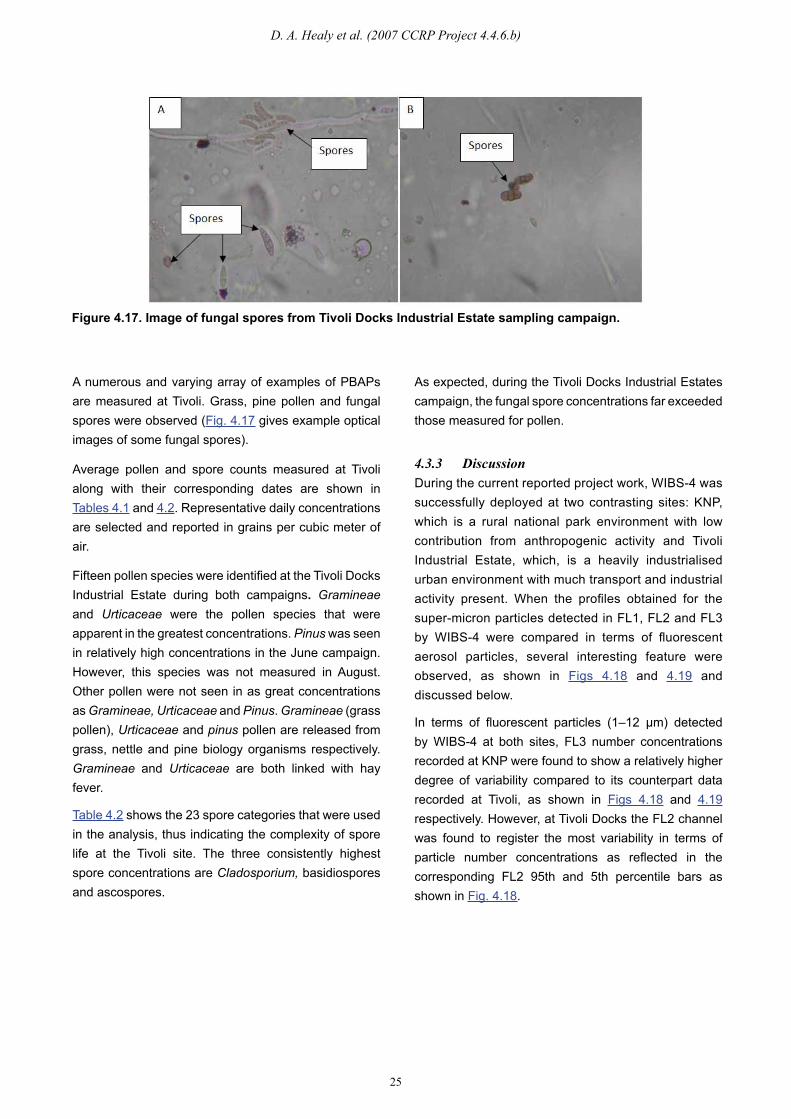
A numerous and varying array of examples of PBAPs are measured at Tivoli. Grass, pine pollen and fungal spores were observed (Fig. 4.17 gives example optical images of some fungal spores).
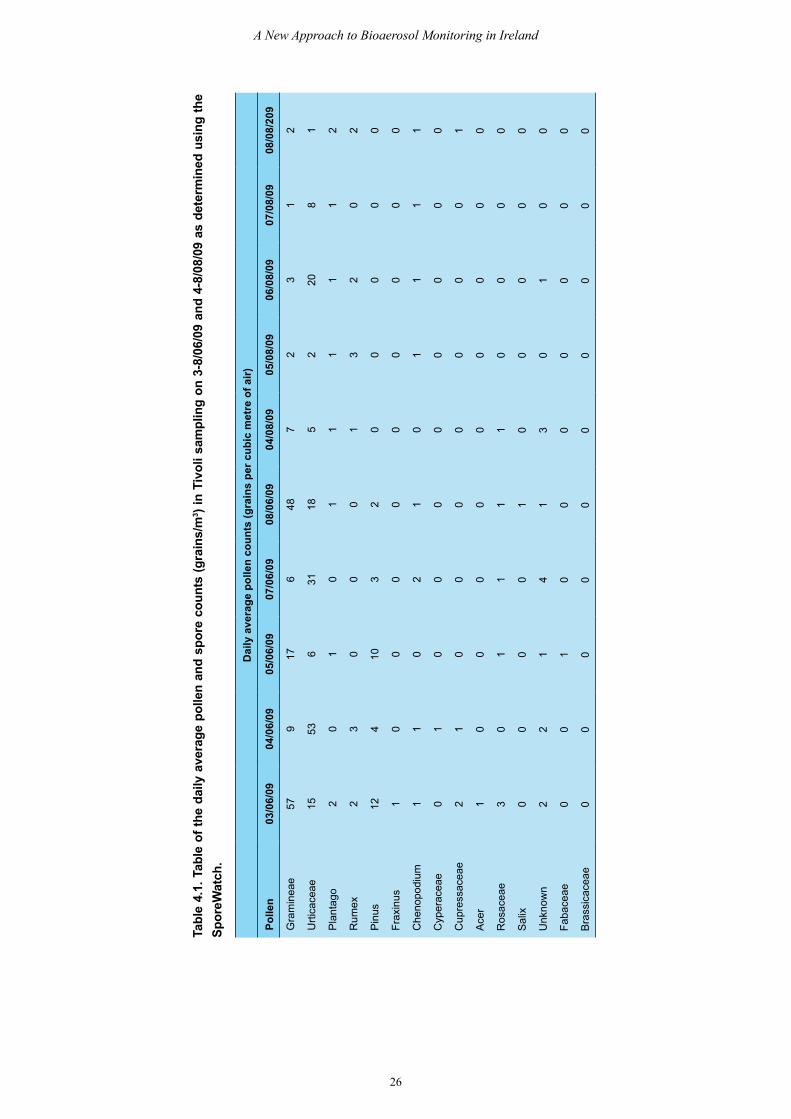
Average pollen and spore counts measured at Tivoli along with their corresponding dates are shown in Tables 4.1 and 4.2. Representative daily concentrations are selected and reported in grains per cubic meter of air.
Figure 4.17. Image of fungal spores from Tivoli Docks Industrial Estate sampling campaign.
Fifteen pollen species were identified at the Tivoli Docks Industrial Estate during both campaigns. Gramineae and Urticaceae were the pollen species that were apparent in the greatest concentrations. Pinus was seen in relatively high concentrations in the June campaign. However, this species was not measured in August. Other pollen were not seen in as great concentrations as Gramineae, Urticaceae and Pinus. Gramineae (grass pollen), Urticaceae and pinus pollen are released from grass, nettle and pine biology organisms respectively. Gramineae and Urticaceae are both linked with hay fever.
Table 4.2 shows the 23 spore categories that were used in the analysis, thus indicating the complexity of spore life at the Tivoli site. The three consistently highest spore concentrations are Cladosporium, basidiospores and ascospores.
As expected, during the Tivoli Docks Industrial Estates campaign, the fungal spore concentrations far exceeded those measured for pollen.
4.3.3 Discussion During the current reported project work, WIBS-4 was successfully deployed at two contrasting sites: KNP, which is a rural national park environment with low contribution from anthropogenic activity and Tivoli Industrial Estate, which, is a heavily industrialised urban environment with much transport and industrial activity present. When the profiles obtained for the super-micron particles detected in FL1, FL2 and FL3 by WIBS-4 were compared in terms of fluorescent aerosol particles, several interesting feature were observed, as shown in Figs 4.18 and 4.19 and discussed below.
In terms of fluorescent particles (1–12 µm) detected by WIBS-4 at both sites, FL3 number concentrations recorded at KNP were found to show a relatively higher degree of variability compared to its counterpart data recorded at Tivoli, as shown in Figs 4.18 and 4.19 respectively. However, at Tivoli Docks the FL2 channel was found to register the most variability in terms of particle number concentrations as reflected in the corresponding FL2 95th and 5th percentile bars as shown in Fig. 4.18.
26
A New Approach to Bioaerosol Monitoring in Ireland
Tabl
e 4.
1. T
able
of t
he d
aily
ave
rage
pol
len
and
spor
e co
unts
(gra
ins/
m3 )
in T
ivol
i sam
plin
g on
3-8
/06/
09 a
nd 4
-8/0
8/09
as
dete
rmin
ed u
sing
the
Spor
eWat
ch.
Dai
ly a
vera
ge p
olle
n co
unts
(gra
ins
per c
ubic
met
re o
f air)
Polle
n03
/06/
0904
/06/
0905
/06/
0907
/06/
0908
/06/
0904
/08/
0905
/08/
0906
/08/
0907
/08/
0908
/08/
209
Gra
min
eae
579
176
487
23
12
Urti
cace
ae15
536
3118
52
208
1
Pla
ntag
o2
01
01
11
11
2
Rum
ex2
30
00
13
20
2
Pin
us12
410
32
00
00
0
Frax
inus
10
00
00
00
00
Che
nopo
dium
11
02
10
11
11
Cyp
erac
eae
01
00
00
00
00
Cup
ress
acea
e2
10
00
00
00
1
Ace
r1
00
00
00
00
0
Ros
acea
e3
01
11
10
00
0
Sal
ix0
00
01
00
00
0
Unk
now
n2
21
41
30
10
0
Faba
ceae
00
10
00
00
00
Bra
ssic
acea
e0
00
00
00
00
0
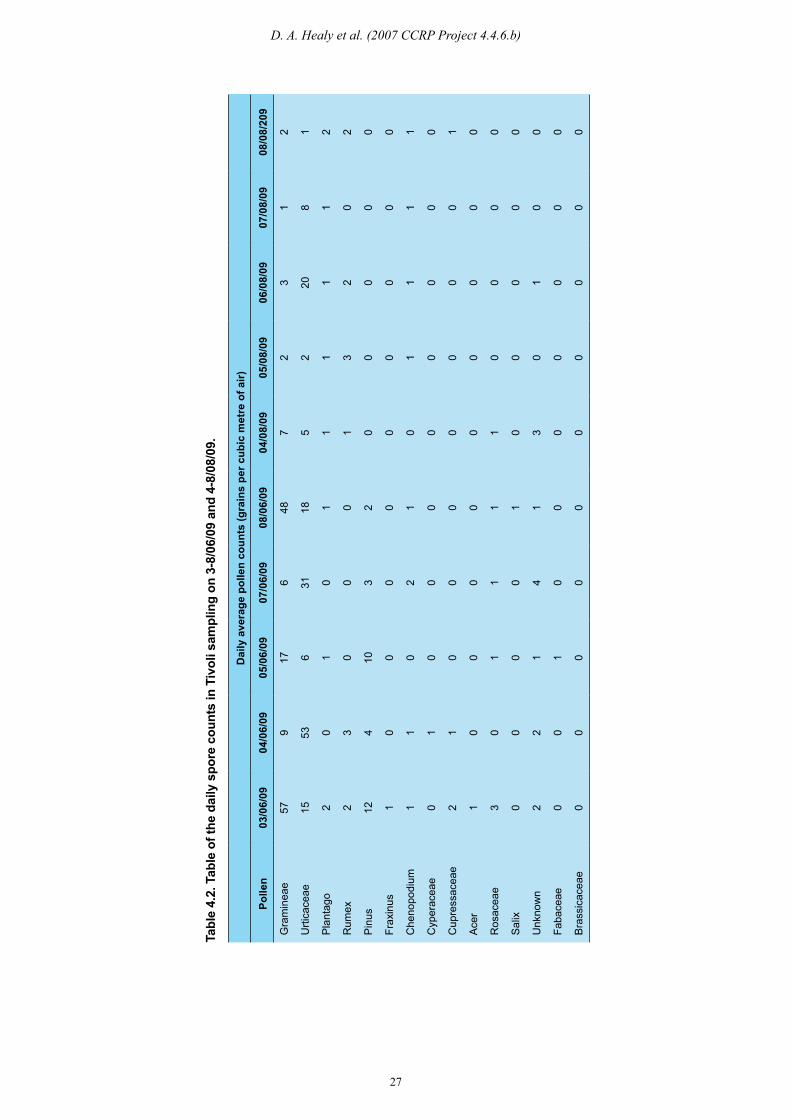
27
D. A. Healy et al. (2007 CCRP Project 4.4.6.b)
Tabl
e 4.
2. T
able
of t
he d
aily
spo
re c
ount
s in
Tiv
oli s
ampl
ing
on 3
-8/0
6/09
and
4-8
/08/
09.
Dai
ly a
vera
ge p
olle
n co
unts
(gra
ins
per c
ubic
met
re o
f air)
Polle
n03
/06/
0904
/06/
0905
/06/
0907
/06/
0908
/06/
0904
/08/
0905
/08/
0906
/08/
0907
/08/
0908
/08/
209
Gra
min
eae
579
176
487
23
12
Urti
cace
ae15
536
3118
52
208
1
Pla
ntag
o2
01
01
11
11
2
Rum
ex2
30
00
13
20
2
Pin
us12
410
32
00
00
0
Frax
inus
10
00
00
00
00
Che
nopo
dium
11
02
10
11
11
Cyp
erac
eae
01
00
00
00
00
Cup
ress
acea
e2
10
00
00
00
1
Ace
r1
00
00
00
00
0
Ros
acea
e3
01
11
10
00
0
Sal
ix0
00
01
00
00
0
Unk
now
n2
21
41
30
10
0
Faba
ceae
00
10
00
00
00
Bra
ssic
acea
e0
00
00
00
00
0

28
A New Approach to Bioaerosol Monitoring in Ireland
Figure 4.18. Campaign average statistical distribution of integrated coarse particle number concentrations (1–12 μm) measured by WIBS-4 during the entire campaign at Tivoli, June 2009 as box-whisker plots for fluorescent particles detected in FL1, FL2 and FL3. Orange dot/line represents median (50th percentile), lower and upper limits of box represent 25th and 75th percentiles, respectively. Horizontal bars on the top and bottom of each plot represent 5th and 95th percentiles, respectively.
Figure 4.19. Campaign average statistical distribution of integrated coarse particle number concentrations (1–12 μm) measured by WIBS-4 during the entire campaign at Killarney National Park, August 2010 as box-whisker plots for fluorescent particles detected in FL1, FL2 and FL3 (plot is analogous to Fig. 4.18).
At KNP the campaign average number concentration for FL3 (>1 µm) was calculated as NFL3,c ~ 0.96cm-3 but at Tivoli the same value was calculated to be NFL3,c ~ 0.1 cm-3 (Table 4.3).
Therefore, using fluorescence intensity signals as a proxy to measure the contribution of PBAPs to the Irish ambient number concentrations, it can be concluded that an Irish rural national park environment contributes up to ~64 % to ambient particle (super-micron) number concentrations compared to ~4% in an urban industrial environment. It is of note that these values can be
taken as a lower limit value since they do not include sub-micron PBAP and employ only one fluorescence channel, FL3, because of potential interference to the fluorescence signals by non-PBAPs such as PAHs in FL1 and FL2.
As expected when comparing mean NT,c at both sites (>1 µm) it was found that the industrialised site, Tivoli, showed a higher number concentration of integrated coarse total particle number concentrations when averaging over the entire campaign, i.e. for Tivoli: NT,c
~2.5 cm-3 and Killarney: NT,c ~1.5 cm-3.
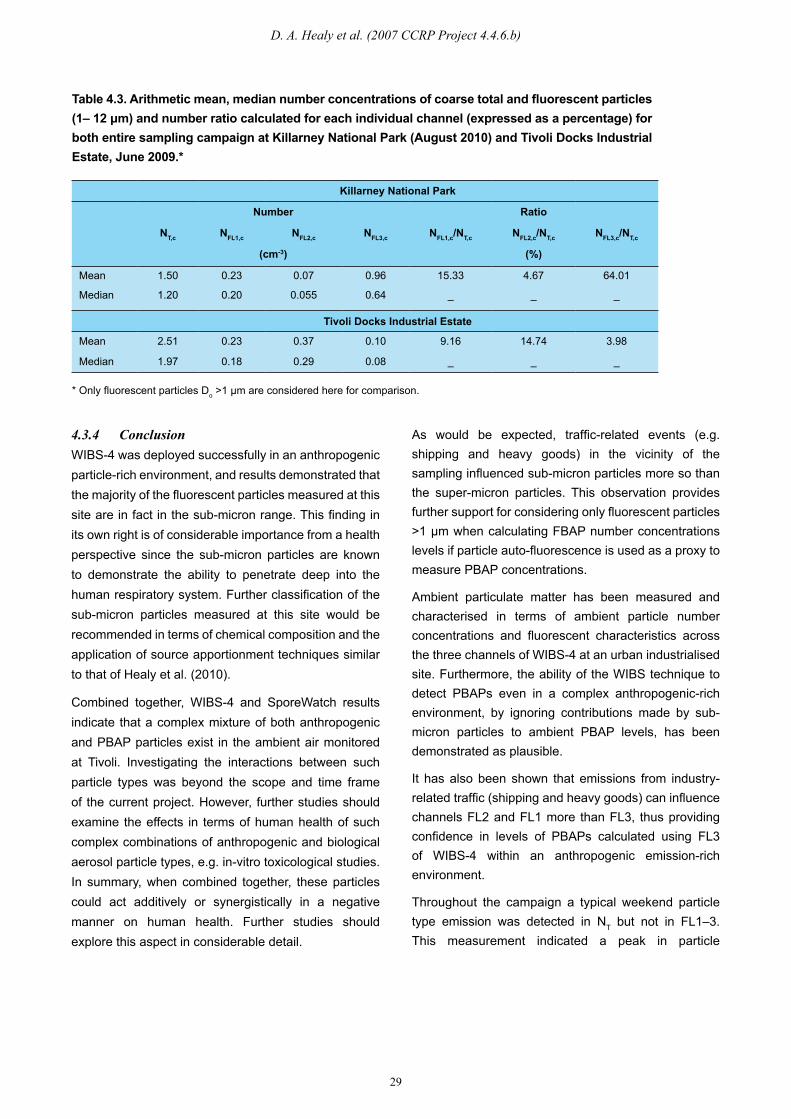
29
D. A. Healy et al. (2007 CCRP Project 4.4.6.b)
4.3.4 ConclusionWIBS-4 was deployed successfully in an anthropogenic particle-rich environment, and results demonstrated that the majority of the fluorescent particles measured at this site are in fact in the sub-micron range. This finding in its own right is of considerable importance from a health perspective since the sub-micron particles are known to demonstrate the ability to penetrate deep into the human respiratory system. Further classification of the sub-micron particles measured at this site would be recommended in terms of chemical composition and the application of source apportionment techniques similar to that of Healy et al. (2010).
Combined together, WIBS-4 and SporeWatch results indicate that a complex mixture of both anthropogenic and PBAP particles exist in the ambient air monitored at Tivoli. Investigating the interactions between such particle types was beyond the scope and time frame of the current project. However, further studies should examine the effects in terms of human health of such complex combinations of anthropogenic and biological aerosol particle types, e.g. in-vitro toxicological studies. In summary, when combined together, these particles could act additively or synergistically in a negative manner on human health. Further studies should explore this aspect in considerable detail.
Table 4.3. Arithmetic mean, median number concentrations of coarse total and fluorescent particles (1– 12 μm) and number ratio calculated for each individual channel (expressed as a percentage) for both entire sampling campaign at Killarney National Park (August 2010) and Tivoli Docks Industrial Estate, June 2009.*
Killarney National Park
Number Ratio
NT,c NFL1,c NFL2,c NFL3,c NFL1,c/NT,c NFL2,c/NT,c NFL3,c/NT,c
(cm-3) (%)
Mean 1.50 0.23 0.07 0.96 15.33 4.67 64.01
Median 1.20 0.20 0.055 0.64 _ _ _
Tivoli Docks Industrial Estate
Mean 2.51 0.23 0.37 0.10 9.16 14.74 3.98
Median 1.97 0.18 0.29 0.08 _ _ _
* Only fluorescent particles Do >1 µm are considered here for comparison.
As would be expected, traffic-related events (e.g. shipping and heavy goods) in the vicinity of the sampling influenced sub-micron particles more so than the super-micron particles. This observation provides further support for considering only fluorescent particles >1 µm when calculating FBAP number concentrations levels if particle auto-fluorescence is used as a proxy to measure PBAP concentrations.
Ambient particulate matter has been measured and characterised in terms of ambient particle number concentrations and fluorescent characteristics across the three channels of WIBS-4 at an urban industrialised site. Furthermore, the ability of the WIBS technique to detect PBAPs even in a complex anthropogenic-rich environment, by ignoring contributions made by sub-micron particles to ambient PBAP levels, has been demonstrated as plausible.
It has also been shown that emissions from industry-related traffic (shipping and heavy goods) can influence channels FL2 and FL1 more than FL3, thus providing confidence in levels of PBAPs calculated using FL3 of WIBS-4 within an anthropogenic emission-rich environment.
Throughout the campaign a typical weekend particle type emission was detected in NT but not in FL1–3. This measurement indicated a peak in particle

30
A New Approach to Bioaerosol Monitoring in Ireland
number concentration around midnight of each night of the weekend and was more evident when winds approached the sampling site from a south-westerly direction, i.e. from the direction of the Marina Industrial Estate located across the channel.
4.4 PM10 and NOx Monitoring Programme (Tivoli Docks Industrial Estate)
4.4.1 IntroductionThis section of the project report details the measurement of PM10 mass concentration and nitrogen oxides (NOx = NO + NO2) concentrations in ambient air analysed at Tivoli Docks Industrial Estate, Cork for the period between February 2008 and February 2010 (in the case of NOX) and February 2008 and March 2011 for PM10. These measurements can be taken in comparison to the EPA’s annual air quality report for 2010 (Air Quality in Ireland 2010 Key Indicators of Ambient Air Quality), which was published recently. Here, it was stated that while air quality across the country complied with EU standards, a concern remained regarding the levels of nitrogen dioxide and particulate matter emitted from traffic in the urban centres of Dublin and Cork. Although this report is in full agreement with the earlier findings of the EPA report, it also gives both weekend/weekday and seasonal trends of particulate levels and NOx. In addition, it provides a much longer-term (three to four year) review of air pollution trends in Cork. (A detailed presentation of the findings from the work package described here is presented in Section 5 of the Final Project Report.)
It should be restated here that due to space constraints the Synthesis Report presented here serves to present an overview of key findings of the BioCheA project. Further details are available in the full and comprehensive Final Project Report.
4.4.2 Summary of key findingsPM10 Table 4.4 displays the summary statistics for the PM10 dataset obtained. For each year, the annual mean measured for PM10 is below the limit value of 40 µg m-3 set out by the EU in the CAFÉ directive 2008/50/EC. There were 8 exceedances in each of the years 2008, 2009 and 2010 for the daily PM10 limit of 50 µg m-3. This number is below the 35 exceedances allowed annually. The deployment was started formally in February 2008 but reliable results were not obtained until early April of that year.
Table 4.4. Summary statistics for PM10 concentrations (in µg m-3) at the Tivoli Docks Industrial Estate site.
PM10 (µg m-3) 2008 2009 2010 2011*
Annual mean 26 20 21 28
Median 18 15 15 21
% data capture 23 84 96 18
Values >50 µg m-3 8 8 8 5
Values >35 µg m-3 (UAT) 18 19 40 18
Values >25 µg m-3 (LAT) 33 56 96 30
Daily maximum 84 104 66 72
*Data for 2011 relates only to January to March. UAT: upper assessment thresholds; LAT: lower assessment thresholds.
Table 4.5 compares the summary statistics for PM10 data from three different sites in the Cork area: Tivoli Docks Industrial Estate, Old Station Road (OSR) and Heatherton Park (HP). Old Station Road is an urban/traffic site located in Cork city centre, while HP is an urban background site located on the outskirts of the city. The Tivoli data compares well with OSR and HP data in 2009 and 2010, exhibiting similar annual mean values and a similar number of exceedances. However, this behaviour is not found for the 2008 data: here the Tivoli site values do not compare well with the other two sites, perhaps because less data was captured.

31
D. A. Healy et al. (2007 CCRP Project 4.4.6.b)
Weekday and weekend splits for the mass concentration of PM10 at the Tivoli Docks site were considered and are shown in Fig. 4.20. The difference between weekday and weekend concentrations is evident: 40% higher PM10 concentrations were measured on weekdays
compared to the weekends. This weekday increase is a result of higher anthropogenic emissions related to industrial/economic activity; in general, there is less work performed in the docks at weekends. All the weekday/weekend values are displayed in Table 4.6.
Table 4.6. Weekday/weekend split in PM10 mass concentrations (µg m-3) for each calendar year and overall.
PM10 2008 2009 2010 2011 Overall
Weekday 29.6 21.3 23.4 30.4 23.9
Weekend 18.5 17.1 15.7 22.3 17.0
Figure 4.20. Weekday/weekend split in PM10 concentrations at the Tivoli Docks Industrial Estate site from 2008 to 2011. The overall value is the average of the four years.
Table 4.5. Comparison between summary statistics for PM10 data collected from Tivoli Docks Industrial Estate, Old Station Road (OSR) and Heatherton Park (HP).*
PM10 (µg m-3) 2008 2009 2010
Tivoli OSR HP Tivoli OSR HP Tivoli OSR HP
Annual mean 26 16 15 20 18 15 21 22 18
Median 18 14 13 15 16 12 15 18 14
% data capture 23 90 95 84 95 93 96 46 100
Values >50 µg m-3 8 1 1 8 6 10 8 7 8
Daily maximum 84 52 68 104 94 89 66 96 91
*OSR and HP data taken from the Cork City Council Air Pollution in Cork City reports and the relevant EPA Air Quality annual reports.

32
A New Approach to Bioaerosol Monitoring in Ireland
Figure 4.21 shows the seasonal variability for the diurnal variation of PM10 at the Tivoli site. The data represents the meteorological summer (June–August) and winter (December–February) months. The resulting plot demonstrates the large seasonal variability that pervades the Tivoli PM10 data. There is a big change in the diurnal variation when comparing summer to winter; winter concentrations are generally higher than their summer counterparts. This observation is probably due to higher anthropogenic emissions from home (space) heating, more re-suspension of materials by stronger winds and a higher contribution from natural sources such as sea-salt in winter.
The most striking difference when considering temporal trends appears in the morning (7:00–11:00) and in the evening (17:00–23:00). There are two likely reasons for these discrepancies: higher road transport emissions and increased solid-fuel combustion for home heating in winter than in summer. However, there are also similarities between the weekday diurnal plot (see Section 5 of Final Project Report). All plots exhibit the morning (starting at 7:00) and evening (17:00–18:00) rush-hour peaks attributable to vehicle emissions. Another common feature is the observation of smaller peaks found in the afternoon
NOx Table 4.7 shows the summary statistics for the NO2 dataset from the Tivoli site. For each year, the annual mean of NO2 is well below the limit value of 40 µg m-3 set out by the EU in the CAFÉ directive 2008/50/EC. The 2008 and 2009 annual mean values compare well with each other. The hourly NO2 values are safely below the limit of 200 µg m-3 set out by the EU as no exceedances were observed during the monitoring campaign. The upper assessment threshold (UAT) and the lower assessment threshold (LAT) were exceeded in 2009 and 2010 but not by more than the allowed number of 18 exceedances. (Note that the NO2 values were averaged hourly before analysis.)
Figure 4.21. Diurnal variation of PM10 mass concentration for the whole dataset as a function of seasons at the Tivoli Docks Industrial Estate monitoring site.
Table 4.8 displays the summary statistics for the NOx data. The annual mean limit of NOx for the protection of ecosystems is 30 µg m-3 (applicable from 2010) as set by the EU. The 2009 annual mean is quite close to the limit value of 30 µg m-3. The large difference between the annual mean and median values for each year should be noted: the annual mean is approximately double its respective median value. This large disparity indicates the occurrence
(12:00–13:00 and about 15:00), which are would also be expected to be related to traffic emissions.

33
D. A. Healy et al. (2007 CCRP Project 4.4.6.b)
the hourly max in all three years. This pattern is similar to
that of the NO2 data above and is more than likely due to
the close roadside, inner city location for OSR.
Table 4.9. Comparison of summary statistics for NO2 data from Tivoli Docks Industrial Estate and Old Station Road (OSR) in Cork.*
NO2 (µg m-3) 2008 2009 2010
Tivoli OSR Tivoli OSR Tivoli OSR
Annual mean 17 30 15 34 30 34
Median 11 27 9 29 26 29
% data capture 70 88 79 61 14 100
NO2 values > 200 0 0 0 0 0 0
Values >140 (UAT) 0 0 1 7 0 12
Values >100 (LAT) 0 13 6 61 7 102
Hourly maximum 90 135 145 167 122 169
*OSR data taken from Cork City Council air pollution reports and EPA annual reports as described above. UAT = upper assessment threshold; LAT = lower assessment threshold.
Table 4.7. Summary statistics for the NO2 dataset from the Tivoli Docks Industrial Estate site. (Units: µg m-3).
NO2 2008 2009 2010
Annual mean 17 15 30
Median 11 9 26
% data capture 70 79 14
NO2 values > 200 µg m-3 0 0 0
Values >140 µg m-3 (UAT) 0 1 0
Values >100 µg m-3 (LAT) 0 6 7
Hourly maximum 90 145 122
UAT = upper assessment threshold ; LAT = lower assessment threshold.
Table 4.8. Summary statistics for the NOx dataset from the Tivoli Docks Industrial Estate site. (Units: µg m-3).
NOx 2008 2009 2010
Annual mean 41 28 70
Median 21 13 38
% data capture 70 79 14
Hourly maximum 611 968 938
of relatively few pollution episodes but with very high NOx concentrations.
A comparison of the NO2 summary statistics from Tivoli Docks and OSR in Cork city is shown in Table 4.9. Figures 4.22 and 4.23 compare the weekday and
weekend concentrations for NO2 and NOx respectively at the Tivoli site. As expected, NO2 and NOx concentrations are higher for weekdays than weekends as a result of more industrial/economic activity.
Table 4.10 compares the NOx data from the Tivoli site
with that from the OSR site. The OSR data displays
higher levels of NOx with respect to the annual mean and

34
A New Approach to Bioaerosol Monitoring in Ireland
Table 4.10. Comparison between summary statistics for NOx data from Tivoli Docks Industrial Estate and Old Station Road (OSR) in Cork.*
NOx (µg m-3) 2008 2009 2010
Tivoli OSR Tivoli OSR Tivoli OSR
Annual mean 41 54 28 72 70 71Median 21 41 13 50 38 50% data capture 70 88 79 61 14 100Hourly maximum 611 763 968 1081 938 1271
* OSR data taken from Cork City Council air pollution reports and EPA annual reports as described above.
Figure 4.22. Weekday/weekend split in NO2 concentrations at Tivoli Docks Industrial Estate site, 2008–2010. Overall value is the average of the three years. Note percentage data capture for 2010 is ~14% and therefore 2010 results should be treated with caution when comparing to other years.
Figure 4.23. Weekday/weekend split in NOx concentrations, Tivoli Docks Industrial Estate site, 2008–2010. Overall value is average of the three years. Note percentage data capture for 2010 is ~14% and therefore 2010 results should be treated with caution when comparing to other years.
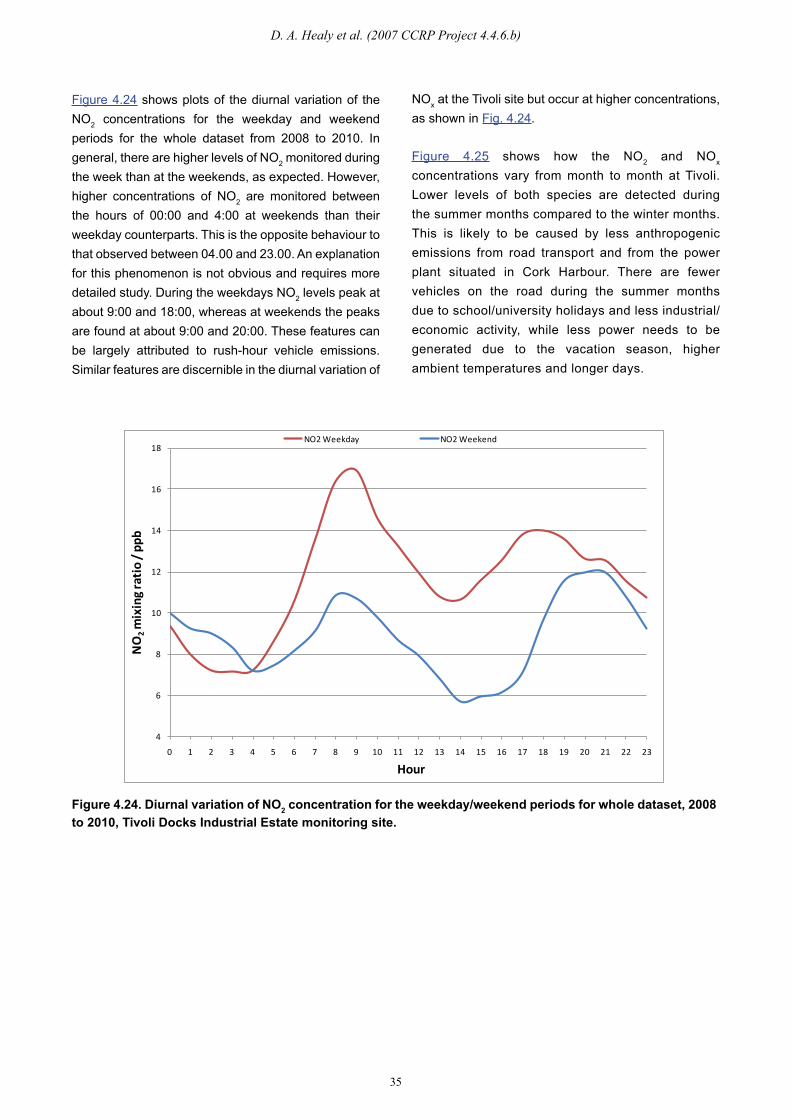
35
D. A. Healy et al. (2007 CCRP Project 4.4.6.b)
Figure 4.24 shows plots of the diurnal variation of the NO2 concentrations for the weekday and weekend periods for the whole dataset from 2008 to 2010. In general, there are higher levels of NO2 monitored during the week than at the weekends, as expected. However, higher concentrations of NO2 are monitored between the hours of 00:00 and 4:00 at weekends than their weekday counterparts. This is the opposite behaviour to that observed between 04.00 and 23.00. An explanation for this phenomenon is not obvious and requires more detailed study. During the weekdays NO2 levels peak at about 9:00 and 18:00, whereas at weekends the peaks are found at about 9:00 and 20:00. These features can be largely attributed to rush-hour vehicle emissions. Similar features are discernible in the diurnal variation of
Figure 4.25 shows how the NO2 and NOx concentrations vary from month to month at Tivoli. Lower levels of both species are detected during the summer months compared to the winter months. This is likely to be caused by less anthropogenic emissions from road transport and from the power plant situated in Cork Harbour. There are fewer vehicles on the road during the summer months due to school/university holidays and less industrial/economic activity, while less power needs to be generated due to the vacation season, higher ambient temperatures and longer days.
NOx at the Tivoli site but occur at higher concentrations, as shown in Fig. 4.24.
4
6
8
10
12
14
16
18
0 1 2 3 4 5 6 7 8 9 10 11 12 13 14 15 16 17 18 19 20 21 22 23
NO
2m
ixin
g rat
io /
ppb
Hour
NO2 Weekday NO2 Weekend
Figure 4.24. Diurnal variation of NO2 concentration for the weekday/weekend periods for whole dataset, 2008 to 2010, Tivoli Docks Industrial Estate monitoring site.

36
A New Approach to Bioaerosol Monitoring in Ireland
Figure 4.25. Monthly variations of NO2 and NOx, Tivoli Docks Industrial Estate site for the whole campaign.
4.4.3 Discussion: Comparison between PM10 and NOx datasets
The monthly variations observed for NOx, NO2 and PM10 at Tivoli over the whole campaign are shown in Fig. 4.26. All three parameters follow a similar trend displaying high values during the winter months and lower values during the summer months. This trend is seen because there are less vehicle emissions and solid-fuel combustion during the summer months.
Figure 4.26. Monthly variation of NOx, NO2 and PM10 at Tivoli Docks Industrial Estate for the whole campaign. NOx (red) and NO2 (blue) on left axis. PM10 (green) on right axis.
Figure 4.27 compares the NOx, NO2 and PM10 data as a function of diurnal variation during the summer months. The three datasets correlate reasonably well with peaks found in the morning, afternoon and evening. These peaks can be largely attributed to anthropogenic vehicle emissions at rush hour. In addition, because the data shown is from the summer months (June–August), very little PM10 emissions from the combustion of solid fuels for home/space heating are expected to be present in
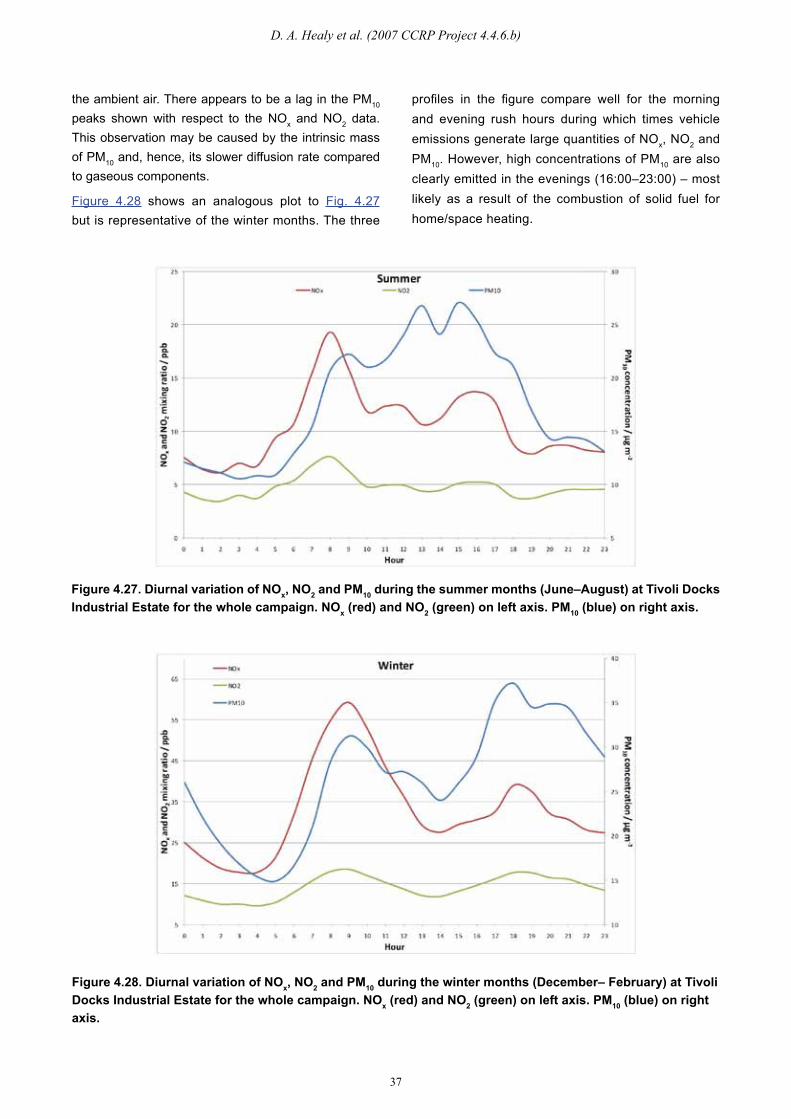
37
D. A. Healy et al. (2007 CCRP Project 4.4.6.b)
Figure 4.27. Diurnal variation of NOx, NO2 and PM10 during the summer months (June–August) at Tivoli Docks Industrial Estate for the whole campaign. NOx (red) and NO2 (green) on left axis. PM10 (blue) on right axis.
the ambient air. There appears to be a lag in the PM10 peaks shown with respect to the NOx and NO2 data. This observation may be caused by the intrinsic mass of PM10 and, hence, its slower diffusion rate compared to gaseous components.
Figure 4.28. Diurnal variation of NOx, NO2 and PM10 during the winter months (December– February) at Tivoli Docks Industrial Estate for the whole campaign. NOx (red) and NO2 (green) on left axis. PM10 (blue) on right axis.
profiles in the figure compare well for the morning and evening rush hours during which times vehicle emissions generate large quantities of NOx, NO2 and PM10. However, high concentrations of PM10 are also clearly emitted in the evenings (16:00–23:00) – most likely as a result of the combustion of solid fuel for home/space heating.
Figure 4.28 shows an analogous plot to Fig. 4.27 but is representative of the winter months. The three
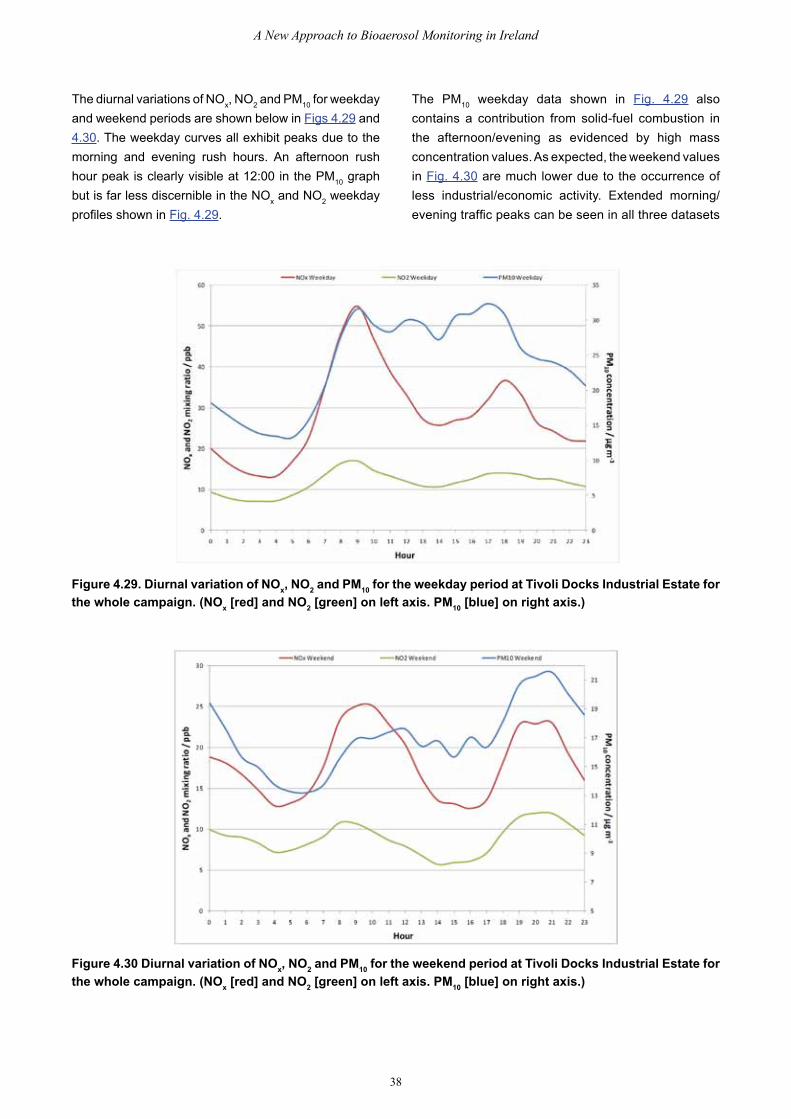
38
A New Approach to Bioaerosol Monitoring in Ireland
The diurnal variations of NOx, NO2 and PM10 for weekday and weekend periods are shown below in Figs 4.29 and 4.30. The weekday curves all exhibit peaks due to the morning and evening rush hours. An afternoon rush hour peak is clearly visible at 12:00 in the PM10 graph but is far less discernible in the NOx and NO2 weekday profiles shown in Fig. 4.29.
Figure 4.29. Diurnal variation of NOx, NO2 and PM10 for the weekday period at Tivoli Docks Industrial Estate for the whole campaign. (NOx [red] and NO2 [green] on left axis. PM10 [blue] on right axis.)
Figure 4.30 Diurnal variation of NOx, NO2 and PM10 for the weekend period at Tivoli Docks Industrial Estate for the whole campaign. (NOx [red] and NO2 [green] on left axis. PM10 [blue] on right axis.)
The PM10 weekday data shown in Fig. 4.29 also contains a contribution from solid-fuel combustion in the afternoon/evening as evidenced by high mass concentration values. As expected, the weekend values in Fig. 4.30 are much lower due to the occurrence of less industrial/economic activity. Extended morning/evening traffic peaks can be seen in all three datasets
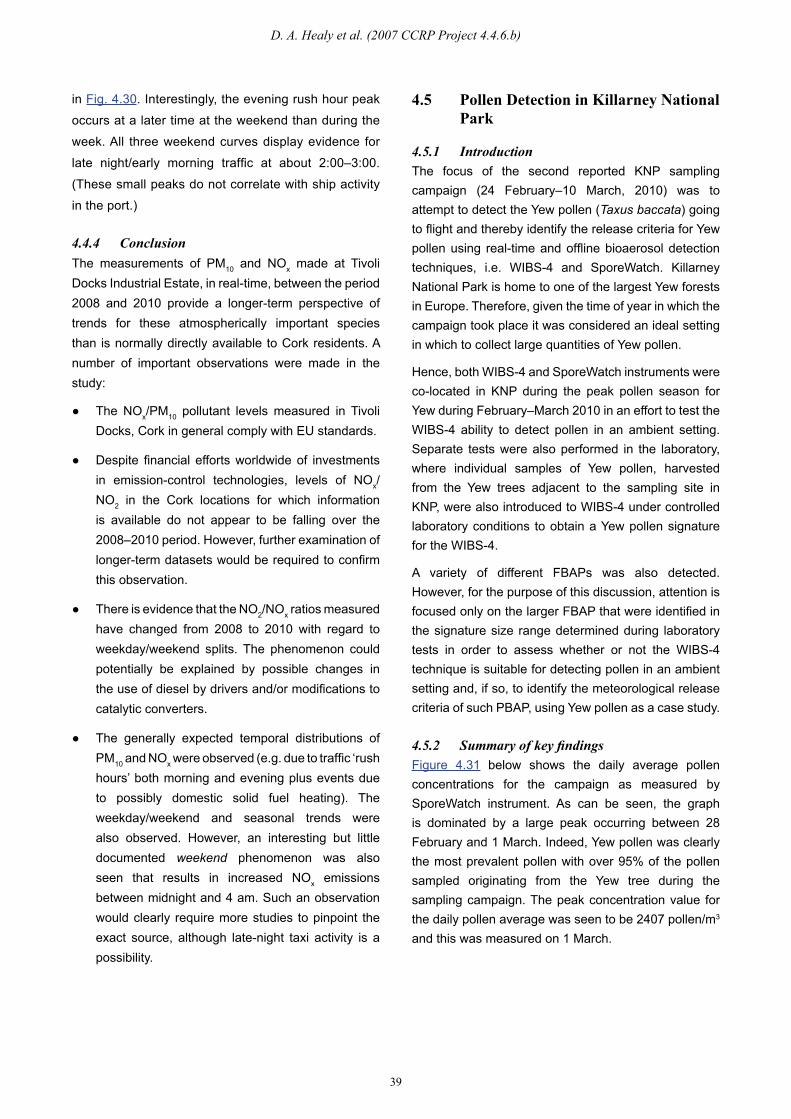
39
D. A. Healy et al. (2007 CCRP Project 4.4.6.b)
in Fig. 4.30. Interestingly, the evening rush hour peak
occurs at a later time at the weekend than during the
week. All three weekend curves display evidence for
late night/early morning traffic at about 2:00–3:00.
(These small peaks do not correlate with ship activity
in the port.)
4.4.4 ConclusionThe measurements of PM10 and NOx made at Tivoli Docks Industrial Estate, in real-time, between the period 2008 and 2010 provide a longer-term perspective of trends for these atmospherically important species than is normally directly available to Cork residents. A number of important observations were made in the study:
● The NOx/PM10 pollutant levels measured in Tivoli Docks, Cork in general comply with EU standards.
● Despite financial efforts worldwide of investments in emission-control technologies, levels of NOx/NO2 in the Cork locations for which information is available do not appear to be falling over the 2008–2010 period. However, further examination of longer-term datasets would be required to confirm this observation.
● There is evidence that the NO2/NOx ratios measured have changed from 2008 to 2010 with regard to weekday/weekend splits. The phenomenon could potentially be explained by possible changes in the use of diesel by drivers and/or modifications to catalytic converters.
● The generally expected temporal distributions of PM10 and NOx were observed (e.g. due to traffic ‘rush hours’ both morning and evening plus events due to possibly domestic solid fuel heating). The weekday/weekend and seasonal trends were also observed. However, an interesting but little documented weekend phenomenon was also seen that results in increased NOx emissions between midnight and 4 am. Such an observation would clearly require more studies to pinpoint the exact source, although late-night taxi activity is a possibility.
4.5 Pollen Detection in Killarney National Park
4.5.1 IntroductionThe focus of the second reported KNP sampling campaign (24 February–10 March, 2010) was to attempt to detect the Yew pollen (Taxus baccata) going to flight and thereby identify the release criteria for Yew pollen using real-time and offline bioaerosol detection techniques, i.e. WIBS-4 and SporeWatch. Killarney National Park is home to one of the largest Yew forests in Europe. Therefore, given the time of year in which the campaign took place it was considered an ideal setting in which to collect large quantities of Yew pollen.
Hence, both WIBS-4 and SporeWatch instruments were co-located in KNP during the peak pollen season for Yew during February–March 2010 in an effort to test the WIBS-4 ability to detect pollen in an ambient setting. Separate tests were also performed in the laboratory, where individual samples of Yew pollen, harvested from the Yew trees adjacent to the sampling site in KNP, were also introduced to WIBS-4 under controlled laboratory conditions to obtain a Yew pollen signature for the WIBS-4.
A variety of different FBAPs was also detected. However, for the purpose of this discussion, attention is focused only on the larger FBAP that were identified in the signature size range determined during laboratory tests in order to assess whether or not the WIBS-4 technique is suitable for detecting pollen in an ambient setting and, if so, to identify the meteorological release criteria of such PBAP, using Yew pollen as a case study.
4.5.2 Summary of key findingsFigure 4.31 below shows the daily average pollen concentrations for the campaign as measured by SporeWatch instrument. As can be seen, the graph is dominated by a large peak occurring between 28 February and 1 March. Indeed, Yew pollen was clearly the most prevalent pollen with over 95% of the pollen sampled originating from the Yew tree during the sampling campaign. The peak concentration value for the daily pollen average was seen to be 2407 pollen/m3 and this was measured on 1 March.
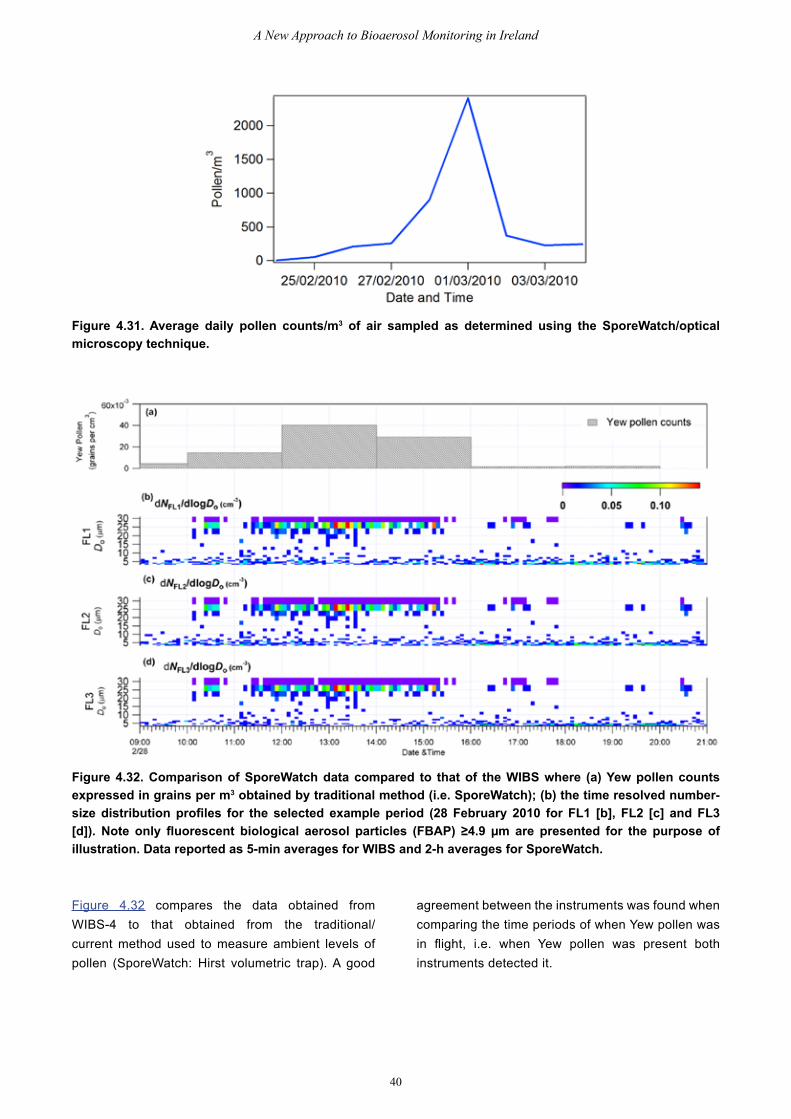
40
A New Approach to Bioaerosol Monitoring in Ireland
Figure 4.31. Average daily pollen counts/m3 of air sampled as determined using the SporeWatch/optical microscopy technique.
Figure 4.32 compares the data obtained from WIBS-4 to that obtained from the traditional/current method used to measure ambient levels of pollen (SporeWatch: Hirst volumetric trap). A good
agreement between the instruments was found when comparing the time periods of when Yew pollen was in flight, i.e. when Yew pollen was present both instruments detected it.
Figure 4.32. Comparison of SporeWatch data compared to that of the WIBS where (a) Yew pollen counts expressed in grains per m3 obtained by traditional method (i.e. SporeWatch); (b) the time resolved number-size distribution profiles for the selected example period (28 February 2010 for FL1 [b], FL2 [c] and FL3 [d]). Note only fluorescent biological aerosol particles (FBAP) ≥4.9 µm are presented for the purpose of illustration. Data reported as 5-min averages for WIBS and 2-h averages for SporeWatch.
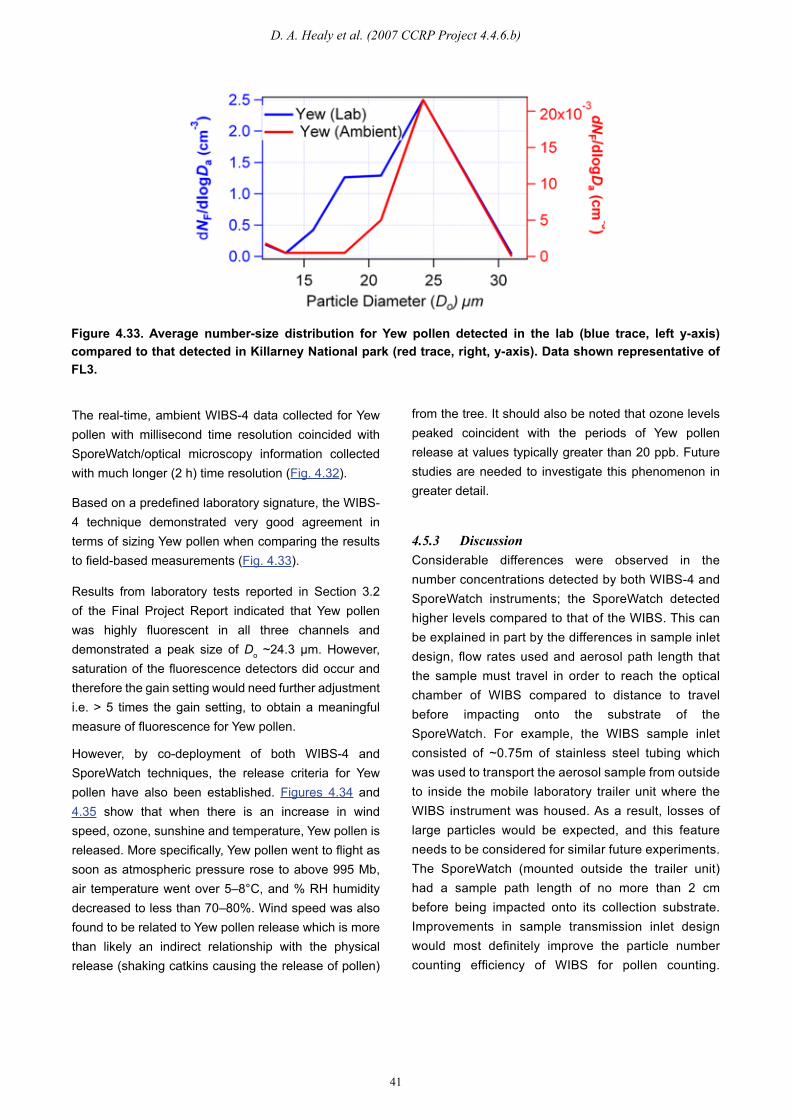
41
D. A. Healy et al. (2007 CCRP Project 4.4.6.b)
from the tree. It should also be noted that ozone levels peaked coincident with the periods of Yew pollen release at values typically greater than 20 ppb. Future studies are needed to investigate this phenomenon in greater detail.
Figure 4.33. Average number-size distribution for Yew pollen detected in the lab (blue trace, left y-axis) compared to that detected in Killarney National park (red trace, right, y-axis). Data shown representative of FL3.
Based on a predefined laboratory signature, the WIBS-4 technique demonstrated very good agreement in terms of sizing Yew pollen when comparing the results to field-based measurements (Fig. 4.33).
Results from laboratory tests reported in Section 3.2 of the Final Project Report indicated that Yew pollen was highly fluorescent in all three channels and demonstrated a peak size of Do ~24.3 µm. However, saturation of the fluorescence detectors did occur and therefore the gain setting would need further adjustment i.e. > 5 times the gain setting, to obtain a meaningful measure of fluorescence for Yew pollen.
However, by co-deployment of both WIBS-4 and SporeWatch techniques, the release criteria for Yew pollen have also been established. Figures 4.34 and 4.35 show that when there is an increase in wind speed, ozone, sunshine and temperature, Yew pollen is released. More specifically, Yew pollen went to flight as soon as atmospheric pressure rose to above 995 Mb, air temperature went over 5–8°C, and % RH humidity decreased to less than 70–80%. Wind speed was also found to be related to Yew pollen release which is more than likely an indirect relationship with the physical release (shaking catkins causing the release of pollen)
The real-time, ambient WIBS-4 data collected for Yew pollen with millisecond time resolution coincided with SporeWatch/optical microscopy information collected with much longer (2 h) time resolution (Fig. 4.32).
4.5.3 DiscussionConsiderable differences were observed in the number concentrations detected by both WIBS-4 and SporeWatch instruments; the SporeWatch detected higher levels compared to that of the WIBS. This can be explained in part by the differences in sample inlet design, flow rates used and aerosol path length that the sample must travel in order to reach the optical chamber of WIBS compared to distance to travel before impacting onto the substrate of the SporeWatch. For example, the WIBS sample inlet consisted of ~0.75m of stainless steel tubing which was used to transport the aerosol sample from outside to inside the mobile laboratory trailer unit where the WIBS instrument was housed. As a result, losses of large particles would be expected, and this feature needs to be considered for similar future experiments. The SporeWatch (mounted outside the trailer unit) had a sample path length of no more than 2 cm before being impacted onto its collection substrate. Improvements in sample transmission inlet design would most definitely improve the particle number counting efficiency of WIBS for pollen counting.
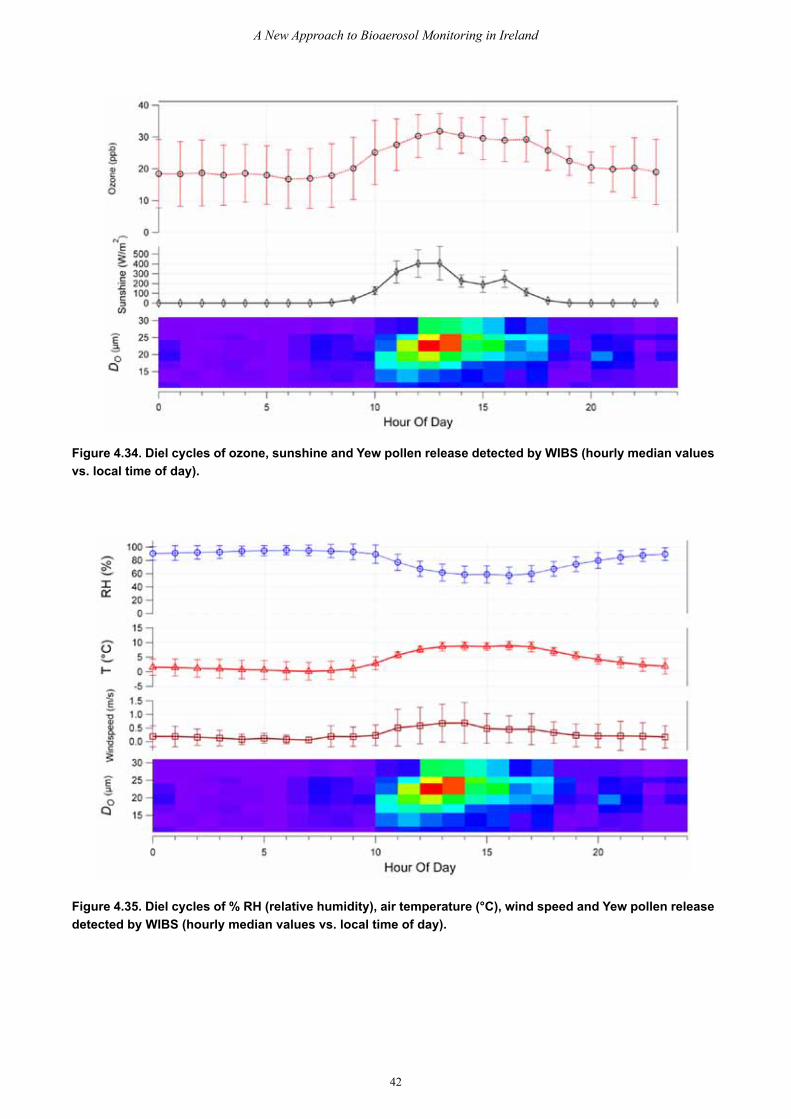
42
A New Approach to Bioaerosol Monitoring in Ireland
Figure 4.34. Diel cycles of ozone, sunshine and Yew pollen release detected by WIBS (hourly median values vs. local time of day).
Figure 4.35. Diel cycles of % RH (relative humidity), air temperature (°C), wind speed and Yew pollen release detected by WIBS (hourly median values vs. local time of day).

43
D. A. Healy et al. (2007 CCRP Project 4.4.6.b)
Moreover, should WIBS pollen monitoring be considered worthwhile as a future automated method, other modifications to sample inlet design and configuration would also be necessary. For example, as discussed earlier, the gain sensitivity of the detectors would have to be decreased by a magnitude of greater than five times as used in the current instrument (Low Gain) since saturation was observed in all FL channels when pollen was detected. Further laboratory-based studies would help deduce the optimum gain settings for WIBS detection of pollen.
Irrespective of the fluorescence saturation and particle loss issues mentioned above, the information collected by WIBS-4 is still valid. Effectively, a large fluorescent particle that matches the laboratory signature of Yew pollen was also detected in the field, i.e. evidence that Yew pollen was reliably monitored while also being confirmed by employment of the SporeWatch/microscopy technique.
4.5.4 ConclusionThe WIBS-4 spectroscopic technique detected Yew pollen in an ambient setting, albeit in lower concentrations in comparison to SporeWatch. Reasons for such differences were discussed earlier in Section 4.4.3. However, the detection of Yew pollen was considered to be successful when a matching Yew pollen signature (size, AF and highly fluorescent)
obtained in the laboratory was also measured in the field. Issues with the pollen signature were noted though and included issues related to the saturation of the fluorescence detector by the majority of Yew pollen grains measured. This observation was found to be the case in all three fluorescence channels and further adjustments to the gain settings of the detectors would potentially rectify this issue related to Yew pollen. It is of note that the WIBS-4 was never originally designed to look at PBAPs larger than 12 µm, e.g. pollen grains. The current experiment reported in Section 4.4 is a mere demonstration of what the technique could potentially achieve in terms of pollen monitoring if certain changes in configuration were made to WIBS-4.
The above experimental model could also be applied to other PBAPs, i.e. obtaining a WIBS-4 signature for a specific PBAP (e.g. Taxus baccata [Yew] pollen) in a laboratory setting and detecting it in an ambient setting could also be utilised to identify specific release criteria of other PBAPs. It is of note that a total of over 15 laboratory WIBS-4 signatures have already been characterised and catalogued during the life of project BioCheA, and the examination of future WIBS-4 datasets will certainly highlight the release criteria of other PBAPs while also providing useful information e.g. the physical behaviour of specific PBAPS whilst in-flight in terms of size and shape.
44
A New Approach to Bioaerosol Monitoring in Ireland
Surprisingly little information is available to the environmental or aerobiological communities on the monitoring of airborne PBAPs in real-time – especially since their impact on climate change and health has become of increasing concern to society. For example, the ice nucleation ability of PBAPs is thought to drive the development of ice clouds, the formation of which can influence radiative forcing, an important parameter in the construction of predictive global climate models. Furthermore, industry and environmental agencies find an increasing need to respond to growing concerns about the release of bioaerosols from different sources such as agriculture, construction and waste-treatment facilities. These threats are related to the increased risk of health-related problems such as respiratory diseases (e.g. Farmer’s Lung), allergies and cancer to humans and also the occurrence of certain plant diseases (e.g. ringspot).
Therefore, project BioCheA, which is a complementary laboratory and field-based measurement programme for the quantification and identification of representative PBAPs in Ireland, represents both a timely and important development. The studies undertaken have shown that discrimination between aerosolised chemicals, pollen and fungal spore material (including hyphae) can be made using the WIBS-4 in a controlled laboratory setting. The WIBS approach provides distinct signal streams related to the intrinsic fluorescence of the samples and optical scattering parameters providing size and shape information. Readily contrasting data for the PBAP samples investigated can thereby be obtained. Subsequent convolution of this data into user-friendly 3D plots provides a powerful method for specifying the presence of individual PBAPs. Of particular importance in this regard, from inspection of the current datasets, is the clearly visible distinction of the fungal spore Aspergillus fumigatus from all other species investigated. It can be speculated that the reliable, real-time detection of this biological material
in situ may, in future, help prevent serious respiratory illness developing in those with an immunodeficiency.
In the initial field campaigns the results obtained, using WIBS-4, were duly and successfully compared with those obtained using more traditional techniques such as SporeWatch collection/optical microscopy analysis. A successful field comparison between the WIBS-4 instrument and a counterpart device, based on fluorescence detection of PBAPs, was also made; the campaign represented the first such in situ deployment and provided both user communities with much useful information on the respective strengths of their methodologies. Such ‘benchmark’ approaches for comparing these relatively new methods are necessary in order to assess the reliability of the data now obtainable in real-time for PBAPs.
Campaign data on the identification and quantification of PBAPs were obtained from two contrasting regions in Ireland in order to further assess the detection capabilities of WIBS-4. Thus, results were obtained from both the Tivoli industrialised urban site, Cork and the rural forested region of KNP during 2010 in order to assess the potential interfering effects of non-PBAP materials on the PBAP signals. Using appropriate data-filtering methods and analysis, it can be concluded that it is possible to screen interfering signals so that reliable data on the bioaerosols themselves can be uniquely determined.
A further field campaign made in Co. Cork using the SporeWatch also provided some observations of note to the aerobiological community. Pollen counts were seen to exhibit a highly diurnal trend, peaking between 10:00 and 14:00 each day. Peak concentrations correlated with increasing temperature, solar radiance and decreasing humidity. The opposite release conditions were monitored for the spores, basidiospores and ascopores and were found not to be site specific.
5 Conclusions from Project BioCheA
45
D. A. Healy et al. (2007 CCRP Project 4.4.6.b)
for which has been already been catalogued during the current project). Furthermore, the possible interactions between chemicals and airborne biologicals (e.g. diesel ‘piggybacking’ pollen) to increase synergistically certain allergenic properties is virtually unexplored due to the difficulties that have been associated, until now, with monitoring bioaerosols in real-time.
Hence, PBAP monitoring on a routine basis is potentially a predictable outcome of the concerns of the general public about bioterrorism attacks, climate change and health issues related to both humans and plant life. Research and training of personnel are fundamental prerequisites of any successful future for such an ambition in Ireland. The knowledge and skills accrued within project BioCheA should now be built upon both in Ireland and throughout the world, for not just environmental science but also possible health/medical science applications.
There is currently no continuous monitoring of bioaerosols in Ireland. Indeed, even the pollen counts used as a basis for the Asthma Society in Ireland to provide hay-fever intensity maps for the public are based on computer models and pollen-grain collections made in the UK. Of course, allergic conditions, while mainly uncomfortable, are generally not life threatening and so perhaps activities aimed at the real-time monitoring of PBAPs should be directed toward species of a relatively small size (<3 μm). Because these can penetrate deeply into respiratory systems and lead to adverse health outcomes, they should be prioritised. The compact, robust nature of the WIBS instrumentation is likely well suited to drive such campaigns and perhaps could be used for monitoring composting centres and other sources of bio-aerosols such as those related to agricultural activities (e.g. Aspergillus fumigatus: a laboratory WIBS-4 signature
6 Recommendations for the Future
46
A New Approach to Bioaerosol Monitoring in Ireland
References
AGRANOVSKI, V., RISTOVSKI, Z., HARGREAVES, M., BLACKALL, P. J. & MORAWSKA, L. (2003a) Performance evaluation of the UVAPS: influence of physiological age of airborne bacteria and bacterial stress. Journal of Aerosol Science, 34, 1711–1727.
AGRANOVSKI, V., RISTOVSKI, Z., HARGREAVES, M., BLACKALL, P. J. & MORAWSKA, L. (2003b) Real-time measurement of bacterial aerosols with the UVAPS: performance evaluation. Journal of Aerosol Science, 34, 301–317.
AGRANOVSKI, V. & RISTOVSKI, Z. D. (2005) Real-time monitoring of viable bioaerosols: capability of the UVAPS to predict the amount of individual microorganisms in aerosol particles. Journal of Aerosol Science, 36, 665–676.
BROWN, A., KNIGHT, A., KUMARSWAMI, N., LAMARRE, B., LIPSCOMBE, B., ROBINSON, R. & WILLIAMS, M. (2009) Rapid and Responsive Monitoring Network for Bioaerosol Emissions: Final Report. National Physical Laboratory, U.K.
CHEN, B. T., YEH, H. C. & FAN, B. J. (1995) Evaluation of the TSI small-scale powder disperser. Journal of Aerosol Science, 26, 1303–1313.
CHENG, Y. S., BARR, E. B., FAN, B. J., HARGIS, P. J., RADER, D. J., O’HERN, T. J., TORCZYNSKI, J. R., TISONE, G. C., PREPPERNAU, B. L., YOUNG, S. A. & RADLOFF, R. J. (1999) Detection of bioaerosols using multiwavelength UV fluorescence spectroscopy. Aerosol Science and Technology, 30, 186–201.
DURHAM, O. C. (1946) The volumetric incidence of atmospheric allergens: IV. A proposed standard method of gravity sampling, counting, and volumetric interpolation of results. Journal of Allergy, 17, 79–86.
FOOT, V. E., KAYE, P. H., STANLEY, W. R., BARRINGTON, S. J., GALLAGHER, M. & GABEY, A. (2008) Low-cost real-time multiparameter bio-aerosol sensors. Optically Based Biological and Chemical Detection for Defence IV. 1 ed. Cardiff, Wales, United Kingdom, SPIE.
GABEY, A. M., GALLAGHER, M. W., WHITEHEAD, J., DORSEY, J. R., KAYE, P. H. & STANLEY, W. R. (2010) Measurements and comparison of primary biological aerosol above and below a tropical forest canopy using a dual channel fluorescence spectrometer. Atmospheric Chemistry and Physics, 10, 4453–4466.
GABEY, A. M., STANLEY, W. R., GALLAGHER, M. W. & KAYE, P. H. (2011) The fluorescence properties of aerosol larger than 0.8 micrometres in an urban and tropical rainforest locations. Atmospheric Chemistry and Physics, 11, 5491–5504.
HAIRSTON, P. P., HO, J. & QUANT, F. R. (1997) Design of an instrument for real-time detection of bioaerosols using simultaneous measurement of particle aerodynamic size and intrinsic fluorescence. Journal of Aerosol Science, 28, 471–482.
HEALY, R. M., HELLEBUST, S., KOURTCHEV, I., ALLANIC, A., O’CONNOR, I. P., BELL, J. M., HEALY, D. A., SODEAU, J. R. & WENGER, J. C. (2010) Source apportionment of PM2.5 in Cork Harbour, Ireland using a combination of single particle mass spectrometry and quantitative semi-continuous measurements. Atmospheric Chemistry and Physics, 10, 9593–9613.
HEALY, D., O’ CONNOR, D. & SODEAU, J. R. (2012) Measurement of the particle counting efficiency of the ‘Waveband Integrated Bioaerosol Sensor’ model number 4 (WIBS-4). Journal of Aerosol Science, 47, 94–99.
HIRST, J. M. (1952) An automatic volumetric spore trap. Annals of Applied Biology, 39, 257.
HUFFMAN, J. A., TREUTLEIN, B. & PÖSCHL, U. (2010) Fluorescent biological aerosol particle concentrations and size distributions measured with an Ultraviolet Aerodynamic Particle Sizer (UV-APS) in Central Europe. Atmospheric Chemistry and Physics, 10, 3215–3233.
JAENICKE, R. (2005) Abundance of Cellular Material and Proteins in the Atmosphere. Science, 308, 73.
JENNINGS, S.G. (1996) Characterisation of Background Biological Aerosol. Interim Rept. no. 1, Sep–Dec 1996, http://stinet.dtic.mil/oai/oai?&verb = getRecord&metadataPrefix = html&identifier = ADA324823 Accessed 2011
JOHNSON, D. B. (1982) The role of giant and ultra-giant aerosol particles in warm rain initiation. Journal of the Atmospheric Sciences, 39, 448–460.
KANAANI, H., HARGREAVES, M., RISTOVSKI, Z. & MORAWSKA, L. (2007) Performance assessment of UVAPS: Influence of fungal spore age and air exposure. Journal of Aerosol Science, 38, 83–96.
KANAANI, H., HARGREAVES, M., SMITH, J., RISTOVSKI, Z., AGRANOVSKI, V. & MORAWSKA, L. (2008) Performance of UVAPS with respect to detection of airborne fungi. Journal of Aerosol Science, 39, 175–189.
KAYE, P., STANLEY, W. R., HIRST, E., FOOT, E. V., BAXTER, K. L. & BARRINGTON, S. J. (2005a) Single particle multichannel bio-aerosol fluorescence sensor. Optics Express, 13, 3583–3593.
47
D. A. Healy et al. (2007 CCRP Project 4.4.6.b)
KAYE, P. H., HIRST, E., FOOT, V. E., CLARK, J. M. & BAXTER, K. L. (2004) A low-cost multichannel aerosol fluorescence sensor for networked deployment. Optically Based Biological and Chemical Sensing for Defence. 1 ed. London, United Kingdom, SPIE.
KAYE, P. H., STANLEY, W. R., FOOT, V., BAXTER, K. & BARRINGTON, S. J. (2005b) A dual-wavelength single particle aerosol fluorescence monitor. Optically Based Biological and Chemical Sensing, and Optically Based Materials for Defence. 1 ed. Bruges, Belgium, SPIE.
KAYE, P. H., APTOWICZ, K., CHANG, R. K., FOOT, V. E. & VIDEEN, G. (2007) Angularly resolved elastic scattering from airborne particles. IN HOEKSTRA, A., MALTSEV, V. & VIDEEN, G. (Eds.) Optics of Biological Particles. New York, USA, Springer.
KELLY, D. L. (1981) The native forest vegetation of Killarney, south-west Ireland: an ecological account. Journal of Ecology, 69, 437–472.
LOHMANN. U. & FEICHTER, J. (2005) Global indirect aerosol effects: A review. Atmospheric Chemistry Physics, 5, 715–737.
MARSHALL, I. A., MITCHELL, J. P. & GRIFFITHS, W. D. (1991) The behaviour of regular-shaped non-spherical particles in a TSI aerodynamic particle sizer. Journal of Aerosol Science, 22, 73–89.
MATTHIAS-MASER, S. & JAENICKE, R. (2000) The size distribution of primary biological aerosol particles in the multiphase atmosphere. Aerobiologia, 16, 207–210.
MCDONALD M. S. & O’DRISCOLL B. J. (1980) Aerobiological studies based in Galway. A comparison of pollen and spore counts over two seasons of widely differing weather conditions. Clinical Allergy, 10, 211–215.
MILLINGTON, W. M. & CORDEN, J. M. (2005) Long term trends in outdoor Aspergillus/Penicillium spore concentrations in Derby, UK from 1970 to 2003 and a comparative study in 1994 and 1996 with the indoor air of two local houses. Aerobiologia, 21, 105–113.
MITAKAKIS, T., ONG, E., STEVENS, A., GUEST, D. & KNOX, R. (1997) Incidence of Cladosporium, alternaria and total fungal spores in the atmosphere of melbourne (Australia) over three years. Aerobiologia, 13, 83–90.
MÖHLER, O., DEMOTT, P. J., VALI, G. & LEVIN, Z. (2007) Microbiology and atmospheric processes: The role of biological particles in cloud physics. Biogeosciences, 4, 1059–1071.
O’GORMAN, C. M. & FULLER, H. T. (2008) Prevalence of culturable airborne spores of selected allergenic and pathogenic fungi in outdoor air. Atmospheric Environment, 42, 4355–4368.
PAN, Y.-L., HILL, S. C., PINNICK, R. G., HOUSE, J. M., FLAGAN, R. C. & CHANG, R. K. (2011) Dual-excitation-wavelength fluorescence spectra and elastic scattering for differentiation of single airborne pollen and fungal particles. Atmospheric Environment, 45, 1555–1563.
PAN, Y.-L., PINNICK, R. G., HILL, S. C. & CHANG, R. K. (2008) Particle-Fluorescence Spectrometer for Real-Time Single-Particle Measurements of Atmospheric Organic Carbon and Biological Aerosol. Environmental Science & Technology, 43, 429–434.
PRASAD, M., VAN DER WERF, P. & BRINKMANN, A. (2004) Bioaerosol and Composting: A Literature Evaluation. Composting Association of Ireland TEO.
SHELTON, B. G., KIRKLAND, K. H., FLANDERS, W. D. & MORRIS, G. K. (2002) Profiles of airborne fungi in buildings and outdoor environments in the United States. Applied Environmental Microbiology, 68, 1743–1753.
STANLEY, W. R., KAYE, P. H., FOOT, V. E., BARRINGTON, S. J., GALLAGHER, M. & GABEY, A. (2011) Continuous bioaerosol monitoring in a tropical environment using a UV fluorescence particle spectrometer. Atmospheric Science Letters, 12, 195–199.
WIEDINMYER, C., BOWERS, R. M., FIERER, N., HORANYI, E., HANNIGAN, M., HALLAR, A. G., MCCUBBIN, I. & BAUSTIAN, K. (2009) The contribution of biological particles to observed particulate organic carbon at a remote high altitude site. Atmospheric Environment, 43, 4278–4282.
XU, Z., WU, Y., SHEN, F., CHEN, Q., TAN, M. & YAO, M. (2011) Bioaerosol science, technology, and engineering: past, present, and future. Aerosol Science and Technology, 45, 1337–1349.
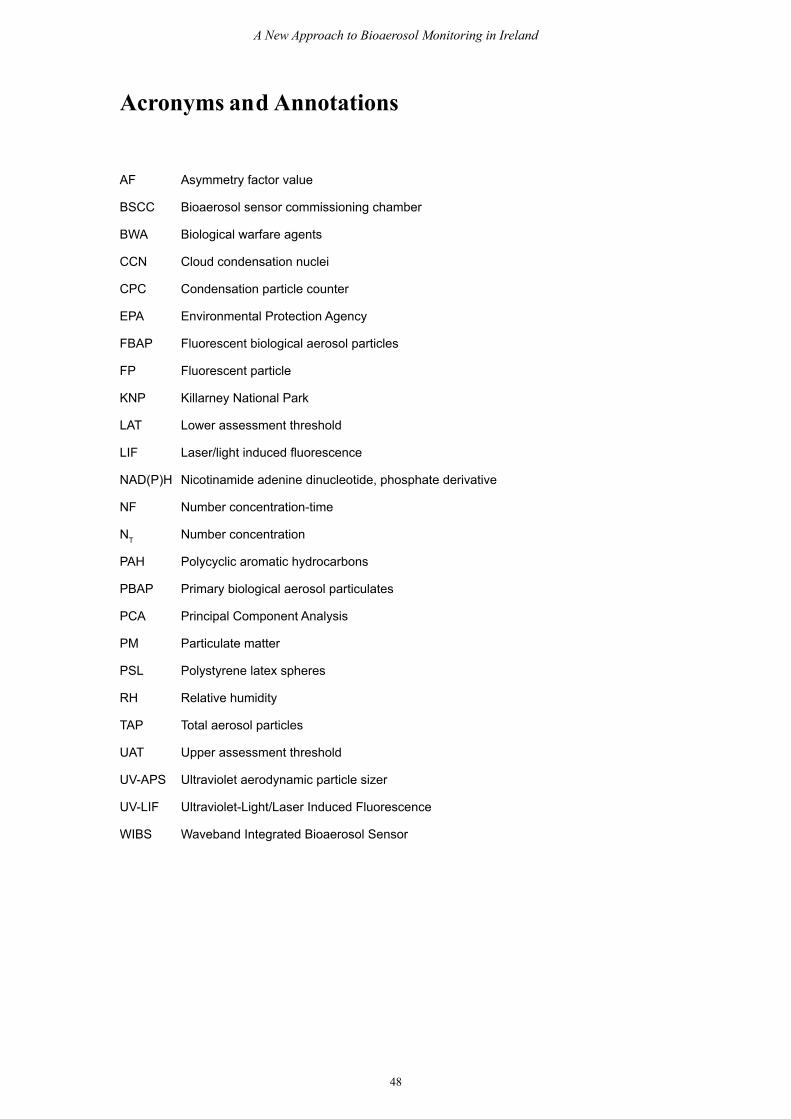
48
A New Approach to Bioaerosol Monitoring in Ireland
Acronyms and Annotations
AF Asymmetry factor value
BSCC Bioaerosol sensor commissioning chamber
BWA Biological warfare agents
CCN Cloud condensation nuclei
CPC Condensation particle counter
EPA Environmental Protection Agency
FBAP Fluorescent biological aerosol particles
FP Fluorescent particle
KNP Killarney National Park
LAT Lower assessment threshold
LIF Laser/light induced fluorescence
NAD(P)H Nicotinamide adenine dinucleotide, phosphate derivative
NF Number concentration-time
NT Number concentration
PAH Polycyclic aromatic hydrocarbons
PBAP Primary biological aerosol particulates
PCA Principal Component Analysis
PM Particulate matter
PSL Polystyrene latex spheres
RH Relative humidity
TAP Total aerosol particles
UAT Upper assessment threshold
UV-APS Ultraviolet aerodynamic particle sizer
UV-LIF Ultraviolet-Light/Laser Induced Fluorescence
WIBS Waveband Integrated Bioaerosol Sensor
An Ghníomhaireacht um Chaomhnú Comhshaoil
Is í an Gníomhaireacht um ChaomhnúComhshaoil (EPA) comhlachta reachtúil achosnaíonn an comhshaol do mhuintir na tírego léir. Rialaímid agus déanaimid maoirsiú arghníomhaíochtaí a d'fhéadfadh truailliú achruthú murach sin. Cinntímid go bhfuil eolascruinn ann ar threochtaí comhshaoil ionas gonglactar aon chéim is gá. Is iad na príomh-nithe a bhfuilimid gníomhach leo nácomhshaol na hÉireann a chosaint aguscinntiú go bhfuil forbairt inbhuanaithe.
Is comhlacht poiblí neamhspleách í anGhníomhaireacht um Chaomhnú Comhshaoil(EPA) a bunaíodh i mí Iúil 1993 faoin Achtfán nGníomhaireacht um ChaomhnúComhshaoil 1992. Ó thaobh an Rialtais, is ían Roinn Comhshaoil, Pobal agus RialtaisÁitiúil.
ÁR bhFREAGRACHTAÍCEADÚNÚ
Bíonn ceadúnais á n-eisiúint againn i gcomhair na nitheseo a leanas chun a chinntiú nach mbíonn astuithe uathuag cur sláinte an phobail ná an comhshaol i mbaol:
n áiseanna dramhaíola (m.sh., líonadh talún,loisceoirí, stáisiúin aistrithe dramhaíola);
n gníomhaíochtaí tionsclaíocha ar scála mór (m.sh.,déantúsaíocht cógaisíochta, déantúsaíochtstroighne, stáisiúin chumhachta);
n diantalmhaíocht;
n úsáid faoi shrian agus scaoileadh smachtaitheOrgánach Géinathraithe (GMO);
n mór-áiseanna stórais peitreail;
n scardadh dramhuisce.
FEIDHMIÚ COMHSHAOIL NÁISIÚNTA
n Stiúradh os cionn 2,000 iniúchadh agus cigireachtde áiseanna a fuair ceadúnas ón nGníomhaireachtgach bliain.
n Maoirsiú freagrachtaí cosanta comhshaoil údarásáitiúla thar sé earnáil - aer, fuaim, dramhaíl,dramhuisce agus caighdeán uisce.
n Obair le húdaráis áitiúla agus leis na Gardaí chunstop a chur le gníomhaíocht mhídhleathachdramhaíola trí comhordú a dhéanamh ar líonraforfheidhmithe náisiúnta, díriú isteach ar chiontóirí,stiúradh fiosrúcháin agus maoirsiú leigheas nabhfadhbanna.
n An dlí a chur orthu siúd a bhriseann dlí comhshaoilagus a dhéanann dochar don chomhshaol marthoradh ar a ngníomhaíochtaí.
MONATÓIREACHT, ANAILÍS AGUS TUAIRISCIÚ AR AN GCOMHSHAOLn Monatóireacht ar chaighdeán aeir agus caighdeáin
aibhneacha, locha, uiscí taoide agus uiscí talaimh;leibhéil agus sruth aibhneacha a thomhas.
n Tuairisciú neamhspleách chun cabhrú le rialtaisnáisiúnta agus áitiúla cinntí a dhéanamh.
RIALÚ ASTUITHE GÁIS CEAPTHA TEASA NA HÉIREANN n Cainníochtú astuithe gáis ceaptha teasa na
hÉireann i gcomhthéacs ár dtiomantas Kyoto.
n Cur i bhfeidhm na Treorach um Thrádáil Astuithe, abhfuil baint aige le hos cionn 100 cuideachta atáina mór-ghineadóirí dé-ocsaíd charbóin in Éirinn.
TAIGHDE AGUS FORBAIRT COMHSHAOIL n Taighde ar shaincheisteanna comhshaoil a
chomhordú (cosúil le caighdéan aeir agus uisce,athrú aeráide, bithéagsúlacht, teicneolaíochtaícomhshaoil).
MEASÚNÚ STRAITÉISEACH COMHSHAOIL
n Ag déanamh measúnú ar thionchar phleananna aguschláracha ar chomhshaol na hÉireann (cosúil lepleananna bainistíochta dramhaíola agus forbartha).
PLEANÁIL, OIDEACHAS AGUS TREOIR CHOMHSHAOIL n Treoir a thabhairt don phobal agus do thionscal ar
cheisteanna comhshaoil éagsúla (m.sh., iarratais archeadúnais, seachaint dramhaíola agus rialacháinchomhshaoil).
n Eolas níos fearr ar an gcomhshaol a scaipeadh (trícláracha teilifíse comhshaoil agus pacáistíacmhainne do bhunscoileanna agus domheánscoileanna).
BAINISTÍOCHT DRAMHAÍOLA FHORGHNÍOMHACH
n Cur chun cinn seachaint agus laghdú dramhaíola tríchomhordú An Chláir Náisiúnta um ChoscDramhaíola, lena n-áirítear cur i bhfeidhm nadTionscnamh Freagrachta Táirgeoirí.
n Cur i bhfeidhm Rialachán ar nós na treoracha maidirle Trealamh Leictreach agus Leictreonach Caite agusle Srianadh Substaintí Guaiseacha agus substaintí adhéanann ídiú ar an gcrios ózóin.
n Plean Náisiúnta Bainistíochta um DramhaílGhuaiseach a fhorbairt chun dramhaíl ghuaiseach asheachaint agus a bhainistiú.
STRUCHTÚR NA GNÍOMHAIREACHTA
Bunaíodh an Ghníomhaireacht i 1993 chun comhshaolna hÉireann a chosaint. Tá an eagraíocht á bhainistiúag Bord lánaimseartha, ar a bhfuil Príomhstiúrthóiragus ceithre Stiúrthóir.
Tá obair na Gníomhaireachta ar siúl trí ceithre Oifig:
n An Oifig Aeráide, Ceadúnaithe agus ÚsáideAcmhainní
n An Oifig um Fhorfheidhmiúchán Comhshaoil
n An Oifig um Measúnacht Comhshaoil
n An Oifig Cumarsáide agus Seirbhísí Corparáide
Tá Coiste Comhairleach ag an nGníomhaireacht lecabhrú léi. Tá dáréag ball air agus tagann siad le chéilecúpla uair in aghaidh na bliana le plé a dhéanamh archeisteanna ar ábhar imní iad agus le comhairle athabhairt don Bhord.
EPA Inside Pages NEW_Blue Text 31/08/2011 15:24 Page 2

ENVIRONMENTAL PROTECTION AGENCY PO Box 3000, Johnstown Castle Estate, Co. Wexford, Ireland t 053 916 0600 f 053 916 0699 LoCall 1890 33 55 99 e [email protected] w http://www.epa.ie
Environment, Community and Local GovernmentComhshaol, Pobal agus Rialtas Áitiúil
Climate Change Research Programme (CCRP) 2007-2013
The EPA has taken a leading role in the development of the CCRP structure with the co-operation of key state agencies and government departments. The programme is structured according to four linked thematic areas with a strong cross cutting emphasis. Research being carried out ranges from fundamental process studies to the provision of high-level analysis of policy options.
For further information see www.epa.ie/whatwedo/climate/climatechangeresearch