a network analysis of the 2010 fifa world cup champion team play
TRANSCRIPT

J Syst Sci Complex (2013) 26: 21–42
A NETWORK ANALYSIS OF THE 2010 FIFA WORLDCUP CHAMPION TEAM PLAY∗
COTTA Carlos · MORA Antonio M · MERELO Juan Julian· MERELO-MOLINA Cecilia
DOI: 10.1007/s11424-013-2291-2Received: 20 July 2012c©The Editorial Office of JSSC & Springer-Verlag Berlin Heidelberg 2013
Abstract This paper analyzes the network of passes among the players of the Spanish team during
the last FIFA World Cup 2010, where they emerged as the champion, with the objective of explaining
the results obtained from the behavior at the complex network level. The team is considered a network
with players as nodes and passes as (directed) edges. A temporal analysis of the resulting passes
network is also done, looking at the number of passes, length of the chain of passes, and to network
measures such as player centrality and clustering coefficient. Results of the last three matches (the
decisive ones) indicate that the clustering coefficient of the pass network remains high, indicating the
elaborate style of the Spanish team. The effectiveness of the opposing team in negating the Spanish
game is reflected in the change of several network measures over time, most importantly in drops of
the clustering coefficient and passing length/speed, as well as in their being able in removing the most
talented players from the central positions of the network. Spain’s ability to restore their combinative
game and move the focus of the game to offensive positions and talented players is shown to tilt the
balance in favor of the Spanish team.
Key words Complex network, complex systems, FIFA World Cup, football, La Roja, network analysis,
soccer, Spanish team, sports.
1 Introduction
The hypothesis that a complex network analysis can help to understand football matcheshas been present for some time now[1]. Several teams, formally or informally, have performedanalyses of football matches from the point of view of the network of passes formed throughoutthe match. One starting point was in 2004, when a competition to predict the four best-classifiedteams in the EuroCup that was celebrated that year was held in the Redes (Spanish word for“network”) social-network mailing list (in Spanish). The results, which completely failed topredict the outcome, were published in [2].
COTTA CarlosDepartment of Computer Science, University of Malaga, Spain. Email: [email protected] Antonio M · MERELO Juan Julian · MERELO-MOLINA CeciliaDepartment of Architecture and Computer Technology, University of Granada, Spain.Email: [email protected]; [email protected].∗This work has been supported in part by the CEI BioTIC GENIL (CEB09-0010) MICINN CEI Program (PYR-2010-13) project, the Andalusian Regional Government P08-TIC-03903, P08-TIC-03928, and TIC-6083 projects,and MICINN projects TIN2008-05941 and TIN2011-28627-C04.�This paper was recommended for publication by Editors FENG Dexing and HAN Jing.

22 CARLOS COTTA, et al.
The main problem with these predictions –besides the outcome which was completely wrong(not even the two finalists, Portugal and Greece, were included in any of them) — was thatthey were looking at the static picture of the team as it emerged from the previous match. Itis quite clear that football is a game of two teams, whose networks clash. While there mustbe some quantity or structural property reflecting the team’s organization and playing stylethat is maintained from one game to the next, the other team will do its best to prevent thatnetwork to move information (namely, the football) from one part to other, resulting in a quiteunpredictable result.
On the other hand, the network does not have any kind of spatiotemporal information.A network might show what one would consider a perfect structure, well formed, with shortdistances from goalie to forward players, but if it plays out of place or simply in its own fieldit will not be able to obtain a good result. Furthermore, if the network develops quite slowlywith a low number of passes and low precision (low transitivity), the result will not be goodeither. In both cases, the static structure, while meaningful and a good qualitative descriptionof the overall game, is unable to reflect its dynamics.
In this paper, spurred on by the victory of the Spanish selection in the 2010 World Cup,we have performed a spatiotemporal analysis of the essential games that led to victory. In thisanalysis, we have looked at the temporal evolution of the number of passes, at the length ofthe chains of passes and its transitivity (thus taking into account the effect on the opponent ofsimple ball losses) and analyzed the team network (considering pitch zones) at a microscopiclevel by identifying the most central nodes. In this way, we take into account both the complexnetwork structure (reflected in the power-law structure of the length of the number of passesand overall network structure[3]) and the spatiotemporal nature of the game. In that sense, thispaper is the first to do this kind of analysis (at the complex network level — see also [4, 5] forrelated work), which can later be complemented with other kinds of static micro-, macro-, andmeso-measurements of the same type.
Since we are talking about sports here, and football which is claimed to be the king ofall sports, in some cases we allow ourselves to get carried away by emotion and make somestatements that are not purely scientific, but more in the spirit of our passion for the sport(and, even more so, for the team we are talking about). Even so, as the scientific claims wemake are sufficiently supported by our data, we ask for some leniency from the reader for ourlanguage and context statements, which we feel do no harm to the scientific claims we make inthis paper.
The rest of the paper is structured as follows: next, we examine the state of the art inanalyses of the outcome of football matches. Then, the methodology used to extract data fromthe match is presented. An overall examination of the matches played by the Spanish team issubsequently performed. We close the paper with some conclusions and guidelines for futurework.
2 State of the Art
Despite the huge cultural and popular interest that football has, being arguably the mostpopular sport (or maybe spectacle) in the world, there have not been many scientific approachesto sport performance and prediction. This was true when Onody and Castro[6] wrote theiroften-referenced paper in 2004, and it is still true today.
However, since then, several papers have tried to apply complex network analysis to thefootballing world. The above-mentioned paper itself was seminal in its thoroughness: it ana-lyzed the network of all Brazilian football players, and linked them if they had shared a team,

NETWORK ANALYSIS OF THE 2010 FIFA WORLD CUP CHAMPION 23
and found that several metrics (number of teams per player, number of goals per player, numberof games played) follow truncated power-laws† or exponential distributions. This power-law be-havior present in football was, later on, confirmed by Yamamoto and Yokoyama, who performedan analysis quite similar to the one we complete in this paper, analyzing several teams playingin the 2006 FIFA World Cup[7]. Their analysis detected power laws in the passes network,with exponents around 3, and made a very interesting analysis of the temporal evolution ofthe competitive play by looking at the number of triangles, or transitive passes, among otherthings. Duch, et al.[8] proved that flow centrality of the pass network can adequately qualifyteam and player performance; in this they coincide with the results obtained by Lee, et al.[9],who showed a moderate relationship between the flow/betweenness centralization of the wholeteam and the outcome, as well as a negative relationship between the out-degree centralization.
However, there has been no attempt to relate any of those quantities to performance. Couldthe number of teams a player has played in be related to the number of goals? In general, theprediction of performance has concentrated on the hypothesis that a team has some kind ofintrinsic fitness — See [10] — the difference of which between teams affects the probability (notthe certainty) of one beating the other. These studies have mainly concentrated on time seriesanalysis[11] but not intra-game dynamics.
Since the pass data for several world-class events (Euro Cup 2004, 2008, and World Cup2006, 2010) were made available, one of the authors has been carrying out informal analysis onthe team’s networks and deducting from them some kind of qualitative prediction on the resultof a match. However, this analysis has not been published, and even as differences between thenetwork qualities of different teams were appreciated, it was difficult to relate them either to theteam fitness or to the match outcome. The ARSfutbol team, based in Argentina, has carried outextensive analyses of world-class events as well as local low-level football teams[12], concludingthat the performance of a team is mainly related to the existence of a well-coordinated coreof players (such as the players which are taken from FC Barcelona, in the Spanish nationalteam or the set of players from Porto FC in the Portuguese selection). Even those post-hocobservations cannot be easily used for predicting performance.
In this paper, we will look at the micro-dynamics of a football team, the Spanish selectionduring the last World Cup in which they emerged as champions, bringing happiness to millionsof Spaniards all over the world. We will try to find out which quantities made the Spanish teamexcellent by focusing on quantitative analysis of its game-play. This will be used as the firststep for a second leg of analysis which will focus on prediction.
3 Data Extraction
In order to collect the data for the analysis, an important issue was the fact that we intendedto analyze the game play from a spatiotemporal perspective. The spatial dimension tries tocapture the fact that a player can act in different parts of the pitch and his role (and thereforethe way he performs and interacts with his teammates) may be different in each of these zones.For example, a certain midfielder can have a defensive role when the opposing team is attacking,and have the teammates in the last defensive line as preferred targets for a pass whenever heregains control of the ball. On the other hand, this very same player can adhere to a much morecombinative play when in offensive positions, interacting more with wingers and other creativemidfielders. To this end, the pitch has been divided into nine zones as depicted in Figure 1: fourzones correspond to defensive positions (own box, wingback lanes, and own midfield), a furtherfour zones correspond to offensive positions (opponent’s box and midfield and wingers’ lanes),
†Two quantities x, y are said to be related by a power-law if y = f(x) ∝ xk for some constant k[13].

24 CARLOS COTTA, et al.
and the the very central zone of the pitch which plays an important role for both initiatingstatic attacks and pressing the opponent in defense. For the purpose of this analysis, eachplayer is figuratively divided into 9 different players depending on the pitch zone in which theytouch the ball (of course, most players only visit a limited number of zones throughout anygiven game).
Figure 1 Model of the football field for data extraction, playing zones
As for the temporal perspective, our goal is to capture the fact that a football game can gothrough different phases in which a team can change its way of playing (e.g., the dominant teamcan become dominated even if just sporadically or the trainer may introduce tactical changes)or at least can change its effectiveness (e.g., a player that was nullified by an effective defensecan resurface later on, when tiredness prevents the defenders keeping tight marks). To accountfor this, we also keep track of the minute in which each pass was made.
Once the kind of data we needed was defined, data extraction was done by ourselves, review-ing the knock-out games played by Spain (contrarily to regular group games in which a teamcan speculate with a draw or even with a somehow minimal loss in order to qualify for the nextphase, knock-out games imply a win-lose situation and therefore the playing style and tacticsare effectively directed at winning the game without depending on external factors‡). These
‡Winning the game must be interpreted here as progressing on to the next knock-out stage rather thanscoring more goals than the opponent. For example, a team may decide to play very defensively in order toreach the penalty shootout if they consider they will be outplayed otherwise; be that as it may, this reflects adefinite and valid style, and is anyway not applicable to the games considered in which Spain went all out to

NETWORK ANALYSIS OF THE 2010 FIFA WORLD CUP CHAMPION 25
correspond to the games against Portugal (round of 16) (not analyzed in this paper), Paraguay(quarterfinals), Germany (semifinals), and the Netherlands (final). The raw data obtained fromthis visual inspection consists of a list of all passes in the match, with the format
<half> <minute> <player> <zone> <player’> <zone’>indicating which player passed to which player, in which minute, and in which pitch zoneseach of them were in. As mentioned before, each pair (player, zone) can be interpreted as avirtual player for the purposes of network construction. More precisely we consider a movingwindow of 15 minutes (which we believe is long enough to capture the state of the game at anygiven instant) and build a series of directed graphs Gi(V, Ei) where V = {(p, z) | p ∈ T, z ∈{1, 2, · · · , 9}}, T is the set of actual players in the national team, and (u → v) ∈ Ei if, and onlyif, virtual player u passed to virtual player v within the i-th time window. Figure 2 shows anexample of the networks obtained.
(1,1)
(15,2)
(5,4)
(18,5)
(5,1)
(11,3)
(3,2)
(5,5)
(3,4)
(14,4)
(6,5) (16,5)
(16,4)
(8,4)
(8,5)
(8,6)
(6,7)
(18,7)
(18,6)
(11,6)
(6,9)
(7,9)
(14,6)
(7,8)
(7,7)
(15,5)
(3,5)
(6,8)
(14,5)
(14,7)
(16,6)
(11,5)
(6,6)
(16,7)
(8,8)
(5,9)
(15,8)
(8,7)
Figure 2 An example of the networks obtained, taken from the Germany-Spain match(15’, 1st half). Each node is labeled with a pair (p, z) where p is the squadnumber of the player — see Appendix — and z is the zone of the pitch. Onlythose nodes corresponding to players/zones intervening in the game during theparticular time window considered are displayed. Node sizes depend on degreecentrality and the different shades correspond to defense (zones 1–4), midfield(zone 5) and attack (zones 6–9)
This data was extracted by visualizing the matches by the authors, which has been found tobe an appropriate, and probably the only, method for gathering network data from a match[14];data collection took approximately 4–5 times the duration of matches§.
effectively win the game before penalty shootouts.§This data is available upon request to the scientific community, with the provision that this paper is refer-
enced.

26 CARLOS COTTA, et al.
4 Analyzing the Spanish Team
The Spanish national team entered the World Cup 2010 as one of the favorites to win thetrophy. While to some extent this was not a completely new situation from a local point of view(and even a scientific point of view: Spain hosted the World Cup in 1982, and New Scientistpublished an article proving why they should win due to home advantage[15]), in this case thisconsideration was quite reasonable a priori, since Spain was the current incumbent in Europeafter winning the Euro Cup in 2008 for the 2nd time in their history (the 1st time datingback to 1964 in the Euro Cup hosted precisely in Spain). This win at the European level (andeven more precisely the win over Italy in penalty shootouts in the quarterfinals game) was seenby many as a turning point from the psychological point of view, finally breaking the “curseof the QFs” that had been inescapable for several other — very talented — Spanish teams.On reflection, the current generation of players was probably the most perfectly suited to thispurpose, since they had been surfing on a winning wave in the national team since junior stages(Iker Casillas, Xavi Hernandez, and Carlos Marchena were members of the team that won theUnder-20 World cup in 1999) and were also part of the last dominant cycles of Real MadridCF and FC Barcelona at club level (holding numerous National, European, and Internationaltrophies).
The lack of this “choking culture” that had haunted preceding generations, and finally thediscovery of a playing style that players felt their own (incidentally a style that departed bya long way from the traditional “Spanish fury” that had been the national team’s trademarkuntil this generation, and arguably a finding that was in part possible due to the unfortunateseries of injuries of several players) led to the current success cycle of the team. While thisstyle –informally termed “tiki-taka”[16] (apparently, an otherwise meaningless phrase that canbe translated as “touchy-touch”, but which actually is very close to Basque “tipi tapa” meaningstep by step) by former coach of the Spanish national team Javier Clemente in a pejorative senseand later popularized by the late Andres Montes, a famous TV commentator, in a more neutralsense– is now considered a trademark by many in Spain, and is commonly associated with thatused by FC Barcelona (a claim based on the number of players of this club in the nationalteam), a deeper inspection indicates that there are stylistic differences not only between thenational team and other clubs in Spain, but also between the Euro 2008 team and the WorldCup 2010 team. The former had players such as Fernando Torres (then at Liverpool FC) orDavid Silva and David Villa (then at Valencia CF) at their highest performance level and playeda more dynamic, faster combinative football. The latter team had several of these players at alower performance level, some key players in midfield or defense were obviously two years olderand other players more suited to passing play were incorporated. Indeed, while FC Barcelonaplayers were a minority in the Euro 2008 team (just 3, outnumbered for example by the 4players contributed by Valencia CF or Liverpool FC), they were more numerous in the WorldCup 2010 team. The result was possession-based style in which the ball often moves rapidlybut in which the net advance is slow (yet steady). In the following we will analyze some of thecharacteristics of this style using the network information collected as indicated in Section 3.In particular, we will pay attention to the following features:
1) Number of passes per minute: this provides an indication of the speed of the game.2) Number of consecutive passes without losing the ball: this reflects the elaborateness of
the offensive game of the Spanish team.3) Clustering coefficient[17]: this measure is an indication of the extent to which players
tend to cluster together when passing the ball. To compute this coefficient we symmetrize thenetwork and compute the local clustering coefficient γv for each node v with more than two
NETWORK ANALYSIS OF THE 2010 FIFA WORLD CUP CHAMPION 27
vertices asγv =
Nv
δv(δv − 1)/2,
where δv is the degree of node v and Nv is the number of links between nodes u, w connectedto v. Subsequently, the clustering coefficient γG of the network G is
γG =
∑
v∈V \V (1)
γv
∣∣V \ V (1)
∣∣ ,
i.e., the average clustering coefficient for all nodes with more than one neighbor — see [18].4) Centrality: we analyze the network at a microscopic level trying to identify the most
important nodes in two ways, by considering the number of passes (weighted degree centrality)and by considering the flow of the ball. Regarding this latter aspect, our analysis tries toidentify which player (and in which pitch zone) is more likely to have the ball after a longsequence of passes. This is analogous to eigenvector centrality[19] computed using the poweriteration method, i.e., converting the adjacency matrix in a Markov matrix and iterating froman initial vector representing a uniform distribution among all players intervening in the game;this process provides the probability of reaching a certain player by following an arbitrarily longrandom walk in the graph.
For the convenience of the reader, we include in Table 1 the final result and scorers of thematches considered.
Table 1 Matches analyzed in this work. For the sake of completeness we also include the finalscore and the player/minute in which goals were scored
Match Result Scorer
Paraguay-Spain 0-1 Villa (83′)Germany-Spain 0-1 Puyol (73′)Netherlands-Spain 0-1 Iniesta (116′)
4.1 Quarter Final Match: Paraguay-Spain
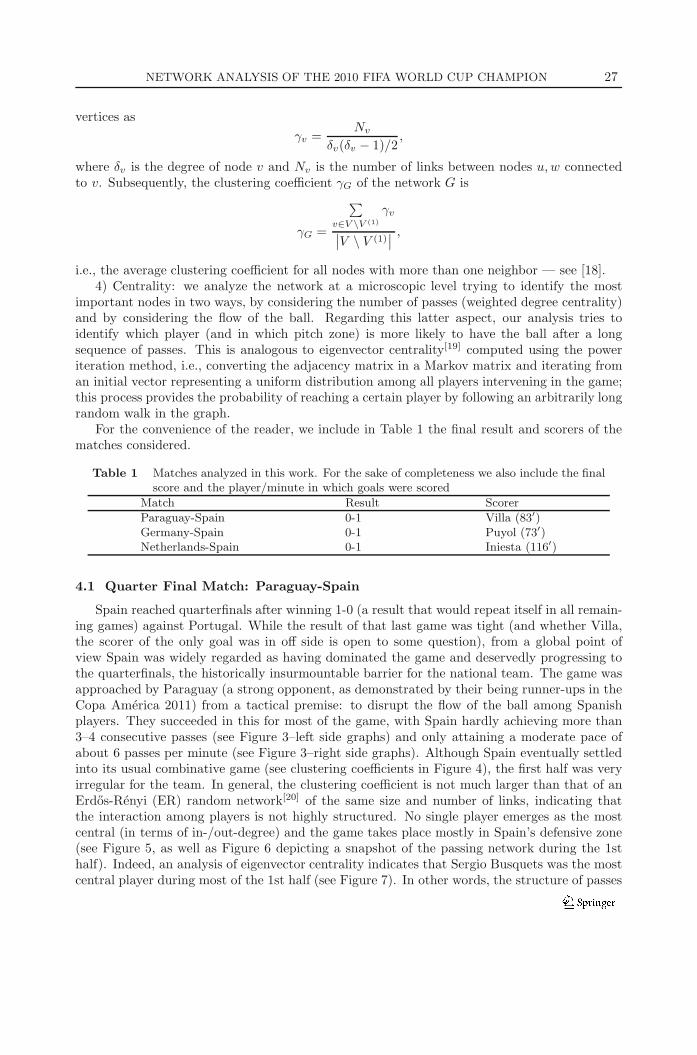
Spain reached quarterfinals after winning 1-0 (a result that would repeat itself in all remain-ing games) against Portugal. While the result of that last game was tight (and whether Villa,the scorer of the only goal was in off side is open to some question), from a global point ofview Spain was widely regarded as having dominated the game and deservedly progressing tothe quarterfinals, the historically insurmountable barrier for the national team. The game wasapproached by Paraguay (a strong opponent, as demonstrated by their being runner-ups in theCopa America 2011) from a tactical premise: to disrupt the flow of the ball among Spanishplayers. They succeeded in this for most of the game, with Spain hardly achieving more than3–4 consecutive passes (see Figure 3–left side graphs) and only attaining a moderate pace ofabout 6 passes per minute (see Figure 3–right side graphs). Although Spain eventually settledinto its usual combinative game (see clustering coefficients in Figure 4), the first half was veryirregular for the team. In general, the clustering coefficient is not much larger than that of anErdos-Renyi (ER) random network[20] of the same size and number of links, indicating thatthe interaction among players is not highly structured. No single player emerges as the mostcentral (in terms of in-/out-degree) and the game takes place mostly in Spain’s defensive zone(see Figure 5, as well as Figure 6 depicting a snapshot of the passing network during the 1sthalf). Indeed, an analysis of eigenvector centrality indicates that Sergio Busquets was the mostcentral player during most of the 1st half (see Figure 7). In other words, the structure of passes

28 CARLOS COTTA, et al.
1 half
mea
n nu
mbe
r of c
onse
cutiv
e pa
sses
minute10 20 30 40
0
1
2
3
4
5
6
7
2 half
mea
n nu
mbe
r of c
onse
cutiv
e pa
sses
minute50 60 70 80 90
0
1
2
3
4
5
6
7
1 half
pass
es/m
inut
e
minute10 20 30 40
0
2
4
6
8
10
2 half
pass
es/m
inut
e
minute50 60 70 80 90
0
2
4
6
8
10
Figure 3 Paraguay-Spain. Upper graphs — Average number of consecutive passes. Lowergraphs — Passes per minute. In this figure and all subsequent ones, the white lineis the mean and the shadowed area covers one standard error of the mean aboveand below the former. Data always corresponds to the Spanish national team

NETWORK ANALYSIS OF THE 2010 FIFA WORLD CUP CHAMPION 29
of the Spanish team was leading to the less creative midfielder dominatinge the circulation ofthe ball. This does not mean Spain was necessarily under attack, but that Paraguay’s pressingavoided Spain’s more creative midfielders being actively engaged in the game and settling theball in offensive zones. The game’s turning point took place when two penalty shots were failedsuccessively first by Paraguay and then by Spain (low valley shown in Figure 3–right graph),after which Paraguay lowered their defensive strength due to tiredness, and Spain could finallyenter into longer sequences of passes, with Xavi Hernandez and Xabi Alonso emerging as thedominant players in the midfield.
1 half
clus
terin
g co
effic
ient
(zon
e-ba
sed)
minute10 20 30 40
0
0.1
0.2
0.3
0.4
0.5
0.6
0.7
0.8
0.9
12 half
clus
terin
g co
effic
ient
(zon
e-ba
sed)
minute50 60 70 80 90
0
0.1
0.2
0.3
0.4
0.5
0.6
0.7
0.8
0.9
1
Figure 4 Paraguay-Spain. Clustering coefficient (CR). The dottedline indicates the CR of a random network with the samenumber of players involved and the same number of links
4.2 Semi Final Match: Germany-Spain
The victory over Paraguay in the quarterfinals meant Spain advanced for the first time inhistory to the semifinals¶, and a general consensus that the team had fulfilled the expectationsof the supporters. This meant that the semifinal was approached as a game in which there wasnothing to lose (although it must be noted that the same could be said for Germany, who hadpresented a very young team and a new, less physical style, and were in a transitional year).Maybe due to this lack of pressure, Spain gave their best performance of the tournament.
The game was thoroughly dominated by Spain, who managed to engage in a fast game(well above 6 passes per minute, the ceiling reached for the greatest part of the game againstParaguay, cf. Figures 3–bottom row and 8–bottom row) and more elaborated sequences of
¶The previous best performance of Spain had been a 4th place in Brazil’s World Cup 1950, an edition inwhich there was a small league among the top-four teams.

30 CARLOS COTTA, et al.
1 half
play
er w
ith h
ighe
st d
egre
e ce
ntra
lity
minute
10 20 30 40
13568
141516
zone
of t
he p
laye
r
minute
10 20 30 40
1
45
78
2 half
play
er w
ith h
ighe
st d
egre
e ce
ntra
lity
minute
50 60 70 80 90
3
8
1415
zone
of t
he p
laye
r
minute
50 60 70 80 90
45
7
Figure 5 Paraguay-Spain. Zone-based player centrality based on number of passes
(11,5)
(6,5)
(16,5)
(16,7)
(6,7)
(7,7)
(14,7)
(8,8)
(7,6)
(8,7)
(16,4)
(9,7)
(15,5) (16,2)
(15,8)
(9,5)
(3,5)
(15,4)
(7,5)
(3,2)
(11,4)
(14,4)
(14,2)
(3,4)
(15,2)(8,4)
(1,1)
(3,3)
(11,3)
(5,4)
(8,5)
(9,8)
(6,8)
(14,5)
(14,3)
Figure 6 A snapshot of the passing network (15’, 1st half) taken from the Paraguay-Spainmatch. Node sizes depend on degree centrality. Note the diminished role ofcreative midfielders such as Xavi (8) or Iniesta (6), as well as the important roleof Busquets (16) in the midfield and Pique (3) in defensive positions
NETWORK ANALYSIS OF THE 2010 FIFA WORLD CUP CHAMPION 31
1 half
play
er w
ith h
ighe
st e
igen
valu
e ce
ntra
lity
minute
10 20 30 40
13
78
11
141516
zone
of t
he p
laye
r
minute
10 20 30 40
1
456789
2 half
play
er w
ith h
ighe
st e
igen
valu
e ce
ntra
lity
minute
50 60 70 80 90
35678
1415
zone
of t
he p
laye
r
minute
50 60 70 80 90
45
7
9
Figure 7 Paraguay-Spain. Zone-based player centrality based on random walks
passes (roughly twice as many as against Paraguay, cf. Figures 3–top row and 8–top row).It is interesting to note that the clustering coefficient was rather stable (the drop near theend of the 2nd half corresponds to the final push exerted by Germany once they were 1 goaldown) and similar to that reached against Paraguay but clearly higher than that of the ERnetwork. This indicates the underlying passing pattern was maintained in both games butwas more effective — i.e., resulted in longer sequences of passes – against Germany. Note inthis sense how such longer sequences of passes are correlated with shots at goal, in particularin successful teams[21]. As shown in Figure 2, the passing network looks more balanced andlayered than against Paraguay at the beginning of the match, with a more important role of themost talented players in the midfield and a notable presence in offensive positions. One of thetactical surprises of the match was the inclusion in the starting eleven of Pedro Rodrıguez as afalse winger, playing in-between the German defense and midfield. As seen in the eigenvectorcentrality analysis (Figure 11), he was instrumental in the circulation of the ball during longphases of the match. Xabi Alonso and specially Xavi Hernandez during the 2nd half were theclear hubs of the game (Paraguay had partly succeeded in disabling these two players, hence themore disconnected game). Actually the 2nd half saw the ball parked deeply inside the Germanfield (Figure 10–bottom, right), indicating a clear domination of the game: sequences of upto 24 passes took place before Spain’s goal (which paradoxically was a header after a cornerkick).
4.3 Final Match: Netherlands-Spain
The great final took place against the Netherlands, a very talented team that featured one ofthe best players of the season in the midfield (Wesley Sneijder, surprisingly left out of the Ballond’Or contest in that year despite being instrumental in his team – FC Internazionale Milano–

32 CARLOS COTTA, et al.
1 half
mea
n nu
mbe
r of c
onse
cutiv
e pa
sses
minute10 20 30 40
0
2
4
6
8
10
12
2 half
mea
n nu
mbe
r of c
onse
cutiv
e pa
sses
minute50 60 70 80 90
0
2
4
6
8
10
12
1 half
pass
es/m
inut
e
minute10 20 30 40
0
2
4
6
8
10
122 half
pass
es/m
inut
e
minute50 60 70 80 90
0
2
4
6
8
10
12
Figure 8 Germany-Spain. Upper graphs — Average number of con-secutive passes. Lower graphs — Passes per minute

NETWORK ANALYSIS OF THE 2010 FIFA WORLD CUP CHAMPION 33
1 halfcl
uste
ring
coef
ficie
nt (z
one-
base
d)
minute10 20 30 40
0
0.1
0.2
0.3
0.4
0.5
0.6
0.7
0.8
0.9
12 half
clus
terin
g co
effic
ient
(zon
e-ba
sed)
minute50 60 70 80 90
0
0.1
0.2
0.3
0.4
0.5
0.6
0.7
0.8
0.9
1
Figure 9 Germany-Spain. Clustering coefficient
1 half
play
er w
ith h
ighe
st d
egre
e ce
ntra
lity
minute
10 20 30 40
35
8
141618
zone
of t
he p
laye
r
minute
10 20 30 40
45
7
2 half
play
er w
ith h
ighe
st d
egre
e ce
ntra
lity
minute
50 60 70 80 90
678
1618
zone
of t
he p
laye
r
minute
50 60 70 80 90
45678
Figure 10 Germany-Spain. Zone-based player centrality based on number of passes

34 CARLOS COTTA, et al.
1 half
play
er w
ith h
ighe
st e
igen
valu
e ce
ntra
lity
minute
10 20 30 40
3568
11
14
18
zone
of t
he p
laye
r
minute
10 20 30 40
34567
2 half
play
er w
ith h
ighe
st e
igen
valu
e ce
ntra
lity
minute
50 60 70 80 90
1
68
141618
zone
of t
he p
laye
r
minute
50 60 70 80 90
1
4567
Figure 11 Germany-Spain. Zone-based player centrality based on random walks
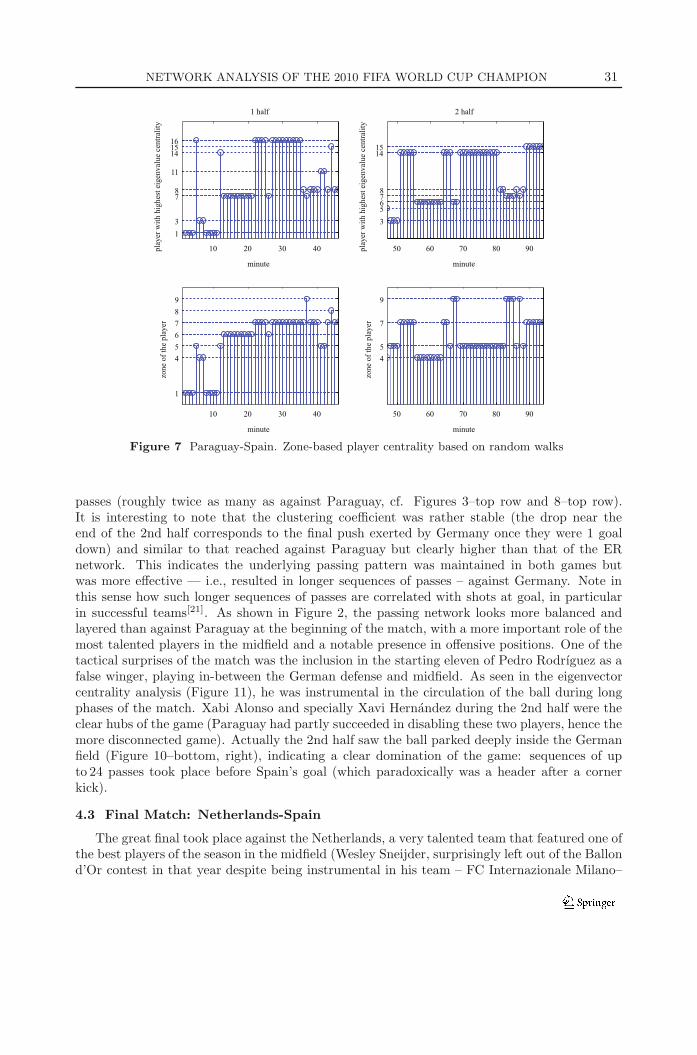
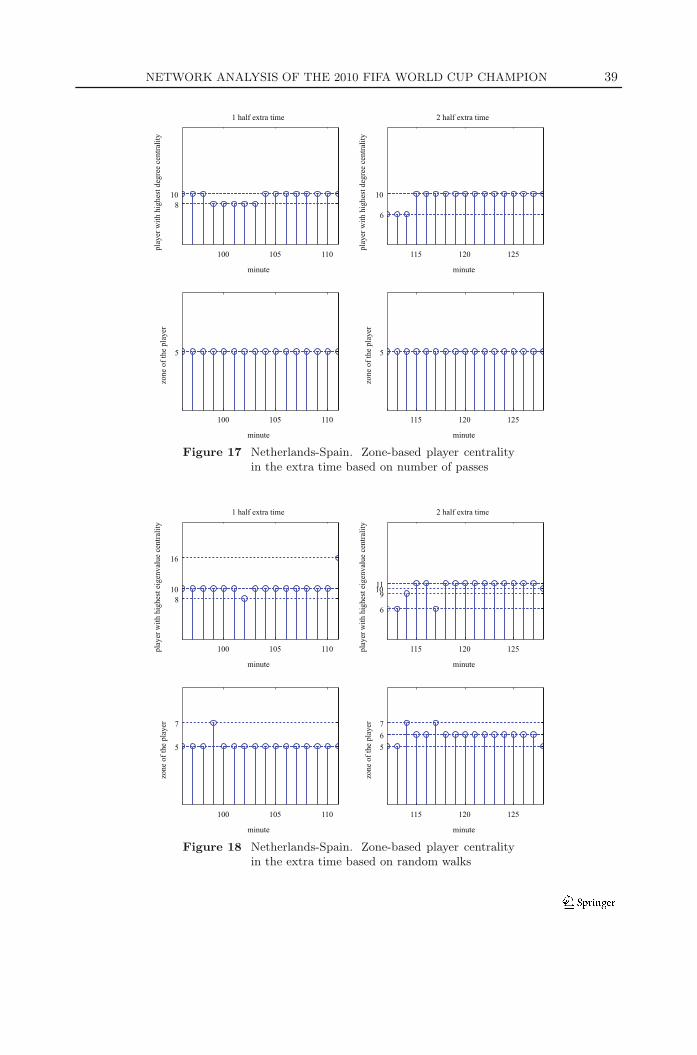
achieving the treble) and possibly the fastest and finest winger in the whole tournament (ArjenRobben). Indeed, the connection between these two players could have very well tipped thebalance in favor of Netherlands had not Iker Casillas provided an outstanding performance.Despite the talent available on the pitch, the Dutch team engaged however in a very roughgame, forever symbolized by Nigel de Jong’s ominous tackle on Xabi Alonso’s chest[22]. Tosome extent the tactical objective was similar to that of Paraguay’s — disrupt the smooth flowof the ball in the Spanish team — yet the execution was much more questionable (and so wasthe condescending attitude of the referee towards it). The game settled for the most part intoa very slow pace due to the number of interruptions (Figure 13), and sequences of passes weregenerally short, analogously to the game against Paraguay (Figure 12). Unlike the latter game,the Dutch team succeeded in disabling Xabi Alonso but the balance of the game followed asimilar pattern in that the physical style of the Netherlands became less consistent as timepassed. The midfield was eventually controlled by Xavi Hernandez (Figures 15 and 16) and— despite two clear fast breaks by Robben mentioned before — the ball advanced away fromSpain’s defensive zone. The average number of consecutive passes gained momentum at theend of the 2nd half and was rather stable during the 1st half of extra time. Not surprisingly,the pace of the game decreased steadily during the extra time (Figure 13–right side), due toboth the exhaustion of the players and the team’s strategy shifting to a safer mode of holdingpossession in order to avoid conceding a late goal and trying to exploit a more direct approachwhen possible. Indeed, the clustering coefficient during the 2nd part of the extra time is muchlower than in remaining games (Figure 14–bottom), which is consistent with a less structureddevelopment of the game and larger distances between team lines. The whole extra timewitnessed the emergence of Cesc Fabregas (Figures 17 and 18), coming from the bench todominate the midfield, eventually providing the assist that resulted in Andres Iniesta’s decisivegoal.

NETWORK ANALYSIS OF THE 2010 FIFA WORLD CUP CHAMPION 35
1 half
mea
n nu
mbe
r of c
onse
cutiv
e pa
sses
minute10 20 30 40
0
1
2
3
4
5
6
7
2 half
mea
n nu
mbe
r of c
onse
cutiv
e pa
sses
minute50 60 70 80 90
0
1
2
3
4
5
6
7
1 half extra time
mea
n nu
mbe
r of c
onse
cutiv
e pa
sses
minute100 105 110
0
1
2
3
4
5
6
7
2 half extra time
mea
n nu
mbe
r of c
onse
cutiv
e pa
sses
minute115 120 125
0
1
2
3
4
5
6
7
Figure 12 Netherlands-Spain. Average number of consecutive passes inthe match time (top) and in the extra time (bottom)

36 CARLOS COTTA, et al.
1 half
pass
es/m
inut
e
minute10 20 30 40
0
2
4
6
8
10
12
14
162 half
pass
es/m
inut
e
minute50 60 70 80 90
0
2
4
6
8
10
12
14
16
1 half extra time
pass
es/m
inut
e
minute100 105 110
0
2
4
6
8
10
12
14
162 half extra time
pass
es/m
inut
e
minute115 120 125
0
2
4
6
8
10
12
14
16
Figure 13 Netherlands-Spain. Passes per minute in thematch time (top) and in the extra time (bottom)

NETWORK ANALYSIS OF THE 2010 FIFA WORLD CUP CHAMPION 37
1 halfcl
uste
ring
coef
ficie
nt (z
one-
base
d)
minute10 20 30 40
0
0.1
0.2
0.3
0.4
0.5
0.6
0.7
0.8
0.9
12 half
clus
terin
g co
effic
ient
(zon
e-ba
sed)
minute50 60 70 80 90
0
0.1
0.2
0.3
0.4
0.5
0.6
0.7
0.8
0.9
1
1 half extra time
clus
terin
g co
effic
ient
(zon
e-ba
sed)
minute100 105 110
0
0.1
0.2
0.3
0.4
0.5
0.6
0.7
0.8
0.9
12 half extra time
clus
terin
g co
effic
ient
(zon
e-ba
sed)
minute115 120 125
0
0.1
0.2
0.3
0.4
0.5
0.6
0.7
0.8
0.9
1
Figure 14 Netherlands-Spain. Clustering coefficient in thematch time (top) and in the extra time (bottom)

38 CARLOS COTTA, et al.
1 half
play
er w
ith h
ighe
st d
egre
e ce
ntra
lity
minute
10 20 30 40
35
8
1416
zone
of t
he p
laye
r
minute
10 20 30 40
45
2 half
play
er w
ith h
ighe
st d
egre
e ce
ntra
lity
minute
50 60 70 80 90
568
11
1516
zone
of t
he p
laye
r
minute
50 60 70 80 90
2345
7
Figure 15 Netherlands-Spain. Zone-based player centrality based on number of passes
1 half
play
er w
ith h
ighe
st e
igen
valu
e ce
ntra
lity
minute
10 20 30 40
135
8
151618
zone
of t
he p
laye
r
minute
10 20 30 40
1
45
8
2 half
play
er w
ith h
ighe
st e
igen
valu
e ce
ntra
lity
minute
50 60 70 80 90
1
678
15
22
zone
of t
he p
laye
r
minute
50 60 70 80 90
1
56789
Figure 16 Netherlands-Spain. Zone-based player centrality based on random walks
NETWORK ANALYSIS OF THE 2010 FIFA WORLD CUP CHAMPION 39
1 half extra time
play
er w
ith h
ighe
st d
egre
e ce
ntra
lity
minute
100 105 110
810
zone
of t
he p
laye
r
minute
100 105 110
5
2 half extra time
play
er w
ith h
ighe
st d
egre
e ce
ntra
lity
minute
115 120 125
6
10
zone
of t
he p
laye
r
minute
115 120 125
5
Figure 17 Netherlands-Spain. Zone-based player centralityin the extra time based on number of passes
1 half extra time
play
er w
ith h
ighe
st e
igen
valu
e ce
ntra
lity
minute
100 105 110
810
16
zone
of t
he p
laye
r
minute
100 105 110
5
7
2 half extra time
play
er w
ith h
ighe
st e
igen
valu
e ce
ntra
lity
minute
115 120 125
6
91011
zone
of t
he p
laye
r
minute
115 120 125
567
Figure 18 Netherlands-Spain. Zone-based player centralityin the extra time based on random walks

40 CARLOS COTTA, et al.
5 Conclusions and Future Work
This paper has attempted to use some graph and network metrics to analyze the performanceand playing style of the Spanish national football team in the FIFA World Cup 2010. Whenanalyzed from a temporal perspective, global measures such as the number of consecutive passesor the number of passes per minute provide a measure of the success of the team in imposingits style (or alternatively the success of the opposing team in disrupting the style of the Spanishteam). A deeper insight is obtained by observing the clustering coefficient which captures thecombinative nature of the “tiki-taka” style, and hints that the passing network exhibits thesmall-world property. While prone to a kind of baroqueness in the sense that many passes areoften made in a short distance (contributing to the Spanish team’s having the highest percentageof completed passes in the tournament: 87%[23]) and might be expendable, it is evident thatit has prime value as a defensive strategy, by depriving the opponent of ball possession, one ofthe factors that is determinant in the game’s outcome[24,25]. Even in the games in which theperformance of the Spanish team has been deemed worse by analysts and the general public,this combinativeness imprint globally remains, with marked valleys in the aftermath of scoringa goal (and the subsequent push of the trailing team) and sporadically during the final, a specialgame in which emotions and passion often led to lower precision and less elaborated game-play.
There is of course much work to be done. From a purely methodological point of view,it is of crucial importance to keep analyzing other network measures such as node and edgebetweenness, which naturally capture the hubs and essential associations in the distribution ofthe ball (let us note en passant here as an example that the role of Sergio Busquets was initiallymuch criticized by the press and a large part of the public due to his lower creativeness; howeverit is clear that he was instrumental in providing balance to the midfield; this balance shouldnot be measured in terms of outstanding possession of the ball, a task for which more creativemidfielders should be responsible, but more likely for his contribution to the robustness of thenetwork). This can have not just an explanatory value, but also a predictive value in terms ofidentifying the weak points of the circuit that may be targeted by the opponent. From a moreglobal perspective, it may be interesting to analyze whether there are other high-level propertiesof the network — e.g., scale-freedom – preserved over time. In addition to these methodologicalissues, it will be very useful to deploy this kind of analysis on further data both at club level(e.g., to identify similarities and dissimilarities between team and player performance in theirclubs and in the national team), and at the national team level such as in the Euro 2012 inPoland and Ukraine or — looking beyond — the World Cup 2014 in Brazil.
References
[1] Passos P, Davids K, Araujo D, Paz N, Minguens J, and Mendes J, Networks as a novel tool forstudying team ball sports as complex social systems, Journal of Science and Medicine in Sport,2011, 14(2): 170–176.
[2] Euro 2004 network predictions at Revista Redes (accessed January 2012), URL: http://revista-redes.rediris.es/webredes/eurocopa2004.htm, 2004.
[3] Mendes R S, Malacarne L C, and Anteneodo C, Statistics of football dynamics, European PhysicalJournal B, 2007, 57(3): 357–363.
[4] Brillinger D R, A potential function approach to the flow of play in soccer, Journal of QuantitativeAnalysis in Sports, 2007, 3(1): 3.

NETWORK ANALYSIS OF THE 2010 FIFA WORLD CUP CHAMPION 41
[5] Hughes M and Franks I M, Notational Analysis of Sport: Systems for Better Coaching and PEr-formance in Sport, Routledge, New York, 2004.
[6] Onody R N and De Castro P A, Complex network study of brazilian soccer players, Physical ReviewE, 2004, 70(3): 037103.
[7] Yamamoto Y and Yokoyama K, Common and unique network dynamics in football games, PLoSONE, 2011, 6(12): e29638.
[8] Duch J, Waitzman J S, and Amaral L A N, Quantifying the performance of individual players ina team activity, PLoS ONE, 2010, 5(6): e10937.
[9] Lee J, Borgatti S P, Molina J L, and Merelo Guervos J J, Who passes to whom: Analysis of optimalnetwork structure in soccer matches, Poster at the Sunbelt XXV conference, URL: http://revista-redes.rediris.es/webredes/novedades/soccer sunbelt.pdf, 2005.
[10] Heuer A and Rubner O, Fitness, chance, and myths: An objective view on soccer results, TheEuropean Physical Journal B — Condensed Matter and Complex Systems, 2009, 67: 445–458.
[11] Heuer A, Mueller c, and Rubner O, Soccer: Is scoring goals a predictable poissonian process? EPL(Europhysics Letters), 2010, 89: 38007.
[12] Bundio J and Conde M, Analisis del desempeno deportivo durante la eurocopa 2004 a partir delanalisis de redes sociales, REDES-Revista hispana para el analisis de redes sociales, 2009, 13(0)(in Spanish).
[13] Simon H A, On a class of skew distribution functions, Biometrika, 1955, 42(3–4): 425–440.
[14] Karbowski M R, Video-based social network analysis data collection in sport, QMSS2 2011 Work-shop: Social Network Data Collection, URL: http://vladowiki.fmf.uni-lj.si/lib/ exe/fetch.php?media=events: qmss2:abs:mariusz karbowski.doc, 2011.
[15] Dowie J, Why Spain should win the world cup, New Scientist, 1982, 94(10): 693–695.
[16] Berrone P, Business lessons from the soccer world cup, Management Research: Journal of theIberoamerican Academy of Management, 2011, 9(1): 73–78.
[17] Holland P W and Leinhardt S, Transitivity in structural models of small groups, ComparativeGroup Studies, 1971, 2: 107–124.
[18] Li X, Leonard D, and Loguinov D, On reshaping of clustering coefficients in degree-based topologygenerators, ed. by Leonardi S, Algorithms and Models for the Web-Graph (WAW 2004), volume3243 of Lecture Notes in Computer Science, Springer-Verlag, Rome, Italy, 2004, 68–79.
[19] Bonacich P, Factoring and weighting approaches to status scores and clique identification, Journalof Mathematical Sociology, 1972, 2: 113–120.
[20] Erdos P and Renyi A, On the evolution of random graphs, Publications of the Mathematical Insti-tute of the Hungarian Academy of Sciences, 1960, 5: 17–61.
[21] Hughes M and Franks I M, Analysis of passing sequences, shots and goals in soccer, Journal ofSport Sciences, 2005, 23(5): 509–514.
[22] BBC news piece: “World Cup 2010: Xabi Alonso slams Nigel De Jong tackle” (accessed May 2012),URL: http://news.bbc.co.uk/sport2/hi/football/world cup 2010/8813661.stm, July 13th, 2010.
[23] Datablog: “World Cup 2010 statistics: Every match and every player in data” (accessed May 2012),URL: http://www.guardian.co.uk/news/datablog/2010/jul/09/world-cup-2010-statistics, July 9th,2010.
[24] Lago C and Martın R, Determinants of possession of the ball in soccer, Journal of Sports Sciences,2007, 25(9): 969–974.
[25] Bate R, Football chance: Tactics and strategy, Science and Football, 1988, 293–301.

42 CARLOS COTTA, et al.
Appendix: Spain’s Squad Numbers
# Name Position
1 Iker Casillas (C) Goalkeeper2 Raul Albiol Defender3 Gerard Pique Defender4 Carlos Marchena Defender5 Carles Puyol Defender6 Andres Iniesta Midfielder7 David Villa Forward8 Xavi Hernandez Midfielder9 Fernando Torres Forward10 Cesc Fabregas Midfielder11 Joan Capdevila Defender12 Vıctor Valdes Goalkeeper13 Juan Mata Forward14 Xabi Alonso Midfielder15 Sergio Ramos Defender16 Sergio Busquets Midfielder
17 Alvaro Arbeloa Defender18 Pedro Rodrıguez Forward19 Fernando Llorente Forward20 Javi Martınez Midfielder21 David Silva Midfielder22 Jesus Navas Forward23 Jose Manuel Reina Goalkeeper