a ncarbs analysis of sme intended innovation: learning
TRANSCRIPT

A NCaRBS analysis of SME intended innovation: Learning about the Don’t Knows Beynon, M.J. , Jones, P. , Pickernell, D. and Packham, G. Author post-print (accepted) deposited by Coventry University’s Repository Original citation & hyperlink: Beynon, M.J. , Jones, P. , Pickernell, D. and Packham, G. (2016) A NCaRBS analysis of SME intended innovation: Learning about the Don’t Knows. Omega, volume 59 (A): 97–112
http://dx.doi.org/10.1016/j.omega.2015.04.018 DOI 10.1016/j.omega.2015.04.018 ISSN 0305-0483 Publisher: Elsevier NOTICE: this is the author’s version of a work that was accepted for publication in Omega. Changes resulting from the publishing process, such as peer review, editing, corrections, structural formatting, and other quality control mechanisms may not be reflected in this document. Changes may have been made to this work since it was submitted for publication. A definitive version was subsequently published in Omega, [VOL 59, ISSUE A, (2015)] DOI: 10.1016/j.omega.2015.04.018 © 2015, Elsevier. Licensed under the Creative Commons Attribution-NonCommercial-NoDerivatives 4.0 International http://creativecommons.org/licenses/by-nc-nd/4.0/ Copyright © and Moral Rights are retained by the author(s) and/ or other copyright owners. A copy can be downloaded for personal non-commercial research or study, without prior permission or charge. This item cannot be reproduced or quoted extensively from without first obtaining permission in writing from the copyright holder(s). The content must not be changed in any way or sold commercially in any format or medium without the formal permission of the copyright holders. This document is the author’s post-print version, incorporating any revisions agreed during the peer-review process. Some differences between the published version and this version may remain and you are advised to consult the published version if you wish to cite from it.

1
A NCaRBS Analysis of SME Intended Innovation: Learning about the Don’t Knows
Abstract
This study demonstrates a novel form of business analytics, respecting the quality of the data
available (allowing incompleteness in the data set), as well as engaging with the uncertainty
in the considered outcome variable (inclusive of Don’t Know (DK) responses). The analysis
employs the NCaRBS technique, based on the Dempster-Shafer theory of evidence, to
investigate the relationship between Small and Medium-sized Enterprise (SME)
characteristics and whether they intended to undertake future innovation. The allowed
outcome response for intended innovation was either, Yes, No and DK, all of which are
considered pertinent responses in this analysis. An additional consequence of the use of the
NCaRBS technique is the ability to analyse an incomplete data set, with missing values in the
characteristic variables considered, without the need to manage their presence. From a soft
computing perspective, this study demonstrates just how exciting the business analytics field
of study can be in terms of pushing the bounds of the ability to handle real ‘incomplete’
business data which has real, and sometimes uncertain, outcomes. Further, the findings also
inform how different notions of ignorance in evidence are accounted for in such analysis.
1 Introduction
Individual Small and Medium-sized Enterprises (SMEs) have their own strategies for their
survival and contribution to the associated economy (Westhead et al., Van Looy et al., 2003;
Hadjimanolis, 2006, Theodorou and Florou, 2008), including in respect to innovation.
Innovation, put simply finding a more effective way of doing something (or the application of
enhanced solutions that meet new requirements), can therefore be seen to play a critical role
in enabling these firms’ business growth and improving performance (Harris et al., 2013).
Whilst this highlights an important applied business research area, there is an associated
research problem, specifically the uncertainty of this potential future activity for the firms
themselves (Sawyer et al., 2003). Within a business analytics context, this study asks the
question whether it is possible, and indeed relevant, to gain knowledge of firms expressing
uncertain innovation plans, such as by answering ‘Don’t Know’ (DK) to related questions.
For example, if an SME gives a DK response to an intended innovation question, is there an
underlying indication that the firm is more inclined to actually mean ‘No’ or ‘Yes’ to such
intended innovation.

2
In terms of analysing such uncertainty, Francis and Busch (1975) suggest, generally,
which respondents with non-substantive responses, such as DK, should not be excluded from
analysis, arguing such responses are not random and so exclusion would introduce bias in any
undertaken analysis. The general limited investigation of the DK response problem,
considered a vexing problem to researchers (Feick, 1989), with the slight exception of within
the area of political opinion (Feick, 1989; Gilljam and Granberg, 1993; Lee and Kanazawa,
2000; Luskin and Bullock, 2011), may be due to the lack of technical approaches able to
pertinently investigate this problem. Business analytics can assist in such analysis, as an area
of research, it has manifested itself to cover the more general data mining and knowledge
discovery terms often used (see Piatetsky-Shapiro, 2007), and has been welcoming of the
development of new approaches to analyse data.
This paper, demonstrates the exciting potential of business analytics, using a nascent
soft computing based methodology (see later), in a multi-direction investigation of SME
intended innovation in the UK. Beyond the prior mentioned intention to be inclusive of the
non-substantive DK response and how other variables may relate to them, a further direction
of this study is to consider the pertinent ability to analyse incomplete data, here meaning
without the need to manage in any way prevalent missing values, without needing to
transform the data in any way. This approach is in contrast to the perceived inevitable
problem of how to deal with the missing values, indeed Svolba (2014) states this very point,
going onto highlight the business point of view on the handling of missing values.
Whether it is concerned with small, medium or big data, the issue of analysing
incomplete data usually means some form of data management is required (Allison, 2000;
Schafer and Graham, 2002; Svolba, 2014). For example, dummies representing missing
values in predictors can be incorporated into regression analysis, an example of how more
traditional techniques might accommodate such incompleteness (see Graham, 2009, for
recent survey of literature on missing values). The level of impact of the missing value issue
is succinctly described by Koslowsky (2002, p. 312), who stated;
“One of the most critical issues in model formulation and marketing analytics is how to
handle missing data. If not handled correctly, even the best analysis efforts can fail,
and even worse, an entire database marketing strategy can be seriously damaged.”
The ability to analyse incomplete data, without having to manage the missing values
in some way, therefore, introduces an important dimension of intelligence to the business
analytics area of research. Specifically, this identifies an interesting point, namely that
intelligence here may not just be about producing a more pertinent answer, but also about
3
more pertinently using the data available. Indeed, what is more intelligent, using an
‘intelligent’ method to transform the incomplete data into complete data (see for example,
Huang and Zhu, 2002), or using an intelligent method that allows the use of the original
incomplete data without any transformation (as in this study)? A consequence of this study
includes the elucidation of two notions of ignorance in the evidence in the classification
problem (ignorance due to missing values and ignorance from variable value contribution).
Such an intelligent method, however, in addition to being able to handle these two
issues, of uncertain DK responses and incomplete (missing) data, would also need to still be
able to analyse the important applied problem which the data has been identified as being
able to help address, here SME intended innovation, producing results that are clearly
interpretable. One specific feature of the unfolding popularity of business analytics is its
association to producing results that can be then used in policy decisions, and for example,
the ability to offer competitive advantage amongst organisations (see for example, Kohavi et
al., 2002; Sharma et al., 2010). Here, the competitive advantage in the considered applied
problem may be more at the policy maker level, being able to use the presented results to
develop policies that inspire higher SME performance (here innovation).
The technique employed throughout this study is the N-State Classification and
Ranking Belief Simplex (NCaRBS), introduced in Beynon and Kitchener (2006) and Beynon
et al. (2014), a development from the original CaRBS (Beynon, 2005a, 2005b). With its
methodology based on the Dempster-Shafer theory of evidence (Dempster, 1967; Shafer,
1976), also called theory of belief functions, the technique has a close association to soft
computing (see for example, Jiroušek, 2010). In this study, the use of NCaRBS will
demonstrate the ability to pertinently work throughout the three research directions outlined
previously. Results presented will include consideration of the level of classification fit of
the analysis undertaken, contribution (predictive power) of the characteristic variables
considered, the ability to interpret analysis of individual objects and validation of results
through re-sampling based analysis.
The structure of the rest of the paper is as follows: In section 2, brief descriptions of
soft computing, the NCaRBS analysis technique and incomplete data handling are presented.
In section 3, the incomplete FSB-innovation data set is described and research problem
presented. In section 4, an initial analysis using NCaRBS is presented, including exposition
of the level of classification fit, contribution of characteristic variables and elucidation of
individual objects’ classification details. In section 5, validation of the results is given with
respect to a re-sampling based analysis of the data set, using in-sample and out-sample

4
partitioned data sets. In section 6, inferences in respect to SME innovation and business
analytics are given. In section 7, conclusions are given as well as direction for future
research.
2 Soft computing, NCaRBS technique and incomplete data handling
This section is broken down into three subsections, briefly describing the issues of, soft
computing, NCaRBS technique and incomplete data handling.
Soft computing
One direction contributing to the nascence of business analytics has been technical
development in the area of soft computing. The understood tolerance of imprecision,
uncertainty and approximation, underpinning the inspiration of soft computing in respect to
modelling a wide variety of human rational decisions (Seising and Sanz, 2011), has brought a
number of non-traditional analysis techniques into the domain of business analytics.
Pertinent to this study, Azvine et al. (2003) focuses on soft computing as an emerging
technology suitable for incorporation into business analytics applications, highlighting the
often significant degree of manual intervention in preparing, presenting and analysing
business data. The analysis presented in this study, will remove some of the often awkward
impact of managing missing values within incomplete data, as referred to previously, with
here the ability to analyse incomplete data without such management (see later).
Underlying the technique employed in this study (NCaRBS - see next subsection),
and associated with soft computing, is Dempster-Shafer theory (DST - Dempster, 1967;
Shafer, 1976), otherwise known as the theory of belief functions (see for example, Denœux
and Masson, 2012). Liu (2003) states where DST fits with other, more common,
methodologies (p. 1):
“The Dempster-Shafer theory of belief functions has become a primary tool for knowledge
representation that bridges fuzzy logic and probabilistic reasoning.”
Further, DST is closely associated with uncertain reasoning (understanding uncertain
knowledge and how to represent it). Canfora and Pedrycz (2008, p. 1), confirm the
association of uncertain reasoning and soft computing:
“Soft computing technologies have provided us with a unique opportunity to establish a
coherent software engineering environment in which uncertainty and partial data and
knowledge are systematically handled.”
5
The technique next described and employed in this study is based on DST, and is able
to demonstrate much of the qualities of uncertain reasoning/soft computing based business
analytics. Throughout the analysis part of this study, the reader should be conscious of the
data able to be analysed, and how the approach can be used in other areas closely associated
with business analytics.
Technical description of NCaRBS
NCaRBS (N-state Classification and Ranking Belief Simplex, Beynon et al., 2014), models
the classification of nO objects (o1, o2, ..), to nD decision outcomes (d1, d2, ..), based on their
description by nC characteristics (c1, c2, ..). The characteristics’ evidence is expressed
through the initial construction of constituent BOEs (bodies of evidence – see Dempster,
1967; Shafer, 1976), from characteristic values vi,j (ith
object, jth
characteristic), to discern
between an object’s association to (focal elements) a decision outcome (say {dh}), its
complement ({¬dh}) and a level of concomitant ignorance ({dh, ¬dh}).
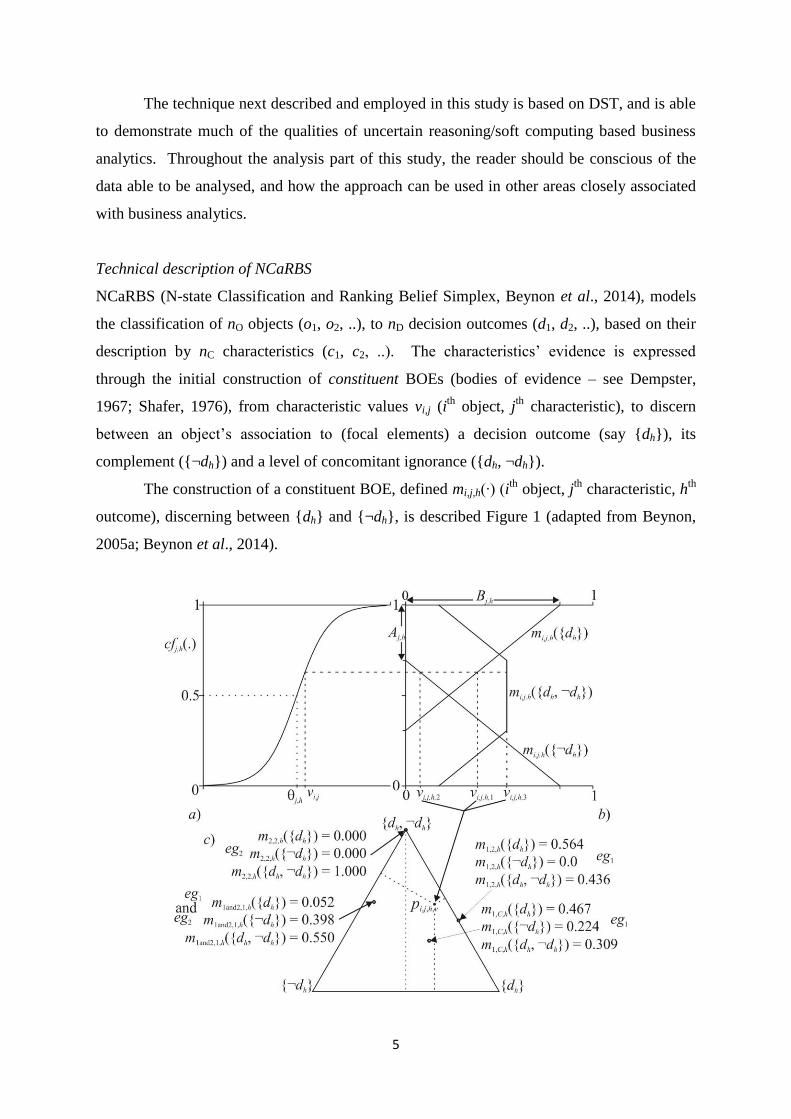
The construction of a constituent BOE, defined mi,j,h(∙) (ith
object, jth
characteristic, hth
outcome), discerning between {dh} and {¬dh}, is described Figure 1 (adapted from Beynon,
2005a; Beynon et al., 2014).

6
Figure 1. Stages within the NCaRBS technique (adapted from Beynon, 2005a; Beynon et al.,
2014), including exposition of the representation of a missing value
In Figure 1, stage a) shows the transformation of a characteristic value vi,j into a
confidence value cfj,h(vi,j), using cfj,h(vi,j) = 1/(1 + exp(kj,h(vi,j j,h))), with control
parameters kj,h and j,h (a process to standardize the domains of each characteristic variable
considered). Stage b) transforms a cfj,h(vi,j) into a constituent BOE mi,j,h(), made up of the
three mass values (see Safranek et al., 1990);
mi,j,h({dh}) =
hj
hjhj
jihj
hj
hj
A
BAvcf
A
B
,
,,
,,
,
,
1)(
1,0max ,
mi,j,h({¬dh}) =
hjjihj
hj
hjBvcf
A
B,,,
,
,)(
1,0max ,
and mi,j,h({dh, ¬dh}) = 1 mi,j,h({dh}) mi,j,h({¬dh}),
where Aj,h and Bj,h are two further control parameters. Stage c) shows a BOE mi,j,h();
mi,j,h({dh}) = vi,j,h,1, mi,j,h({¬dh}) = vi,j,h,2 and mi,j,h({dh, ¬dh}) = vi,j,h,3, can be represented as a
simplex coordinate (pi,j,h,v) in a simplex plot (equilateral triangle), with example BOEs shown
(discussed in next subsection).
Dempster’s rule of combination is used to combine these BOEs (see Dempster, 1967;
Shafer, 1976; Beynon et al., 2005a, 2005b). To illustrate, the combination of two constituent
BOEs, )(,, 1hjim and )(,, 2
hjim , for the same object (oi) and single outcome (dh), defined
))(( ,,,, 21 hjihji mm , results in a combined BOE with mass values (and focal elements) given
by:
}))({})({})({})({(1
}),({})({
}),({})({})({})({
}))({(,,,,,,,,
,,,,
,,,,,,,,
,,,,
2121
21
1221
21
hhjihhjihhjihhji
hhhjihhji
hhhjihhjihhjihhji
hhjihjidmdmdmdm
ddmdm
ddmdmdmdm
dmm
}))({})({})({})({(1
}),({})({
})({}),({
})({})({
}))({(,,,,,,,,
,,,,
,,,,
,,,,
,,,,
2121
12
12
21
21
hhjihhjihhjihhji
hhhjihhji
hhjihhhji
hhjihhji
hhjihjidmdmdmdm
ddmdm
dmddm
dmdm
dmm
}))({(}))({(1}),)({( ,,,,,,,, 2,1,2,1,21 hhjihhjihhhjihji dmmdmmddmmhjihji
.
The combination process can be performed iteratively to combine the characteristic
based evidence, constituent BOEs mi,j,h() j = 1, .., nC, for an object oi to a single outcome dh,

7
producing an outcome BOE, defined mi,-,h(∙) (other ways of combining the evidence can be
considered - see later). The outcome BOEs can also be combined to bring together the
evidence contained in them, the result termed an object BOE, for object oi is defined mi,-,-(∙)
(reduced to mi(∙)), contains the evidence on the associations of the object to the nD decision
outcomes.
The object BOEs are made up of mass values associated with focal elements that are
the power set of {d1, d2, ..} (minus the empty set). To enable the assignment of values to
individual outcomes, the pignistic probability function
}{
,..},{ 21
||)()(
hj
j
ds
dds
jjihi ssmdBetP for
object oi represents the level of pignistic probability associated with the outcome dh from the
object BOE mi(∙). The series of pignistic probability values BetPi(dh) h = 1, .., nD (see
Denœux and Zouhal, 2001), dictates the levels of association of the object oi to each of the
outcomes dh h = 1, .., nD.
The effectiveness of the NCaRBS technique, is governed by the values assigned to the
incumbent control parameters kj,h, j,h, Aj,h and Bj,h, j = 1, .., nC and h = 1, .., nD. This
necessary configuration is considered as a constrained optimization problem, solved here
using trigonometric differential evolution (TDE), see Fan and Lampinen (2003). The
configured NCaRBS system can be measured by a defined objective function (OBNCaRBS,w
).
In this study, the original OBNCaRBS
presented in Beynon et al. (2014) is developed to fairly
take account of the imbalance in the number of objects with known classification to each of
the known nD discrete decision outcomes, so termed OBNCaRBS,w
.
This class imbalance problem is well known (see Japkowicz and Stephen, 2002), and
is here resolved by weighting the error between each actual and predicted classification of an
object by the number of objects with the same decision outcome as the object in question (the
weighting term is defined wi signifying the proportion of objects associated with the same
decision outcome as that for object oi – with condition the sum of wis equals nD). The
OBNCaRBS,w
is then defined as:
OBNCaRBS,w
=
O
h
n
i i
n
h idhi
O w
vdBetP
n 1
1
2
,
D
)(
3
1,
where, in the limit, 0 OBNCaRBS,w
1.
Incomplete data handling

8
An age old problem in itself, what to do with missing values in incomplete data is an issue
that appears across a wide range of business related research (Schafer and Graham, 2002). In
the case of survey data this is certainly an ever present problem (Brick and Kalton, 1996),
with regular suggestions given on how to pertinently manage the presence of missing values,
including deleting the objects which have missing values amongst the variable values
describing them and imputing the missing values present (Little and Rubin, 1998). These
traditional approaches, and others, transform the original data in some way, and so will
negatively impact on the ability to achieve analysis results that fairly reflect the information
in the original data. It is noticeable in the literature how standard, and acceptable, it is to
have to transform incomplete data (see for example Svolba, 2014), something challenged in
this study.
Using the NCaRBS technique, however, there is no need to transform the incomplete
data in anyway, meaning the missing values present are retained in the analysis. Moreover,
with DST forming the rudiments of the NCaRBS technique, the missing values are
considered ignorant pieces of evidence (see Beynon, 2005b). For a missing value vi,j (ith
object, jth
characteristic), its ‘missingness’ is interpreted as offering only ignorant evidence
(the term ignorance here should not be viewed with negative reverence instead highlighting
that it offers no specific evidence that would lead to a correlative or causal relationship with
other variables), and modelled to this effect in the associated constituent BOE. That is,
within NCaRBS, the constituent BOE mi,j,h(·), which contains the evidence from a variable
value, is able to model this ignorance, by assigning full belief (mass value) to ignorance,
namely by defining such a BOE mi,j,h(·) as:
mi,j,h({dh}) = 0.000, mi,j,h({¬dh}) = 0.000 and mi,j,h({dh, ¬dh}) = 1.000,
for any value vi,j known to be missing. This constituent BOE is fixed, and does not change
depending on the identified control parameters (kj,h, θj,h, Aj,h and Bj,h), found when
configuring NCaRBS (see discussion around Figure 1). That is, the configuration process is
not effected by missing values, and configuration is based on the variable values that are
present in the data.
This concept of managing the missing values is next illustrated. In Table 1, a
hypothetical example of two objects (eg1 and eg2) is given, with two variables each
potentially describing them (for reference the positions of all the next described BOEs in this
example are given in Figure 1c). From Table 1, object eg1 has two numerical values present
(v1,1 and v1,2), hence there are two BOEs associated with them that contain the evidence from
each variable value (here using the same control parameters for the BOEs’ construction,

9
namely, kj,h = 0.5, θj,h = 4.0, Aj,h = 0.333, Bj,h = 0.9), whereas for eg2 one of its variable values
(v2,2) is missing (denoted by -), and actually has the same other variable value as eg1, that is,
v2,1 = v1,1.
Example vi,j mi,j,h({dh}) mi,j,h({¬dh}) mi,j,h({dh, ¬dh })
eg1 | v1,1 2.950 0.052 0.398 0.550
eg1 | v1,2 6.210 0.564 0.000 0.436
eg2 | v2,1 2.950 0.052 0.398 0.550
eg2 | v2,2 - 0.000 0.000 1.000
Table 1. Example BOEs including representation of missing value
In Table 1, the BOE mass values can be found using the mi,j,h({dh}), mi,j,h({¬dh}) and
mi,j,h({dh, ¬dh }) expressions given in the previous subsection. For the case of value v2,2 for
object eg2 since it is a missing value the BOE is assigned to it as previously described
(including m2,2,h({dh, ¬dh}) = 1).
Moving onto the combination of the evidence in the pairs of BOEs for each example
object, eg1 and eg2, their combination is next shown, using the ))(( ,,,, 21 hjihji mm based
combination rule shown in the previous subsection.
For eg1:
467.0)000.0052.0564.0398.0(1
436.0052.0550.0564.0564.0052.0}))({( ,2,1,1,1
hhh dmm ,
224.0)000.0052.0564.0398.0(1
550.0000.0398.0436.0000.0398.0}))({( ,2,1,1,1
hhh dmm ,
309.0224.0467.01}),)({( ,2,1,1,1 hhhh ddmm ,
as shown in Figure 1c where it is termed m1,C,h(·) (showing the graphical form of the
combination of two pieces of evidence – two BOEs).
For eg2:
052.0)000.0052.0000.0398.0(1
000.1052.0550.0000.0000.0052.0}))({( ,2,2,1,2
hhh dmm ,
398.0)000.0052.0000.0398.0(1
550.0000.0398.0000.1000.0398.0}))({( ,2,2,1,2
hhh dmm ,
550.0398.0052.01}),)({( ,2,2,1,2 hhhh ddmm ,

10
the resulting piece of evidence is the same as from the variable v2,1 (m2,1,h(·) BOE). This is
because the ignorance associated with the missing value from v2,2, has not impacted on the
available evidence for this object, the associated m2,2,h(·) BOE does not impact during the
combination process (hence the whole NCaRBS configuration process).
3 FSB data and SME innovation
Background
The Federation of Small Businesses is the UK's largest campaigning pressure
group promoting the interests of the self-employed and owner/managers of SMEs with over
200,000 members across 33 regions (FSB, 2014). The FSB survey is a significant biannual
study of UK private sector organisations behaviour and attitudes, and is the largest
representative survey of UK firms available for academic research purposes.
Data Set
The FSB 2010 survey instrument itself was a reiteration and evolution of prior FSB surveys
and was developed in consultation with FSB members to ensure the instrument design was
logical and transparent. The paper authors were granted access to use the data for academic
research purposes after representation to the FSB.
Individual enterprises were considered the unit of analysis, with Owner/Managers
being asked to complete the questionnaire. The 2010 survey was sent out to the FSB’s entire
UK membership of approximately 200,000 firms. This enabled access to a large dataset, with
a notable number of usable (in raw or adjusted form) variables. Overall 11,367 enterprises
responded, providing 7,880 responses that were usable for the research discussed in this
paper (for reasons discussed further below, usable respondents had to contain a response to
the outcome variable and at least one of the considered characteristic variables).
Coding
While the presence of missing values was not considered a problem here, with no action
needing to be taken on their presence, allowing them to be retained in the analysis (as
described in section 2), the coding of the considered variables in terms of their meaning is
next given. Six characteristic variables, found in the literature to be potentially linked to
intended SME innovation are used to describe each SME, namely, Age, Education, Growth,
Internet, Reliance and Size (but where the literature is currently inconclusive as to the precise
nature of that relationship, particularly with regard to the issue of non-substantive “Don’t

11
Know” responses). These are described below, following a discussion of the outcome
variable, Innovation intention.
Outcome
Innovation intention:
Innovation is one of the main determinants of competitiveness (Orfila-Sintes and Mattsson,
2009) however there is a limited literature considering its adoption characteristics (Utterback
and Abernathy, 1975; King and Kugler, 2000). Edwards et al. (2005) suggests SMEs
flexibility and specificity can be advantageous in accelerating innovation. Russell and
Russell (1992) also argue that entrepreneurship and innovation are closely intertwined
processes, and that both have high degrees of uncertainty associated with them in terms of
both processes and outcomes. In terms of related work which has considered the non-
substantive DK response, Reynolds et al. (2005) used DK as an answer option, for potential
entrepreneurial activities. Schultze and Stabell (2004) also argue that the management of
knowledge requires research into the management of ignorance, partly because it raises issues
over the use of “ignore” strategies in management, highlighting the importance of what a DK
response actually means.
The FSB survey question asked was “Do you have plans to introduce new or
improved products/services in the next 12 months?”, with response of either, Yes, No or
Don’t Know (DK), see Figure 2a. In Figure 2b, the response representation at the vertices of
a simplex plot is shown, this is the domain later used in the classification analysis undertaken
(using NCaRBS).
Figure 2. Intended innovation question with response options (a) and response representation
in simplex plot domain (b)

12
The representation of the three responses No, Yes and DK, shown in Figure 2b, offers
a consistent domain to view them. The quantification of the outcome variable in this study, is
in a three value vector, where [1, 0, 0], [0, 1, 0] and [0, 0, 1] represent the outcome responses
No, Yes and DK, respectively (and are the points at the vertices of the presented simplex plot
in Figure 2b).
Characteristic variables
Firm Age:
Salavou et al. (2004) recognise the contrasting extant research between firm age and
innovation, suggesting that younger firms are more innovative (see also Patel, 2005). By
contrast, research including Sorensen and Stuart (2000) and Camison-Zornoza et al. (2004)
identify that older more established SMEs have the capability to acquire innovative
knowledge and engage in a greater level of innovative activity which enhances organisation
performance.
The FSB survey question asked was “How many years have you owned or co-owned
your main business?” with response given as number of years. So increasing value of Age
indicates increasing age of the business.
Education:
Pickernell et al. (2011) suggest that graduates possess skills, abilities, and resources that will
produce more beneficial outcomes than non-graduates for a firm (see also for example,
Galloway et al., 2005). The research highlighted here considers higher education level with
more employment in innovation oriented SMEs.
The FSB survey question asked was “Which of the following is the highest level of
education that you have attained so far?” with response modelled in a binary variable 0 – less
than Bachelor Degree or equivalent and 1 - Bachelor Degree or equivalent or above. So
increasing value of education indicates increasing level of education of SME
Owner/Managers.
Growth aspiration:
Prior studies suggest that rapid growth can occur in labour and knowledge intensive
industries in both manufacturing and service industries (Davidsson and Delmar, 1997), and in
firms of all ages (Smallbone et al., 2002). Related to this, several factors have been identified

13
as potential signs of high growth competency, including higher levels of innovativeness
(Allen and Stearns, 2004).
The FSB survey question asked was “What has been the main business objective for
the next 12 months?” four ordinal categories went from 1 - to downsize/consolidate the
business, upto 4 - to grow rapidly in terms of turnover/sales were considered. Businesses
were removed from the analysis which indicated they would be discontinuing the business
namely, closing the business or handing on the business. Therefore, increasing value of
Growth indicates the future intention to grow the business.
Internet:
Teoa et al. (1999) and Lesjak and Vehovar (2005) recognised that Internet use contributed to
the creation of current and future economic benefits and usefulness, which was reflected in
increased market value. It has also been recognised that Internet utilisation and adoption in
SMEs remains an under researched topic, especially with regard to recognising the
antecedents to successful deployment (Fink and Disterer, 2006).
The FSB survey question asked was “Which of the following, if any, do you use the
internet for whilst running your business”. Fourteen categories were shown as well as “do not
use the internet” (see Figure 3).
Figure 3. Categories of internet use by SME
Measured here as a view of internet intensity, the sum of the fourteen categories
ticked was used, along with a 0 when the ‘Do not use the internet’ term was highlighted. So
increasing value of Internet indicates increased level of internet intensity.
Reliance:

14
Keskin (2006) and Demirbag et al. (2010) suggests that SMEs following a proactive business
strategy foster innovativeness as a central part of their organisational culture. High-tech
SMEs, including electronics, software, and biotechnology can demonstrate improved
performance by continuously generating new markets and industries due to their
innovativeness (Romijn and Albaladejo, 2002). The positive role of firm innovativeness on
organisation performance has been supported by several studies (Calantone et al., 2002).
The FSB survey question asked was “What percentage of your revenue comes from
new products or services that have been introduced in the past two years?”, with eight
categories ranging from zero% (0) to more than 60% employed (7) as well as a DK option.
So increasing value of the Reliance characteristic indicates increased level of reliance on new
products or services.
Firm Size:
Schumpeter (1942) claimed that large firms had an advantage with regards to innovation over
SMEs as their financial capabilities enabled them to be the most effective innovators (see also
Laforet, 2008). In contrast, Cohen and Klepper (1996), who suggested that larger firms
suffered from excessive bureaucracy that impedes creativity and flexibility in contrast to the
SME sector (see also Rothwell and Zegveld, 1986; Bertschek and Entorf, 1996).
In the survey, the question asked was “Including yourself how many of each of the
following types of employee work in your business”. Here the number of full time staff is
therefore a term to describe size. So increasing value of Size indicates increased size of the
business.
The Potential Relationships between the Characteristics Variables and DK for Innovation
In terms of the characteristic variables, in addition to their inferred linkages with innovation,
discussed above, they may also be specifically related to the DK response for innovation.
Birkinshaw et al. (2008), focus their research on innovations which have a high degree of
uncertainty of outcome (a common issue for innovation more generally), seeing this as a
particular issue in organisations that lack expertise (which may be linked to firm size and age,
and also the educational level of the owner), and where understanding of the innovation may
be difficult or negative consequences may be possible (which may be linked to a lack of
growth intention as innovations that reduce costs or increase efficiency in non or low growth
organisations will inevitably lead to reductions in resources).

15
They also argue that these uncertainties are also likely to be greater where there is a
lack of precedence for the innovation (suggesting that previous innovation experience should
reduce the uncertainty). Adner (2006) also notes that, with innovation, the greater the
number of intermediaries involved, the greater the degree of uncertainty (which may suggest
that where internet use brings the company closer to the customer such uncertainty may be
reduced). Not generally explicitly considered in the extant literature, however, is what
impact these variables might have on an SME knowing their future innovation intention, with
emphasis here in actually knowing, Yes or No, compared to not knowing (DK).
Incomplete FSB-Innovation Data Set
Based on the described characteristic and outcome variables, from the FSB survey, a total of
7,880 SMEs (responses) were able to be used (from an original 11,367 responses). Two
reasons for the reduction in used SMEs are, i) at least one characteristic variable value has to
be present to describe each SME, and ii) the outcome variable was not allowed to be missing.
In the case of the outcome variable Innovation-intention, the breakdown of SMEs to the three
response outcomes, No, Yes and DK was 1,795, 5,061 and 1,032, respectively. With
13.083% (1,032 out of 7,888) giving the non-substantive response of DK to the outcome
survey intended innovation question (see Figure 3a), this is above the largely academic level
of less than 5% suggested by Gilljam and Granberg (1993) but below the uncommon sight of
between 20-30% (ibid.).
It is worth noting, Gilljam and Granberg (1993) use the term ‘easy out’ provision
when a DK response option is given to a respondent. While here we include the DK outcome
response, other papers have taken the decision to recode such a response as No, in job
practises for example (see Wright et al., 2003). Groothuis and Whitehead (2002), also asked
whether a don't know response actually meant no, they generated findings that suggested
circumstances existed where DK could mean No, Yes or indicating uncertainty or
ambivalence. Perhaps pertinent to this study of SME intended innovation, Turner and
Michael (1996), argue that DK is not always a sign of knowledge deficit (i.e. uncertainty or
ambivalence), but can also be a “political” statement, and thus the social context must also be
considered (in our analysis whether an SME manager would want to admit to saying No to
intended innovation – preferring instead to say DK in their response).
Clearly, in terms of the analysis to be undertaken in this paper, if these were not
included in the analysis (listwise delete SMEs with DK as outcome response), there would be
a noticeable decrease in the size of the considered data set, down to 6,856 (analysis of which

16
is not undertaken here). A brief empirical description of the considered characteristic
variables within the incomplete FSB-innovation data set is given in Table 2.
Variable Min Mean Max Std Dev Missing
Age 0 12.567 262 11.096 55
Education 0 0.381 1 0.486 121
Growth 1 2.775 4 0.789 347
Internet 0 6.610 14 2.507 0
Reliance 1 3.466 8 1.937 3,625
Size 0 4.803 150 8.773 743
Table 2. Descriptive statistics of characteristic variables
While the descriptive statistics given in Table 2 offer some elucidation to the
variations in data being considered, the missing column quantifies the number of missing
response values to each of the characteristic variables considered. That is, the least and
largest numbers of missing responses is with respect to Internet (0 out of 7,888 missing) and
Reliance (3,625 out of 7,888), respectively. In the case of the Internet characteristic, the
respondent had the option to tick against a number of different Internet uses as part of their
business, but importantly also able to respondent with ‘Do not use the Internet’ (see Figure
3), hence no missing responses in this case. For Reliance, this survey question may have
required the SME’s Owner/Managers own investigation into actual level of innovation
reliance (Reliance) their SME has, hence for many (near 45.956% of SMEs) their non-
response may indicate their unwillingness of the Owner/Managers to give time to the
answering of this question (the time to find the answer).
An example of the types of SME data considered in this analysis is given in Table 3,
to aid in the understanding of the impact of having missing responses (values) amongst the
considered SMEs in the FSB-innovation data set.
SME Age Education Growth Internet Reliance Size No Yes Don’t Know
o3728 - 0 - 4 - - 0 0 1
o3835 28 - - 10 - - 0 1 0
o3910 6 0 3 7 - - 0 1 0

17
o4865 - 1 2 4 - 15 1 0 0
o6624 25 1 3 7 2 7 0 0 1
o7612 25 1 2 7 4 2 1 0 0
Table 3. Example SMEs from incomplete FSB data set
Within Table 3, different SMEs have different numbers of the characteristic variables’
values present (or missing if you see it like that). In this paper all these SMEs, and those like
them, are included in the analysis, with the missing values kept as missing. A breakdown of
the number of SMEs and number of missing values associated with them showed, 0 missing -
3,722, 1 - 3,525, 2 - 561, 3 - 76, 4 - 4. For example, there are 76 SMEs with half of their
characteristic values missing (76 + 4 = 80). Moreover, from this breakdown, if only
complete data was to be considered, employing listwise deletion approach to missing value
management, only 3,722 (47.186%) SMEs would be considered in a completed data set based
analysis.
With 4,891 (10.334%) of characteristic variable values missing, any imputation based
completion of the data set would dramatically change the content of the data. It is clear from
the description of the data set that the ability to analysis incomplete data allows this analysis
to pertinently take place, a noticeable intelligent dimension to business analytics based
analysis.
4 Results from NCaRBS analysis
This section reports an NCaRBS analysis of the incomplete FSB-innovation data set, through
the configuration of a NCaRBS model (see Beynon et al., 2014, for example of its previous
analysis).
As described in the description of the NCaRBS technique, the configuration process
involves the assignment of values to the control parameters, kj,h, j,h, Aj,h and Bj,h, j = 1, .., nC
and h = 1, .., nD, from which the evidence is constructed in constituent BOEs then combined
to give the predicted classifications of objects (here SMEs). Bounds on these control
parameters we employed (following Beynon et al., 2014), were; 6.000 ≤ kj,h ≤ 6.000, 3.000
≤ j,h ≤ 3.000, 0.000 ≤ Aj,h ≤ 1.000 and 0.000 ≤ Bj,h ≤ 0.600. The specific bound on the Bj,h
control parameters, is a technical issue, and incorporates the existence of some level of
ignorance in each constructed constituent BOE, necessary for the combination of constituent
BOEs, see Beynon et al., 2005b). Moreover, this is to mitigate the impact of contradictions
18
in evidence from different sources (in constituent BOEs), a feature of the issue regarding the
independence of evidence when combining BOEs (see for example, Altınçay, 2006; Smets,
2007; Cattaneo, 2011), where independence is, in qualitative terms here, viewed in terms of
the distinctness of each characteristic variable (see Smets, 2007).
The results presented in this analysis are in three forms, i) a description of the
classification fit of the findings, ii) the contribution of the individual characteristic variables
in the analysis, and iii) an example elucidation of one respondents classification details.
Further validation of the results are presented in section 5, where re-sampling based analyses
are described.
Classification fit
With the outcome measure here being a vector of three values (see discussion around Figure
2b), identifying which of the three responses an SME is associated with, in terms of intended
innovation, No (vector [1, 0, 0]), Yes (Ys) ([0, 1, 0]) and Don’t Know (DK) ([0, 0, 1]). The
NCaRBS analysis was undertaken, with 10 runs of the configuration process performed (each
time using TDE to minimise the OBNCaRBS,w
objective function described in Section 2). The
best classification fit was found to be OBNCaRBS,w
= 0.688.
Since each of these ‘predicted outcome’ vectors sums to one, they can all be
represented in a simplex plot (see Figure 2b). The NCaRBS is concerned with ambiguous
classification, the predicted classification results may indicate part association to more than
one possible response, and in terms of the simplex plot, illustrated in Figure 2b, this means a
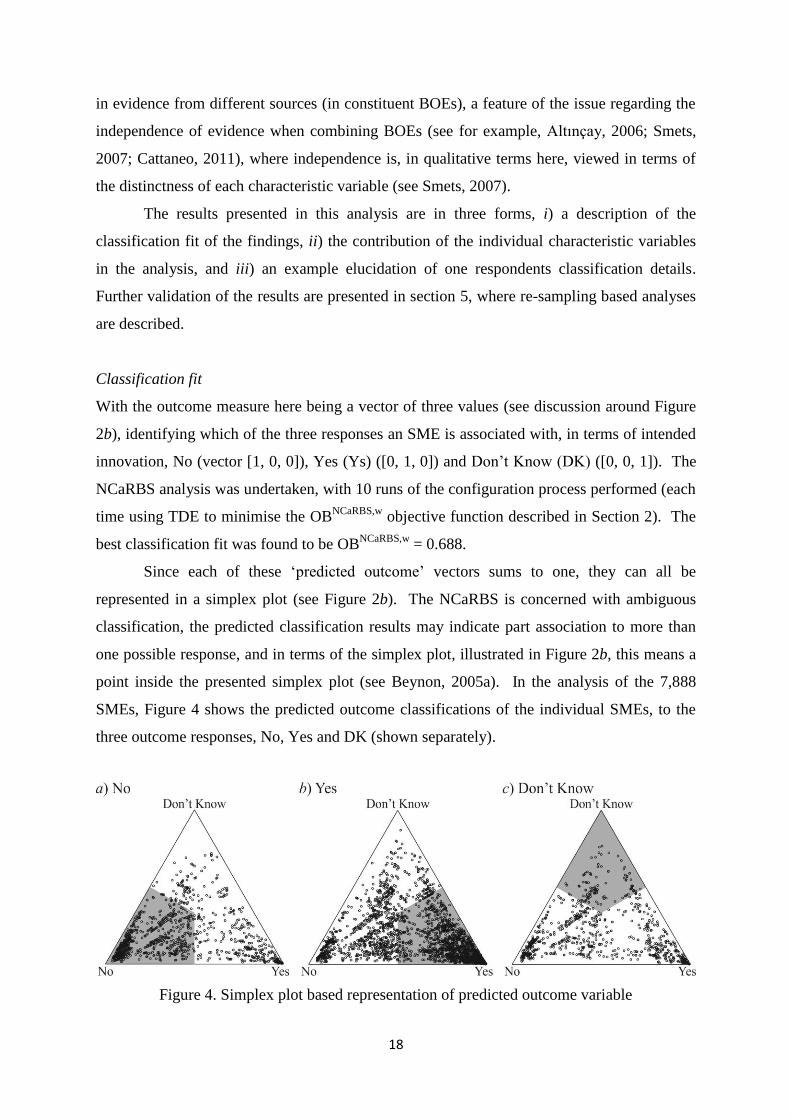
point inside the presented simplex plot (see Beynon, 2005a). In the analysis of the 7,888
SMEs, Figure 4 shows the predicted outcome classifications of the individual SMEs, to the
three outcome responses, No, Yes and DK (shown separately).
Figure 4. Simplex plot based representation of predicted outcome variable

19
In Figure 4, the three simplex plots shown, describe separately the predicted outcomes
of those SMEs originally known to be associated with the outcome response, 1,795 No (4a),
5,061 Yes (4b) and 1,032 Don’t Know (4c). From the description of the NCaRBS analysis,
the variation in the numbers of SMEs associated with each outcome was taken into account,
allowing each group of SMEs equal weighting in achieving their correct classification (see
description around description of OBNCARBS,w
objective function).
In each simplex plot shown in Figure 4, the shaded region shows the area within the
simplex where there is correct classification (based on majority association) of an SME
predicted outcome to their actual outcome response. A numerical breakdown of the
correct/incorrect classification of SMEs is given in Table 4.
Actual / Predicted No Yes Don’t Know Ambiguous Total
No 1,328 (0.740)1
334 (0.186) 119 (0.066) 14 (0.008) 1,795 (0.228)
Yes 1,205 (0.238) 3,436 (0.679) 404 (0.080) 16 (0.003) 5,061 (0.642)
Don’t Know 564 (0.523) 326 (0.316) 139 (0.135) 3 (0.003) 1,032 (0.131)
Total 3,097 (0.393) 4,096 (0.519) 662 (0.079) 33 (0.004) 7,888
1 Numbers in brackets are the proportions of the values originally associated with each row’s actual
classification (these are presented for comparison purposes with the re-sampling results presented later
which was unstratified in nature) - with exception of Total row and column.
Table 4. Confusion matrix of classification results
In Table 4, the actual and predicted classifications of the 7,888 SMEs is provided, for
each group of SMEs the spread of these across the three possible outcome responses is given.
For the case of the 1,795 No SMEs, then 1,328, 334 and 119, were classified as being No,
Yes and DK response SMEs, respectively (the latter two numbers indicating the number of
incorrect classifications). From this table, the overall level of correct classification is found
to be 4,903 out of 7,888 (62.158%) SMEs. The ambiguous column in Table 4 is to
acknowledge that for small numbers of SMEs (33 - 0.4%), their predicted classifications were
ambiguous, meaning two (or more) of their BetPi(dh) values were equal to each other (often
associated with SMEs with missing values, so classification evidence limited to one or two
pieces of evidence – such as with cases o3728 and o3825 shown in Table 3).
The bracketed values, showing proportions of respondents, enable comparisons across
the different actual classifications groups of SMEs, it is noticeable that in terms of correct

20
predicted classifications, the No SMEs are most correctly classified (0.740), followed by the
Yes respondents (0.679), but lastly DK (0.135) showing a particular lack of ability to
correctly classify DK respondents away from other respondents. Beyond that, over half of
the DK respondents were miss-classified as No respondents. So taking the nature of the
question, in terms of intended innovation, into account, this may suggest that respondents
who, based on their characteristic variables, would have given “No” responses, may have
given a DK response. This result, again acknowledging this is based on the predictive quality
of the considered characteristic variables, supports the view in Groothuis and Whitehead
(2002) that a predominance of DK response SMEs are more similar to the No response
SMEs.
For specific variables, however, a variety of relationships between No, Yes and Don’t
Know were found to exist. These are discussed below.
Characteristic contribution
Beyond the classification fit of the undertaken analysis, this subsection considers the
contribution of the individual characteristics, an important facet of business analytics based
analysis. The form of this elucidation of characteristic variable contribution is graphical, and
is based on the general forms of the relevant constituent BOEs. Moreover, for a specific
variable, a variable BOE can be constructed, through the combining of the evidence in the
constituent BOEs, mi,j,h(·) h = 1, .., nD, termed a variable BOE, defined mi,j,-(·). The resultant
variable BOE mi,j,-(·), for each characteristic variable, found from the configured NCaRBS
model can be presented graphically, based on their pignistic probability form (see Beynon et
al., 2014), see Figure 5.

21
Figure 5. Graphical elucidation of characteristic variables - showing pignistic probability
forms (sets of points) of variable BOEs (lines connecting points are to signify the internal
structure of going from one possible set of pignistic probability values to another)
In Figure 5, each graph gives a graphical elucidation of the variable BOEs associated
with the six characteristic variables considered in this analysis. It should be noted, the points
on each line illustrate where actual values of the characteristic variable existed, and so actual
variable BOEs would be constructed, the lines between these points show the underlying
structure of the variable BOEs for each characteristic variable. For example, in the case of
the Education characteristic, only two values 0 (Less than Bachelor degree) and 1 (At least
Bachelor degree) exist, but the lines between these two points show the structure of the
variable BOEs getting from 0 to 1 (in this case). This is helpful since it elucidates the non-
linear contribution possible from a characteristic variable in the configured NCaRBS model.

22
Each of the contribution graphs in Figure 5 are next explained (further elucidation will be
given in a later section).
Age (5a)
Beyond the very recently started SMEs there is continued increase of evidence towards No to
intended innovation as the age of the SME increases. In contrast, as the age of the SME
increases there is a similar decrease in the evidence towards Yes and DK (Don’t Know)
intended innovation. This result tends to favour the research of Salavou et al. (2004) that
firms must exhibit innovation behaviour as young entities and it is more difficult to acquire
such behaviour as the firm ages (see also Wang et al., 2007).
Education (5b)
As a binary variable the only details to be concerned with are the left and right hand sides of
the graph. On the left side, with Owner/Manager education level less than Bachelor degree
there is noticeable discernment between the greater evidence suggesting DK as outcome
response against the more substantive responses of No and Yes. In contrast, with those
Owner/Managers with at least a Bachelor degree there is discernment in the evidence towards
the substantive responses, noticeably the association to DK is reduced, with most increase to
No and minimal change to Yes. This result suggests that SME Owner/Managers acquire
informed decision capabilities towards innovation deployment by the completion of a
Bachelor degree. One issue of relevance here is the date of the survey. It was conducted in
the middle of the severe UK and global recession, hence this may be contributory factor for
the negative outlook on intended innovation
More importantly, this result supports the view that the education of the individual
does impact on the use of the non-substantive response DK, following Ferber (1966),
contrasting slightly with Francis and Busch (1975). That is, with more education (higher
education attainment), there is more focus on a substantive response.
Growth (5c)
The growth characteristic (taking one of four values), shows variation in the evidence it
offers towards the outcome responses No, Yes and DK. As growth belief increases there is
understandable increase and decrease in the evidence towards Yes and No to intended
innovation, respectively, suggesting a positive relationship between growth and intended
innovation. The case of the DK is interesting, in that as growth belief increases, there is

23
initial increase in DK but then decrease. That is, at the extremes of knowledge of the growth
of the SME there is the least evidence to DK, in the middle where the growth believe is
muted (qualitative terms shown in Figure 5c), so there is more evidence towards the DK
outcome response. This result potentially indicates the uncertainty and lack of evaluation
within SMEs to fully understand the association between innovation and attaining growth
(Hudson et al., 2001).
Internet (5d)
The description of the Internet characteristic is that the higher the value the more intense the
use of internet. From the variable BOE graph in Figure 5d, for no or little use of the internet,
there is more evidence suggesting No intended innovation or DK, with little evidence towards
Yes. As internet use increases so there is increased evidence towards Yes to intended
innovation, with consequential decrease in evidence towards No or DK (relatively close
similarity in evidence towards No and DK across this characteristic). This result suggested
that SMEs that are adopting technologies like the internet are typically more innovative. This
is a logical finding in that the SMEs concerned are using technological solutions as a
potential enabler towards more innovative behaviour (Loebbecke and Schäfer, 2001).
Reliance (5e)
For this characteristic the variable BOE graph shows as the reliance of the SME on
innovation increases so there is understandable increase in the intention for more innovation
in the next 12 months. This increase in Yes is balanced by a decrease in the DK outcome,
with little movement of the evidence towards No. This seems a logical finding in that the
desire for the firm to be innovative is self-perpetuating and increased reliance is based on this
behaviour as proposed by Keskin (2006).
Size (5g)
The Size characteristic, demonstrates for small SMEs a marked difference to when there is a
slight increase in its size. As the size of the SME increases so there is increasing evidence
towards Yes to intended innovation. In contrast, there is different levels of decrease in the
evidence towards No and DK when SME size goes up (more dramatic for DK when SME
size increase from near small). These results tend to support the findings of Laforet (2008)
who argue that larger firms are more likely to be innovative. This finding supports the belief

24
that larger firms have greater capacity (e.g. finance, staff etc.) to invest in and support
entrepreneurial activity.
Example of individual SME’s classification details
To offer further elucidation of the processes by which the evidence from a SME’s survey
responses contributes to their final predicted classification to their outcome response, a single
SME case is considered, namely for o199. In Table 5, for SME o199, the majority of the
numerical details are given, in terms of constituent BOEs and outcome BOEs, representing its
evidence in the NCaRBS analysis.
Outcome Variable Age Education Growth Internet Reliance Size Outcome
BOEs Value (Stdz) 1.042 1.275 0.286 0.243 - -
No
No 0.000 0.121 0.000 0.000 0.000 0.000 0.108
Ys, DK 0.120 0.000 0.000 0.000 0.000 0.000 0.107
No, Ys, DK 0.880 0.879 1.000 1.000 1.000 1.000 0.785
Yes
Ys 0.193 0.000 0.000 0.000 0.000 0.000 0.132
No, DK 0.000 0.000 0.000 0.363 0.000 0.000 0.315
No, Ys, DK 0.807 1.000 1.000 0.637 1.000 1.000 0.553
DK
DK 0.296 0.000 0.000 0.000 0.000 0.000 0.296
No, Ys 0.119 0.000 0.000 0.000 0.000 0.000 0.119
No, Ys, DK 0.585 1.000 1.000 1.000 1.000 1.000 0.585
Table 5. Constituent and outcome BOEs for SME o199
In Table 5, the standardized values of the SME question’s responses are given (those
used in the NCaRBS analysis), with a ‘-’ showing where the SME did not give a response to
a variable question (the characteristic variables Reliance and Size in this case). In the next
three table subsections (sets of three rows) the constituent BOEs (m199,i,h(·)) are given across
the different characteristic variables, and when each of the outcome responses are considered
(No, Ys and DK) against their complement and ignorance. The last column of the table
shows the aggregated evidence from the combination of groups of constituent BOEs, using
Dempster’s combination rule, with respect to a specific outcome, in this case producing the
outcome BOEs (m199,-,No(∙), m199,-,Ys(∙) and m199,-,DK(∙)).
The combination of the three outcome BOEs, following the same combination
process, results in the final object BOE (m199,-,-(·) m199(·)), for SME o199, is found to be:
m199({No}) = 0.104, m199({Ys}) = 0.099, m199({DK}) = 0.270, m199({Ys, DK}) = 0.038,

25
m199({No, DK}) = 0.157, m199({No, Ys}) = 0.056 and m199({No, Ys, DK}) = 0.276.
In the outcome BOE m199(·) the focal elements are from the power set of the frame of
discernment {No, Ys, DK} (minus empty set {}). In terms of final predicted classification to
the individual outcomes, as described previously, the BetP199() values (for No, Ys and DK),
based on the object BOE m199(·), is found to be:
BetP199(No) = 0.303, BetP199(Ys) = 0.237, BetP199(DK) = 0.460.
In this case the largest of these values is associated with the DK outcome response
(BetP199(DK) = 0.460), the correct classification in this case (based on majority association).
This process of evidence representation, evidence combination and final predicted
classification specification for this SME is next visually reported, see Figure 6.
Figure 6. Simplex plot based representation of evidence associated with SME o199.
In Figure 6, a simplex plot based representation of the evidence previously described
in respect of SME o199 is given, over a number of different simplex plots. In Figures 6a, 6b
and 6c the constituent BOEs (m199,i,h(·)) are shown (relating directly to their respective
variable values in Table 5), along with their respective outcome BOEs (numerical values also
shown in Table 5). The fourth simplex plot shows the final object BOE based BetP199(.) for

26
the SME o199, and also respective variable BOE based BetP199,j(·)s. A number of points are
exhibited from these results (demonstrating the interpretive power of NCaRBS at the
individual object level), in terms of associated notions of ignorance with the characteristic
variables.
i) Missing characteristic variable values – For the SME o199 there are two missing response
values, for Reliance and Size, hence throughout the analysis, the evidence from these two
variables is only ignorance (m199,j,h({No, Ys, DK}) = 1.000 etc.). Hence for these two
variables their points in the simplex plots in Figures 6a, 6b and 6c are at the respective top
vertex (labelled {No, Ys, DK}). In Figure 6d the associated variable BOE based
BetP199,j(·)s are at the centre of the simplex plot, since the ignorance only evidence
associated with them is simply split equally amongst the three outcomes No, Ys and DK
(hence each BetP199,j(dh) = 0.333).
ii) Ignorance only variable contribution – For the variable Growth, while its response value
is present, the results in the simplex plots in Figure 6a, 6b and 6c, as in point i), shows
only ignorant evidence towards innovation. That is, from the NCaRBS analysis
undertaken, this response value for Growth characteristic variable, offers only ignorant
evidence (for any SME with this outcome), meaning that it is not related in any relational
way with the innovation outcome variable (that is zero predictive power). This is
confirmed with inspection of Figure 5c, where for the ‘To grow moderately’ response to
the Growth question there is an equal level of evidence to each outcome (0.333 values).
5 Re-sampling based validation
The results presented in Section 4 are from a one-off analysis using all the available data
(7,888 SMEs). To add confidence in the validity of the results from this analysis, a re-
sampling procedure is undertaken and further NCaRBS models configured (see for example
Twomey and Smith, 1998).
The re-sampling undertaken here was based on performing multiple runs of the
NCaRBS technique using identified in-samples and out-samples of SMEs. Here, 40 runs
were performed over a number of different partitions of the data. The initial partition of the
FSB-innovation data set was based on 90% of SMEs (7,099) were used as the in-sample on
which the NCaRBS was run to configure a model, and 10% of SMEs (789) were used as an

27
out- sample. Later, summary results are also given for the further partitions of i) 80% (6,310)
and 20% (1,578), ii) 70% (5,522) and 30% (2,366) and iii) 60% (4,733) and 40% (3,155).
For the 90%/10% partition of the data and each pair of in-sample and out-sample sets
of SMEs, levels of classification fit can be found based on the objective function
(OBNCaRBS,w
), see Figure 7.
Figure 7. Scatter-plot of in-sample and out-sample classification fit values over 40 runs
(based on OBNCaRBS,w
and FSB-innovation data set)
In Figure 7, the two axes depict the OBNCaRBS,w
fit values for in-sample (horizontal)
and out-sample (vertical) sets of data. Clearly, there is a limited inverse relationship between
the pairs of fit values, namely as the level of in-sample fit increases so the level of out-sample
fit decreases. Beyond this relationship, whether there is significant difference between the in-
sample and out-sample fit values are considered using a paired-sample t-test (see for example
Kula and Tatoglu, 2003). From the test there was not a significant difference between the fit
values for in-sample (M = 0.690, SD = 0.00145) and out-sample (M = 0.700, SD = 0.040)
sets of data; t(39) = 1.580, p = 0.122.
Following the classification/prediction results for the one-off analysis shown in Table
4, comparisons with these in terms the 90%/10% re-sampling are first shown in Table 6
(SMEs with ambiguous prediction results not included here – limited to near 0.4% of cases).
Actual / Predicted
(90% in-sample) No Yes Don’t Know Total
No 0.736 (0.025) 0.194 (0.011) 0.070 (0.020) 0.227 (0.002)
Yes 0.241 (0.015) 0.690 (0.009) 0.068 (0.017) 0.642 (0.002)
Don’t Know 0.535 (0.031) 0.337 (0.015) 0.127 (0.030) 0.131 (0.001)
Total 0.392 (0.018) 0.531 (0.009) 0.077 (0.019) 7099

28
Actual / Predicted
(10% out-sample) No Yes Don’t Know Total
No 0.715 (0.045) 0.210 (0.028) 0.075 (0.031) 0.229 (0.014)
Yes 0.243 (0.022) 0.686 (0.019) 0.071 (0.019) 0.642 (0.017)
Don’t Know 0.570 (0.045) 0.335 (0.045) 0.096 (0.030) 0.129 (0.013)
Total 0.394 (0.026) 0.531 (0.016) 0.075 (0.020) 789
Table 6. Confusion matrices of classification/prediction results from 90%/10% in-sample/out-
sample re-sampling analysis
In terms of classification prediction accuracy, the results from the 90% in-sample and
10% out-sample data sets show (mean (standard deviation)), 0.627 (0.005) and 0.617 (0.018).
These results, with respect to each other, show an understandable slight dip in predictive
accuracy when going from in-sample to out-sample results, while a further understandable
increase in the respective variations (seen through standard deviation values) in these results.
When compared with the full analysis (see Table 4), the in-sample accuracy here of 0.627 is
slightly above the previously found 0.621, due to the less objects being considered in the
90%/10% in-sample data.
The contribution of the individual characteristic variables to SME intended
innovation, following the re-sampling procedure, can be illustrated graphically as for the one-
off analysis using all of the data (see Figure 5), here shown for the two characteristic
variables, Age (8a, 8b and 8c) and Internet (8d, 8e and 8f).

29
Figure 8. Age (a, b and c) and Internet (d, e and f) characteristic variable contribution lines in
40 runs (with 90%/10% partition)
In each graph in Figure 8, the contribution lines (in grey) from each of the 40 runs are
presented for each of the possible outcome responses, No, Yes and Don’t Know, for the two
characteristic variables Age and Internet (separate graphs for No, Yes and Don’t Know are
given to enable their clear elucidation). As before, these lines show the internal connections
between the actual values which exist for each characteristic variable. Also shown in each
graph, is a thicker solid black line representing the average contribution line (from the 40
runs undertaken).
Similar average contribution lines are shown for all the characteristic variables
considered in this analysis, see Figure 9.

30
Figure 9. Average characteristic variable contribution lines in 40 runs (with 90%/10%
partition)
The results in Figure 9, for each characteristic are comparable with the results from
the one-off analysis shown in Figure 5. As the contribution lines are the average of the
respective lines from the 40 runs, they are smoother than those evident in Figure 5. Across
the board, with a 90%/10% partition of the data, the inference is very similar to the analysis
of all the data (see Figure 5), with one exception being with the Size characteristic.
Beyond just the 90%/10% partition of the data, other partitions were also considered,
namely 80%/20%, 70%/30% and 60%/40%. The statistical results in terms of t-tests between
the in-sample and out-sample fits were found to be, for 80%/20%, in-sample (M = 0.689, SD
= 0.00217) and out-sample (M = 0.698, SD = 0.028) sets of data; t(39) = 2.150, p = 0.038,
70%/30%, in-sample (M = 0.688, SD = 0.00301) and out-sample (M = 0.699, SD = 0.026)
sets of data; t(39) = 2.491, p = 0.017 and 80%/20%, in-sample (M = 0.687, SD = 0.00310)

31
and out-sample (M = 0.699, SD = 0.020) sets of data; t(39) = 3.608, p = 0.001. It can be seen
from these results there is increasing significant difference between the classification fit
levels of the in-sample and out-sample partitions of the data.
In regards to characteristic contribution, Figure 10 reports contribution graphs,
showing average contribution lines, for the Age and Internet characteristics, over the
80%/20%, 70%/30% and 60%/40% partitions of the data.
Figure 10. Average characteristic variable contribution lines for Age and Internet over the
resample partitions of, 80%/20% (a and d), 70%/30% (b and e) and 60%/40% (c and f), using
40 runs in each case.
In terms of the contribution of the variables, Figure 10 shows the average contribution
lines for the characteristic variables Age and Internet, over these three sets of partitions of the
data. The results are similar over the different sets of partitions, with only slight changes
identifiable. These results give support to the contribution results found in the on-off analysis
given in Figure 5, and 90%/10% partition analysis given in Figures 8 and 9.

32
In terms of classification prediction accuracy, the results from the different in-sample
and out-sample results are (each set of values is mean (standard deviation)): 80%/20% -
0.626 (0.007) and 0.619 (0.010); 70%/30% - 0.626 (0.007) and 0.618 (0.015); and 60%/40% -
0.628 (0.009) and 0.617 (0.013). As before (see discussion around Table 6), these results
show, with respect to each other, an understandable slight dip in predictive accuracy when
going from in-sample to out-sample results, while a general no change across the in-sample
results.
6 Inference on Innovation, Don’t Know and NCaRBS
The inference discussed in this section is broken down into three sub-sections, namely that
regarding the innovation problem considered, contribution to the issue of how to handle the
non-substantive response Don’t Know or what inference to specifically associate with it, and
the role of NCaRBS in business analytics based research.
Innovation
This subsection summarizes the inference evident on the understanding of intended
innovation in SMEs and a sample of the characteristics considered.
The case of the Education characteristic variable is interesting in its own way, there is
clearly discernment in the level of education of the Owner/Manager and their association to
the No and Yes responses to that of the DK response. Moreover, the strength of evidence
towards a substantive response of either No or Yes increases as the level of education is
higher, with a respective decrease in the evidence towards Don’t Know. It would be
interesting to see if this increase in substantive response is because the higher education
characteristic enables a more informed/educated opinion, or simply that the higher education
has given the respondent more confidence to provide such a substantive response.
Worth separately mentioning is the Growth characteristic variable, where for the two
more muted responses of ‘To downsize/consolidate the business’ and ‘To remain about the
same size’ there is more association to No in terms of innovation intention than to either Yes
or DK (the level of evidence being similar may be due to the similarity in the statement terms
– consolidate and remain about the same), there is then continued increase in evidence
towards a Yes response to innovation intention, unlike for the evidence towards DK where
initial increase then becomes a decrease (noting the subtle difference in growth being
moderate or rapid – almost the difference between a rash or cautious general).

33
The size characteristic suggests that larger SMEs are more likely to embrace
innovation due to their internal capabilities and finances. Similarly, SMEs which adopted
Internet technologies had a more innovative mindset. However, by contrast innovative
behaviour is more prevalent within younger firms than older entities. This suggests the
importance of new start-ups adopting an appropriate mind-set towards innovation as a means
of achieving competitive advantage and growth. This is further support by the Reliance
characteristic whereby the desire for the firm to be innovative is self-perpetuating and
increased reliance is based on ongoing innovation as a core business focus. Thus, these
results suggest that innovative SMEs require several inter-related characteristics to enable
effective innovative behaviour.
Learning about Don’t Know
A consequential beneficial impact of allowing the non-substantive response Don’t Know to
be one dimension of the outcome response is that it allows us to consider how its presence
has impacted on the results (rather than having to make assumptions about this and thus
losing the value of this data). In section 4, and Table 4, there was supportive evidence that
the predictability of the responses of SMEs, to whether they were No, Yes or DK to SME
intended innovation was possible, based on the considered characteristic variables. Further,
there was a suggested predominance of a majority of DK responses being predicted more to a
No response. This is supported by the research literature that has connected the making of
the DK response more with the No response that with the Yes response (see Groothuis and
Whitehead, 2002).
With respect to the intended innovation outcome considered there could also be a
level of social bias contributing to the DK response being more associated with the No
response. That is, for many SMEs, there is an internal desire to be innovative, hence when
asked about future innovation intention, there may be a reluctance to say No, instead
responding DK as the ‘easy out’ option, as termed by Gilljam and Granberg (1993). It may
be that in future FSB surveys, further gradations of response may be included that will offer
more pertinent responses between No and Yes, rather than just DK, for example, allowing a
gradation between 0% and 100% certainty of undertaking innovation.
The relationships between the three dimensions of outcome response, No, Yes and
DK, and the individual characteristic variables also, however, needs to be considered. From
inspection of Figures, 5, 8, 9 and 10, there is a predominance for more association of the
evidences over the domains of the characteristic variables to show similarities between the

34
No and DK outcome responses, at least in terms of when the levels of belief based evidence
are near same (such as in the case of the Reliance characteristic variable in Figure 5 – for
21% or above), but with the exceptions of the Age and Education characteristics.
These findings will contribute to the issue of how to handle, and whether to include
non-substantive responses, like DK, in survey questionnaires generally, and here specifically
in surveys associated with SMEs. Moreover, there may be policy inference that may be taken
forward from such non-substantive responses, which will differ depending on the
relationships between Yes, No and DK for different sets of variable relationships.
NCaRBS
From the previous two subsections of this section, the findings of the NCaRBS analyses have
enabled important discussions on innovation intention in SMEs and survey design to be
given. Beyond this, the NCaRBS has allowed perhaps the most intelligent approach to
handling missing values in an incomplete data set, namely through their retention and the
removal of any need to manage their presence in any way. The ability of a constituent BOE
to represent a missing value is an important contribution of the soft computing based analysis
using NCaRBS. This can only be a positive for the development of pertinent business
analytic based analyses of data, whether small, medium or big data.
7 Conclusions
This study has given a novel demonstration on a future direction of business analytics. The
NCaRBS analysis technique employed, through its rudimentary association to soft
computing, i) enabled the analysis of real incomplete data without any
transformation/manipulation of the data, ii) offered novel insights in terms of the role of non-
substantive outcome responses, and iii) offered insights into the issue of SME innovation
intention. Overall, in most of the characteristics a DK response was more associated with a
no response, although there was at least one characteristic where DK seemed more associated
with yes, and at times at least for some variables DK really meant DK. This greater
discernment capability is another important advantage of this technique as it clearly shows
that one cannot assume a static relationship between No and DK for all relationships. At the
very least, this indicates that the processes described in this paper may assist in more
accurately reclassifying DKs for more traditional regression-based techniques (if required –
subject to some form of pre-processing of the data to handle the incompleteness of the data).

35
The study contributes increased knowledge regarding SME characteristics and their
impact on innovative behaviour/non-behaviour and uncertain behaviour within the firm, more
accurately meeting the call for more research into the impact of innovation upon the SME
and its key influences (McAdam et al., 2004), a call that is an example of business analytics.
This assists SME Owner/Managers to understand how to embrace innovation effectively
within their processes and practices, but also provides evidence of assistance for policy
makes and enterprise decision makers. The differing influence of a range of SME
characteristics upon innovation intention is also apparent. Such data will be of relevance to
policy makers and SME support agencies in their encouragement of innovation within the
SME sector. The ability to recognise SMEs capable of more entrepreneurial behaviour could
also be enabled by business analytics techniques like NCaRBS.
A limitation of this paper, is the lack of comparison between NCARBS and
alternative, more traditional methods of handling such data. The management of missing
values (as well as DK responses), and approaches used to manage these issues, are many and
diverse. Since any findings on a managed data set would, by their definition, be on a new
(transformed data set), they would only be partially comparable to the NCaRBS results
presented here and within the context of business analytics, the use of soft computing has
already found its stand-alone status, hence there may be less need to compare results with
other techniques.
However, such comparison could also have its place and offers an interesting area of
future research. Comparing techniques such as NCaRBS, against other more traditional
techniques, where some can analyse incomplete data and some cannot, would allow more in-
depth examination of the issues surrounding different pre-processing requirements before
analysis is undertaken. By NCaRBS having the ability to analyse incomplete data, it would
therefore allow for a whole new direction of research to be undertaken comparing the results
of using different missing value management processes, against a benchmarked set of results
from the original incomplete data using NCaRBS. This is an interesting, and exciting
possibility, in particular offering a very important future research direction section.
Clearly, the fast growing interest in the role, or use, of business analytics, is in its
ability to pertinently analyse data (small, medium or big data). As important, however, is the
ability to analyse the data available, as exemplified in this study. The direction, or many
directions, business analytics may go is an exciting question, probably with no one analysis
approach (or technique) being able to do everything. The study here has shown that
techniques do exist to undertake business analytics, in ways even recently not thought
36
possible (such as analysing incomplete data for example). It is fair to say that the term
business analytics is fitting since it contributes to the interest (excitement) such analysis is
achieving.
References
1. Adner, R. Match Your Innovation Strategy to Your Innovation Ecosystem. Harvard
Business Review 2006 April, 1-11.
2. Allen K, Stearns T. Technology entrepreneurs. In: Gartner WB, Shaver KG, Carter
NM, Reynolds PD. (Eds.), Handbook of Entrepreneurial Dynamics: The Process of
Business Creation, Sage Publications, Thousand Oaks, CA 2004.
3. Allison PD. Missing Data. Quantitative Applications in the Social Sciences, 136. Sage
University Paper Series 2000.
4. Altınçay H. On the independence requirement in Dempster-Shafer theory for
combining classifiers providing statistical evidence. Applied Intelligence
2006;25(1):73-90.
5. Azvine B, Nauck D, Ho C. Intelligent Business Analytics – A Tool to Build Decision-
Support Systems for ebusinesses. BT Technology Journal 2003;21(4):65-71.
6. Bertschek I, Entorf H. On Nonparametric Estimation of the Schumpeterian Link
between Innovation and Firm Size. Empirical Economics 1996;21(3):401-26.
7. Beynon MJ. A Novel Technique of Object Ranking and Classification under
Ignorance: An Application to the Corporate Failure Risk Problem. European Journal
of Operational Research 2005a;167:493517.
8. Beynon MJ. Optimizing object classification under ambiguity/ignorance: application
to the credit rating problem. International Journal of Intelligent Systems in
Accounting, Finance and Management 2005b;13:11330.
9. Beynon MJ, Andrews RA, Boyne, G. Evidence-based modelling of hybrid
organizational strategies. Computational and Mathematical Organization Theory
2014; forthcoming.
10. Beynon MJ, Kitchener M. Analyzing Strategic Stance in Public Services
Management: An Exposition of NCaRBS in a Study of U.S. States’ Long-Term Care
Systems, Business Applications and Computational Intelligence, editors: Voges, K. E.
and Pope, N. K. Ll., IDEA Group Inc., PA, USA. ISBN 1-59140-702-8. 2006;
Chapter 17, pp. 344–59.

37
11. Birkinshaw J, Hamel G, Mol M. Management Innovation. Academy of Management
Review 2008;33(4);825-45.
12. Brick JM, Kalton G. Handling missing data in survey research. Statistical Methods in
Medical Research 1996;5(3):215-38.
13. Calantone RJ, Cavusgil ST, Zhao Y. Learning orientation, firm innovation capability
and firm performance. Industrial Marketing Management 2002;31:515-24.
14. Camison-Zornoza C, Lapiedra-Alcami R, Segarra Cipres M and Boronat-Navarro M.
A meta-analysis of innovation and organizational size. Organization Studies
2004;25(3): 331–61.
15. Canfora G, Pedrycz W. Special issue on Software Engineering and Soft Computing.
Soft Computing 2008;12(1):1-2.
16. Cattaneo MEGV. Belief functions combination without the assumption of
independence of the information sources. International Journal of Approximate
Reasoning 2011;52(3): 299-315.
17. Cohen WM, Klepper S. Firm size and the nature of innovation within industries: the
case of process and product R&D. The Review of Economics and Statistics
1996;78(2):232–43.
18. Davidsson P, Delmar F. High-growth firms and their contribution to employment: the
case of Sweden 1987-96. OECD Working Party on SMEs, Organisation for Economic
Co-operation and Development, Paris 1997.
19. Demirbag M, Tatoglu E, Glaister KW, Zaim S. Measuring strategic decision making
efficiency in different country contexts: A comparison of British and Turkish firms.
Omega 2010; 38(1-2); 95-104.
20. Dempster AP. Upper and lower probabilities induced by a multiple valued mapping.
Ann. Math. Statistics 1967;38:325-39.
21. Denœux T, Masson M-H. (Eds) Belief Functions: Theory and Application,
Proceedings of the 2nd
International Conference on Belief Functions, France.
Springer-Verlag, Heidelberg. 2012.
22. Denœux T, Zouhal M. Handling possibilistic labels in pattern classification using
evidential reasoning. Fuzzy Sets and Systems 2001;122:409-424.
23. Edwards T, Delbridge R, Munday M. Understanding innovation in small and
medium-sized enterprises: a process manifest. Technovation 2005;25:1119–20.
24. Fan H-Y. Lampinen J. A Trigonometric Mutation Operation to Differential Evolution.
Journal of Global Optimization 2003;27(1):105-29.

38
25. Federation of Small Business (FSB), About the FSB, Available online:
http://www.fsb.org.uk/about. Accessed 28th
August 2014.
26. Feick, F. Latent Class Analysis of Survey Questions that Include Don't Know
Responses. Public Opinion Quarterly 1989;53:525-47.
27. Ferber R. Item Non-response in a Consumer Survey. Public Opinion Quarterly
1966;30, 399-415.
28. Fink D, Disterer G. International case studies – to what extent is ICT infused into the
operations of SMEs? Journal of Enterprise Information Management 2006;19:608-24.
29. Francis JD, Busch L. What We Now Know About "I Don't Knows". The Public
Opinion Quarterly 1975;39:207-18.
30. Galloway L, Anderson M, Brown M, Whittam G, The Impact of Entrepreneurship
Education in HE, Report, (2005), Business Education Support Team, Oxford, May.
31. Gilljam M, Granberg D. Should we take Don’t Know for an Answer. The Public
Opinion Quarterly 1993;57(3):348-57.
32. Graham JW Missing Data Analysis: making It Work in the Real World. Annual
Review of Psychology 2009; 60: 549-76.
33. Groothuis PA, Whitehead JC. Does don't know mean no? Analysis of 'don't know'
responses in dichotomous choice contingent valuation questions. Applied Economics
2002;34(15):1935-1940.
34. Hadjimanolis A. A case study of SME–university research collaboration in the
context of a small peripheral country (Cyprus). International Journal of Innovation
Management 2006;10:65–88.
35. Harris R, McAdam R, McCausland I, Reid R. Levels of innovation within SMEs in
peripheral regions: the role of business improvement initiatives. Journal of Small
Business and Enterprise Development 2013;20(1):102–24.
36. Huang X, Zhu Q. A pseudo-nearest-neighbour approach for missing data on Gaussian
random data sets. Pattern Recognition Letters 2002;23:1613-622.
37. Hudson M, Smart A, Bourne M. Theory and practice in SME performance
measurement systems. International Journal of Operations and Production
Management 2001;21:1096–115.
38. Japkowicz N, Stephen S. The class imbalance problem: A systematic study.
Intelligent Data Analysis 2002;6(5):429-49.
39. Jiroušek, R. An Attempt to Define Graphical Models in Dempster-Shafer Theory of
Evidence, In: Borgel et al. (Eds.) Combining Soft Computing and Statistical Methods

39
in data Analysis (Advances in Intelligent and Soft Computing 77), Springer-Verlag,
Berlin Heidelberg, 2010; p. 361-368.
40. Keskin H. Market orientation, learning orientation, and innovation capabilities in
SMEs: An extended model. European Journal of Innovation Management 2006;9:396-
417.
41. King WR, Kugler JL. The impact of rhetorical strategies on innovation decisions: an
experimental study. Omega 2000; 28(5):485-99.
42. Kohavi R, Rothleder NJ, Simoudis E. Emerging Trends in Business Analytics.
Communications of the ACM 2002; 45(8):45-8.
43. Koslowsky S. The case of missing data. Journal of Database Marketing
2002;9(4):312-18.
44. Kula V, Tatoglu E. An exploratory study of internet adoption by SMEs in an
emerging market economy. European Business Review 2003;15(5):324-33.
45. Laforet, S. Size, strategic, and market orientation effects on innovation. Journal of
Business Research 2008;61:753–64.
46. Lee S-G, Kanazawa Y. Handling "Don't Know" Survey Responses: The Case of
Japanese Voters on Party Support, Behaviormetrika 2000;27:181-200.
47. Lesjak D, Vehovar V. Factors affecting evaluation of e-business projects. Industrial
Management & Data Systems 2005;105:409-28.
48. Liu L. Special Issue on the Dempster-Shafer Theory of Evidence: An Introduction.
International Journal of Intelligent Systems 2003;18:1-4.
49. Little RJA, Rubin DB. The Analysis of Social Science Data with Missing Values.
Sociological Methods Research 1998;18(2-3):292-326.
50. Loebbecke C, Schäfer S. Web portfolio based electronic commerce: the case of
transtec AG. Logistics Information Management 2001;14:54-67.
51. Luskin, RC, Bullock, JG. "Don’t Know" Means "Don’t Know": DK Responses and
the Public’s Level of Political Knowledge. The Journal of Politics 2011;73:547-57.
52. McAdam R, Reid R, Gibson D. Innovation and Organisational size in Irish: an
empirical study. Intentional Journal of Innovation Management 2004; 8:147-65.
53. Orfila-Sintes F, Mattsson J. Innovation behavior in the hotel industry. Omega
2009;37:380-394.
54. Patel SH. Business age and characteristic of SME performance. Working paper series
no. 14, Kingston. Business School, 2005 Kingston University, London, UK.

40
55. Piatetsky-Shapiro, G. Data Mining and Knowledge Discovery 1996-2005:
Overcoming the Hype and Moving from “University” to “Business” and “Analytics”.
Data Mining and Knowledge Discovery 2007;15:99-105.
56. Pickernell D, Packham G, Jones P, Miller C, Thomas B. Graduate entrepreneurs are
different: they have more knowledge? International Journal of Entrepreneurial
Behaviour and Research 2011;17:183-202.
57. Reynolds P, Bosma N, Autio E, Hunt S, De Bono N, Servais I, Lopez-Garcia P, Chin
N. Global Entrepreneurship Monitor: Data Collection Design and Implementation
1998–2003, Small Business Economics 2005;24:205-31.
58. Romijn H, Albaladejo M. Determinants of innovation capabilities in small electronics
and software firms in southeast England. Research Policy 2002;31;1053-1067.
59. Rothwell R, Zegveld W. Innovation and the small and medium sized firm. London:
Francis Pinter; 1986.
60. Russell R, Russell C. An examination of the effects of organisational norms,
organisational structure, and Environmental uncertainty on Entrepreneurial Strategy.
Journal of Management 1992;18(4):639-56.
61. Safranek RJ, Gottschlich S, Kak AC. Evidence accumulation using binary frames of
discernment for verification vision. IEEE Transactions on Robotics and Automation
1990;6:405-17.
62. Salavou H, Baltas G, Lioukas S. Organisational innovation in SMEs: The importance
of strategic orientation and competitive structure. European Journal of Marketing
2004;38: 1091-112.
63. Sawyer O, McGee J, Peterson M. Perceived Uncertainty and Firm Performance in
SMEs: The Role of Personal Networking Activities. International Small Business
Journal 2003; 21(3):269-90.
64. Schafer JL, Graham JW. Missing Data: Our View of the State of the Art.
Psychological Methods 2002;7(2):147-77.
65. Schultze U, Stabell C, Knowing What You Don’t Know? Discourses and
Contradictions in Knowledge Management Research. Journal of Management Studies
2004;41(4):549-73.
66. Schumpeter J. Capitalism, Socialism and Democracy. New York: Harper; 1942.
67. Seising R, Sanz V. From Hard Science and Computing to Soft Science and
Computing – An Introductory Survey. In Seising R, Sanz V. (Eds.) Soft Computing in

41
Humanities and Social Sciences (Studies in Fuzziness and Soft Computing), Springer
2011; p. 3-35.
68. Shafer GA. Mathematical theory of evidence. Princeton, Princeton University Press
1976.
69. Sharma R, Reynolds P, Scheepers R, Seddon PB, Shanks G. Business Analytics and
Competitive Advantage: A Review and a Research Agenda, in Respicio et al. (eds.)
Bridging the Socio-technical Gap in Decision Support Systems, IOS Press, 2010; p.
187-198.
70. Smallbone D, Baldock R, Burgess S. Targeted support for high-growth start-ups:
some policy issues. Environment and Planning C: Government and Policy
2002;20:195-209.
71. Smets P. Analyzing the combination of conflicting belief functions. Information
Fusion 2007;8:387-412.
72. Sorensen JB, Stuart TE. Aging, obsolescence, and organizational innovation.
Administrative Science Quarterly 2000;45:81-112.Svolba G. Missing Values: The
origin, detection, treatment and consequences of missing values in analytics.
Analytics: Driving Better Business Decisions 2014, Jan/Feb:58-65.
73. Teoa, TSH, Limb VKG, Laia RYC. Intrinsic and extrinsic motivation in Internet
usage. Omega 1999;27(1):25-37.
74. Theodorou P, Florou G. Manufacturing strategies and financial performance - The
effect of advanced information technology: CAD/CAM systems. Omega 2008;
36(1):107-121.
75. Twomey JM, Smith AE. Bias and Variance of Validation Methods for Function
Approximation Neural Networks under Conditions of Sparse Data. IEEE Transaction
on Systems, Man and Cybernetics – Part C: Applications and Reviews 1998;28:417-
430.
76. Turner J, Michael M. What do we know about “don't knows”? Or, contexts of
“ignorance”. Social Science Information 1996;35(1):15-37.
77. Utterback JM, Abernathy, WJ. A dynamic model of process and product innovation.
Omega 1975;3(6):639-656.
78. Van Looy B, Debackere K, Andries P. Policies to stimulate regional innovation
capabilities via university–industry collaboration: an analysis and an assessment.
R&D Management 2003;33(2):209–29.

42
79. Wang C, Walker EA, Redmond J. Explaining the lack of strategic planning in SMEs:
the importance of owner motivation. International Journal of Organisational
Behaviour 2007; 12(1):1-16.
80. Westhead P, Wright M, Ucbasaran, D. International market selection strategies
selected by ‘micro’ and ‘small’firms. Omega 2002;30(1):51-68.
81. White M. 1988, Small Firm's Innovation: Why Regions Differ, Policy Studies
Institute, London.
82. Wright PW, Gardner TM, Moynihan LM. The impact of HR practices on the
performance of business units. Human Resource Management Journal 2003; 13(3):21-
36.