a multivariate panel data analysis on nexus between banks...
TRANSCRIPT
Vol-3 Issue-6 2017 IJARIIE-ISSN(O)-2395-4396
7042 www.ijariie.com 774
A Multivariate Panel Data Analysis on Nexus
between Banks Stock Returns and Institutional
Specific Profitability Determinants of
Commercial Banks listed in BSE Dr. P. Arun Prakash* Ms. B. Savitha**
* Asst Prof, School of Management Studies, Bannari Amman Institute of Technology,
Sathyamangalam.
**Asst Prof, Department of Commerce, Sri Krishna Adithya College of Arts and Science, Coimbatore.
ABSTRACT
This study investigates the dynamic nexus between commercial banks stock returns and banking
sectoral profitability indicators for the period 2004-2005 to 2014-2016. The study aims to find the association
between banks stock returns and institutional specific factors with the help of econometrics tools such as Panel
Unit Root Test Analysis, Panel Johansen Fisher Panel Cointegration Test, Granger Casualty and Panel Data
Regression (Random Effect Model). The analytical results revealed the long term relationship between bank
stocks return and profitability determinants of commercial banks listed in during the study period. It is found
that all the profitability variables are cointegrated with bank stocks return of commercial banks. It is also
observed from the results that exogenous variables such as Return on Assets (ROA), Return on Equity (ROE),
Operating Profits to Total Assets (OPTA), Deposits to Total Liabilities (DPTL) ,Return on Advances (ROAD),
Secured Advances to Total Advances (SATAD), Non-Performing Assets to Total Assets (NPATA) and Repo Rate
(RR) have prodigious effect in determining the movement of bank stocks return of listed commercial banks.
1. INTRODUCTION
Commercial Banks have witnessed tremendous changes in its functioning post banking reforms
introduced during the year 1991. In the wake of stock market integration at global level, international major
episodes like global financial crisis, Chinese currency devaluation and Asian financial crisis. Indian commercial
banks are no exception to these phenomena. Surprisingly, Indian commercial banks were unaffected by the
sweeping changes of global economic meltdown. The US Sub-prime crisis was a big lesson for the banks which
extended loans without proper scrutiny of loan applications. Macroeconomic indicators have also its own
contribution to the volatility level of banks stock return. Monetary policy rate also has its influence on banks
stock returns. With this few brief prelude, the paper has been organised as follows: Section 2 reviews the
existing literature related to banks stock returns at global level. Section 3 presents the research design and
methodology. Section 4 discusses the empirical results and Section 5 concludes.
2. REVIEW OF LITERATURE
Maysami and Koh (2000) tested the relationships between the Singapore stock index and selected
macroeconomic variables over a seven-year period from 1988 to 1995 and they found that there existed a
positive relationship between stock returns and changes in money supply but negative relationships between
stock returns with changes in price levels, short- and long-term interest rates and exchange rates. Their results
showed that high inflation in Indonesia and Philippines influences the long-run negative relation between
stock prices and the money supply, while the money growth in Malaysia, Singapore, and Thailand induces the
positive effect for their stock markets. The exchange rate variable is positively related to stock prices in
Indonesia, Malaysia, and Philippines, yet negatively related in Singapore and Thailand. Yusof et al. (2006)
employed the autoregressive distributed lag model (ARDL) to examine the long run relationship between
macroeconomic variables and stock returns in Malaysia. The macroeconomic variables tested in the study are
the money supply, industrial production index, real effective exchange rate, and treasury bill rates. As
hypothesized, money supply is found to be positively related to the changes in stock prices while exchange
rate has negative effect on stock prices in the Malaysian m a r k e t .
Mohammad et al. (2009) establish the association between share prices of KSE (Karachi Stock Exchange) and
foreign exchange reserve, foreign exchange rate, industrial production index, wholesale price index, gross fixed

Vol-3 Issue-6 2017 IJARIIE-ISSN(O)-2395-4396
7042 www.ijariie.com 775
capital formation and broad money in the context of Pakistan. The result shows that after the reforms in 1991
the influence of foreign exchange rate and foreign exchange reserve significantly affected the stock prices.
Other variables like whole sale price index, and gross fixed capital formation insignificantly affected stock
prices while external factors like money supply and foreign exchange affected prices positively. Ahmad,
Rehman, Raoof (2010) observed the impact of interest rate and exchange rate to the Stock Return in Pakistan.
The dependent variable used in their research is the stock return of KSE-100, where the independent variables
used are interest rate and exchange rate (Rs/USD). The data is collected from the State Bank of Pakistan and
Karachi Stock Exchange over period of 1998 – 2009 on yearly basis. As a result of multiple regression
model analysis, it shows that the change in interest rate and exchange rate has a significant impact on stock
returns. The change in interest rate giving negative impact, while change in exchange rate giving positive to
the stock returns. AhmetBüyükşalvarcıb(2010) analyzed the effect of seven variables of macroeconomics in
the Turkish Stock Exchange Market using the Arbitrage Pricing Theory framework. The method used in
processing the data is Multiple Regression with seven variables macroeconomic (variables consumer price
index, money market interest rate, gold price, industrial production index, oil price, foreign exchange rate and
money supply) as independent variables and Turkish stock market Index (Istanbul Stock Exchange Index-
100) as dependent variable. The data used are monthly basis over the period of January 2003 to March 2010.
As a result, interest rate, industrial production index, oil price, foreign exchange rate has a negative effect while
money supply has positive impact on ISE-100 Index returns. Moreover, inflation rate and gold price do not
have any significant effect on ISE-100 Index returns. Xiufang Wang (2010) found that there is a unidirectional
causal relationship between stock market volatility and interest rate volatility, with the direction from stock
prices to the interest rate between bank stock and macroeconomic of important for financial and economic stability.
The model included were GDP growth, inflation, house price inflation, federal funds rate and banking sector.
The study found, expansionary shock shows the average bank risk decline and average bank lending increases.
Further, the heterogeneity banks were characterized by idiosyncratic shocks. Also borrowing of larger banks
increase risk of riskier and domestic banks has more response to house price shock. Xiufang Wang (2011) try to
find some evidence on the relationship between stock price and macroeconomic variables (Real GDP, CPI,
short term interest rate) in China Stock Market. The research is aim to estimate the volatility of each variable
using Exponential Generalized Autoregressive Conditional Heteroskedasticity (EGARCH) and determine the
causal relationship between the stock price volatility and macroeconomic variables by using Lag-Augmented
VAR (LA-VAR) models. The first finding of these research is there is no causal relationship between stock
price and real GDP volatility. Bilateral causal relationship is found between inflation and stock price volatility.
Saeed and Akhter (2012) determined the effects of macroeconomic variables on stock prices and investment
decisions has preoccupied the minds of economists. In the literature, there are many empirical studies that
disclose the relationship between macroeconomic variables such as interest rate, inflation, exchange rates,
money supply, etc., and stock prices. Hsing. Y (2012) applied the exponential GARCH model to examine the
macroeconomic factors that influenced the Argentine stock market index. The author chosen real GDP,
money policy, fiscal policy, the exchange rate, the world stock market as represented by the U.S. stock market
index, and the inflation rate. His results indicated that the Argentine stock market index is positively associated
with real GDP, the ratio of M2 money supply to GDP, the peso/USD exchange rate and the U.S. stock
market index, while negatively influenced by the money market rate, government spending as a percent of
GDP and the inflation rate. Laichena and Obwogi (2015) sought to determine the effects of
macroeconomic variables on stock returns in East Africa. Their study used stock returns, interest rate, inflation,
exchange rate and GDP of the 3 East African countries from 2005 to 2014. Their multiple regression results
using random effects model indicated a significant and negative relationship between stock returns and both
exchange rates and interest rates, while displaying a significant but positive relationship between stock returns
and both inflation and GDP.
3. RESEARCH DESIGN
3.1. Statement of the Problem
Commercial Banks performance have come under the keen scrutiny by regulatory bodies like Reserve
Bank of India and Securities Exchange Board of India. Bank stock returns are affected by various
macroeconomic factors such as GDP, inflation rate, exchange rate, and credit growth. In addition to this, RBI’s
Monetary Policy Rates are also having its critical impact on the movement of bank stock in the capital market.
It has implication on banks commercial banks return and risk level in the market. Apart from this, the movement
of stock or the performance of banex predominantly dependent on the financial figures of listed commercial
banks. Audited financial statements play a crucial factor in investment decisions made by the players, investors
and other stakeholders. To be more specific, financial ratios provide clear cut indication about the financial
health of the commercial banks. The financial results serve as the basis for fluctuating prices of bank stock. In
this context, the researcher has taken an effort to analyze the interface between bank stock returns and
institutional specific factors.

Vol-3 Issue-6 2017 IJARIIE-ISSN(O)-2395-4396
7042 www.ijariie.com 776
3.2. Objectives of the Study
The following objectives are outlined for the study.
1) To analyse the existence of stationary of the bank specific profitability determinants and stock
returns of commercial banks listed in BSE.
2) To examine the long run and causality relationship between stock returns of commercial banks
listed in BSE and bank specific profitability determinants.
3) To evaluate the impact of bank specific profitability determinants on stock returns of commercial
banks listed in BSE.
3.3. Statement of Hypotheses
Based on the above mentioned objectives, the following hypotheses are formulated and tested.
1. H0 Bank specific profitability determinants and stock returns of commercial banks listed in BSE do not
have stationarity during the study period.
2. H0 Bank specific profitability determinants and stock returns of commercial banks listed in BSE are not
cointegrated with each other.
3. H0 Bank specific profitability determinants do not granger cause stock returns of commercial banks
listed in BSE and vice versa.
4. H0 Bank specific profitability determinants are not having significant relationship with
stock returns of commercial banks listed in BSE.
3.4. RESEARCH METHODOLOGY
3.4.1. Nature of the Study
The study is descriptive and analytical in nature. It describes the impact of banking sectoral
profitability indicators on Bank Stock Returns.
3.4.2. Sources of Data
The study primarily depends on secondary data. Ratios and other financial variables are heavily drawn
from “Statistical Tables Relating to Banks in India” published by Reserve Bank of India. Data for
macroeconomic factors have been compiled from “Handbook on Statistics of Indian Economy” published by
RBI. Bank stock returns of 27 commercial banks listed in Bombay Stock Exchange have been taken from
“Historical Data of Stock Prices” in BSE website.
3.4.3. Sampling Framework
For the purpose of the study, the researcher has taken totally 27 commercial banks listed in Bombay
Stock Exchange of India. 16 public sector banks and 11 private sector banks have been taken based on the
consistency and availability of data. The list of sample commercial banks chosen for the study is shown in
Annexure 1.
3.4.4. Research Instruments
The study has employed the following econometrics tools for analysis of macroeconomic data.
1. Panel Unit Root Test
2. Johanson Fisher Panel Cointegration Test
3. Granger Causality Test and
4. Panel Data Regression Analysis (Random Effect Model)
3.4.5. Period of the Study
The study is analytical in nature and the present study uses the latest available secondary data
published by RBI for the 12 years starting from 2004-2005 to 2015-2016. 3.4.6. Limitations of the Study
1. The study has heavily dependent on secondary data which does not reflect the qualitative aspects
like investors psychology on price movement.
2. The study has taken listed commercial banks based on the availability of data for the study period,
which do not represent the entire population of listed commercial banks.

Vol-3 Issue-6 2017 IJARIIE-ISSN(O)-2395-4396
7042 www.ijariie.com 777
3.4.7 Summary of Variables used in the study and its Expected Relationship
ENDOGENOUS
VARIABLE EXOGENOUS VARIABLES
Expected
Relationship
BANK-STOCK
RETURN –BANK
SR
Return on Assets - ROA +
Return on Equity - ROE +
Net Interest Margin to Total Assets - NIMTA +
Operating Profit to Total Assets - OPTA +
Return on Advances - ROAD +
Deposits to Total Liabilities - DPTL +
Private Sector Lending - PVSL +/-
Secured Advances to Total Advances - SATAD +/-
Non-Performing Assets to Total Assets- NPATA -
Repo Rate - RR +/-
Gross Domestic Product - GDP +
Inflation Rate - IR -
Vol-3 Issue-6 2017 IJARIIE-ISSN(O)-2395-4396
7042 www.ijariie.com 778
3. ANLAYSIS AND DISCUSSION OF EMPIRICAL RESULTS
4.1 – Econometrics Analysis of Bank Stocks Return and Bank Specific Profitability Determinants
The empirical evidence of the impact of banking institutional specific profitability determinants on banks stock returns of listed in BSE based on data of commercial
banks over the period 2005-2016 is presented in this section. This section highlights the descriptive statistics of the selected variables, the correlation matrix, and finally the
empirical panel data analysis with random effect model.
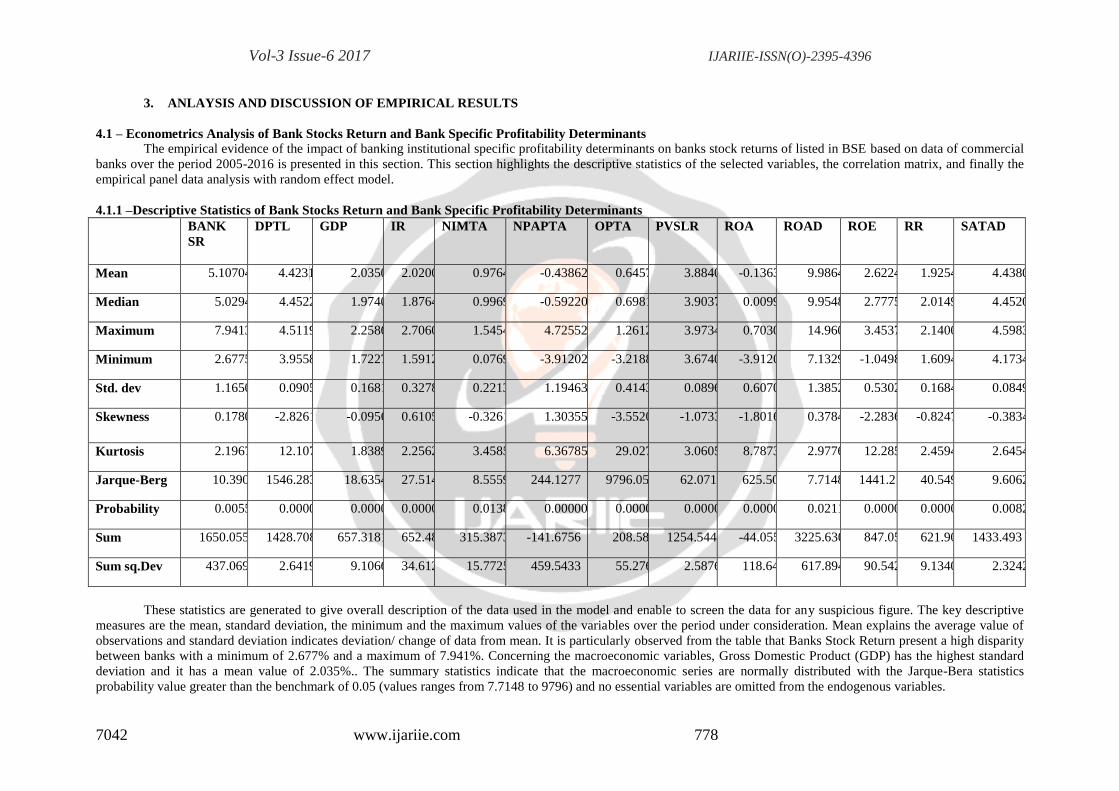
4.1.1 –Descriptive Statistics of Bank Stocks Return and Bank Specific Profitability Determinants
BANK
SR
DPTL GDP IR NIMTA NPAPTA OPTA PVSLR ROA ROAD ROE RR SATAD
Mean 5.1070450 4.4231 2.035043 2.020063 0.976431 -0.438624 0.645770 3.884038 -0.136394 9.986471 2.622471 1.925411 4.438058
Median 5.029457 4.452211 1.974081 1.876407 0.996949 -0.592205 0.698135 3.903789 0.009950 9.954849 2.777576 2.014903 4.452099
Maximum 7.941313 4.511958 2.258633 2.706048 1.545433 4.725524 1.261298 3.973494 0.703098 14.96000 3.453790 2.140066 4.598397
Minimum 2.677591 3.955848 1.722767 1.591274 0.076961 -3.912023 -3.218876 3.674020 -3.912023 7.132926 -1.049822 1.609438 4.173418
Std. dev 1.165057 0.090581 0.168171 0.327861 0.221321 1.194635 0.414325 0.089645 0.607010 1.385254 0.530271 0.168424 0.084960
Skewness 0.178065 -2.826188 -0.095695 0.610588 -0.326143 1.303559 -3.552034 -1.073362 -1.801655 0.378400 -2.283628 -0.824733 -0.383419
Kurtosis 2.196735 12.10740 1.838945 2.256252 3.458541 6.367856 29.02715 3.060523 8.787366 2.977687 12.28587 2.459404 2.645412
Jarque-Berg 10.39068 1546.283 18.63547 27.51463 8.555968 244.1277 9796.056 62.07102 625.5089 7.714897 1441.216 40.54970 9.606205
Probability 0.005542 0.000000 0.000090 0.000001 0.013871 0.000000 0.000000 0.000000 0.000000 0.021122 0.000000 0.000000 0.008204
Sum 1650.055 1428.708 657.3181 652.4803 315.3873 -141.6756 208.5837 1254.544 -44.05519 3225.630 847.0582 621.9079 1433.493
Sum sq.Dev 437.0692 2.641957 9.106669 34.61277 15.77257 459.5433 55.27609 2.587645 118.6447 617.8947 90.54235 9.134059 2.324267
These statistics are generated to give overall description of the data used in the model and enable to screen the data for any suspicious figure. The key descriptive
measures are the mean, standard deviation, the minimum and the maximum values of the variables over the period under consideration. Mean explains the average value of
observations and standard deviation indicates deviation/ change of data from mean. It is particularly observed from the table that Banks Stock Return present a high disparity
between banks with a minimum of 2.677% and a maximum of 7.941%. Concerning the macroeconomic variables, Gross Domestic Product (GDP) has the highest standard
deviation and it has a mean value of 2.035%.. The summary statistics indicate that the macroeconomic series are normally distributed with the Jarque-Bera statistics
probability value greater than the benchmark of 0.05 (values ranges from 7.7148 to 9796) and no essential variables are omitted from the endogenous variables.
Vol-3 Issue-6 2017 IJARIIE-ISSN(O)-2395-4396
7042 www.ijariie.com 779
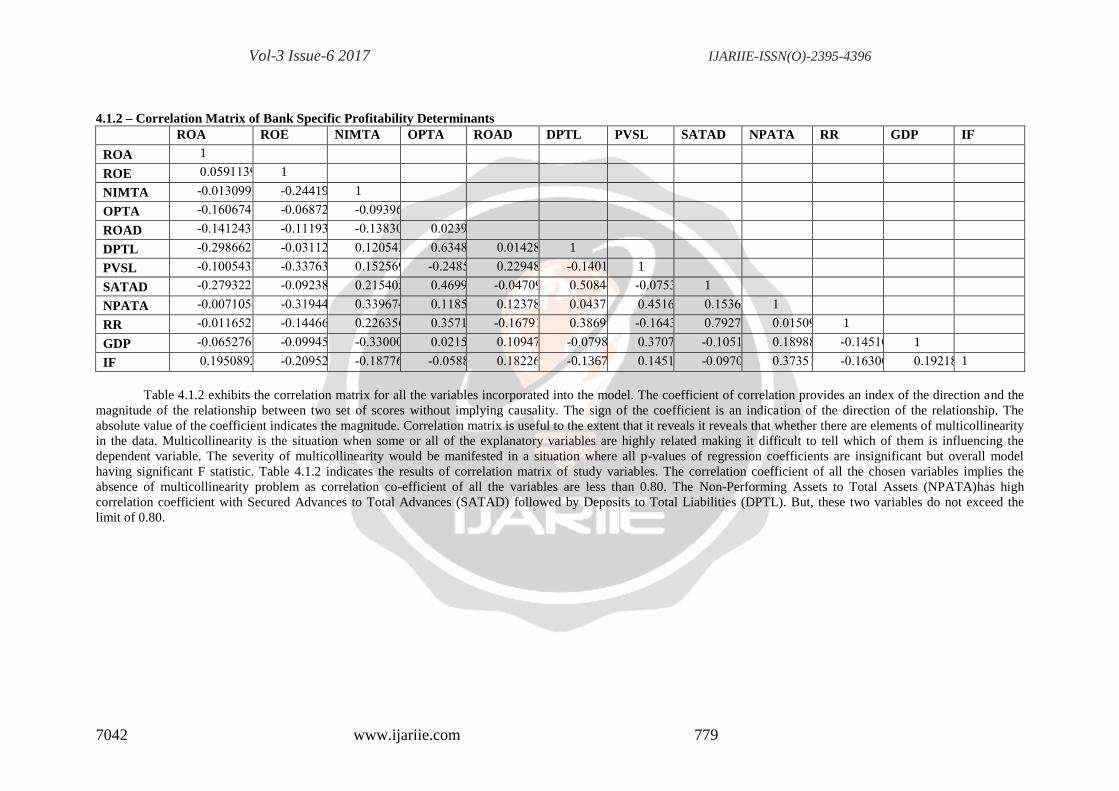
4.1.2 – Correlation Matrix of Bank Specific Profitability Determinants
ROA ROE NIMTA OPTA ROAD DPTL PVSL SATAD NPATA RR GDP IF
ROA 1
ROE 0.0591139… 1
NIMTA -0.0130991… -0.2441944 1
OPTA -0.1606748… -0.06872532… -0.0939672…
1
ROAD -0.1412434… -0.1119371… -0.1383007… 0.02399658…
1
DPTL -0.2986621… -0.03112451… 0.12054397… 0.63489677… 0.0142808… 1
PVSL -0.1005436… -0.3376348… 0.15256974… -0.2485471… 0.22948803… -0.1401468… 1
SATAD -0.2793223… -0.09238970… 0.21540556… 0.46997166… -0.0470982… 0.50844001… -0.0753129… 1
NPATA -0.0071054… -0.3194419… 0.33967426… 0.11857931… 0.12378038… 0.04371669… 0.45165330… 0.15362193… 1
RR -0.0116527… -0.14466439… 0.22635643… 0.35716654… -0.1679159… 0.38699350… -0.1643027… 0.79277252… 0.01509130… 1
GDP -0.0652767… -0.0994559… -0.3300088… 0.02158647… 0.10947579… -0.0798854… 0.37073980… -0.1051434… 0.18988840… -0.1451006… 1
IF 0.19508925… -0.2095253… -0.1877605… -0.0588348… 0.18226347… -0.1367511.. 0.14513591… -0.0970432… 0.37351956… -0.1630045… 0.19218741… 1
Table 4.1.2 exhibits the correlation matrix for all the variables incorporated into the model. The coefficient of correlation provides an index of the direction and the
magnitude of the relationship between two set of scores without implying causality. The sign of the coefficient is an indication of the direction of the relationship. The
absolute value of the coefficient indicates the magnitude. Correlation matrix is useful to the extent that it reveals it reveals that whether there are elements of multicollinearity
in the data. Multicollinearity is the situation when some or all of the explanatory variables are highly related making it difficult to tell which of them is influencing the
dependent variable. The severity of multicollinearity would be manifested in a situation where all p-values of regression coefficients are insignificant but overall model
having significant F statistic. Table 4.1.2 indicates the results of correlation matrix of study variables. The correlation coefficient of all the chosen variables implies the
absence of multicollinearity problem as correlation co-efficient of all the variables are less than 0.80. The Non-Performing Assets to Total Assets (NPATA)has high
correlation coefficient with Secured Advances to Total Advances (SATAD) followed by Deposits to Total Liabilities (DPTL). But, these two variables do not exceed the
limit of 0.80.
Vol-3 Issue-6 2017 IJARIIE-ISSN(O)-2395-4396
7042 www.ijariie.com 780
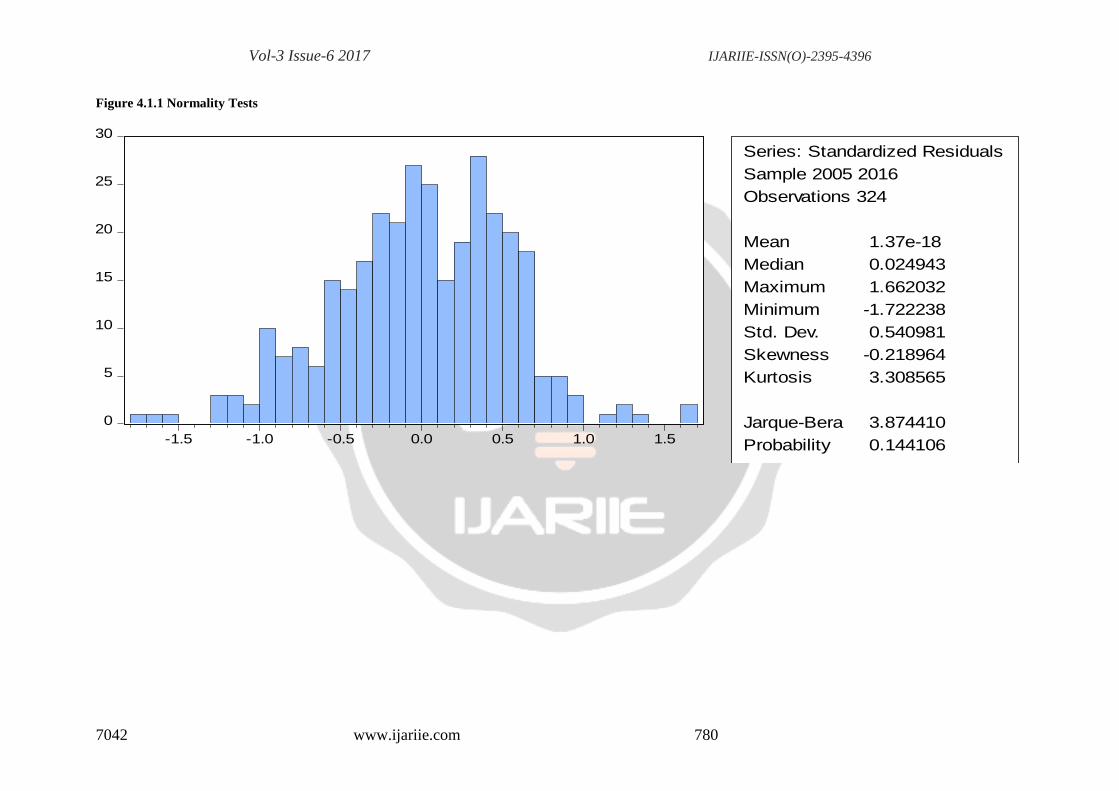
Figure 4.1.1 Normality Tests
0
5
10
15
20
25
30
-1.5 -1.0 -0.5 0.0 0.5 1.0 1.5
Series: Standardized Residuals
Sample 2005 2016
Observations 324
Mean 1.37e-18
Median 0.024943
Maximum 1.662032
Minimum -1.722238
Std. Dev. 0.540981
Skewness -0.218964
Kurtosis 3.308565
Jarque-Bera 3.874410
Probability 0.144106
Vol-3 Issue-6 2017 IJARIIE-ISSN(O)-2395-4396
7042 www.ijariie.com 781
Normality Test
The Jargue-Bera (JB) test is conducted to test the normality of the residuals. Since the p-value is very
high (0.144106), the JB test states that the variables are normally distributed.
Heteroskedasticity Test The White test has been employed to test the presence of heteroskedsastic elements among the chosen
variables and the robust standard errors have been presented to account for the presence of heteroscedasticity.
Before running white test, the natural logarithm of all the variables are taken. The results indicated the residuals
of study variables are homogenous.
Dignostic Test: Fixed Effects Vs Random Effects Model
The model delineating the stock returns of listed commercial banks is estimated using Panel Least
Square method. The random effect panel regression model has been adopted, because the panel sample is
adequately large enough to permit the use of Random Effects Model. To ascertain the selection of random effect
model is appropriate, the hausman test is carried out and the results are presented in Table 4.1.3. The null
hypothesis (Ho) supports the use of panel data regression model with random effect against the alternative (Ha)
Since the estimated chi-square value (282.47Y) is highly significant, the fixed effect model is rejected and
random effects model is fitted.
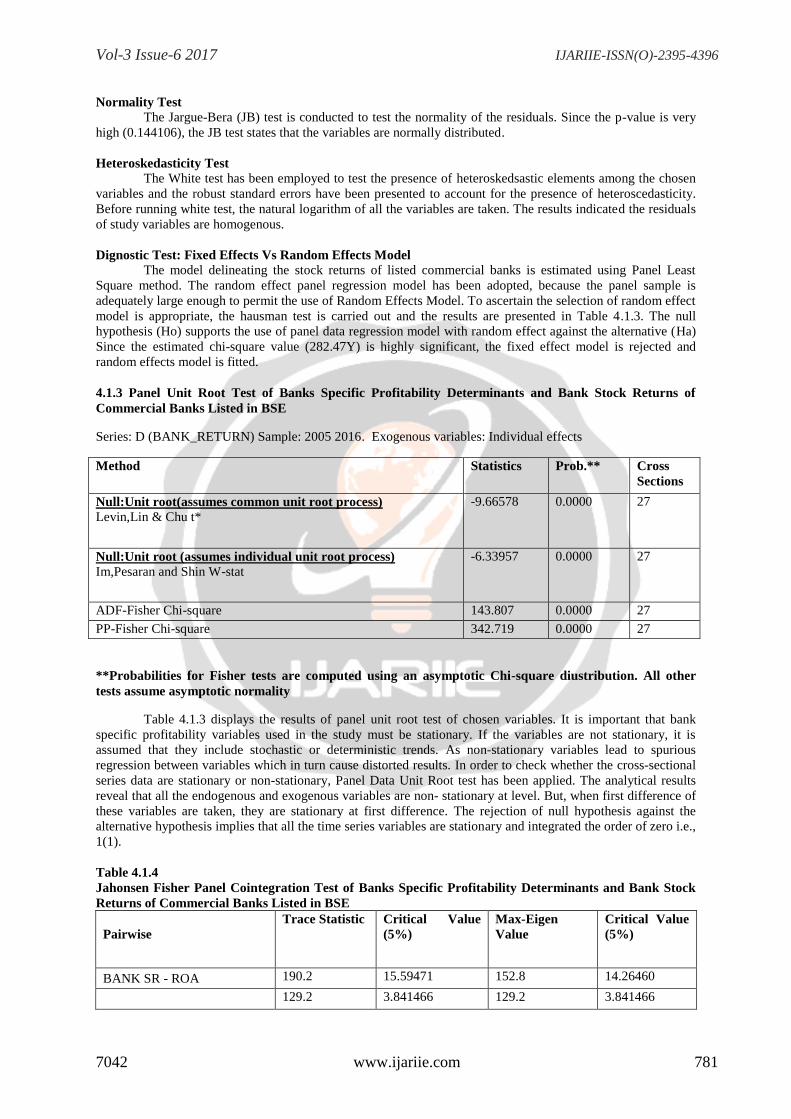
4.1.3 Panel Unit Root Test of Banks Specific Profitability Determinants and Bank Stock Returns of
Commercial Banks Listed in BSE
Series: D (BANK_RETURN) Sample: 2005 2016. Exogenous variables: Individual effects
Method Statistics Prob.** Cross
Sections
Null:Unit root(assumes common unit root process)
Levin,Lin & Chu t*
-9.66578 0.0000 27
Null:Unit root (assumes individual unit root process)
Im,Pesaran and Shin W-stat
-6.33957 0.0000 27
ADF-Fisher Chi-square 143.807 0.0000 27
PP-Fisher Chi-square 342.719 0.0000 27
**Probabilities for Fisher tests are computed using an asymptotic Chi-square diustribution. All other
tests assume asymptotic normality
Table 4.1.3 displays the results of panel unit root test of chosen variables. It is important that bank
specific profitability variables used in the study must be stationary. If the variables are not stationary, it is
assumed that they include stochastic or deterministic trends. As non-stationary variables lead to spurious
regression between variables which in turn cause distorted results. In order to check whether the cross-sectional
series data are stationary or non-stationary, Panel Data Unit Root test has been applied. The analytical results
reveal that all the endogenous and exogenous variables are non- stationary at level. But, when first difference of
these variables are taken, they are stationary at first difference. The rejection of null hypothesis against the
alternative hypothesis implies that all the time series variables are stationary and integrated the order of zero i.e.,
1(1).
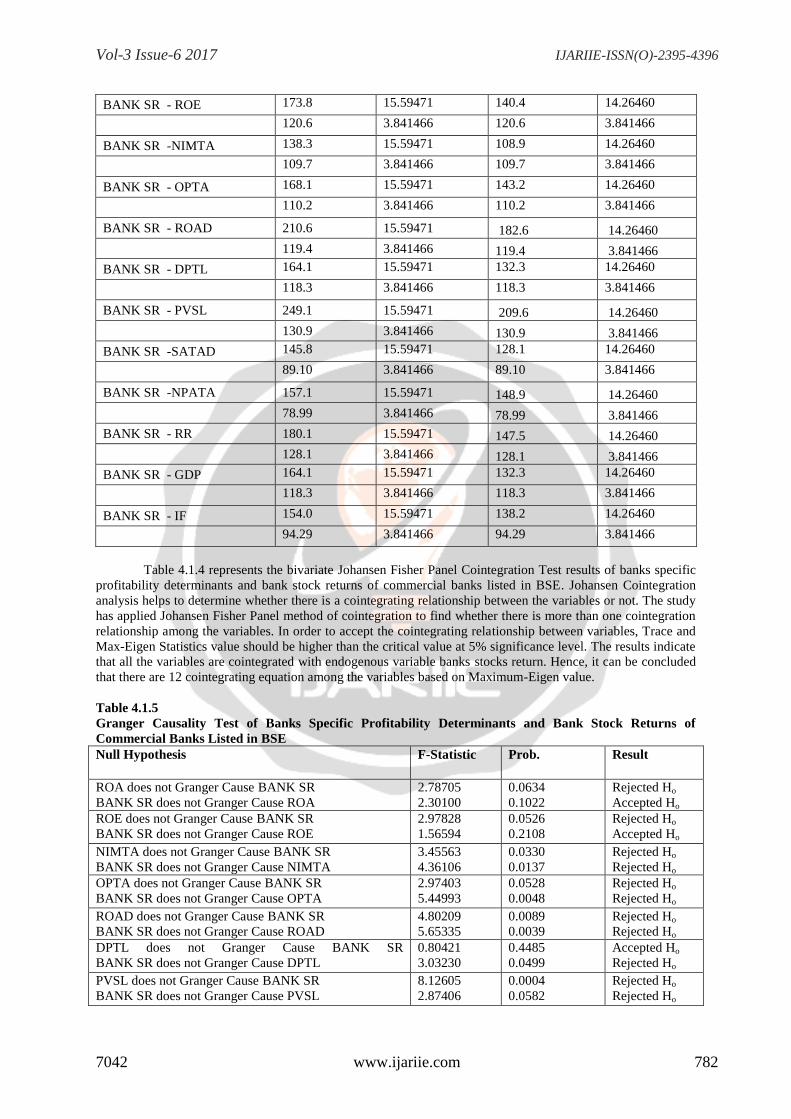
Table 4.1.4
Jahonsen Fisher Panel Cointegration Test of Banks Specific Profitability Determinants and Bank Stock
Returns of Commercial Banks Listed in BSE
Pairwise
Trace Statistic Critical Value
(5%)
Max-Eigen
Value
Critical Value
(5%)
BANK SR - ROA 190.2 15.59471
152.8 14.26460
129.2 3.841466
129.2 3.841466
Vol-3 Issue-6 2017 IJARIIE-ISSN(O)-2395-4396
7042 www.ijariie.com 782
BANK SR - ROE 173.8 15.59471
140.4 14.26460
120.6 3.841466
120.6 3.841466
BANK SR -NIMTA 138.3 15.59471
108.9 14.26460
109.7 3.841466
109.7 3.841466
BANK SR - OPTA 168.1 15.59471
143.2 14.26460
110.2 3.841466
110.2 3.841466
BANK SR - ROAD 210.6 15.59471 182.6 14.26460
119.4 3.841466 119.4 3.841466
BANK SR - DPTL 164.1 15.59471
132.3 14.26460
118.3 3.841466
118.3 3.841466
BANK SR - PVSL 249.1 15.59471 209.6 14.26460
130.9 3.841466 130.9 3.841466
BANK SR -SATAD 145.8 15.59471
128.1 14.26460
89.10 3.841466 89.10 3.841466
BANK SR -NPATA 157.1 15.59471 148.9 14.26460
78.99 3.841466 78.99 3.841466
BANK SR - RR 180.1 15.59471 147.5 14.26460
128.1 3.841466 128.1 3.841466
BANK SR - GDP 164.1 15.59471
132.3 14.26460
118.3 3.841466
118.3 3.841466
BANK SR - IF 154.0 15.59471
138.2 14.26460
94.29 3.841466
94.29 3.841466
Table 4.1.4 represents the bivariate Johansen Fisher Panel Cointegration Test results of banks specific
profitability determinants and bank stock returns of commercial banks listed in BSE. Johansen Cointegration
analysis helps to determine whether there is a cointegrating relationship between the variables or not. The study
has applied Johansen Fisher Panel method of cointegration to find whether there is more than one cointegration
relationship among the variables. In order to accept the cointegrating relationship between variables, Trace and
Max-Eigen Statistics value should be higher than the critical value at 5% significance level. The results indicate
that all the variables are cointegrated with endogenous variable banks stocks return. Hence, it can be concluded
that there are 12 cointegrating equation among the variables based on Maximum-Eigen value.
Table 4.1.5
Granger Causality Test of Banks Specific Profitability Determinants and Bank Stock Returns of
Commercial Banks Listed in BSE
Null Hypothesis F-Statistic Prob. Result
ROA does not Granger Cause BANK SR
BANK SR does not Granger Cause ROA
2.78705
2.30100
0.0634
0.1022
Rejected Ho
Accepted Ho
ROE does not Granger Cause BANK SR
BANK SR does not Granger Cause ROE
2.97828
1.56594
0.0526
0.2108
Rejected Ho
Accepted Ho
NIMTA does not Granger Cause BANK SR
BANK SR does not Granger Cause NIMTA
3.45563
4.36106
0.0330
0.0137
Rejected Ho
Rejected Ho
OPTA does not Granger Cause BANK SR
BANK SR does not Granger Cause OPTA
2.97403
5.44993
0.0528
0.0048
Rejected Ho
Rejected Ho
ROAD does not Granger Cause BANK SR
BANK SR does not Granger Cause ROAD
4.80209
5.65335
0.0089
0.0039
Rejected Ho
Rejected Ho
DPTL does not Granger Cause BANK SR
BANK SR does not Granger Cause DPTL
0.80421
3.03230
0.4485
0.0499
Accepted Ho
Rejected Ho
PVSL does not Granger Cause BANK SR
BANK SR does not Granger Cause PVSL
8.12605
2.87406
0.0004
0.0582
Rejected Ho
Rejected Ho
Vol-3 Issue-6 2017 IJARIIE-ISSN(O)-2395-4396
7042 www.ijariie.com 783
SATAD does not Granger Cause BANK SR
BANK SR does not Granger Cause SATAD
1.80255
1.80202
0.1669
0.1670
Accepted Ho
Accepted Ho
NPAPTA does not Granger Cause BANK SR
BANK SR does not Granger Cause NPAPTA
1.00897
2.40271
0.3660
0.0924
Accepted Ho
Rejected Ho
RR does not Granger Cause BANK SR
BANK SR does not Granger Cause RR
6.13585
0.01028
0.0025
0.9898
Rejected Ho
Accepted Ho
GDP does not Granger Cause BANK SR
BANK SR does not Granger Cause GDP
9.18726
21.3515
0.0001
3.E-09
Rejected Ho
Accepted Ho
IR does not Granger Cause BANK SR
BANK SR does not Granger Cause IR
11.6255
1.27124
1.E-05
0.2822
Accepted Ho
Accepted Ho
Table 4.1.5 delineates the results of Granger Causality Test of banks stock return of commercial banks
listed in BSE. Granger Causality Analysis is a statistical hypothesis test for determining whether one times
series data is useful in predicting another. Granger causality test results have shown the bi-directional
relationship between Bank Stocks Return (BANK SR) and Net Interest Margin to Total assets (NIMTA),
Operating Profits to Total Assets (OPTA), Return on Advances (ROAD), Private Sector Lending (PVSL).
Whereas all other profitability determinants such as Return on Assets (ROA), Return on Equity (ROE), Deposits
to Total Liabilities (DPTL), Non-Performing Assets to Total Assets (NPATA) and Repo Rate (RR) have
depicted uni-directional relationship with Bank SR. SATAD does not exhibit any causality relationship with
bank stocks return.
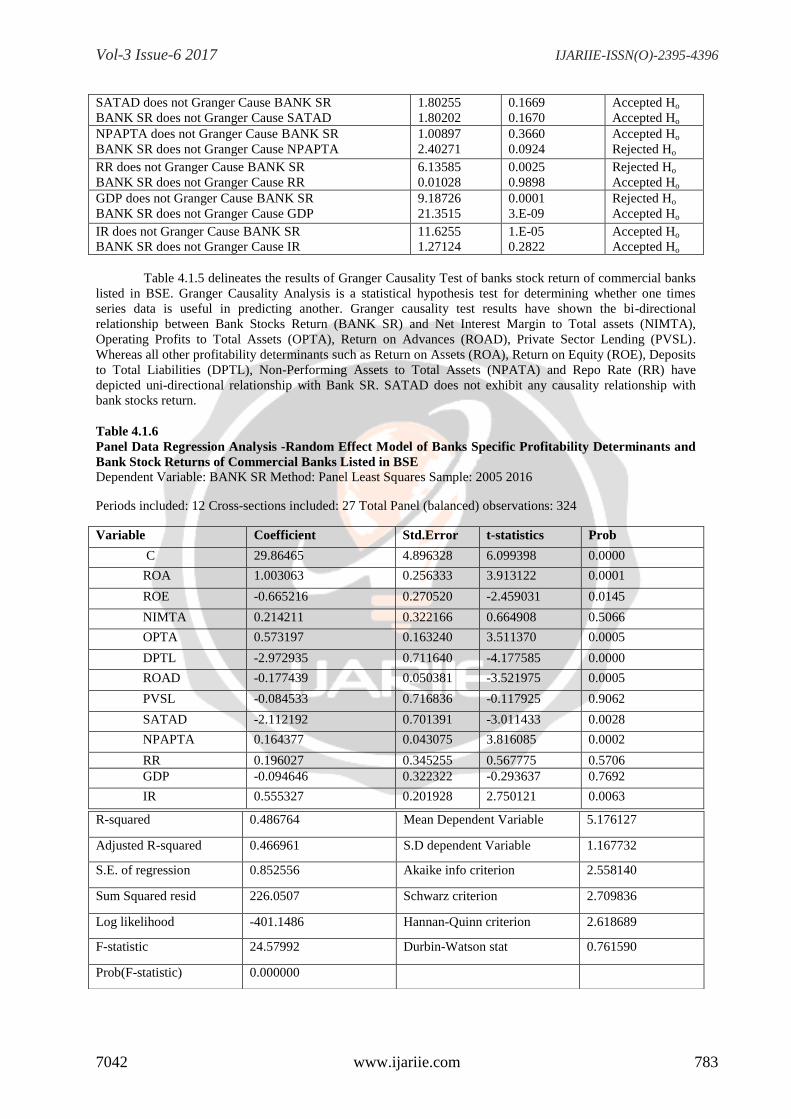
Table 4.1.6
Panel Data Regression Analysis -Random Effect Model of Banks Specific Profitability Determinants and
Bank Stock Returns of Commercial Banks Listed in BSE
Dependent Variable: BANK SR Method: Panel Least Squares Sample: 2005 2016
Periods included: 12 Cross-sections included: 27 Total Panel (balanced) observations: 324
Variable Coefficient Std.Error t-statistics Prob
C 29.86465 4.896328 6.099398 0.0000
ROA 1.003063 0.256333 3.913122 0.0001
ROE -0.665216 0.270520 -2.459031 0.0145
NIMTA 0.214211 0.322166 0.664908 0.5066
OPTA 0.573197 0.163240 3.511370 0.0005
DPTL -2.972935 0.711640 -4.177585 0.0000
ROAD -0.177439 0.050381 -3.521975 0.0005
PVSL -0.084533 0.716836 -0.117925 0.9062
SATAD -2.112192 0.701391 -3.011433 0.0028
NPAPTA 0.164377 0.043075 3.816085 0.0002
RR 0.196027 0.345255 0.567775 0.5706
GDP -0.094646 0.322322 -0.293637 0.7692
IR 0.555327 0.201928 2.750121 0.0063
R-squared 0.486764 Mean Dependent Variable 5.176127
Adjusted R-squared 0.466961 S.D dependent Variable 1.167732
S.E. of regression 0.852556 Akaike info criterion 2.558140
Sum Squared resid 226.0507 Schwarz criterion 2.709836
Log likelihood -401.1486 Hannan-Quinn criterion 2.618689
F-statistic 24.57992 Durbin-Watson stat 0.761590
Prob(F-statistic) 0.000000

Vol-3 Issue-6 2017 IJARIIE-ISSN(O)-2395-4396
7042 www.ijariie.com 784
Table 4.1.6 exhibits the summary results of Panel Data Regression Analysis with Random Effect
Model. In order to control autocorrelation and heteroscedasticity, robust standard errors have been calculated by
clustering the panel data. The value of F for chosen model is significant at 1% level of significance. The
estimation results divulge that Return on Assets (ROA) has a statistically significant relationship with bank
stock returns. The coefficient of Return on Equity (ROE) indicates a negative relationship with BANK SR. At
the same time, its coefficient has been significantly related with endogenous variable bank stock returns. This
result implies that 1% increase in ROE, reduces stock return to the point of 0.66521. The exogenous variable
Return on Advances (ROAD) is negatively related with BANK SR. It denotes that the increase in Return on
Advances is not adequate to the movement of bank stock return. However, this relationship proves to be
statistically significant at 5% level of significance. In accordance with the expected relationship, Net Interest
Margin to Total Assets (NIMTA) has shown a positive relationship with bank stock returns. However, the
coefficient of Net Interest Margin to Total Assets (NIMTA) is having an insignificant relationship. In line with
the expectation, the coefficient of Operating Profits to Total Assets (OPTA) shows a positive association with
endogenous variable BANK SR and significantly related with BANK SR at 1% level of significance. This result
implies that increase in operating profits lead to the positive movement of bank stock returns. An important
determinant of bank stock return is the level of deposits which has a large coefficient with positive sign and
statistically significant as well. It is also consistent with our expectation. The coefficient of Private Sector
Lending (PVSL) is having a highly insignificant association with BANK SR. The coefficient of Secured
Advances to Total Advance (SATAD) is having a negative association with bank stocks return. However, this
result is statistically significant. Hence, it can be interpreted that collateral security received on loans is not
adequate. Similarly, there exists a positive and significant relationship between Non Performing Assets to Total
Assets (NPATA) and bank stocks return. So, increase in NPA level do not affect bank stocks return adversely.
Gross Domestic Product (GDP) has a negative association with BANK SR. It means that increase in GDP
reduces bank stock return. But this result is not statistically significant. Hence, it can be inferred that interest rate
is one of the factors for mounting NPAs in the banks. The influence of monetary policy rate Repo Rate on
BANK SR is negligible. In contrast to our expectation, Inflation Rate (IR) has a positive relationship with
BANKSR and its coefficient is statistically significant at 5% level of significance. R2 value of the model
explains the endogenous variable to the extent of 48% as Likewise, the adjusted R2 value is also good which
implies the goodness of the fil of the model. However, other variables like all monetary policy rate and some
other macroeconomic factors may give better explanation about bank stocks return movement. As Durbin
Watson statistics value is less than 2, there is no problem of auto correlation among the cross sectional data
series.
5. Concluding Remarks: This empirical study has analysed the impact of institutional specific profitability determinants
on Bank Stocks Return using the econometrics tools for the period 2005-2017. The bivariate cointegration
results revealed that all the bank specific profitability determinants are cointegrated with Bank Stocks Return of
commercial banks listed in BSE. It is also found from the analysis that exogenous variables Return on Assets
(ROA), Return on Equity (ROE), Deposits to Total Liabilities (DPTL), Non-Performing Assets to Total Assets
(NPATA) and Repo Rate (RR) are having uni-directional causality relationship with Bank Stocks Return.
Whereas determinants like Net Interest Margin to Total assets (NIMTA), Operating Profits to Total Assets
(OPTA), Return on Advances (ROAD), Private Sector Lending (PVSL) granger caused Bank Stocks Return in
bi-directional mode. It can be concluded that bank specific determinants such as Return on Assets (ROA),
Return on Equity (ROE), Operating Profits to Total Assets (OPTA), Deposits to Total Liabilities (DPTL),Return
on Advances (ROAD), Secured Advances to Total Advances (SATAD), Non-Performing Assets to Total Assets
(NPATA) and Repo Rate (RR) cause monumental upshot on bank stocks return of listed commercial banks.
References:
1) Bharanidharan Suburayan,Dr. Vanitha Srinivasan (2014) ,The Effects of Macroeconomic Variables
on CNX Bankex, Returns: Evidence from Indian Stock Market, vol 4, issue 2
2) Haruna Issahaku, Yazidu Ustarz, Paul Bata Domanban (2013), Macroeconomic Variables and Stock
Market Returns, Asian Economic and Financial Review.
3) Kodaparasti (2014), , The role of Macro economic variables in the stock market in Iran, vol 10,
no2, Polish Journal Of International Studies: [email protected]
4) Lim Kee Fong,Tang Wenk Lok,Yu Yen Hoon (2012), The Impact of Macroeconomic variables on
bank stocks, Returns: Evidence from Malaysia
5) Mike Mugambi, Timothy C. Okech (2016), Internation journal of economic commerce and
management, Effect of macroeconomic variables on stock returns bank in Kenya, vol 4.issue 6.

Vol-3 Issue-6 2017 IJARIIE-ISSN(O)-2395-4396
7042 www.ijariie.com 785
6) Mohi-u-Din Sangmi ,Mohd.Mubasher Hassan (2010), Macroeconomic Variables on Stock Market
Interactions: The Indian Experience, vol 11, issue 3.
7) Rebel A. Cole a Fariborz Moshirian b, Qiongbing Wu (2008), journal Banking &finance, Bank stock
returns and economic growth.
8) Waeibrorheem Waemustafa, Suriani Sukri2 (2016), International Journal of Economics and
Financial Issues, Systematic and Unsystematic Risk Determinants of Liquidity Risk between Islamic
and Conventional Banks, available at http: www.econjournals.com.
9) Yong Tan and Christos Floros, Stock market volatility and bankper formance in China. The current
issue and full text archive of this journal is available at www.emeraldinsight.com/1086-7376.htm.
Annexure 1
S.No Listed Public Sector Banks S.No Listed Private Sector Banks
1. State Bank of India 1. City Union Bank
2. Allahabad Bank 2. Dhanlaxmi Bank
3. Andhra Bank 3. Federal Bank
4. Bank of Baroda 4. Jammu and Kashmir Bank
5. Bank of India 5. Karnataka Bank
6. Bank of Maharashra 6. Karur Vysya Bank
7. Canara Bank 7. South Indian Bank
8. Corporation Bank 8. Axis Bank
9. Dena Bank 9. HDFC Bank
10. Indian Overseas Bank 10. ICICI Bank
11. Oriental Bank of Commerce 11. Indusind Bank
12. Punjab National Bank
Listed Public Sector Banks = 16
Listed Private Sector Banks = 11
Total Sample Banks Chosen = 27
13. Syndicate Bank
14. UCO Bank
15. Union Bank of India
16. Vijaya Bank