a multivariate analysis of fatness and relative fat patterning
TRANSCRIPT

A Multivariate Analysis of Fatness and Relative Fat Patterning
WILLIAM H. MUELLER AND RUSSELL M. REID Center for Demographzc and Population G e n e t m , L’nauerszty of Texas Health Scienre Center, Houston, Texas 77030 and Department of Anthropology, University of Houston, Houston, Texas 77004
KEY WORDS Obesity Genetics . Skinfolds . Pattern analysis . Principal components . Colombia
ABSTRACT Skinfold measurements (triceps, subscapular, suprailiac and medial calf) in four samples (376 boys, 352 girls, 338 men and 380 women from rural Colombia) were subjected to principal components analysis to identify components of obesity and relative fat patterning. Three components emerged which were similar in the four samples: a first component of fatness explaining 70-80% of the variance and two fat pattern components each explaining 10-159/, of the variance: trunk-extremity and upper-lower body. Fatness and the trunk- extremity pattern components changed with age in children (7-12 years), but none of the components changed with age in adults (25-60 + ). The fatter tended to be more patterned in both age groups. Canonical correlation analysis revealed that socioeconomic status was more related to fatness than to pattern- ing. With the exception of brothers, all first degree relatives (sib, parent-off- spring) and spouses were correlated in fatness. Some of the correlations be- tween relatives-usually sibs, but not spouses-were also significant for the pattern components, suggesting a genetic basis for the known stability of this characteristic (Garn, ’55a). Principal components analysis is a useful multi- variate alternative for quantitative studies of anthropometric patterning.
The importance of heredity and environ- ment in human obesity has been approached from two perspectives. The first concerns fat- ness itself measured either by weight for height indices (Hunt, ’721, somatotype (With- ers, ’64) or skinfold thickness (Reynolds, ’51; Garn et al., ’75). The second concerns the rela- tive distribution of fat on the body. Thus, fat patterns have been identified as “girdle,” “Rubens,” “extremity,” “abdominal,” “gy- noid” and the like (Skerlj e t al., ’53; Garn, ’55a; Vague, ’56). A promising analytic meth- od was initiated by Garn (’55a) who standar- dized X-ray measurements of fat on the popu- lation means of various sites. The resulting profile of z-scores for an individual he termed relative fat patterning (RFP). Relative fat patterning is not to be confused with absolute fat patterning (e.g., Edwards, ’51). Little is known about genetidenvironmental causes of
AM. J. PHYS. ANTHROP. (1979) 50; 199-208.
RFP variation, other than i t appears to be sta- ble in the face of nutritional changes, in con- trast t o absolute fatness (Garn, ’55a). Other workers have shown that fat patterning is a risk factor in chronic diseases such as arteri- osclerosis and diabetes (Vague, ’56; Feldman et al., ’69). Knowledge of the genetics of RFP would thus contribute to the epidemiology of chronic disease and possibly obesity itself (Seltzer, ’69).
The analysis of RFP from a genetic-epide- miological perspective presents some chal- lenges. A simple Mendelian approach would be impossible since there are no discrete pattern types. Garn (’55a) found that less than one- fourth of the adult males of his sample could be assigned t o arbitrarily defined patterns. An alternative is quantitative genetic analysis, but here we face the difficulty that fat pat- terning involves the comparison of multiple
199
200 WILLIAM H. MUELLER A N D RUSSELL M. REID
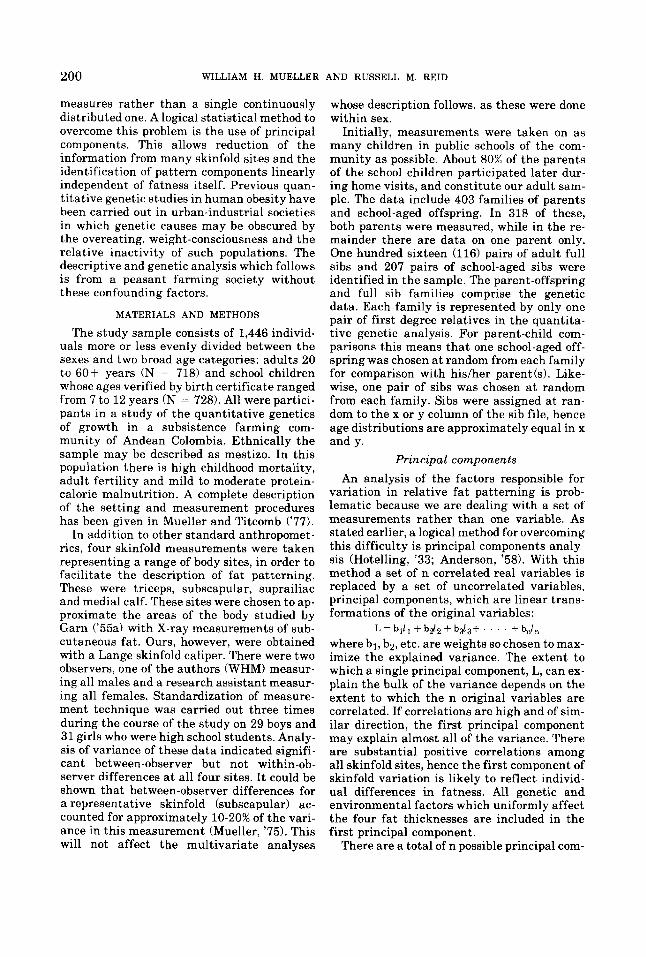
measures rather than a single continuously distributed one. A logical statistical method to overcome this problem is the use of principal components. This allows reduction of the information from many skinfold sites and the identification of pattern components linearly independent of fatness itself. Previous quan- titative genetic studies in human obesity have been carried out in urban-industrial societies in which genetic causes may be obscured by the overeating, weight-consciousness and the relative inactivity of such populations. The descriptive and genetic analysis which follows is from a peasant farming society without these confounding factors.
MATERIALS AND METHODS
The study sample consists of 1,446 individ- uals more or less evenly divided between the sexes and two broad age categories: adults 20 to 60+ years (N = 718) and school children whose ages verified by birth certificate ranged from 7 to 12 years (N = 728). All were partici- pants in a study of the quantitative genetics of growth in a subsistence farming com- munity of Andean Colombia. Ethnically the sample may be described as mestizo. In this population there is high childhood mortality, adult fertility and mild to moderate protein- calorie malnutrition. A complete description of the setting and measurement procedures has been given in Mueller and Titcomb ('77).
In addition to other standard anthropomet- rics, four skinfold measurements were taken representing a range of body sites, in order to facilitate the description of fat patterning. These were triceps, subscapular, suprailiac and medial calf. These sites were chosen to ap- proximate the areas of the body studied by Garn ('%a) with X-ray measurements of sub- cutaneous fat. Ours, however, were obtained with a Lange skinfold caliper. There were two observers, one of the authors (WHM) measur- ing all males and a research assistant measur- ing all females. Standardization of measure- ment technique was carried out three times during the course of the study on 29 boys and 31 girls who were high school students. Analy- sis of variance of these data indicated signifi- cant between-observer but not within-ob- server differences a t all four sites. It could be shown that between-observer differences for a representative skinfold (subscapular) ac- counted for approximately 10-2016 of the vari- ance in this measurement (Mueller, '75). This will not affect the multivariate analyses
whose description follows, as these were done within sex.
Initially, measurements were taken on as many children in public schools of the com- munity as possible. About 80% of the parents of the school children participated later dur- ing home visits, and constitute our adult sam- ple. The data include 403 families of parents and school-aged offspring. In 318 of these, both parents were measured, while in the re- mainder there are data on one parent only. One hundred sixteen (116) pairs of adult full sibs and 207 pairs of school-aged sibs were identified in the sample. The parent-offspring and full sib families comprise the genetic data. Each family is represented by only one pair of first degree relatives in the quantita- tive genetic analysis. For parent-child com- parisons this means that one school-aged off- spring was chosen at random from each family for comparison with h isker parent (9). Like- wise, one pair of sibs was chosen a t random from each family. Sibs were assigned a t ran- dom to the x or y column of the sib file, hence age distributions are approximately equal in x and y.
Principal components An analysis of the factors responsible for
variation in relative fat patterning is prob- lematic because we are dealing with a set of measurements rather than one variable. As stated earlier, a logical method for overcoming this difficulty is principal components analy- sis (Hotelling, '33; Anderson, '58). With this method a set of n correlated real variables is replaced by a set of uncorrelated variables, principal components, which are linear trans- formations of the original variables:
where bl, bz, etc. are weights so chosen to max- imize the explained variance. The extent to which a single principal component, L, can ex- plain the bulk of the variance depends on the extent to which the n original variables are correlated. If correlations are high and of sim- ilar direction, the first principal component may explain almost all of the variance. There are substantial positive correlations among all skinfold sites, hence the first component of skinfold variation is likely to reflect individ- ual differences in fatness. All genetic and environmental factors which uniformly affect the four fat thicknesses are included in the first principal component.
There are a total of n possible principal com-
L bil l + b&2 + b$,+ . . . . + b,Z,

201 MULTIVARIATE ANALYSIS OF FAT PATTERNING
ponents from an analysis of n variables. Sub- sequent components will be uncorrelated with the first and one with another, and each ex- plains less of the multivariate variance than the one preceding it. However, these are likely to explain significant proportions of the vari- ance (say, 5-20%) as individuals differ not only in fatness levels but in the relative distribu- tion of body fat. It is the components subse- quent to the first which are of primary inter- est to us and represent what Garn ('55a) has termed relative fat patterning. While i t is often desirable to rotate components to simpli- fy interpretation, in our analysis we do not, as we wish to preserve the independence from fatness of the pattern components, and pat- tern identification is the main purpose of our analysis. For each component, a score can be computed for each individual based upon the weights obtained from the principal compo- nents analysis. The value of the score for any individual represents the sum of the products of the weights and the z-score (sex-age group specific) pertaining to each site.
One other matter of importance is the way principal components are computed. If one computes the principal components from raw, unstandardized data, results will be biased towards the measurement with the greatest variance (Schull and Neel, '65). The means and variances of different skinfold sites differ substantially. This problem was overcome by simply using a matrix of correlations among the skinfold measurements to compute the principal components.
Canonical correlation Socioeconomic variability among families
in the study could augment the familial corre- lations and make it appear that genetic causes are more important than they actually are. Socioeconomic status (SES) was assessed in our study by means of seven observations ob- tained a t each household. These are: (1) the number of rooms in the house; materials of the (2) roof, (3) walls and (4) floor; (5 ) water and (6) sanitary facilities; and (7) stove type. Each of these exhibited a range of variation ex- pressed in a three point scale except for room number. Thus, for example, roof types were readily classifiable as either (a) straw, (b) tile or (c) composite. The SES variables are not in- cluded as potential causes of fatness but gen- eral indications of a family's affluence. The ef- fect of SES on skinfold thickness and pattern- ing was assessed by canonical correlation of
the four skinfolds with six of the SES varia- bles (stove type was eliminated because it con- tained a majority of missing values) within age and sex groups.
There are three types of correlation analy- sis: (1) product-moment (r) in which a single variable y is related to a single variable x, (2) multiple (R) in which a single variable y is re- lated to multiple variables x,, x2, x3, . . ., x,, and (3) canonical in which a series of measure- ments yl, y2, y3, . . ., yn (e.g., skinfolds) is re- lated to another series of measurements xl, xp, X3, . . ., xk (e.g., SES variables). Clearly, the latter lends itself to exploring the association between fat patterning and socioeconomic factors.
As in the case of principal components, we transform a set of x and y variables which are mutually dependent into new variates which are uncorrelated. Unlike principal compo- nents where the new variables are chosen to maximize the explained variance in a set of measurements, in canonical correlation the new variates are chosen to maximize the cor- relation between them. Thus, for each canoni- cal we produce two new variates:
+ = alyl T aZYZ + 8 3 ~ 3 + . . . + anyn
where alr a2, etc. and bl, bZ, etc. are the weights so chosen to maximize the correlation between $ and p. Just as in principal compo- nents where there may be more than one com- ponent which explains a significant portion of the variance, there may be more than one canonical correlation. Alternatively stated, we first seek the linear combination of skin- fold and SES variables, which has the max- imum correlation. We next seek, among the linear combinations uncorrelated with the first, that combination of skinfold and SES variables which has the maximum correla- tion, and so on. The number of possible canoni- cal correlations is equal to the number of vari- ables in the smaller set (here, 4). Examining the signs and magnitudes of the weights pro- duced by canonical correlation analysis ena- bles one to interpret that component of skin- fold variation (fat thickness or relative fat patterning) which is most dependent on SES.
Skinfold measurements are usually posi- tively skewed. A normal distribution of the data is required for tests of significance. One may log-transform raw data; however, trans- formations will change components of the ge- netic variance, in particular dominance. Thus, instead of transformation, where possible, we
p = blxl + bzxz + b 3 ~ 3 + . . . + bkxk

202 WILLIAM H. MUELLER AND RUSSELL M. REID
TABLE I
Mean triceps and subscapular skinfolds by age and sex in the Colombian sample compared to U.S. White samples
Males Females Age
midpoint Colombia US. Whites ' Colombia U.S. Whites : N xkS .E . x k S.E. N x 2 S . E . xi-S.E.
(years)
Triceps 7.5 8.5 9.5
10.5 11.5
60 90 71 79 76
6.9?0.22 6.5? 0.20 6.6'021 6.9t0.21 6.93-0.20
8 .72 0.16 9.3-to.20
10.4f 0.30 10.55022 11.510.27
66 76 82 61 67
352 30
144 171 35
380
-
- -
9.22 0.35 9.4T0.26 9.2-tO.34 8.950.31
10.720.40
10.8--t0.21 11.82 0.18 12.72 0.28 13.0t0.34 12.920.26
376 5
82 123 87 41
338 -
25 35 45 55 65
8251.75 6.0t0.28 6.O-tO.25 5.91 0.25 5.620.33
13.0 13.7 13.0 12.3 11.7
14.620.97 16.1k0.59 15.220.56 14.12 1.35 -
20.7 22.7 24.0 24.3 23.0
Su hscapular 7.5 8.5 9.5
10.5 11.5
60 90 71 79 76
376 5
82
-
4.520.12 4.620.13 5.0?0.16 5.020.12 5.3k0.14
5.220.12 5.62 0.17 6.320.24 6.520.16 7.3'0.20
66 76 82 61 67
352 30
144 170 35
379
-
- -
5.51 0.18 6.1'0.23 6.120.28 5.9'023 7.120.31
6.210.22 6.92 0.17 7.9-tO.33 8.25 0.33 8.6% 0.29
25 35 45 55 65
10.7&1.18 9.920.50
10.420.47 10.2+0.51 9.22 0.68
14.7 15.7 15.7 15.3 14.3
18.72 1.61 20.020.84 19.4?0.79 18.72 1.92
-
15.3 17.7 20.0 22.0 19.7
123 87 41
338 -
I US. White children from Johnaton e t al. ('721. Adult data are from Stoudt et al. ('70) for which standard errors ulere not pre- sented. However, these must be comparable to thoae of the child sample as each age group contained hundreds of subjects.
TABLE 2
Principal components o f skinfold thickness in a rural Colombian population with the percent o f the uariation accounted for by each component
Principal components Eigenvector
1 2 3 4 1 2 3 4
Children Triceps Subscapular Suprailiac Medial calf
Eigenvalue Percent of
variation explained
Triceps Subscapular Suprailiac Medial calf
Adults
Eigenvalue Percent of
variation explained
0.87 0.84 0.81 0.76 2.71
Males (N = 376) 0.13 -0.28 -0.39
-0.31 -0.30 0.32 -0.37 0.44 -0.10
0.59 0.18 0.19 0.61 0.39 0.28
Females (N = 352) 0.85 0.18 -0.49 0.89 -0.30 0.04 0.86 -0.37 0.18 0.77 0.56 0.30 2.86 0.57 0.36
0.07 - 0.34
0.29 - 0.01
0.21
67.60 15.10 9.80 7.50 71.50 14.20 9.10
Females (N = 379) 0.92 0.19 -0.31 0.92 -0.25 -0.11 0.89 -0.36 0.19 0.87 0.43 0.24 3.22 0.42 0.20
5.10
Males (N = 336) -0.02 -0.44 0.19 -0.19 -0.05 -0.36 -0.31 0.35 0.19
0.56 0.17 -0.01 0.45 0.35 0.21
0.88 0.91 0.86 0.81 3.00
0.17 -0.29
0.20 -0.07
0.16
75.00 11.20 8.70 5.20 80.50 10.50 5.00 3.90

MULTIVARIATE ANALYSIS OF FAT PATTERNING 203
1 .o 1 I
.5-
C h i l d A d u l t m f m f
t r i c e p s 0 8 0 0 s u b s c a p u l a r E
s u p r a i l i a c a A A A m e d i a l calf 0 0 0
2
“Q
@ @ 0
0
I I , I I I I 1 I I J J
-2; 0 .5 -.5 0 .5 Fig. 1 Plot of the first three principal components in the four age-sex groups based on the values given in
table 2. For all four skinfold sites the four age-sex groups cluster closely together.
use non-parametric in combination with parametric methods (Kendall’s tau in familial correlations).
RESULTS
The age-sex distribution of the sample along with mean triceps and subscapular skinfolds is shown in table 1 and compared to data on U.S. whites. At most ages the Colombians are leaner than the Americans. In Colombian children there is little change in skinfold thickness from 7 to 12 years of age except in girls 10.5 to 11.5 years of age. In contrast, skinfolds of U.S. white children increase regu- larly over this age range. Changes in adult skinfold thickness with age in Colombian adults were insignificant. The seemingly non- linear trend in Colombian female adults with a gain up to age 35 and a loss thereafter, was also insignificant.
Principal components analysis of skinfold measurements by sex and age group is shown in table 2, and the first three components are plotted in figure 1 for the four sex-age groups. The first component correlates uniformly with all skinfolds, hence we may term it “fat- ness.” This component accounts for from 70- 80% of the variation. The second and third components are pattern components. The sec- ond component contrasts extremity and trunk fat, and it accounts for from 10-15% of the var- iance. The third component seems to contrast lower from upper body fat and accounts for from 5-10% of the variance. The pattern com- ponents are remarkably similar in all four sex- age groups (fig. 1). The fourth component is trivial.
I t is of interest to ask to what extent these components depend on age and socioeconomic status, and whether patterning itself depends
TA
BL
E 3
Can
onic
al c
orre
latio
ns r
elat
ing
skin
fold
mea
sure
men
ts a
nd s
ocio
econ
omic
var
iabl
es i
n a
rura
l C
olom
bian
pop
ulat
ion
Chi
ldre
n A
dult
s
Mal
es (
N =
318)
Fsm
ales
(N
= 2
93)
Can
onic
al v
aria
tes
Can
onic
al v
aria
tes
Can
onic
al v
aria
tes
Mal
es (
N =
331
) Fe
mal
es (
N =
376
1
Can
onic
al v
aria
tes
1 2
3 4
1 2
3 4
1 2
3 4
1 2
3 4
SES v
aria
bles
R
oom
s Fl
oor
Wal
l R
oof
Wat
er
Sani
tary
Sk
info
lds
Tri
ceps
Su
bsca
pula
r Su
prai
liac
Med
ial c
alf
corr
elat
ion =
Can
onic
al
Chi
-squ
are =
df=
0.38
-0
.72
0.55
-0
.06
0.06
-0
.69
0.13
-0
.31
-0.5
7 0.
34
0.61
0.
72
-0.0
2 -0
.54
0.15
0.
59
0.75
-0
.29
0.07
-0
.88
0.87
0.
64
1.14
-0
.34
0.19
-0
.90
-0.8
8 0.
28
0.42
0.
48
0.30
0.
18
0.09
42.2
4 '
13.7
3 2.
89
24
15
8
0.55
--
0.21
-
0.40
--
0.51
-0
.42
0.65
- 0.
83
-0.5
9 0.
56
1.07
0.03
0.36
3
-0.1
4 -0
.72
0.73
-0
.27
0.21
0.
41
0.65
0.
39
0.36
0.
36
0.30
-0
.44
-0.9
7 -0
.30
0.21
-0
.26
0.82
0.
17
-0.3
4 -0
.09
0.50
-0
.17
0.07
-0
.79
0.12
0.
30
0.14
-0
.16
0.93
0.
50
0.09
-0
.95
0.39
-0
.87
-0.4
1 0.
31
-0.7
5 -1
.11
1.1
1
0.94
0.
44
1.34
-0
.04
-1.0
3 0.
30
0.33
0.
23
0.94
0.
76
0.14
0.31
0.
22
0.09
0.
08
0.42
48.7
9 I
19.0
8 4.
21
1.67
72
.81 '
14
15
8
3 24
-0.9
1 0.
55
0.19
0.
07
0.67
- 0
.49
0.53
-0
.27
-0.8
3 1.
01
0.15
9.82
15
-0.5
1 -0
.71
0.34
0.
41
-0.0
9 0.
73
0.12
- 1
.48
1.28
0.
41
0.08
2.30
8
- 0
.33
0.74
0.41
-0
.70
0.51
- 0.
72
- 1
.44
0.47
-0
.13
0.77
0.04
0.43
3
0.23
0.
99
-0.1
2 0.
08
-0.5
8 0.
65
-0.0
8 -0
.31
-1.0
8 0.
18
0.41
0.
26
0.33
-0
.05
0.59
0.
57
-0.3
0 -0
.47
0.03
-1
.72
1.23
0.
10
1.52
-1
.22
-0.0
7 -0
.44
-0.4
9 0.
95
0.38
0.
19
0.51
0.
20
0.09
131.
88'
18.1
8 2.
83
24
15
8
- 0
.59
- 0.
60
- 0
.06
0.76
0.
40
0.09
- 1
.44
- 0
.56
0.41
1.
31
0.01
0.08
3
lp <
0.01.

MULTIVARIATE ANALYSIS OF FAT PATTERNING 205
TABLE 4
Familial correlations in the first three principal components of skinfold variation in a Colombian population Product-moment correlations except in relationships involving growing children, in which
case correlations are partials with child's age held ronstant
Principal cornponentri
Component correlation of
1 2 3 trunk^ Upper.
N Fatness extremity lower
Spouse Father-school aged son Father-school aged daughter Mother-school aged son Mother-school aged daughter Father-child Mother-child Siblings 7.00-11.99 years Sister-sister Brother-brother Sister-brother Combined sib Adult siblings Sister-sister Brother-brother Sister-brother Combined sib
313 157 132 169 149 289 318
46 59
102 207
33 32 50
115
0.26' 0.18' 0.22' 0.26' 0.36' 0.20' 0.31'
0.54' 0.21 0.45' 0.41'
0.68' 0.11 0.11 0.30'
0.05 0.15' 0.02 0.14 0.19' 0.09 0.17'
0.02 0.422 0.20' 0.23'
- 0.26 0.44' 0.04 0.07
0.07 ~ 0.12 - 0.04
0.05 0.1 1
- 0.08 0.08
- 0.06 0.16 0.00 0.03
0.31 0.50' 0.32' 0.37*
' p < 0.05. p p < 0.01.
on the degree of fatness. In children the first principal component (fatness) increases with age (r = 0.12, boys, N = 376; r = 0.20, girls, N = 352; p < 0.01). Older boys had relatively more fat on the trunk and upper body than younger boys in this age range (r = -0.21, for trunk-extremity, and r = - 0.14, upper-lower components (N = 376, p < 0.01)). Pattern components of girls did not change signifi- cantly with age. None of the principal com- ponents of adult skinfold measurements changed systematically with age.
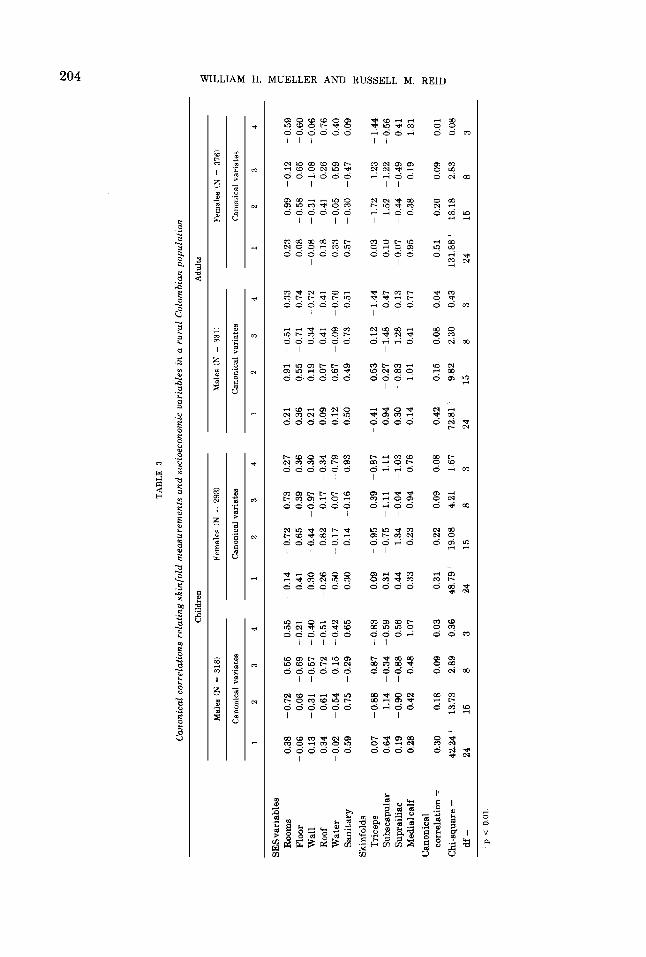
Canonical correlations between SES and skinfold measurements are shown in table 3. These were computed from a correlation ma- trix which is tantamount to standardizing each of the measurements separately. Only the first canonical correlation is significant in each sex-age group. The correlations reveal that adult female skinfolds are more depen- dent on socioeconomic status (0.51) than adult males (0.42) and children of both sexes (-0.30). Concentrating on the signs of the canonical variates of the first canonical corre- lation, in none of the four groups do these signs with respect to the skinfold set conform to the pattern of loadings identified in table 2 as relative fat patterning components. For children the loadings are all positive suggest-
ing a socioeconomic effect on levels of fatness rather than fat patterning.
Garn ('55a) found some association of pat- tern intensity (fat variability around an indi- vidual's mean standard score) with obesity. To test whether fatter individuals had more in- tense relative fat patterning, we transformed the component scores for the trunk-extremity and upper-lower patterns to absolute values (sign ignored). Thus, individuals with very small values of the pattern so transformed would have z-scores which vary little from site to site, while those with very large values would, for example, have a majority of fat con- centrated either on the trunk or the ex- tremities, and so on. The association of pat- tern intensity so defined with the first compo- nent (fatness) was significant (p < 0.01) in all age-sex categories and for both of the relative patterns (Spearman's rho ranged from 0.28 t o 0.51 in adults and from 0.21 to 0.28 in children with N's as in table 2) . Thus. the more obese are more patterned.
Familial correlations for the first three principal components are shown in table 4. Correlations are Pearson's r's except where growing children are involved in which case correlations are partials in which age is held constant. Kendall's tau correlations were sim-

206 WILLIAM H. MUELLER
ilarly significant. Perhaps it is not surprising that most of the statistically significant familial correlations fall under the first prin- cipal component, as this component explains the largest proportion of variance. Spouses are correlated in fatness (Component No. 1) but not relative fat patterning. Likewise, parents and children resemble one another in fatness but very little in patterning. Mother-child cor- relations are somewhat higher overall than father-child correlations. Turning to the sib- ling correlations, sisters are significantly cor- related in fatness (Component No. 11, but not patterning. In contrast, brothers resemble one another in patterns, not fatness. This appears to be the case whether siblings are adults or are still growing. There is less consistency in the correlations of brothers and sisters. Grow- ing brothers and sisters are correlated in fat- ness and trunk-extremity patterning, but adult brothers and sisters are correlated in upper-lower patterning only. On combining parent-child and sib correlations, the only ones significantly heterogeneous were the adult sib correlations for fatness ( x L = 11.12, df = 2, p < 0.01) and trunk-extremity pat- terning ( x L = 8.12, df = 2, p < 0.05).
DISCUSSION
Ours is not the first multivariate analysis of skinfold measurements (Hammond, '55; Hunt. '61). However, others using the tech- nique of factor analysis have concentrated on the first factor in order to identify the skinfold site which best correlates with overall fatness. We have gone beyond the first component to identify patterns independent of fatness. Garn ('55b) has noted that an ideal measure of patterning should contain information on both pattern type and intensity. The compo- nent scores from a principal components anal- ysis provide both kinds of data in a single score which like any other continuously distributed variate may be used in a quantitative genetic analysis.
The two components of fat patterning (trunk-extremity and upper-lower) are essen- tially the same in all four sex and age groups. Although the four groups are not strictly inde- pendent, the probability that the same compo- nents could appear in four samples by chance alone must be very small. Hence, there can be little doubt as to the statistical significance of the components of relative fat patterning even though these components together ac-
AND RUSSELL M. REID
count for only 25% of skinfold variation. The association of patterning with obesity, socio- economic status and age provide some clues as to the biological meaning of the pattern com- ponents.
Older boys in the age range 7 to 12 years are more developed in the pattern characteristic of adult males (trunk and upper body) than younger boys. This suggests that even before the pronounced sexual dimorphism in stature, sex differences in fat patterning are emerg- ing.
Pattern intensity is associated with obesity. This may simply reflect a greater opportunity for patterning in the obese. Whether obesity leads to more intense patterning or whether the more patterned are at risk for obesity could only be answered by longitudinal data.
Familial correlations in the components of skinfold variation in this sample are not easily interpreted. With respect to the pattern com- ponents (trunk-extremity and upper-lower), the familial correlations may lead to some in- teresting speculations. However, i t may be risky to make too much of them, because the first principal component explains so much of the variance. With this caution in mind we may make the following observations and gen- eralizations. Spouse, parent-child and sibling correlations in the first component resemble those presented elsewhere for the individual skinfold sites (Mueller and Titcomb, '77; Mueller, '77). Fatness is more dependent on the immediate environment than is pattern- ing, since spouses are correlated in the first component only. The average difference be- tween marriage age and present age is 19.7 * SD 7.6, a substantial cohabitation time in this sample. The canonical variates relating skin- folds to SES do not resemble the fat pattern- ing components. Indeed, in children the load- ings are uniform in sign across skinfold sites supporting the idea that fatness rather than patterning is related to socioeconomic status. Similarly, Garn ('55a) found fatness more dependent on environmental change than the relative fat pattern.
There is a sex dependency in the pattern of familial correlations; female relatives resem- ble one another in fatness but little in either of the components of patterning, while male relatives are more alike in patterning. This appears to be the case whether or not related pairs in question are currently living in the same household. This is not to say that only

207 MULTIVARIATE ANALYSIS OF FAT PATTERNING
male relatives are similar in fat patterning. Mothers and daughters and brother-sister pairs in both age groups are significantly cor- related in one of the pattern components. Moreover, adult sibs are significantly corre- lated in upper-lower patterning with correla- tion coefficients homogeneous among sib pair- ings by sex.
Since fatness is more dependent on the im- mediate environment (correlations are high- est between family members currently living together) and since adult female skinfolds ap- pear t o depend to a greater extent on SES than do male skinfolds (table 31, an environmental component in correlations between female rel- atives in the principal components cannot be discounted. It is conceivable that the source of such a correlation in adult sisters (who are married and living in separate households) could be the different sex roles in this society, in which nutrition and sanitation are the re- sponsibility of women. Practices learned early in life could be carried over into adulthood. Unfortunately, cultural data which could clarify this point are not available at present.
Another explanation for the sex-specific pattern of familial correlations in this sample is sex limitation, genetic, environmental or both. Either genes affecting fat development produce different phenotypic effects in the two sexes, or males and females respond dif- ferently to early environmental influences. Sex linkage of fatness genes is not indicated in the pattern of familial correlations. A strong sex dependency has not been identified in other studies on the genetics of fattening (Garn et al., '75). But other studies have been of urban-industrial societies, very different from the one studied here. Some degree of maternal effect (common intrauterine or ear- ly postnatal environment) is evident in fat- ness and trunk-extremity patterning as the mother-child and growing sib correlations are somewhat higher than those of other pairings. But similarity of adult sibs in upper-lower fat patterning is not easily ascribable to environ- mental correlations, as neither spouse, parent- child nor young sib correlations are signifi- cant. Garn ('55a) has observed that relative fat patterning is a stable or individual charac- teristic in contrast to fatness. We have evi- dence here that a t least part of this stability has a genetic basis. We still need to know how fat patterning develops from birth t o ma- turity, and i t would be useful to compare adult
offspring with their parents (ours are of school age) and investigate the influences of exer- cise, occupation and other environmental fac- tors in the development of RFP.
ACKNOWLEDGMENTS
We would like to thank Doctors W. J. Schull and Ranajit Chakraborty for helpful discus- sions. Support for this research came from a Heart and Lung Institute Grant HL-05255-02.
LITERATURE CITED Anderson, T. W. 1958 An Introduction to Multivariate
Statistical Analysis. John Wiley and Sons, New York. Edwards, D. A. W. 1951 Differences in the distribution
of subcutaneous fat with sex and maturity. Clin. Sci., 10: 305-315.
Feldman, R., A. V. Sender and A. B. Siegelaub 1969 Dif- ference in diabetic and nondiabetic fat distribution pat- terns by skinfold measurements. Diabetes, 18: 478-486.
Garn, S. M. 1955a Relative fat patterning: An individ- ual characteristic. Hum. Biol., 27: 75-89.
19551, Application of pattern analysis to anthro- pometric data. Ann. N.Y. Acad. Sci., 63: 537-552.
Garn, S. M., D. C. Clark and B. M. Ullman 1975 Does human obesity have a genetic basis? Ecol. Food Nutr., 4: 57-59.
Hammond, W. H. 1955 Measurement and interpretation of subcutaneous fat, with norms for children and young adult males. Brit. J. Prev. Soc. Med., 9: 201-211.
Hotelling, H. 1933 Analysis of a complex of statistical variables into principal components. J. Educ. Psychol.,
Hunt, E. E. 1961 Measures of adiposity and muscularity in man: Some comparisons by factor analysis. In: Tech- niques for Measuring Body Composition. J. Brozek and A. Henschel, eds. National Academy of Science-National Re- search Council, Washington, D.C., pp. 192-211.
1972 Epidemiologic considerations. Adv. Psy- chosom. Med., 7: 148-172.
Johnston, F. E., P. V. V. Hamill and S. Lemeshow 1972 Skinfold thickness of children 6-11 years, United States. Vital and Health Statistics, Data from the National Health Survey, Series 11, No. 120. U. S. Department of Health, Education and Welfare, Rockville, Maryland.
Mueller, W. H. 1975 Parent-child and Sibling Correla- tions and Heritability of Body Measurments in a Rural Colombian Population. Ph.D. dissertation, University of Texas, Austin.
Sibling correlations in growth and adult morphology in a rural Colombian population. Ann. Hum. Biol., 4: 133-142.
Mueller, W. H., and M. Titcomb 1977 Genetic and environ- mental determinants of growth of school-aged children in a rural Colombian population. Ann. Hum. Eiol., 4: 1-15.
Reynolds, E. J. 1951 The distribution of subcutaneous fat in childhood and adolescence. Monog. SOC. Res. Child Develop., Vol. 15, Series No. 50.
Schull, W. J., and J. V. Nee1 1965 The Effects of Inbreeding on Japanese Children. Harper and Row, New York.
Seltzer, C. C. 1969 Genetics and obesity. Third Interna- tional Meeting of Endocrinologists, Marseilles, 1968. In: Physiopathology of Adipose Tissue. J. Vague, ed. Ex- cerpta Medica Foundation, Amsterdam, pp. 325-334.
Skerlj, B., J. Brozek and E. E. Hunt 1953 Subcutaneous fat
24: 417-441, 498-520.
1977

208 WILLIAM H. MUELLER A N D RUSSELL M. REID
and age changes in body build and body form in women. Health, Education and Welfare, Rockville, Maryland. Am. J. Phys. Anthrop., 11: 577-600. Vague, J. 1956 The degree of masculine differentiation
Stoudt, H. W., A. Damon and R. A. McFarland 1970 Skin- of obesities: A factor determining predisposition to folds, body girths, biacromial diameter and selected an- diabetes, atherosclerosis, gout, and uric calculous disease. thropometric indices of adults, United States, 1960-1962. Am. J. Clin. Nutr., 4: 20-34. Vital and Health Statistics, Data from the National Withers, R. F. J. 1964 Problems in the genetics of Health Survey, Series 11, No. 35. US. Department of human obesity. Eugen. Rev., 56: 81-90.