a molecular assessment of northeast paciï¬c alaria species
TRANSCRIPT

www.elsevier.com/locate/ympev
Molecular Phylogenetics and Evolution 44 (2007) 634–648
A molecular assessment of northeast Pacific Alaria species(Laminariales, Phaeophyceae) with reference
to the utility of DNA barcoding
Christopher E. Lane a,*, Sandra C. Lindstrom b, Gary W. Saunders a
a Centre for Environmental and Molecular Algal Research, Department of Biology, University of New Brunswick, Fredericton, NB, Canada E3B 6E1b Department of Botany, #3529-6270 University Building, University of British Columbia, Vancouver, BC, Canada V6T 1Z4
Received 21 August 2006; revised 2 February 2007; accepted 16 March 2007Available online 4 April 2007
Abstract
Despite their relatively complex morphologies, species in the genus Alaria Greville are notoriously difficult to identify with certainty.Morphological characters, often influenced by environmental factors, make individuals in similar habitats artificially appear related. Spe-cies identification would, therefore, benefit greatly from the application of molecular tools. We applied DNA barcoding, using the 50 endof the cytochrome c oxidase I (coxI-50) gene from the mitochondrial genome, to define species limits and relationships in northeast Pacificpopulations of Alaria. This emerging technique is being employed to catalogue species diversity worldwide, particularly among animals,and it has been shown to be sensitive enough to discriminate between closely related species. However, the utility of this marker for iden-tifying or categorizing the majority of life remains unclear. We compared the resolution obtained with this marker to two other molecularsystems commonly used in algal research: the nuclear internal transcribed spacer (ITS) of the ribosomal cistron, and the plastid Rubiscooperon spacer (rbcSp). In agreement with previous results, Alaria fistulosa Postels & Ruprecht, with its distinct morphological, ecologicaland molecular features, stands apart from the other species in the genus and we establish Druehlia gen. nov. to accommodate it. For theremaining isolates, distinct mitochondrial haplotypes resolved with the barcode data indicate a period of genetic isolation for at leastthree incipient species in the northeast Pacific, whereas unexpected levels and patterns of ITS variation, as well as the extreme morpho-logical plasticity found among these isolates, have most probably resulted from a recent collapse in species barriers. The cloning of ITSamplicons revealed multiple ITS copies in several individuals, further supporting this hypothesis.� 2007 Published by Elsevier Inc.
Keywords: Alaria; Druehlia; coxI-50; DNA barcode; ITS; Pacific; Rubisco spacer
1. Introduction
Alaria Greville is a common brown seaweed in the coldtemperate regions of the Northern Hemisphere where it canbe found in the intertidal and subtidal. Alaria is the secondlargest genus in the Laminariales and the type of the Alar-iaceae, one of the four ‘‘derived’’ families within this order(Lane et al., 2006). There are currently 12 recognized spe-
1055-7903/$ - see front matter � 2007 Published by Elsevier Inc.
doi:10.1016/j.ympev.2007.03.016
* Corresponding author. Present address: Dalhousie University, Depart-ment of Biochemistry and Molecular biology, 5850 College street, Halifax,NS., Canada B3H 1X5. Fax: +1 902 494 2536.
E-mail address: [email protected] (C.E. Lane).
cies (Kraan et al., 2001; Luning, 1990; Widdowson,1971a), but 108 specific and subspecific names have beenapplied to members of this genus (Widdowson, 1971a)since it was described (Greville, 1830). The morphologicalplasticity common to the kelp has caused considerable tax-onomic confusion within Alaria despite comprehensivemonographs (Widdowson, 1971a; Yendo, 1919), includinga statistical attempt to quantify morphological variation inthe genus (Widdowson, 1971b).
Widdowson’s monograph (1971a) is the most compre-hensive treatment of Alaria and includes extensive geo-graphic distribution records, as well as a taxonomic keyto the 14 species recognized by him, 11 in the North Pacific

C.E. Lane et al. / Molecular Phylogenetics and Evolution 44 (2007) 634–648 635
and three reported from both the North Atlantic and Paci-fic [A. pylaii (Bory) Greville and A. grandifolia J. Agardhhave since been synonymized with A. esculenta, see below].However, the difficulty of actually applying species con-cepts to specimens in the field was described as follows:‘‘With the exception of Alaria fistulosa, all the species varyin all their taxonomically important characteristics’’, and‘‘. . .much of this variation appears to be caused by environ-mental factors, so that different species growing in a similarhabitat resemble each other more than do populations ofthe same species growing in different habitats’’ (Widdow-son, 1971a, p. 45).
The only species of Alaria still recognized in the AtlanticOcean is A. esculenta, which has an extensive circumpolardistribution and the largest reported geographic range ofany species in the genus (Widdowson, 1971a). Populationsof A. esculenta can be found as far south as northern Japanin the Pacific, and France and New England in the easternand western Atlantic, respectively. The other Atlantic spe-cies recognized in Widdowson’s monograph, A. grandifolia
and A. pylaii, are now considered forms of A. esculenta
(Luning, 1990). Subsequently, Kraan et al. (2001) sup-ported Luning’s opinion using hybridization studies andDNA sequences from the Rubisco spacer (rbcSp) to showthat A. esculenta and A. grandifolia are conspecific. Thus,A. esculenta is the only representative of the genus in theNorth Atlantic, whereas 12 species (including A. esculenta)are still recognized in the North Pacific.
The taxonomy and number of Alaria species in the Paci-fic has also been questioned. Widdowson (1971a) foundcommon misidentifications among herbarium specimensof the poorly defined species A. angustata Kjellman, A.
crassifolia Kjellman and A. praelonga Kjellman. Addition-ally, Widdowson reported that intermediate forms of A.
marginata Postels & Ruprecht and A. tenuifolia Setchellwere common along the coast of southern British Colum-bia. More recently, in their flora of the CommanderIslands, Selivanova and Zhigadlova (1997) rejected therecord of A. esculenta from there without explicitly statingtheir reason for doing so, but records from other northwestPacific locations cited by Widdowson (1971a) have yet tobe verified, namely Saghalien, the Okhotsk Sea coast ofKamchatka, and the Kurile Islands.
Confusion over species boundaries and evolutionaryrelationships within Alaria, combined with extensive mor-phological plasticity, prompted us to employ a molecularapproach to investigating the systematics of this genus.DNA barcoding is an emerging tool aimed at cataloguingthe diversity of life (Hebert et al., 2003a) using the 50 endof the mitochondrial gene encoding cytochrome c oxidaseI (coxI-50). Proponents of DNA barcoding suggest that thisshort region of nucleotide sequence will allow scientists toidentify, quickly and inexpensively, species with a high levelof accuracy (Hebert et al., 2003a). However, while DNAbarcoding has been used to resolve systematic issues in ani-mals (Hogg and Hebert, 2004; Remigio and Hebert, 2003),this method remains untested for the majority of lineages
on the tree of life. In a recent study, Saunders (2005) estab-lished the utility of this system for florideophyte red algae,but other algal groups have not been investigated.
Alaria is an excellent test case for barcoding in brownalgae because there is an established morphology-basedsystematic scheme for Alaria species, but plasticity andmorphological convergence appear to be rampant in thisgenus. If we can resolve distinct molecular groups withinAlaria we can use this information to re-examine taxonom-ically important morphological characters to determine ifmorphology can be used to separate species of Alaria.Commonly used intraspecific gene systems from thenucleus [internal transcribed spacer of the ribosomal cis-tron (ITS)] and chloroplast (rbcSp) were also used to takeadvantage of published sequences and for comparisonagainst results obtained from coxI-50 data.
2. Methods
2.1. Sample collection and identification
Samples were collected (Table 1) and identified in thefield using the dichotomous key in Widdowson (1971a),then pressed for herbarium vouchers (deposited in UBCand UNB). A portion of each thallus was dried on silicagel in the field. Dried material was ground under liquidnitrogen in the lab with a cold mortar and pestle and storedat �20 �C.
2.2. DNA extraction through sequencing
DNA was extracted from 54 samples of Alaria accord-ing to the protocol of Lane et al. (2006). OligonucleotidePCR and sequencing primers for the ITS and rbcSp(KR3-KR4), as well as amplification profiles, followedLane et al. (2006). Two brown algal mitochondrial gen-omes (Oudot-Le Secq et al., 2001; Oudot-Le Secq et al.,2002) were used to design primers for amplification andsequencing of the coxI-50 barcoding region. They werethe forward primer GazF2 (50 CCAACCAYAAAGATATWGGTAC 30) and reverse primer GazR2 (50 GGATGACCAAARAACCAAAA 30). The thermal profile forPCR amplification of the coxI-50 region included: an initialdenaturation cycle of 94.0 �C for four minutes, followed by38 cycles of 94.0 �C for one minute, 50.0 �C for 30 s and72.0 �C for one minute. A final extension step was per-formed at 72.0 �C for seven minutes followed by storageat 4.0 �C until the samples were processed. PCR productswere purified and sequenced as outlined in Lane et al.(2006). For seven isolates (Anana1749, Amar9797,Ataen10759, Atenu11487, Amar031501, Atenu9790 andAesc9803), the ITS PCR products were cloned using theTopo TA Cloning� Kit (Invitrogen, Carlsbad, CA, USA)according to the manufacturer’s protocol. Four to eightclones were sequenced per isolate using the CEQ Dye Ter-minator Cycle Sequencing (DTCS) kit (Beckman Coulter,

Table 1Collection locations or reference, and GenBank numbers for species used in this study
Morphological identification Location rbcSp ITS coxI-50
Alaria crassifolia KjellmanAcras Kraan and Guiry (2000) AF109802 — —Acras Yoon et al. (2001) AF318957 AF319001 —
A. crispa KjellmanAcrispa1 St. Lawrence Isl., Alaska EF218947 EF218904 EF218901
A. esculenta (Linnaeus) GrevilleAesc032601 Mullaghmore Head, Ireland EF218953 EF218910 EF218859Aesc033102 Cape Hat, Baffin Island, NVT, Canada EF218950 EF218907 EF218856Aesc9804 Prospect Pt., Resolute Bay, Cornwallis Isl., NVT, Canada EF218949 EF218906 EF218857Aesc9803 Prospect Pt. EF218957 EF218929 EF218879Aesc1253 Grand Manan Isl., NB, Canada EF218952 EF218908 EF218858Aesc002 Perce, Quebec, Canada EF218951 EF218909 EF218860Aesc(AF318958) Yoon et al. (2001) AF318958 — —Agrand(AF177175) Kraan and Guiry (2000) AF177175 — —
A. fistulosa Postels & RuprechtAfist9805 Seldovia Point, Cook Inlet, AK, USA AY851536 AY857878 EF218854Afist11481 Akutan Harbor, Akutan Isl., Alaska EF218946 EF218903 EF218855
A. marginata Postels & RuprechtAmar01SR Seal Rock, OR, USA EF218958 EF218911 EF218890Amar02SR Seal Rock EF218959 ND NDAmar03SR Seal Rock ND ND EF218891Amar01KP Bamfield, Vancouver Isl., BC, Canada ND EF218913 EF218896Amar031501 Port Hardy, Vancouver Isl., BC, Canada EF218954 EF218922 EF218867Amar031503 Port Hardy EF218967 EF218923 EF218868Amar031601 Palmerston Rec. Area, NW Vancouver Isl. EF218962 EF218914 EF218899Amar031901 Rennell Sound, Queen Charlotte Isl., BC, Canada EF218963 ND EF218893Amar0409002 Bamfield EF218968 EF218912 EF218894Amar9794 Knoll Head, Cook Inlet, Alaska EF218985 EF218915 EF218892Amar9796 Gull Isl. Kachemak Bay, Alaska EF218966 EF218917 EF218870Amar9797 Gull Isl. EF218955 EF218918 EF218869Amar9799 Sunshine Cove, Alaska ND EF218933 EF218875Amar9800 Sunshine Cove EF218964 EF218935 EF218880Amar10037 Port Dick, Kenai Peninsula, Alaska EF218956 ND EF218895
A. nana SchraderAnana1107 Bamfield EF218974 ND EF218897Anana1171 Bamfield EF218969 EF218916 EF218872Anana1749 Bamfield EF218971 EF218921 EF218898Anana1750 Bamfield EF218972 EF218920 EF218873Anana031401 Bamfield ND EF218934 EF218871Anana040801 Palmerston Rec. Area EF218973 EF218919 EF218900Anana11570 Akutan Point, Akutan Isl., Alaska EF218970 EF218936 EF218888
A. praelonga KjellmanAprae7 Hokkaido, Japan EF218948 EF218905 EF218902Aprae319004 Yoon et al. (2001) — AF319004 —Aprae Kraan and Guiry (2000) AF109801 — —Aprae Yoon and Boo (1999) AF318960 — —
A. taeniata KjellmanAtaen031701 Rennell Sound ND EF218928 EF218877Ataen9795 Seldovia Point EF218960 EF218940 EF218861Ataen9801 Bainbridge Bight, Alaska ND EF218925 EF218876Ataen9802 Bainbridge Bight EF218979 EF218926 EF218874Ataen9806 Scott Isl., Cook Inlet, Alaska ND EF218937 EF218886Ataen9974 Turtle Reef, Cook Inlet, Alaska ND EF218938 EF218889Ataen10292 Katmai Bay, Alaska Peninsula, Alaska EF218980 EF218939 EF218864Ataen10350 Amalik Bay, Alaska ND EF218942 EF218863Ataen10488 Katmai Bay EF218961 EF218943 EF218866Ataen10759 Kiukpalik Isl., Alaska EF218986 EF218941 EF218881Ataen11176 Nanwallek Reef, Cook Inlet, Alaska EF218977 EF218945 EF218862Ataen11583 Akutan Harbor EF218976 EF218944 EF218865
636 C.E. Lane et al. / Molecular Phylogenetics and Evolution 44 (2007) 634–648

Table 1 (continued)
Morphological identification Location rbcSp ITS coxI-50
A. tenuifolia SetchellAtenu9790 Shrine Isl., Alaska EF218984 EF218930 EF218882Atenu9791 Shrine Isl. EF218983 ND EF218883Atenu9792 Pt. Louisa, Alaska EF218981 EF218931 EF218884Atenu9793 Pt. Louisa EF218982 EF218932 EF218885Atenu9967 Shaman Isl. Alaska EF218978 EF218927 EF218878Atenu11487 Akutan Harbor EF218975 EF218924 EF218887
Agarum clathratum Dumortier Grand Mannan Is., N.B., Canada ND AY857880 EF218850
Laminaria digitata Kjellman Green Pt., Lepreau, N.B., Canada ND AY857886 NDLaminaria digitata Oudot-Le Secq et al. (2002) — — AJ344328
Lessonia corrugata Lucas Gov. Is. Reserve, Tas., Australia ND AY857902 EF218848
Lessoniopsis littoralis (Farlow and Setchell) Reinke Frank Island, Uculet, BC, Canada ND AY857874 EF218851
Pelagophycus porra (Leman) Setchell San Diego, CA, USA ND ND EF218849Pelagophycus porra Yoon et al. (2001) — AF319039 —
Pleurophycus gardneri Setchell & Saunders Whiffen Spit, Sooke, BC, Canada — AY857876 —Pleurophycus gardneri Pachena Beach, Bamfield AY851534 — EF218852
Pterygophora californica Ruprecht Cape Beale, Bamfield AY851539 AY857875 ND
Saccharina lattisima (L.) C.E. Lane, C. Mayes,Druehl and G.W. Saunders
Green Pt. ND AY857893 ND
S. lattisima Hannafore Point, Looe, Cornwall, England ND ND EF218847
Saccharina sessile (C. Agardh) C.E. Lane, C. Mayes,Druehl and G. W. Saunders
Whiffen Spit, Sooke, BC, Canada ND ND EF218846
Undaria pinnatifida (Harvey) Suringar l’Etang de Thau, France AY851535 AY857873 EF218853
Data reported on the same line are from the same isolate. Entries in plain type were completed in this study, whereas those in bold were previouslypublished. Cells with (—) indicate no data were available in GenBank for that gene from that particular isolate, whereas ND indicates sequences that werenot determined in this study.
C.E. Lane et al. / Molecular Phylogenetics and Evolution 44 (2007) 634–648 637
Inc., Fullerton, CA, USA) on a Beckman CoulterCEQ8000.
2.3. Data analyses
Overlapping complementary fragments were edited andaligned in Sequencher� v 4.2 (Gene Codes Corporation,Ann Arbor, MI, USA), and multiple sequence alignmentswere constructed with MacClade 4.06 (Maddison andMaddison, 2003).
To elucidate the phylogenetic affinity of A. fistulosa weused ITS (18 taxa) and coxI-50 (17 taxa, the coxI-50
sequence of Pterygophora californica Ruprecht could notbe determined) sequences from the major groups of thederived families of the Laminariales (Lane et al., 2006),all genera of the Alariaceae and isolates from the majorclades of Alaria as determined below. The A. fistulosa
alignments were subjected to maximum likelihood (ML)analyses in PAUP* v 4.0b10 (Swofford, 2002) using themodel parameters (TrN + I + G for the ITS data andK81uf + I + G for the coxI-50 data) estimated in Modeltestv 3.7 (Posada and Crandall, 1998). One hundred randomsequence addition replicates were performed under the heu-ristic search algorithm, and subsequently 100 bootstrapreplicates were analyzed with ten random sequence addi-tion replicates. Bayesian analyses were performed with
MrBayes v 3.0 (Huelsenbeck and Ronquist, 2003) usingdefault values and the GTR + I + G model with parame-ters estimated during the analyses. Four independent runsof 1,000,000 generations were performed, and trees weresampled every 100 generations and a ‘‘burn-in’’ value of�130,000 generations was determined by visual inspectionof likelihood values. The first 400,000 generations were dis-carded to ensure stabilization, and the remaining trees wereused to construct the consensus. Finally, the ITS and coxI-50 data sets were combined and analyzed using theK81uf + I model (determined by Modeltest) in ML analy-ses as described above. Bayesian analyses were carried outas above with each gene as a separate partition and all rel-evant parameters unlinked.
The coxI-50 sequence alignment of Alaria spp. was sub-jected to parsimony, neighbor-joining (NJ) and bootstrapanalyses in PAUP*, and Bayesian analyses were performedas above. Fifty random addition replicates under the heu-ristic search method, using TBR branch swapping, werecompleted under unweighted parsimony with gaps treatedas missing data. Model parameters used in NJ analyseswere estimated in Modeltest (Posada and Crandall,1998). Bootstrap analyses (1000 replicates) were calculatedunder NJ and with 10 random additions in parsimony. Forbootstrap analyses, only a single taxon representing iso-lates with identical sequences was included. Due to the
0.01 substitutions/site
Lessonia corrugata
Pelagophycus porra
Saccharina sessile
Saccharina lattisima
Laminaria digitata
Agarum clathratum
Pleurophycus gardneri
Lessoniopsis littoralis
Amar040902
Aesc1253
Amar031503
Acras7
Ataen10488
Afist9805
Afist11481
Undariapinnatifida
*/98
*/68
*/97
*/62
*/*
99/67
*/*
*/96
94/-
*/71
*/73
*/77
*/73
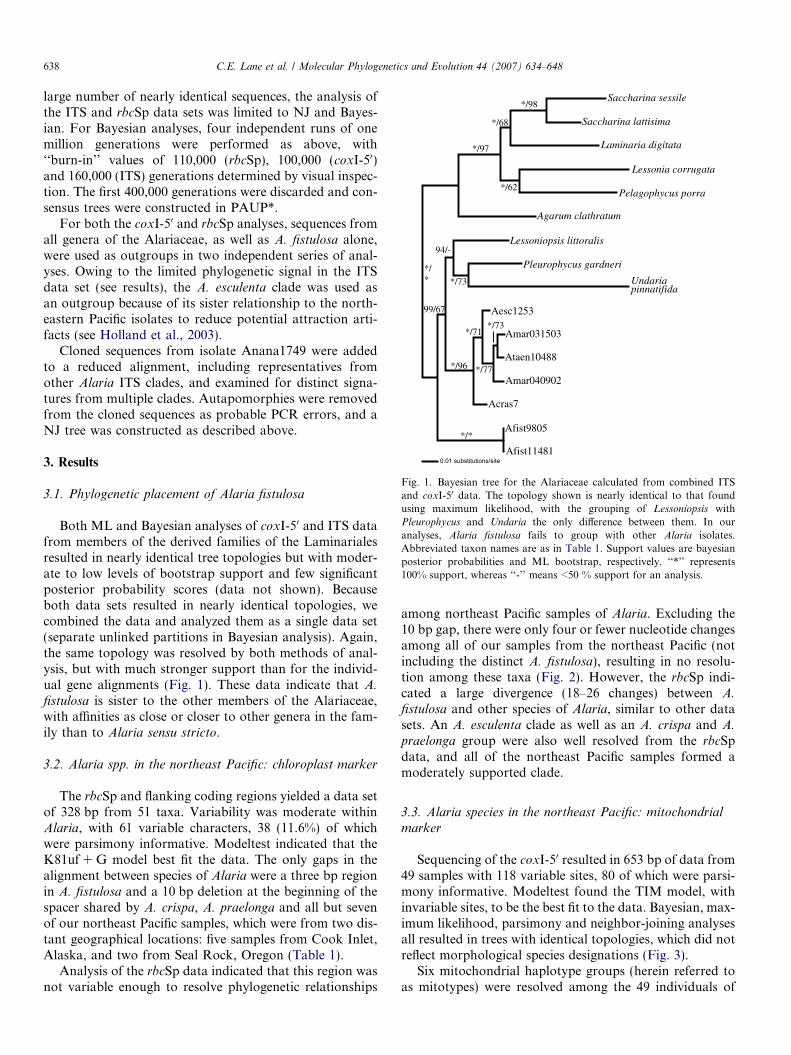
Fig. 1. Bayesian tree for the Alariaceae calculated from combined ITSand coxI-50 data. The topology shown is nearly identical to that foundusing maximum likelihood, with the grouping of Lessoniopsis withPleurophycus and Undaria the only difference between them. In ouranalyses, Alaria fistulosa fails to group with other Alaria isolates.Abbreviated taxon names are as in Table 1. Support values are bayesianposterior probabilities and ML bootstrap, respectively. ‘‘*’’ represents100% support, whereas ‘‘-’’ means <50 % support for an analysis.
638 C.E. Lane et al. / Molecular Phylogenetics and Evolution 44 (2007) 634–648
large number of nearly identical sequences, the analysis ofthe ITS and rbcSp data sets was limited to NJ and Bayes-ian. For Bayesian analyses, four independent runs of onemillion generations were performed as above, with‘‘burn-in’’ values of 110,000 (rbcSp), 100,000 (coxI-50)and 160,000 (ITS) generations determined by visual inspec-tion. The first 400,000 generations were discarded and con-sensus trees were constructed in PAUP*.
For both the coxI-50 and rbcSp analyses, sequences fromall genera of the Alariaceae, as well as A. fistulosa alone,were used as outgroups in two independent series of anal-yses. Owing to the limited phylogenetic signal in the ITSdata set (see results), the A. esculenta clade was used asan outgroup because of its sister relationship to the north-eastern Pacific isolates to reduce potential attraction arti-facts (see Holland et al., 2003).
Cloned sequences from isolate Anana1749 were addedto a reduced alignment, including representatives fromother Alaria ITS clades, and examined for distinct signa-tures from multiple clades. Autapomorphies were removedfrom the cloned sequences as probable PCR errors, and aNJ tree was constructed as described above.
3. Results
3.1. Phylogenetic placement of Alaria fistulosa
Both ML and Bayesian analyses of coxI-50 and ITS datafrom members of the derived families of the Laminarialesresulted in nearly identical tree topologies but with moder-ate to low levels of bootstrap support and few significantposterior probability scores (data not shown). Becauseboth data sets resulted in nearly identical topologies, wecombined the data and analyzed them as a single data set(separate unlinked partitions in Bayesian analysis). Again,the same topology was resolved by both methods of anal-ysis, but with much stronger support than for the individ-ual gene alignments (Fig. 1). These data indicate that A.
fistulosa is sister to the other members of the Alariaceae,with affinities as close or closer to other genera in the fam-ily than to Alaria sensu stricto.
3.2. Alaria spp. in the northeast Pacific: chloroplast marker
The rbcSp and flanking coding regions yielded a data setof 328 bp from 51 taxa. Variability was moderate withinAlaria, with 61 variable characters, 38 (11.6%) of whichwere parsimony informative. Modeltest indicated that theK81uf + G model best fit the data. The only gaps in thealignment between species of Alaria were a three bp regionin A. fistulosa and a 10 bp deletion at the beginning of thespacer shared by A. crispa, A. praelonga and all but sevenof our northeast Pacific samples, which were from two dis-tant geographical locations: five samples from Cook Inlet,Alaska, and two from Seal Rock, Oregon (Table 1).
Analysis of the rbcSp data indicated that this region wasnot variable enough to resolve phylogenetic relationships
among northeast Pacific samples of Alaria. Excluding the10 bp gap, there were only four or fewer nucleotide changesamong all of our samples from the northeast Pacific (notincluding the distinct A. fistulosa), resulting in no resolu-tion among these taxa (Fig. 2). However, the rbcSp indi-cated a large divergence (18–26 changes) between A.fistulosa and other species of Alaria, similar to other datasets. An A. esculenta clade as well as an A. crispa and A.
praelonga group were also well resolved from the rbcSpdata, and all of the northeast Pacific samples formed amoderately supported clade.
3.3. Alaria species in the northeast Pacific: mitochondrial
marker
Sequencing of the coxI-50 resulted in 653 bp of data from49 samples with 118 variable sites, 80 of which were parsi-mony informative. Modeltest found the TIM model, withinvariable sites, to be the best fit to the data. Bayesian, max-imum likelihood, parsimony and neighbor-joining analysesall resulted in trees with identical topologies, which did notreflect morphological species designations (Fig. 3).
Six mitochondrial haplotype groups (herein referred toas mitotypes) were resolved among the 49 individuals of

Pleurophycus gardneri UndariapinnatifidaAfist9805
Afist11481Pterygophora californica
Lessoniopsis littoralisAesc9804
Aesc033102Agrand(AF177175)
Aesc(AF318958)Aesc002Aesc1253
Aesc032601Acrispa1Aprae7Aprae(AF318960)Aprae(AF109801)
Acras(AF318957)Acras(AF109802)
Atenu11487Atenu11176
Amar031501Amar9797
Amar10037Atenu9967
Atenu9802Amar031601
Aesc9803Amar01SR
Amar02SRAtaen9795Amar10488Amar9794Amar9796Amar031901Amar9800AnanaAF109803Amar031503Amar040902Anana1171Ataen10759Anana11570
Atenu10292Atenu9792
Atenu9793Anana1749Anana1750
Atenu9791Atenu9790
Anana040801Anana1107Atenu11583
0.005 substitutions/site
*/*
66/-*/*
*/*
74/-
89/59
*/94
63/53
*/81
*/81*/90
90/86
59/64
91/92
95/80
65/56
99/64
99/57
Fig. 2. Bayesian tree of Rubisco spacer sequences from isolates of Alaria.Whereas the Rubisco spacer was able to separate the genera of theAlariaceae and provided some support with Alaria, it was not variableenough to resolve relationships among northeast Pacific isolates of Alaria.Abbreviations for taxa are as in Table 1. GenBank Accession Numbers fordata generated elsewhere are in parentheses. Values along branchesindicate posterior probability and neighbor-joining bootstrap support,respectively. Branches lacking values, or support values denoted with ‘‘-’’received <50 % support.
C.E. Lane et al. / Molecular Phylogenetics and Evolution 44 (2007) 634–648 639
Alaria, most with strong bootstrap and significant poster-ior probability support (Fig. 3). Mitotypes A, B and Care distinct, with relatively large numbers of nucleotide dif-ferences between them (Fig. 3). Mitotypes D, E and F aremore closely related to one another, as suggested by theirrelatively low degree of nucleotide divergence. MitotypeD was only collected along the Pacific coast of Alaska fromCook Inlet westward (Fig. 4). Mitotype E was also foundthroughout our northern collections and as far south asBamfield, British Columbia. In contrast, mitotype F wasmainly sequenced from southern isolates, including sam-ples from Seal Rock, Oregon, but was also found in twoAlaskan isolates (Fig. 4).
3.4. Alaria species in the northeast Pacific: nuclear marker
Internal transcribed spacer (ITS) data resulted in analignment of 735 bp from 46 taxa, with the TrN + I + Gmodel recovered as the best fit. The variability in the ITSalignment may be underestimated due to a long string of
C followed by G nucleotides, which may have led to com-pression artifacts. In most cases, the sequencing polymer-ase was unable to read cleanly through this region.Unfortunately, the area affected by these artifacts is themost variable portion of the ITS and may provide addi-tional signal at the species level. Because of the artifacts,27 alignment positions were removed from analyses toavoid noise in the data, making the number of changesreported here only minimum estimates among our Alaria
isolates (Fig. 5). When the 27 problematic characters wereremoved, there were 63 variable characters, 50 (7.1%) ofwhich were parsimony informative. However, with gapsincluded as a fifth state, there were 114 (16.1%) parsimonyinformative characters out of 134 variable characters.
Phylogenetic analysis of the ITS data resulted in therecovery of several clades with virtually no bootstrap sup-port, but most clades had significant posterior probabilityscores (Fig. 5). In agreement with the previous analyses,the isolates did not group based on their morphology,but the ITS data did reveal a loose geographic patternfor the isolates (Fig. 5). The ‘‘Northern clade’’ containedisolates from the Queen Charlotte Islands to Cook Inlet,Alaska. The only exception to this range was one samplefrom southern Vancouver Island. Atenu11487 was resolvedindependently from all of our other samples, but betweenthe Northern and Southern groups. The ‘‘Southern clades’’encompassed samples from Oregon to the northern tip ofVancouver Island, as well as two isolates from Cook Inletand one from Prince William Sound, Alaska. There wasalso a clade of samples from the area around Cook Inlet,but not all of the samples from this region were resolvedin this group. One unexpected result from the ITS datawas the grouping of A. crassifolia, A. crispa and A. praelon-
ga within the A. esculenta group, but this could be an arti-fact of sample size or the arbitrary rooting of the tree.
Interestingly, when the mitotypes are mapped onto theITS trees (Fig. 5), an introgression of the ‘‘E’’ mitotypefrom the north into isolates of the Southern clade#2 isrevealed. This weakly indicates asymmetric introgressionof the mitochondrion between the two groups. Addition-ally, a single member of the Cook Inlet clade (Ataen10759)contains an E mitotype, indicating that there is crossingbetween members of the Northern and Cook Inlet cladesas well.
3.5. Cloning of ITS products
Seven isolates were investigated further to determine ifmultiple variant copies of the ITS existed within an individ-ual. The ITS region was amplified and cloned from threesamples in the Southern clade #2 (Amar9797, Anana1749and Amar031501), the phylogenetically distinct Aten-u11487, two isolates from the Northern clade (Atenu9790and Aesc9803), as well as for one isolate from the CookInlet clade (Ataen10759). In most cases, variability amongthe different clones was modest (zero to three nucleotidechanges) and concentrated in the variable C–G stretch

Lessoniopsis littoralisPleurophycus gardneri
Undaria pinnatifida
0.005 substitutions/site
A B C D E FA 0 ---- -B 45 - 47 4 - - - -C 51 - 52 21 - 22 0 - 6 - - -D 44 - 46 21 - 22 16 - 20 0 - 4 - -E 45 - 49 24 - 27 14 - 19 7 - 11 0 - 5 -F 47 - 55 26 - 30 18 - 20 11 - 16 8 - 15 0 - 6
*/*/*
*/71/95
97/99/90
*/99/98
98/84/76
96/54/-
93/62/68
*/62/56
59/-/58
98/74/89
*/93/96
93/80/85
*/85/87
Afist9805Afist11481
Aesc033102Aesc9804Aesc1253
Aesc032601Aesc002
Ataen9795Ataen11176Ataen10350Ataen10292Ataen10488Ataen11583
Amar031501Amar031503Amar9797Amar9796
Anana031401Anana1171
Anana1750Ataen9802
Amar9799Ataen9801Ataen031701Atenu9967Aesc9803Amar9800Ataen10759Atenu9790Atenu9791Atenu9792Atenu9793
Ataen9806Atenu11487Anana11570
Ataen9974
Amar01SRAmar03SR
Amar9794Amar031901Amar040902Amar10037Amar01KPAnana1107
Anana1749Amar031601
Anana040801Acrispa1Aprae7
C
D
E
F
A
B
Fig. 3. Bayesian tree of coxI-50 sequences from isolates of Alaria. Five groups of mitochondrial haplotypes (not including the divergent A. fistulosa) areresolved within Alaria. Groups E and F include isolates that exhibit morphologies that correspond to more than one recognized species. Northeast Pacificisolates are in bold text, whereas samples collected elsewhere appear in roman text. Abbreviations are listed in Table 1. Text styles correspond to theresolved mitochondrial haplotypes (mitotypes)—bold for mitotype D, bold italics for mitotype E, and bold underline for F. Support values are bayesianposterior probabilities, parsimony bootstrap and neighbor-joining bootstrap, respectively. An ‘‘*’’ represents 100% support, whereas ‘‘-’’ means <50 %support for an analysis. The matrix shows the absolute number of nucleotide differences within and between the various mitotypes.
640 C.E. Lane et al. / Molecular Phylogenetics and Evolution 44 (2007) 634–648
mentioned above. However, some cases were moreextreme. Clones of Amar031501 varied by two substitu-tions and two deletions, while Aesc9803 clones differedby nine substitutions and four deletions. The most strikingexample of this phenomenon was from clones ofAnana1749. Cloning resulted in five distinct sequencesfrom seven clones, with two very distinct signatures. Onceautapomorphies (likely PCR errors) were removed, oneclone (D) grouped with an Alaria marginata isolate(Amar9794), whereas the others were identical toAnana1750, collected from the same area as Anana1749
(Fig. 6). This result is unlikely to be contamination becauseclone D was not identical to any of our other isolates, evenwith autapomorphies removed.
4. Discussion
4.1. Morphology and genetic differentiation
The most morphologically distinct member of Alaria isA. fistulosa based on the air bladders within the midrib ofthe blade, which allows the blade to float to the surface of

Fig. 4. Geographic distribution along the northeast Pacific coast of North America for isolates used in all analyses. Bold letters following the isolatedesignation correspond to the mitotype of each sample (Fig. 3).
C.E. Lane et al. / Molecular Phylogenetics and Evolution 44 (2007) 634–648 641
the sea. Moreover, this species has a large, complex con-ical holdfast (the attachment of the thallus to the sub-strate), a wide, flattened rachis (area where specializedreproductive structures, called sporophylls, are produced),which in section has distinctly raised margins (as does themidrib), characters that separate A. fistulosa from otherspecies of Alaria (Widdowson, 1971a). This species alsoattains a significantly larger size than its congeners, withlamina reaching 25 m in length and 90 cm in breadth(Setchell and Gardner, 1925). Its fistulose midrib is uniqueamong all of the genera of the Alariaceae and makes itsecology and ability to disperse different from other mem-bers of Alaria. Other species of Alaria are found inthe intertidal or shallow subtidal waters, often in a dis-tinct band just above the Laminaria/Saccharina band.A. fistulosa is the only species in the genus that is a truedenizen of the subtidal environment, where it forms exten-sive offshore floating kelp beds. Although the gross mor-phology of A. fistulosa makes it unquestionably a memberof the Alariaceae, its morphology and ecology clearly dis-
tinguish it from other species of Alaria and other generaof the family.
The data presented here (Figs. 1–3), indicate thatA. fistulosa is genetically divergent from all other Alaria
species and from other members of the Alariaceae. Analy-ses of the combined ITS and coxI-50 data position A.
fistulosa sister to other members of the Alariaceae, separatefrom the other Alaria spp. (Fig. 1). Thus, based on mor-phological, ecological and molecular data, we recognizeA. fistulosa as distinct from other species of Alaria and pro-pose a new genus to accommodate it.
Druehlia C.E. Lane & G.W. Saunders, gen. novType. Druehlia fistulosa (Postels & Ruprecht) C.E. Lane
& G.W. Saunders, comb. nov.
Basionym. Alaria fistulosa Postels and Ruprecht (1840),Illustrationes algarum p. 11.
Diagnosis. Membrum familiae Alariaceae (Laminariales)ab generibus aliis costo fistuloso differens. Member of theAlariaceae (Laminariales) differing from other genera byits fistulose midrib.
Acras(AF319001)Aesc1253Aesc002
Aesc032601Aprae7
Aprae319004Aesc9804
Aesc033102Acrispa1
Amar01SRAmar040902Amar01KP
Amar031601Amar9794
Anana1171Amar9796
Anana1750Anana040801Anana1749
Amar9797Amar031501Amar031503
Atenu11487Atenu9802Atenu9801
Anana031401Atenu9967Amar9799Atenu9793Atenu9792Atenu9790Aesc9803
Amar9800Anana11570
Ataen031701Ataen9806
Ataen9974Ataen10292
Ataen9795Ataen10759Ataen10350
Ataen10488Ataen11583
Ataen11176
0.001 substitutions/site
99/-
91/-
58/-
52/-
100/69
100/-
99/-
99/50
86/-
96/-
57/-
96/65
92/-
100/50
Northernclade
Southern clade #1
Southern clade #2
Cook Inletclade
A. esculentaclade
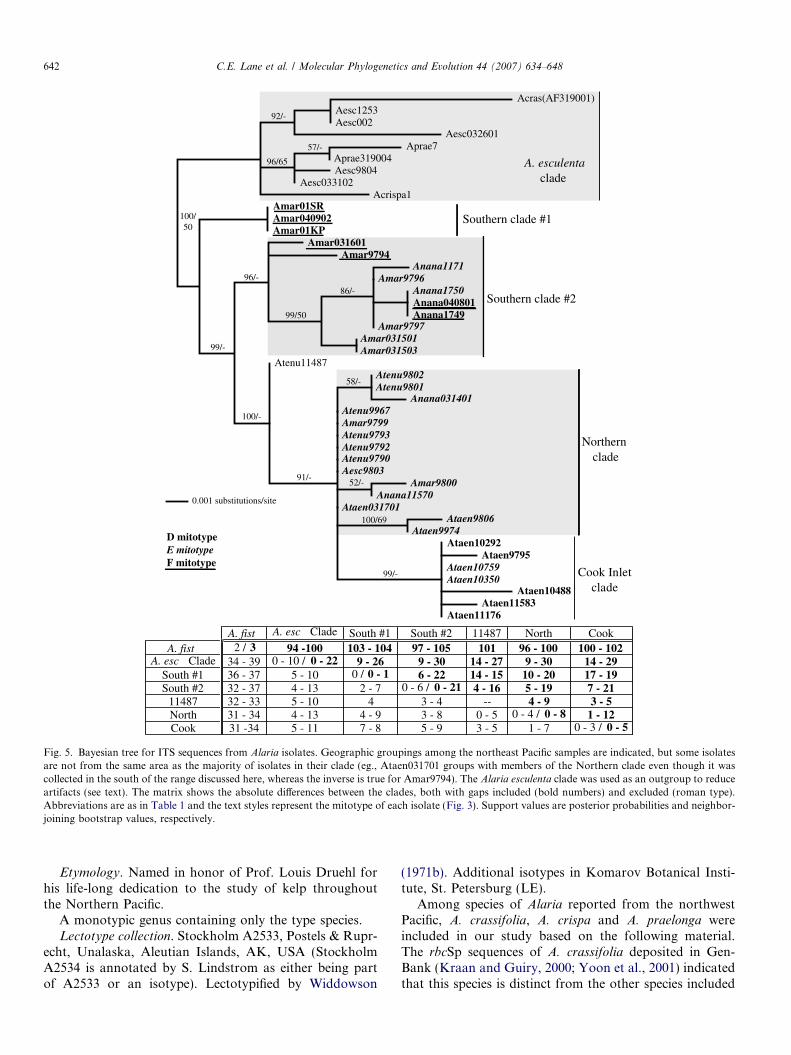
A. fist A. esc Clade South #1 South #2 11487 North CookA. fist 2 / 3 94 -100 103 - 104 97 - 105 101 96 - 100 100 - 102
A. esc Clade 34 - 39 0 - 10 / 0 - 22 9 - 26 9 - 30 14 - 27 9 - 30 14 - 29South #1 36 - 37 5 - 10 0 / 0 - 1 6 - 22 14 - 15 10 - 20 17 - 19South #2 32 - 37 4 - 13 2 - 7 0 - 6 / 0 - 21 4 - 16 5 - 19 7 - 21
11487 32 - 33 5 - 10 4 3 - 4 -- 4 - 9 3 - 5North 31 - 34 4 - 13 4 - 9 3 - 8 0 - 5 0 - 4 / 0 - 8 1 - 12Cook 31 -34 5 - 11 7 - 8 5 - 9 3 - 5 1 - 7 0 - 3 / 0 - 5
D mitotypeE mitotypeF mitotype
Fig. 5. Bayesian tree for ITS sequences from Alaria isolates. Geographic groupings among the northeast Pacific samples are indicated, but some isolatesare not from the same area as the majority of isolates in their clade (eg., Ataen031701 groups with members of the Northern clade even though it wascollected in the south of the range discussed here, whereas the inverse is true for Amar9794). The Alaria esculenta clade was used as an outgroup to reduceartifacts (see text). The matrix shows the absolute differences between the clades, both with gaps included (bold numbers) and excluded (roman type).Abbreviations are as in Table 1 and the text styles represent the mitotype of each isolate (Fig. 3). Support values are posterior probabilities and neighbor-joining bootstrap values, respectively.
642 C.E. Lane et al. / Molecular Phylogenetics and Evolution 44 (2007) 634–648
Etymology. Named in honor of Prof. Louis Druehl forhis life-long dedication to the study of kelp throughoutthe Northern Pacific.
A monotypic genus containing only the type species.Lectotype collection. Stockholm A2533, Postels & Rupr-
echt, Unalaska, Aleutian Islands, AK, USA (StockholmA2534 is annotated by S. Lindstrom as either being partof A2533 or an isotype). Lectotypified by Widdowson
(1971b). Additional isotypes in Komarov Botanical Insti-tute, St. Petersburg (LE).
Among species of Alaria reported from the northwestPacific, A. crassifolia, A. crispa and A. praelonga wereincluded in our study based on the following material.The rbcSp sequences of A. crassifolia deposited in Gen-Bank (Kraan and Guiry, 2000; Yoon et al., 2001) indicatedthat this species is distinct from the other species included

CCC-----MC CYNNNNNNNN .--.....C. .CCTC----- ..-.....C. .CCTC----- ..-.....C. .CCTC----- ...C....C. .CCTCCCTTC ..-.....C. .CCTC----- ...CCCC.T. .CTTYT---- ...CCCC.T. .CTTCT---- ...CCCC.T. .CTTYT---- ...MCCCCYY ..TTCT---- ...MCCC.YY ..TTCT---- ...CCC..T. .CTTCT---- ........C. .CCTC----- ..-.....C. .CTTCT---- ..-.....C. .CTTCT---- .--.....C. .CTTCT----
GAGCG TTCGCGCTCC ..... .......... ..... .......... ..... .......... ....- ..---..... ..... .......... ....- ..---..... ....- ..---..... ....- ..---..... ....- ..---..... ....- ..---..... ..... .......... ..... .......... ..... .C........ ..... .......... ..... ..........
TTTRTTGAAA CCCYCGAATC...G...... ...T.........G...... ...T.........G...... ...T.........A...... ...C.........G...... ...T......------A... ...T......---A..T... ...T......------TT.. ...T.........A...... ...T.........A...... ...C.........ACC.... ...T........AACC.... ...T.........A.C.... ...T.........A.C.... ...T.A.......A.C.... ...T......
GAAAAYCGTT.....T.........T.........T.........C.........T.........T.........T.........T.........T.........C.........T.........T.........T.........T.........T....
0.001 substitutions/site
Aesc9804Aesc032601
Acrispa1Amar031601
Amar9794
Anana1749A
Anana1749D
Anana1749BAnana1749CAnana1749E
Anana1750
NNNNNNNNNN NNNNNNNNNN NTCG -CGGGT---- -GGGGGGGTT -... -CGGGT---- -GGGGGGGTT -... -CGGGT---- -GGGGGGGTT -... TCGGGTTGTG GGTGGGGGTT G... -CGGGT---- -GGGGGGGTT -... -CGGGT-GTG GGTGGGGGTG -... -CGGGT-GTG GGTGGGGGTG -... -CGGGC-GTG GGTGGGGGCG -... -TGGGTTGTG GGTGGGGGTT G... -CGGGTTGTG GGTGGGGGTT G... -CGGGT-GTG GGTGGGGGTT -... -CGGGT---G GGTGGGGGTT -... -CGGGT---- ---GGGGGTG -... -CGGGT---- ---GGGGGTT -... -CGGGT---- ---GGGGGTT -...
CAGGGTGCCT..................................C...................C.........C.........C.........C.........C.........C.........C.........C.........C.........C.....
91 110 141 160Anana1749Anana1749AAnana1749BAnana1749CAnana1749DAnana1749EAcrispa1Aesc9804Aesc032601Amar031601Amar9794Atenu9801Anana11570 Ataen10488Ataen11583 Ataen11176
Anana1749Anana1749AAnana1749BAnana1749CAnana1749DAnana1749EAcrispa1Aesc9804Aesc032601Amar031601Amar9794Atenu9801Anana11570 Ataen10488Ataen11583 Ataen11176
361
404 421 440 541 550
Atenu9801Aesc9803Anana11570
Ataen10488Ataen11583
Ataen11178
Fig. 6. Sequence comparison and resulting NJ tree from ITS sequences of five clones (A–E) from Anana1749 and representative samples from other Alaria
clades. Clone 1749D was substantially different from the other clones from this isolate (even after cloning artifacts were removed), indicating more thanone distinct copy of this region is present in the nuclear genome. Positions with the same nucleotide as the reference sequence are represented with ‘‘.’’,whereas indels are indicated with a ‘‘-’’. Alignment positions for the displayed nucleotides are given next to the sequence and positions that were excludedfrom all analyses are shaded. Abbreviations are as in Table 1.
C.E. Lane et al. / Molecular Phylogenetics and Evolution 44 (2007) 634–648 643
in our study (Fig. 2). Our collection of A. crispa from thetype locality of St. Lawrence Island revealed it to be dis-tinct from other northeast Pacific Alaria in all three ofour data sets, and both rbcSp (Fig. 2) and coxI-50
(Fig. 3) data support a close relationship between A. crispa
and A. praelonga. Alaria praelonga (type locality the Com-mander Islands) was represented in the present study byAprae7, AF318960, AF109801 and Aprae319004 (Kraanand Guiry, 2000; Yoon and Boo, 1999; Yoon et al.,2001). Although reported along the Pacific coast of Alaska
(across the Aleutian Islands to the Commander Islands) tonorthern Japan (Widdowson, 1971a) none of our northeastPacific isolates originally field identified as A. praelonga
(Amar9796, Amar9799 and Ataen9806) grouped withJapanese A. praelonga, indicating that they are geneticallydifferent and suggesting that A. praelonga is confinedto the western Pacific. Examples of North AmericanA. praelonga were re-examined and determined to be mis-identifications of A. marginata or A. taeniata. Examinationof A. praelonga material from its type locality is warranted,

644 C.E. Lane et al. / Molecular Phylogenetics and Evolution 44 (2007) 634–648
however, since Selivanova and Zhigadlova (1997) includedCommander Islands records of this species under A.
marginata.The rbcSp was uninformative for resolving relationships
among the northeast Pacific samples (Fig. 2), supportingclose relationships within this group. The same region wasused unsuccessfully by Kraan and Guiry (2000) to resolvephylogenetic structure among A. esculenta isolates fromthe North Atlantic. Our sequences produced a similar levelof divergence within northeast Pacific collections as theyobserved among North Atlantic A. esculenta isolates, andthe rbcSp only served to separate the northeast Pacific iso-lates from other geographic areas, albeit without strong sup-port (Fig. 2). The rbcSp data did indicate a distinctionbetween A. esculenta and the northwest Pacific taxa includedin the dataset, which was not apparent in the ITS trees. Therelationship among these taxa needs further study.
Our ITS data positioned the three West Pacific species(A. crassifolia, A. crispa and A. praelonga) among variousisolates of A. esculenta (Fig. 5), but the low levels of taxonsampling and the irregularities of the ITS in Alaria (dis-cussed below) are likely responsible for the discrepanciesbetween the organellar data (Figs. 2 and 3) and the ITS tree(Fig. 5). A wider sampling of these taxa, using nuclear andorganellar markers, may shed light on the detailed relation-ships among these entities. A. esculenta isolates were col-lected from a wide range of geographic locations (Table1) and, with the exception of Aesc9803 (presumably misi-dentified as A. esculenta based on collection location), aregenetically distinct from all of our northeast Pacific sam-ples in all analyses (Figs. 2, 3 and 5).
Morphological identification of our northeast PacificAlaria isolates (except D. fistulosa) based on Widdowson’s(1971a) key was not reflected in any of the trees recoveredfrom the separate data sets. In fact, taxa with distinct mor-phologies (Fig. 7), clearly representative of different mor-phological species, have nearly identical sequences fromthe three regions examined here (Figs. 2, 3 and 5). How-ever, some loose patterns of morphology were apparentfrom the trees such that, with the exception of the Northernclade, each clade includes a subset of morphologies, butwith no morphology exclusive to any clade. The Southernclades (Fig. 5) are composed of samples identified as A.
marginata and A. nana H.F. Schrader, two ‘species’ sus-pected of regular hybridization because individuals canbe found with morphologies that form a continuous grade(Widdowson, 1971b). The Northern clade consists mainlyof taxa identified in the field as A. tenuifolia, but all ofthe northeast Pacific morphologies are represented in theclade. Some isolates from lower Cook Inlet and westernAlaska, with identical sequence in all of our data sets, sharea similar morphology, with long, lanceolate sporophyllsand a large blade that flares out almost immediately abovethe transition zone (Fig. 8). The only exception to this mor-phology among the samples from the Cook Inlet clade isAtaen10759, which has numerous small sporophylls anda blade that does not flare out above the transition zone.
As noted above and again below, Ataen10759 is also theonly sample from the ITS Cook Inlet clade that has an Emitotype, indicating that this sample may be a hybrid.The Cook Inlet morphology resembles most closely the fig-ures of A. taeniata in Widdowson’s monograph (Widdow-son, 1971a, Figs. 21a and b).
4.2. Discrepancies in the molecular data
Previous barcoding studies have found an average diver-gence of 11.3% between closely related species of the ani-mal kingdom, whereas values of less than 1% arenormally recovered between isolates within a species(Hebert et al., 2003b). As another comparison to our data,Saunders (2005) uncovered less than 0.5% coxI-50 diver-gence within red algal species and 4.5 to 13.6% betweenspecies within a genus. However, Saunders also reporteddivergence values of only 0.8–1.2% between two closelyrelated species pairs. Sequence variation presented herebetween mitotypes B, C and the D/E/F complex (Fig. 2)ranged from 2.2–4.7%, whereas values between genera ofthe Alariaceae ranged from 6.9–12%. Divergence withinour individual northeast Alaria mitotypes was low, lessthan 1% in all cases, but divergence values between mito-types D, E and F were only slightly greater (1.1–2.3%)—equivalent to or slightly greater than values between closelyrelated species pairs of red algae (Saunders, 2005). If thebarcoding results were taken in isolation, we would proba-bly recognize three closely related species of Alaria in thenortheast Pacific, corresponding to mitotypes D, E andF. However, all of the data together suggest a more compli-cated story.
Divergence values for the ITS sequences within ournortheast Pacific clades are surprisingly large and overlapwith the values between clades (Fig. 5). Comparisons toother genera in the Alariaceae to see if within-genus ITSvariation is high in this family are not possible becausethe Alariaceae is composed of mainly monospecific genera.However, in a red algal ITS study, Ross et al. (2003) foundfewer than four ITS nucleotide differences within isolates oftwo closely related Mazzaella species, and nine to twelvedifferences between them. In a green algal ITS study, Lind-strom and Hanic (2005) observed up to 12 nucleotide differ-ences within three closely related Urospora species, and upto 30 nucleotide differences among the species. As a moreappropriate comparison within the Laminariales, isolatesof Saccharina latissima (L.) C.E. Lane, Mayes, Druehl etG.W. Saunders from each coast of North America haveonly zero to two nucleotide changes in the ITS (Lane,unpubl.) and closely related species of Saccharina differedby as few as five to seven substitutions (Lane et al.,2006). Thus, the ITS divergence values observed amongAlaria isolates in the northeast Pacific exceed species leveldifferences observed in other taxa in the Laminariales.However, rather than resolving distinct species-level groups(0–4 changes), the data revealed essentially a continuum ofITS divergence across isolates, at odds with the mitochondrial

Fig. 7. Examples of the morphological variation of northeast Pacific isolates. Pictured are: (a) Aesc9803, (b) Atenu9793, (c) Amar9799, and (d)Anana031401. Isolates a, b and c were all genetically identical in ITS and barcode analyses, whereas sample d contained minor sequence differences inthese genes. Despite the close relationship, these isolates display a wide range of morphological variation. Centimeter rule.
C.E. Lane et al. / Molecular Phylogenetics and Evolution 44 (2007) 634–648 645
haplotypes, and trees with low resolution. This situation isin contrast to what would be expected among species of agenus.
This previous paradox was accompanied by anotheranomalous aspect of northeast Pacific Alaria ITSsequences—they are characterized by an unusual number

Fig. 8. Three examples of the morphology of Alaria isolates from the mouth of Cook Inlet. The samples pictured are: (a) Ataen10488; (b) Ataen10350;and (c) Ataen10292, respectively. Alaria isolates from this area had the most stable morphology of any of the northeast Pacific collection locations, but thesample size included here is small. Scale equals 5 cm.
646 C.E. Lane et al. / Molecular Phylogenetics and Evolution 44 (2007) 634–648
of ambiguous nucleotide positions. Sixteen of forty-sixsequences contained at least one ambiguous nucleotide (anucleotide that is not assigned to a single state by thesequencing software due to multiple peaks in the same posi-tion; most contained at least three ambiguities), includingall but four of the isolates in the Southern clade, three ofwhich had an E mitotype. In contrast, an ITS data set froma previous kelp study (Lane et al., 2006) had no sequenceambiguities among 43 diverse taxa of the Laminariales.Identification of distinct ITS clones, with different copiesof the ribosomal cistron, from some individuals of north-east Pacific Alaria explains these ambiguities in our directlysequenced data. Based on the large number of ambiguousnucleotides in our ITS sequence data, the occurrence ofmultiple ITS sequences within individuals of Alaria fromthis region is likely widespread. We are confident that thediscrepancies among clones from each sample was due toITS variants rather than contamination from other kelptaxa (e.g., Lane and Saunders, 2005) because all clonesgrouped within the northeast Pacific clade in phylogeneticanalysis, even in the most extreme cases (Fig. 6).
The combination among northeast Pacific Alaria iso-lates of distinct mitotypes and larger than expected ITSvariation within and between clades, which nonethelessfailed to form distinct species assemblages, is consistentwith a hypothesis of formerly isolated species recentlyreverting to a continuous breeding population, rather thanwith an incipient species beginning to diverge. The distinctmitotypes resolved with the DNA barcode data are an indi-cation of a period of former genetic isolation, which waslong enough for the mitochondrial DNA (as well as ITS)to diverge. However, the resolving power expected forITS data at the species level is being degraded by recombi-
nation events between the multiple variants beingexchanged within the current interbreeding population,which includes remnants of the variants of the former spe-cies, explaining the high levels of ITS divergence weobserved. Since the mitochondrial genome does notundergo recombination, the three mitotypes are retainedwithin the interbreeding northeast Pacific species complex.Eventually, if species boundaries continue to collapse, onemitotype, as well as a stable nuclear ribotype, will becomefixed through stochastic processes. Further evidence ofinterbreeding among the northeast Pacific isolates is theprevalence of samples that have identical ITS sequencesbut different mitotypes (Fig. 5).
A similar pattern of mitochondrial divergence, which isnot concordant with nuclear DNA variation, has beendemonstrated for European plankton (Peijnenburg et al.,2006). In this study, nuclear microsatellite markers failedto recover genetic structure within the study populationof Sagitta, whereas significant mitochondrial sequencedivergence was uncovered (up to 26%). The authorshypothesize that the more variant haplotypes may be theremnants of an ancestral mitochondrial lineage that hasnot been lost by lineage sorting. The observed mitochon-drial variation in Alaria is considerably lower and likelyoccurred recently, during the Pleistocene glaciation. At thattime, the northeast Pacific coast was heavily affected by icecover, salinity and sea temperature changes (Hetheringtonet al., 2003) that may have created ideal conditions for allo-patric speciation. Without a physical separation, mitochon-drial variation would have had to occur sympatrically,which is hypothesized to be rare among high-dispersal mar-ine organisms (Palumbi, 1992) and would be unlikely toreverse into the observed interbreeding population. With

C.E. Lane et al. / Molecular Phylogenetics and Evolution 44 (2007) 634–648 647
the retreat of the glacial ice sheet and subsequent rise in sealevel, incipient Alaria species may have regained contactbefore adequate barriers to hybridization had accumulated.This scenario would explain our multiple mitotypes that donot strictly correspond to the pattern shown by the nucleardata, which itself is marred by intra-individual variationthat masks the phylogenetic structure.
4.3. Implications on using coxI-50 as DNA barcode marker in
brown algae
The coxI-50 region has been mainly tested in animals,where it has been established as a tool for differentiatingspecies (e.g., Gomez et al., 2007; Hebert et al., 2003a;Hebert et al., 2003b), as well as for phylogenetic inference(Remigio and Hebert, 2003). Here we employed the coxI-50
in attempt to better understand species boundaries withinthe brown algal genus Alaria. Our coxI-50 data were ableto resolve reasonably well-supported groupings of mito-chondrial haplotypes in Alaria, but the number of differ-ences between groups (e.g., 7–11 between mitotypes Dand E) was equivalent to those observed between onlythe most closely related of red algal sibling species pairs(Saunders, 2005). In the red algal cases genetic isolationof the species pairs was supported by clearly divergent(although very similar) nuclear ITS clusters (Ross et al.,2003). When our Alaria coxI-50 data are compared to datafrom the commonly used nuclear ITS marker, each mito-type is not clearly associated with a nuclear genotype, con-sistent with our hypothesis of incipient speciation followedby hybridization and possibly a breakdown in speciesboundaries. Instances of hybridization and introgressionare particular cases that have been recognized as requiringsupplementary analyses to understand the complexities ofspecies boundaries (Hebert et al., 2003a). In the exampleoutlined here, low levels of coxI-50 sequence divergenceand nucleotide position ambiguity in our ITS sequenceswere diagnostic of a relationship between the northeastPacific isolates that was more complicated than sibling spe-cies. This is not a problem limited to brown algae, andfrom these data, it would seem prudent to investigate anyputatively closely related species, resolved with coxI-50
sequences, using other parts of the genome. However,ongoing work (Saunders Laboratory, unpublished) indi-cates that the coxI-50 region is a useful tool for reliably sep-arating species in other genera of brown algae and thisinteresting exception should not be considered as a failureof DNA barcoding, but as an opportunity to recognize thedynamic nature of evolutionary processes. Thus, we sug-gest that the coxI-50 shows promise for use among brownalgae as tool to differentiate taxa at the level of species.Additionally, the coxI gene may be considered a suitablephylogenetic tool in brown algae based on the reasonableamount of signal in the 50 end of the gene. However, forphylogenetic analysis, we recommend using a portion atleast twice as large as the coxI-50 to maximize the numberof informative characters.
4.4. Taxonomy of the northeast Pacific Alaria
Based on the fact that all of the Alaria populations werecover in the northeast Pacific are interbreeding (causinga lack of phylogenetic signal within the ITS region) andthat morphology in this region appears to be largely anenvironmental artifact, we recommend recognizing Alaria
in the northeast Pacific as an A. marginata species complex.Accordingly, we recommend that A. nana, A. taeniata, andA. tenuifolia be regarded as synonyms of A. marginata andexclude A. crispa and A. praelonga from the flora of thenortheast Pacific. Several subspecies, varieties, or ecadscould be recognized within our definition of A. marginata,but genetic distinctions would be useless in the field, andmorphological designations would have no basis in genet-ics. With the possible exception of the Cook Inlet clade(Fig. 8; except for Ataen10759, which has an E mitotype),individuals within the various clades of northeast PacificAlaria encompass all of the distinct morphologies on whichspecies in this area were previously distinguished (Widdow-son, 1971a), including every imaginable intermediate form(Fig. 7). The biogeography of the isolates in this group mayprovide the best indication of the genetic affinities of an iso-late, but even this would provide a weak probability of cor-rect assignment.
Note added in Proof
DeCew’s Guide to the Seaweeds of British Columbia,Washington, Oregon, and Northern California (http://ucjeps.berkeley.edu/guide/index.html) lists A. tenuifolia
as a later homonym of A. fragilis Saunders. AlthoughA. fragilis (Saunders, 1901) was published earlier thanA. tenuifolia (Setchell and Gardner, 1903) there remainssome debate as to whether these species encompass thesame concept, as Setchell and Gardner included A. fragilis
in their 1903 publication. However, A. fragilis undoubtedlyfalls under our expanded concept of A. marginata.
Acknowledgments
We thank John Archibald and Anna Fong for theirassistance with ITS cloning, as well as Roger Smith forhis help in the preparation of Figs. 7 and 8. We also appre-ciate taxonomic discussion from Mike Wynne. This workwas funded by the Natural Sciences and Engineering Re-search Council of Canada and the Canada Research ChairProgram; as well as the Canada Foundation for Innovationand New Brunswick Innovation Foundation. We alsothank the staff of the Bamfield Marine Sciences Centrefor their assistance.
References
Gomez, A., Wright, P.J., Lunt, D.H., Cancino, J.M., Carvalho, G.R.,Hughes, R.N., 2007. Mating trials validate the use of DNA barcodingto reveal cryptic speciation of a marine bryozoan taxon. Proc. R. Soc.Lond. B 274, 199–207.

648 C.E. Lane et al. / Molecular Phylogenetics and Evolution 44 (2007) 634–648
Greville, R.K., 1830. Algae Britannicae, or, Descriptions of the Marineand other Inarticulated Plants of the British Islands, Belonging to theOrder Algae. Maclachlan & Stewart, Edinburgh.
Hebert, P.D.N., Cywinska, A., Ball, S., deWaard, J.R., 2003a. Biologicalidentifications through DNA barcodes. Proc. R. Soc. Lond. B 270, 313–322.
Hebert, P.D.N., Ratnasingham, S., deWaard, J.R., 2003b. Barcodinganimal life: cytochrome c oxidase subunit 1 divergences among closelyrelated species. Proc. R. Soc. Lond. B 270 (Suppl.), 1–4.
Hetherington, R., Barrie, J.V., Reid, R.G.B., MacLeod, R., Smith, D.J.,James, T.S., Kung, R., 2003. Late Pleistocene coastal paleogeographyof the Queen Charlotte Islands, British Columbia, Canada, and itsimplications for the terrestrial biogeography and early postglacialhuman occupation. Can. J. Earth Sci. 40, 1755–1766.
Hogg, I.D., Hebert, P.D.N., 2004. Biological identification of springtails(Collembola: Hexapoda) from the Canadian Arctic, using mitochon-drial DNA barcodes. Can. J. Zool. 82, 749–754.
Holland, B.R., Penny, D., Hendy, M.D., 2003. Outgroup misplacementand phylogenetic inaccuracy under a molecular clock—A simulationstudy. Syst. Biol. 52, 229–238.
Huelsenbeck, J., Ronquist, F. 2003. MrBayes, 3.0. Evolutionary BiologyCentre, Uppsala University, Uppsala, Sweden.
Kraan, S., Guiry, M.D., 2000. Sexual hybridization experiments andphylogenetic relationships as inferred from rubisco spacer sequences inthe genus Alaria (Phaeophyceae). J. Phycol. 36, 190–198.
Kraan, S., Rueness, J., Guiry, M.D., 2001. Are North Atlantic Alaria
esculenta and A. grandifolia (Alariaceae, Phaeophyceae) conspecific?Eur. J. Phycol. 36, 35–42.
Lane, C.E., Mayes, C., Druehl, L.D., Saunders, G.W., 2006. A multi-genemolecular investigation of the kelp (Laminariales, Phaeophyceae)supports substantial taxonomic re-organization. J. Phycol. 42, 493–512.
Lane, C.E., Saunders, G.W., 2005. Molecular investigation revealsepiphytic extrageneric kelp (Laminairales, Phaeophyceae) gameto-phytes on Lessoniopsis littoralis thalli. Bot. Mar. 48, 426–436.
Lindstrom, S., Hanic, L., 2005. The phylogeny of North AmericanUrospora (Ulotrichales, Chlorophyta) based on sequence analysis ofnuclear ribosomal genes, introns and spacers. Phycologia 44, 194–201.
Luning, K., 1990. Seaweeds: Their Environment, Biogeography andEcophysiology. John Wiley & Sons, Inc., New York.
Maddison, W., Maddison, D. 2003. MacClade, 4.06. Sinauer Associates,Sunderland, MA.
Oudot-Le Secq, M.P., Fontaine, J.M., Rousvoal, S., Kloareg, B.,Loiseaux-De Goer, S., 2001. The complete sequence of a brown algalmitochondrial genome, the ectocarpale Pylaiella littoralis (L.) Kjellm.J. Mol. Evol. 53, 80–88.
Oudot-Le Secq, M.P., Kloareg, B., Loiseaux-De Goer, S., 2002. Themitochondrial genome of the brown alga Laminaria digitata: acomparative analysis. Eur. J. Phycol. 37, 163–172.
Palumbi, S.R., 1992. Marine speciation on a small planet. Trends Ecol.Evol. 7, 114–118.
Peijnenburg, K.T.C.A., Fauvelot, C., Breeuwer, J.A.J., Menken, S.B.J.,2006. Spatial and temporal genetic structure of the planktonicSagitta setosa (Chaetognatha) in European seas as revealed bymitochondrial and nuclear DNA markers. Mol. Ecol. 15, 3319–3338.
Posada, D., Crandall, K.A., 1998. Modeltest: testing the model of DNAsubstitution. Bioinformatics 14, 817–818.
Postels, A., Ruprecht, F. 1840. Illustrationes algarum, St. Petersburg.Remigio, E.A., Hebert, P.D.N., 2003. Testing the utility of partial COI
sequences for phylogenetic estimates of gatropod relationships. Mol.Phyl. Evol. 29, 641–647.
Ross, P.I., Donaldson, S.L., Saunders, G.W., 2003. A molecular inves-tigation of Mazzaella (Gigartinales, Rhodophyta) morphologicallyintermediate between Mazzaella linearis and M. splendens. Bot. Mar.46, 202–213.
Saunders, D.A., 1901. Papers from the Harriman Alaska ExpeditionXXV. The algae. In: Proceedings of the Washington Academy ofSciences 3: 391–486, 19 pls.
Saunders, G.W., 2005. Applying DNA barcoding to red macroalgae: apreliminary appraisal holds promise for future applications. Philos. T.Roy. Soc. B 360, 1879–1888.
Selivanova, O.N., Zhigadlova, G.G., 1997. Marine algae of the Com-mander Islands. Preliminary remarks on the revision of the flora. II.Phaeophyceae. Bot. Mar. 40, 9–13.
Setchell, W.A., Gardner, N. L., 1903. Algae of northwestern America.University of California Publications in Botany 1: 165–418, Plates 17–27.
Setchell, W.A., Gardner, N.L., 1925. The Marine Algae of the Pacificcoast of North America. University of California Press, Berkley.
Swofford, D.L. 2002. PAUP*. Phylogenetic Analysis Using Parsimony(*and other Methods), Version 4.0b10 PPC. Sinauer Associates,Sunderland, MA.
Widdowson, T.B., 1971a. A taxonomic revision of the genus Alaria
Greville. Syesis 4, 11–49.Widdowson, T.B., 1971b. A statistical analysis of variation in the brown
alga Alaria. Syesis 4, 125–143.Yendo, K., 1919. A monograph of the genus Alaria. J. Coll. Sci. Tokyo
Imp. Univ. 153, 1–145.Yoon, H.S., Boo, S.M., 1999. Phylogeny of the Alariaceae (Phaeophyta)
with the special reference to Undaria based on sequences of theRuBisCo spacer region. Hydrobiologia 398/399, 47–55.
Yoon, H.S., Lee, J.Y., Boo, S.M., Bhattacharya, D., 2001. Phylogeny ofthe Alariaceae, Laminariaceae, and Lessoniaceae (Phaeophyceae)based on plastid-encoded RuBisCo spacer and nuclear-encoded ITSsequences comparisons. Mol. Phyl. Evol. 21, 231–243.