a microfluidic digital melt platform for sensitive
TRANSCRIPT

A MICROFLUIDIC DIGITAL MELT PLATFORM FOR SENSITIVE BIOMARKER ANALYSIS AND PARALLELIZED PROFILING OF
MOLECULAR HETEROGENEITY
by Christine M. O’Keefe
A dissertation submitted to Johns Hopkins University in conformity with the requirements for the degree of Doctor of Philosophy
Baltimore, Maryland March 2020
© 2020 Christine O’Keefe All Rights Reserved

ii
Intended to be blank

iii
Abstract
Variability in gene regulation is a fundamental characteristic of biology, allowing
cellular adaptation in many states, such as development, stress response, and survival. In
early disease onset, genetic and epigenetic variability permit the formation of multiple
cellular phenotypes. In cancer, increased cellular plasticity ultimately results in the
foundation of a tumor with the phenotypic alterations necessary to dynamically adapt,
proliferate, metastasize, and acquire therapeutic resistance throughout the course of the
disease. One prominent form of cellular regulation is DNA methylation, an epigenetic
chemical modification that can alter gene expression. Hypermethylation-induced
silencing is known to occur early on in tumorigenesis, often in precursor phases of the
disease. Furthermore, tumors have been shown to undergo epigenetic reprogramming
throughout progression of the disease. In light of these observations, methylation
heterogeneity may serve as a novel biomarker for early cancer detection.
Early detection of cancer remains challenging, as symptoms often manifest in
later stages and current screening techniques often lack the requisite sensitivity and
specificity. To maximize effectiveness, routine screening techniques should be
noninvasive, simple, and unbiased. To this end, liquid biopsies (e.g. blood samples)

iv
containing cellular debris, such as tumor-derived cell-free DNA in the plasma, are ideally
suited towards routine screening. However, detection of tumor-derived molecules in
plasma is challenging, as they are often rare and may be eclipsed by a high background of
molecules from healthy cells. Thus a sensitive platform capable of quantifying epigenetic
heterogeneity could uncover new insights and improve early detection.
In this dissertation, I present a microfluidic digital melt platform for facile,
highly-sensitive detection and molecule-by-molecule profiling. The platform is applied
towards the quantification of epiallelic heterogeneity. Digitization of rare molecules into
thousands of microchambers followed by parallelized sequencing interrogation through
high resolution melt enables order of magnitude higher sensitivity than current techniques
and insight into new intermolecular characteristics. I also demonstrate how this platform
may be modified to complement and improve the sensing capabilities of existing
commercial technologies. Finally, I validate the potential clinical utility of this platform
through detection of methylation heterogeneity in complex clinical samples towards
noninvasive screening applications. The technical capabilities along with the operational
simplicity of this platform facilitate adoption by other laboratories and offer potential
clinical utility. This system may offer new insights into the mechanisms of epigenetic
regulation in pathogenesis, and potentially improve early diagnosis.
Advisor: Tza-Huei Jeff Wang
Committee members: Dr. Ishan Barman, Dr. Tian-Li Wang, Dr. Tza-Huei Jeff Wang

v
Acknowledgements
First I would like to thank my family for all their unconditional support
throughout the years. My parents, Fran and Jerry O’Keefe, who encouraged me when I
needed it and continued to try to help even when they started to grow frustrated with the
verbiage I used in my academic papers. My siblings, Genevieve, Thomas, and Celeste,
who occasionally slipped in some sincere words of support and encouragement when I
needed it alongside their only moderate teasing about my endless years in school. Truly, I
am incredibly grateful for such a close-knit family that keeps me grounded and can
always have a good time together.
I would like to thank God for the great many blessings He has given me. He
provided me with the tools I needed to perform this research and persevere for the last
several years in graduate school.
My principle advisor, Dr. Jeff Wang, who has been very supportive. He guided
my intellectual and professional development through the past several years of my PhD.
He constantly demanded the best of me and the lab, and drove me to reach higher and to
be able to accomplish more in my research. I also want to thank my additional mentor,
Dr. Tom Pisanic, who struggled with me through several years of troubleshooting and
disappointments, allowed me to vent in frustration, and offered encouragement to
continue working.

vi
Thanks to my thesis committee: Dr. Tian-Li Wang and Dr. Ishan Barman. I am
very grateful for the time they dedicated to helping me fulfill my requirements, and their
thoughtful suggestions on how to improve my work.
My fellow labmates were a shining light of hope throughout many difficult times
during my PhD, and I could not have sanely pursued this journey without them. The ones
who came before me, especially Helena Zec, Wen Hsieh, Natt Athamanolap, and Ye
Zhang, set a high bar for performance in the lab that I constantly strove to meet. Their
mentorship and comradery were invaluable throughout my PhD. My co-year oldtimer,
Anu Kaushik, who worked in the trenches of droplets with me. Yang Zhao, who for some
reason thought my project was worth going through the same struggle together. Fanen
Chen, Pei-Wei Lee, Alex Trick, Liben Chen, Pengfei Zhan, Dongjin Shin, Sixuan Li,
Andrew Li, Joon Soo Park, Alejandro Stark for keeping up my spirits and having fun
both inside and outside the lab.
I owe much gratitude to the scientific and private organizations that had enough
faith in me to fund my research: the National Science Foundation Graduate Research
Fellowship Program, the P.E.O. organization, and the Siebel organization. I will continue
to work so that their faith was not misplaced.
Many of my friends outside of lab supported me and put up with many rants in the
past years of PhD. Without them I might not have finished, they provided so much
encouragement. Thanks to Katy McVay, Emily Guo, Melanie Zile, Ethan Nyberg, Caitlin
Walker, Emily Rodriguez, Rachel Thompson, Laura O’Hanlon, Pippa Sykes. And thank
you, dear reader, for making it this far in my dissertation.

vii
Finally, I have to thank my now husband, Doctor Sean Hersey. As we took our
PhD journeys together, he offered daily support and understanding. Thank you for doing
all the cooking when I was busy trying to meet deadlines. Thank you for dealing with my
frustration and understanding. Thank you for trying so hard to understand all the details
of my problems so that you can try to help me with it. Thanks for writing little matlab
programs for me to help my things faster. Thanks for always pushing me to do excellent
work.

viii
Table of Contents
ABSTRACT _____________________________________________________________________________ III
ACKNOWLEDGEMENTS __________________________________________________________________ V
TABLE OF CONTENTS __________________________________________________________________ VIII
LIST OF TABLES _________________________________________________________________________ X
LIST OF FIGURES ________________________________________________________________________XI
CHAPTER 1 ____________________________________________________________________________ 1
EPIGENETICS IN EARLY CANCER EVOLUTION ______________________________________________________ 1 Cancer evolution models _____________________________________________________________ 1 Epigenetic Regulation _______________________________________________________________ 2 Epigenetic “Priming” ________________________________________________________________ 3 Variable methylation ________________________________________________________________ 4 Screening through liquid biopsies ______________________________________________________ 5 Methods of Detection _______________________________________________________________ 6 DREAMing ________________________________________________________________________ 8 Overview of dissertation ____________________________________________________________ 10 Specific Aims: _____________________________________________________________________ 12
CHAPTER 2 ___________________________________________________________________________ 17
HIGHLY PARALLELIZED MOLECULE-BY-MOLECULE ANALYSIS WITH DIGITAL MICROFLUIDICS ______________________ 17 Microfluidics and Digital Technologies _________________________________________________ 17 Digital Device Design _______________________________________________________________ 19 Device Loading and Evaporation Reduction _____________________________________________ 20 Digital PCR _______________________________________________________________________ 22 Discussion ________________________________________________________________________ 23 Methods _________________________________________________________________________ 24
CHAPTER 3 ___________________________________________________________________________ 33
MICROFLUIDIC DIGITAL HIGH RESOLUTION MELT _________________________________________________ 33 High-throughput Parallelized Real-time Analysis _________________________________________ 33 Overview of Epiallelic Profiling by HYPER-Melt __________________________________________ 35 Design of Thermo-Optical Platform ___________________________________________________ 37 Validation of HYPER-Melt System _____________________________________________________ 40 Discussion ________________________________________________________________________ 43 Materials and Methods _____________________________________________________________ 49
CHAPTER 4 ___________________________________________________________________________ 74
HIGHLY EFFICIENT DIGITAL MICROFLUIDICS BY PASSIVE GEOMETRIC IMMOBILIZATION _________________________ 74 Disparity in sample-to-analysis volumes ________________________________________________ 74

ix
Multilayer geometric manipulation ___________________________________________________ 76 Modeling and simulation of 2-dimensional device geometries ______________________________ 77 Loading efficiency in 2D vs. 3D device __________________________________________________ 79 Reducing PDMS distortion and misalignment ___________________________________________ 80 Highly efficient detection of DNA methylation ___________________________________________ 81 Epiallelic discrimination by digital melt ________________________________________________ 82 Methods _________________________________________________________________________ 84
CHAPTER 5 ___________________________________________________________________________ 98
DROPLET DIGITAL HIGH RESOLUTION MELT_____________________________________________________ 98 Overview of Droplet technologies _____________________________________________________ 98 Highly efficient loading and capturing of droplets via pseudo-sieve _________________________ 102 Device Architecture _______________________________________________________________ 103 High-throughput real-time melt curve methylation profiling from droplets ___________________ 105 Droplet Immobilization and Real-time Imaging _________________________________________ 107 Parallelized Droplet Digital High Resolution Melt (ddHRM)________________________________ 108 Methods ________________________________________________________________________ 111
CHAPTER 6 __________________________________________________________________________ 130
ASSESSMENT OF BIOMARKER PANELS ________________________________________________________ 130 Diagnostic advantages of biomarker panel assessment __________________________________ 130 Variable Sequence (Methylation-agnostic) Probe Scheme ________________________________ 134 Ratiometric Multiplexing Scheme ____________________________________________________ 135 Digital Ratiometric Multiplex PCR ____________________________________________________ 136 Microfluidic Digital N-plex Panel Identification _________________________________________ 137 Microfluidic Digital N-plex assessment of methylation heterogeneity _______________________ 138 Discussion _______________________________________________________________________ 139
CHAPTER 7 __________________________________________________________________________ 150
ANALYSIS OF METHYLATION HETEROGENEITY IN COMPLEX SAMPLES ___________________________________ 150 Challenges and Advances in screening techniques _______________________________________ 150 Methylation heterogeneity in plasma samples from liquid biopsy __________________________ 152 Challenges and Advances in Ovarian Cancer Screening ___________________________________ 154 Methylation heterogeneity in Pap Specimens __________________________________________ 156 Methods ________________________________________________________________________ 158
CHAPTER 8 __________________________________________________________________________ 169
CONCLUSION ________________________________________________________________________ 169
REFERENCES _________________________________________________________________________ 173
CURRICULUM VITALE __________________________________________________________________ 184

x
List of Tables
TABLE 1. METHYLATION DETECTION METHODS ..................................................................................... 16
TABLE 2. ASSAY PRIMERS AND SYNTHETIC TARGETS .............................................................................. 73
TABLE 3. PARAMETERS INVOLVED IN THE TWO-DIMENSIONAL MULTIPHASE FLUID MODEL OF THE
SAMPLE DIGITIZATION IN COMSOL ........................................................................................................ 88
TABLE 4. SYNTHETIC SEQUENCES OF CDO1........................................................................................... 125

xi
List of Figures
FIGURE 1.1. GENETIC VARIABILITY IN TISSUE STAGES ............................................................................. 14
FIGURE 1.2: BISULFITE CONVERSION OF DNA ......................................................................................... 15
FIGURE 2.1. ULTRA-THIN MICROFABRICATION ....................................................................................... 27
FIGURE 2.2. MICROFLUIDIC DEVICE DESIGN AND OPERATION. .............................................................. 28
FIGURE 2.3. EVAPORATION DURING PCR. .............................................................................................. 29
FIGURE 2.4. DIGITAL PCR RESULTS ......................................................................................................... 30
FIGURE 2.5. DIGITAL QUANTIFICATION ACCURACY ................................................................................ 32
FIGURE 3.1. HYPER-MELT WORKFLOW. .................................................................................................. 56
FIGURE 3.2. ILLUMINATION OPTIMIZATION. .......................................................................................... 58
FIGURE 3.3. DIGITAL MELT PLATFORM ................................................................................................... 59
FIGURE 3.4. MELT CURVE ACQUISITION AND DISCRIMINATION BY MELT TEMPERATURE. ..................... 61
FIGURE 3.5. PIXEL-SPACE DEFINITION MAPPING. ................................................................................... 62
FIGURE 3.6. DETECTED VS. EXPECTED DNA COPY NUMBER. ................................................................... 63
FIGURE 3.7. HYPER-MELT ANALYSIS. ...................................................................................................... 64
FIGURE 3.8. COMPARISON OF HYPER-MELT WITH DDPCR. ..................................................................... 66
FIGURE 3.9. ANNEALING TEMPERATURE ON-CHIP OPTIMIZATION. ........................................................ 68
FIGURE 3.10. VALIDATION OF MSP ASSAY .............................................................................................. 69
FIGURE 3.11. DATA PROCESSING FILTER OPTIMIZATION ........................................................................ 70
FIGURE 3.12. GENOMIC VALIDATION OF HYPER-MELT PLATFORM ......................................................... 72
FIGURE 4.1. MULTILAYER DEVICE GEOMETRY ........................................................................................ 87
FIGURE 4.2. SIMULATION RESULTS ......................................................................................................... 89
FIGURE 4.3. 2D VS. 3D COMPARISON OF FILL RATE AND WASTE VLUME ................................................ 90
FIGURE 4.4. LOADING VOLUME VS. REACTION SUCCESS ........................................................................ 91
FIGURE 4.5. PDMS WARPING VS. THICKNESS ......................................................................................... 93
FIGURE 4.6. MULTILAYER FABRICATION PROTOCOL ............................................................................... 95
FIGURE 4.7. LOADING AND DETECTION EFFICIENCY ............................................................................... 96
FIGURE 4.8. EPIALLELIC DISCRIMINATION .............................................................................................. 97
FIGURE 5.1. DROPLET TRAPPING DEVICE ARCHITECTURE ..................................................................... 114

xii
FIGURE 5.2. BACK-PRESSURE RELIEF ..................................................................................................... 116
FIGURE 5.3. FULLY LOADED DEVICE WITH 500PL DROPLETS ................................................................. 117
FIGURE 5.4. CDO1 DREAMING WITH QX200 SYSTEM ........................................................................... 119
FIGURE 5.5. QUANTIFICATION ACCURACY ............................................................................................ 120
FIGURE 5.6. SIZE VERSATILITY .............................................................................................................. 122
FIGURE 5.7. HIGH-TEMPERATURE IMMOBILIZATION............................................................................ 123
FIGURE 5.8. IMAGE PROCESSING AND DROPLET SEGMENTATION ........................................................ 124
FIGURE 5.9. DROPLET DIGITAL HIGH RESOLUTION MELT ...................................................................... 126
FIGURE 5.10. SNR AND FLUORESCENCE LEAKAGE ANALYSIS................................................................. 127
FIGURE 5.11. DROPLET GENERATION DEVICES ..................................................................................... 128
FIGURE 6.1. OVERVIEW OF MULTIPLEX HYPER-MELT PROFILING ......................................................... 143
FIGURE 6.2. METHYLATION-AGNOSTIC PROBES ................................................................................... 144
FIGURE 6.3. HIGHLY MULTIPLEXED RATIOMETRIC PROBE SCHEME ...................................................... 145
FIGURE 6.4. RATIOMETRIC IDENTIFICATION PRINCIPLE ........................................................................ 146
FIGURE 6.5. SIMULTANEOUS LOCUS IDENTIFICATION AND PROFILING ................................................ 147
FIGURE 6.6. 4-COLOR IMAGING PLATFORM ......................................................................................... 149
FIGURE 7.1. CLINICAL SAMPLE WORKFLOW AND PATIENT CHARACTERISTICS ...................................... 161
FIGURE 7.2. NDRG4 COPIES DETECTED IN PLASMA SAMPLES ............................................................... 162
FIGURE 7.3. LIQUID BIOPSY (CELL-FREE DNA) BIOMARKER DETECTION AND ANALYSIS VIA HYPER-MELT.
............................................................................................................................................................. 164
FIGURE 7.4. METHYLATION HETEROGENEITY IN PAP SPECIMENS ......................................................... 167
FIGURE 7.5. METHYLATED IRX2 IN CANCER AND HEALTHY PATIENTS ................................................... 168

1
Chapter 1
EPIGENETICS IN EARLY CANCER EVOLUTION
Cancer evolution models
Despite the well-known advantages of early cancer detection, many types of cancer
are not detected until late stages, when treatment is more challenging and the chance of
survival is much lower. Deficiency in early detection may be attributed to both lack of
understanding of early cancer development as well as inadequate or lack of compliance
with current screening methods. In order to improve the chances of survival, early
detection is critical. There are two avenues of approach to increase early detection rates.
First, better diagnostic methods should be used that can reliably detect cancer at its early
stages. Next, these early biomarkers should be detectable by a simple, routine screening
method that is inexpensive and reasonably convenient.
During carcinogenesis, cancers acquire functional characteristics that result in
unregulated and aggressive growth. Cancer cells undergo malignant transformation
through a progressive acquisition of genomic aberrations, such as mutations, insertions,
and deletions, that disrupt the normal regulatory processes of the cell. Numerous studies

2
have uncovered several “driver mutations” which are well-associated with carcinogenesis
[1], [2]. However, due to the numerous possible driver mutations per cancer and their lack
of specificity, their diagnostic utility is limited to a small fraction of patients [3].
A universal characteristic of cancers is genomic instability. Many tumors exhibit
intratumoral heterogeneity that can be observed early in carcinogenesis [1], [4]. Most
models predict that a gradual loss of genomic stability results in the clonal expansion of
abnormal cells with increased cellular plasticity [4]–[6]. Tumors are believed to follow a
Darwinian selection model, in which a phenotype eventually arises expressing the
characteristics of a founder tumor cell that thereby drives tumorigenesis. Further clonal
expansion gives rise to heterogeneous clonal populations, permitting the tumor to acquire
many of the hallmark phenotypic alterations that allow cancer to dynamically adapt,
proliferate, metastasize, and acquire therapeutic resistance throughout the progression of
the disease [1], [4], [7]–[9].
Epigenetic Regulation
There are many levels of cellular regulation. Historically, many studies have
focused on the regulation and aberrations thereof at the genetic level, i.e. the base code of a
cell’s DNA. However, transcription and translation of the genetic code goes through
numerous checkpoints and undergoes several modifications before reaching functional
maturity. Modifications that affect gene expression and are not direct changes to the base
code are broadly encompassed in the field of epigenetics. Epigenetic changes include
modifications to the backbone of DNA, to the chromatin, to proteins, or to RNA. Most

3
tumors exhibit hundreds-to-thousands-fold more epigenetic aberrations than mutations
[10].
Epigenetic alterations are of particular interest because, unlike genetic alterations,
they are reversible. Therefore, identifying tumor-driven epigenetic changes holds promise
for treatment options. In fact, several epigenetic therapies are already clinically available
[11]–[13]. Results of most treatments are mixed, which warrants further investigation into
epigenetic mechanisms.
The most well-studied form of epigenetic modification is DNA methylation, a
chemical modification that results in an additional methyl group to a cytosine nucleotide
that is followed by a guanine (CpG), considered the “backbone” of DNA. The
accumulation of these methylation events, or hypermethylation, can contribute to gene
silencing and is known to be aberrant in cancer [12], [14], [15]. Interestingly, many tumors
simultaneously exhibit global DNA hypomethylation [9], [13], [14], [16], indicating that
methylation has a profound effect on cellular regulation. Recently, studies have found that
tumors exhibit DNA hypermethylation silencing in the promoter region of tumor
suppressor genes (TSGs) early in tumorigenesis, prompting several studies investigating
the use of DNA hypermethylation as biomarkers for early detection of cancer [16], [17].
Epigenetic “Priming”
Many studies have attempted to uncover the molecular origins of cancer, but the
foundational events are still elusive and thus are under academic debate. Traditionally,

4
progressive mutations are thought to be the driving events of tumorigenesis. However,
recent evidence points to epigenetic and methylation aberrations as preceding events to
driver or passenger mutations, which “prime” the genome for genetic abnormalities [18].
Several models have predicted that epigenetic plasticity within chromatin structure, histone
variants, or miRNAs, can permit or even cause genetic alterations [4]–[6], [16].
Epigenetic silencing occurs most frequently at earlier, precancerous stages of tumor
development, and thus can be detected during or even prior to the development of
precursor lesions [19]–[21]. There is also recent evidence to support that epigenetic
aberrations such as DNA methylation may occur before genetic alterations (such as
mutations) [18], [22]. For example, many colon cancers demonstrate overexpression of the
Wnt pathway [23]. Precancerous lesions were found to have hypermethylation in the SFRP
gene family, which interact with Wnt pathway receptors [23], [24]. Hypermethylation-
induced silencing of these genes persisted in those lesions that progressed to primary colon
cancers, whereas none of these lesions possessed any mutations known to be related to the
Wnt pathway. This suggests that epigenetic silencing predisposed the precursor legions to
genetic changes associated with clonal expansion, ultimately leading to tumorigenesis [18].
This process has been described as “epigenetic sensitization,” in which aberrant epigenetic
events confer the neoplasticity required for clonal expansion.
Variable methylation
DNA methylation occurs as a stochastic process, and can thus vary on a patient-by-
patient and even cell-by-cell basis [1], [25], [26]. In fact, the extensive level of

5
“nonsynonymous” alterations, that is those not shared between patients, indicates that
carcinogenesis many occur via numerous possible pathways [1]. The precise effects of this
variability and heterogeneity are only beginning to be elucidated. Nonetheless, very recent
studies have observed that intermediate DNA methylation heterogeneity is predictive of
metastatic versus localized clones in Ewing sarcoma [27], and that recurrent methylation
reprogramming of numerous CpG sites across the epigenome in acute myeloid leukemia
patients occurs throughout the progression of disease [28]. Therefore, further investigation
into the temporal scope of DNA methylation heterogeneity on a single CpG site basis
could provide greater insight into tumor cellular reprogramming mechanisms.
A number of mathematical models have posited that variability in DNA
methylation patterns starts to increase in adenomous precursor tissue [29], [30]. Using
meta-analysis of genome-wide methylation data, some studies have shown that measuring
variance in CpG methylation within a region can serve as a better predictor of disease than
mean methylation levels [20], [31]. This model corresponds intuitively with our
understanding of stochasticity in cellular regulation [32]. In one study, hypervariable CpG
sites were identified in patients three years prior to diagnosis of cervical cancer [30].
We propose that analyzing this genetic variability is key to understanding critical
phases in cancer development and progression (Figure 1.1). By better characterizing
genetic and epigenetic variability, especially in precancerous phases, we hope to improve
early detection and diagnosis.
Screening through liquid biopsies

6
Recently it has been found that disease-associated cell-free DNA (cfDNA) can be
readily found in patient blood plasma. This discovery has opened new avenues for
molecular diagnostics and prognostics in many diseases [33]–[36]. So-called “liquid
biopsies” of cell-free DNA (cfDNA) provide several advantages over traditional
techniques by offering sampling that is noninvasive, heterogeneous, and unbiased,
prompting increasingly more research into its clinical utility as a diagnostic and theranostic
platform [37]–[41]. Perhaps the most prominent applications of liquid biopsies are aimed
at early detection and therapeutic monitoring of cancer, whereby liquid biopsies can
provide a simple, noninvasive means of sampling DNA derived from throughout the body
[42]–[44]. In fact, several studies have shown that genetic and epigenetic molecular
aberrations, such as mutations, copy number variations and DNA methylation correlate
with tumor evolution and can likewise be found in cfDNA in the plasma [45]–[48].
Liquid biopsies provide a simple and non-invasive solution to high-throughput
analysis of patient samples, and are currently in use to monitor therapeutic resistance,
prognosis, and in screening for biomarkers. However, cfDNA is typically present in
concentrations of <50ng/ml in the plasma [17], of which fractions as low as 0.01% may be
tumor-derived strands [42]. Of the tumor-derived fraction, we endeavor to examine the
methylation heterogeneity among epi-alleles. Consequently, detection of these ultra-rare
biomarkers requires extremely sensitive and specific analysis techniques.
Methods of Detection
7
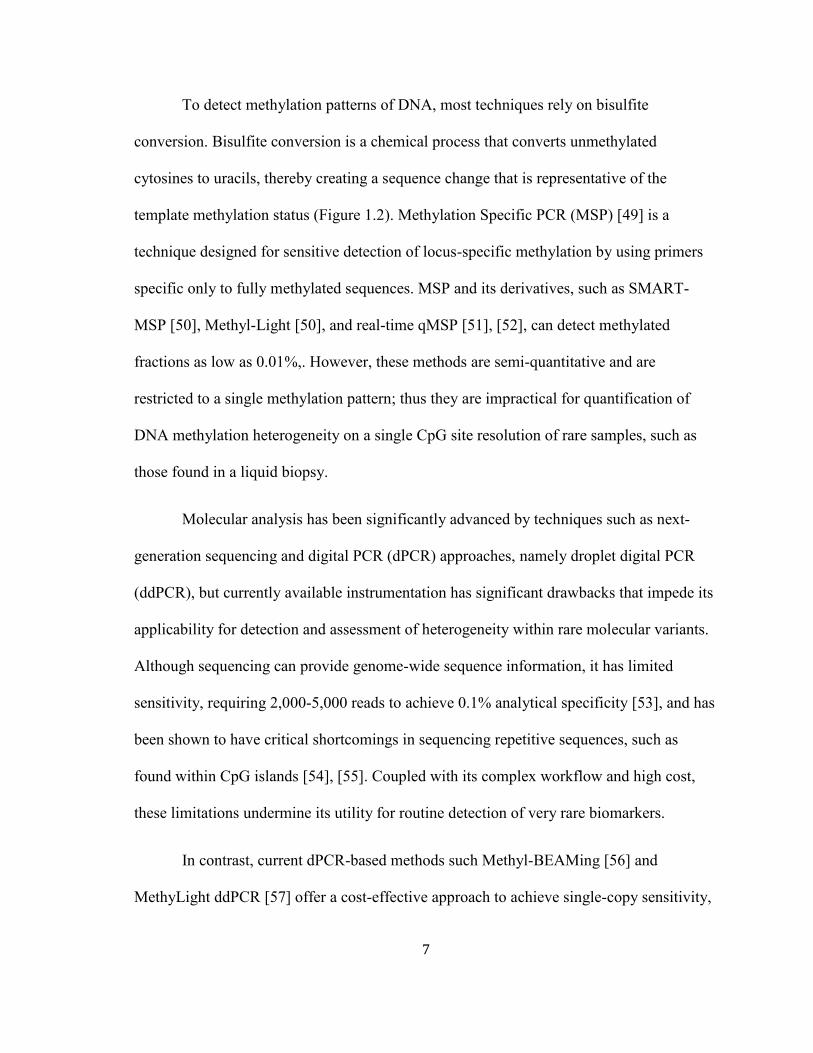
To detect methylation patterns of DNA, most techniques rely on bisulfite
conversion. Bisulfite conversion is a chemical process that converts unmethylated
cytosines to uracils, thereby creating a sequence change that is representative of the
template methylation status (Figure 1.2). Methylation Specific PCR (MSP) [49] is a
technique designed for sensitive detection of locus-specific methylation by using primers
specific only to fully methylated sequences. MSP and its derivatives, such as SMART-
MSP [50], Methyl-Light [50], and real-time qMSP [51], [52], can detect methylated
fractions as low as 0.01%,. However, these methods are semi-quantitative and are
restricted to a single methylation pattern; thus they are impractical for quantification of
DNA methylation heterogeneity on a single CpG site resolution of rare samples, such as
those found in a liquid biopsy.
Molecular analysis has been significantly advanced by techniques such as next-
generation sequencing and digital PCR (dPCR) approaches, namely droplet digital PCR
(ddPCR), but currently available instrumentation has significant drawbacks that impede its
applicability for detection and assessment of heterogeneity within rare molecular variants.
Although sequencing can provide genome-wide sequence information, it has limited
sensitivity, requiring 2,000-5,000 reads to achieve 0.1% analytical specificity [53], and has
been shown to have critical shortcomings in sequencing repetitive sequences, such as
found within CpG islands [54], [55]. Coupled with its complex workflow and high cost,
these limitations undermine its utility for routine detection of very rare biomarkers.
In contrast, current dPCR-based methods such Methyl-BEAMing [56] and
MethyLight ddPCR [57] offer a cost-effective approach to achieve single-copy sensitivity,

8
but also only detect a specific methylation pattern, thus precluding their ability to detect
and quantitate heterogeneous methylation patterns. An ideal technology should be able to
combine the advantages of these two techniques, and permit detection of rare and
heterogeneous DNA patterns (Table 1).
High Resolution Melt (HRM) is a facile means of assessing sequence variations
within a target locus by measuring the release of DNA intercalating dye during
temperature-dependent denaturation. Current commercial dPCR technologies, such as the
QX200 (Biorad) and Raindance systems, have limitations preventing ready adaptation to
HRM as a molecular profiling tool, while most non-commercial ddPCR technologies with
real-time monitoring capabilities require droplet trapping before monitoring, severely
compromising throughput [58], [59]. Although a number of commercial array-based dPCR
strategies do exist, namely QuantStudio (ThermoFisher) and Biomark (Fluidigm), they
lack HRM analysis capabilities, likely due to numerous technical challenges. The limited
number of in-house attempts have generally been encumbered by significant obstacles,
such as maintaining thermal control and uniformity throughout the device [60], achieving
sufficient sequence resolution of a few nucleotides [61], observing dim fluorescence and
optical noise from small reaction volumes as well as managing stochastic amplification
variations from digital starting concentrations [62]. These issues primarily stem from
fundamental limitations in commercially-available hardware or the use of off-the-shelf
analysis software.
DREAMing

9
To that end, we designed and developed an assay, termed Discrimination of Rare
Epi-Alleles by Melt (DREAMing), that interrogates the methylation status of a target
sequence on a molecule-by-molecule basis, described fully in our previous work [63]. In
essence, primers were developed for a PCR-type assay that are methylation-preferred, such
that all epi-allelic variants of the target sequence can be amplified, but methylated
templates experience an amplification bias, permitting single-molecule sensitivity amongst
high background DNA. The methylation status is interrogated by DNA Melt analysis,
which utilizes an intercalating dye to visualize denaturation of ds-DNA during temperature
ramping. The temperature at which exactly half of the strand is denatured is termed the
“melt temperature” for that sequence. A single methylation mark, after bisulfite
conversion, causes the amplicon to denature at a higher temperature due to the increased
stability of C-G hydrogen bonds and base stacking. In DREAMing, two melt temperatures
are identified, one for the unmethylated background and one for the methylated variant.
Due to the digitization of methylated variants, DREAMing represents a quantitative
analysis of DNA methylation heterogeneity.
While DREAMing has shown many promising results, its initial implementation
contains some drawbacks. In principle, DREAMing requires digitization of rare template
molecules from a bulk solution. The probability of sample digitization within a well is
given by the Poisson distribution:
𝑃(𝑛, 𝜆) = (𝜆𝑛𝑒−𝜆)/𝑛!,
where 𝑛 is the number of target molecules and 𝜆 is the ratio of positive wells to total wells.
Thus for the sample to be confidently digitized in a 96-well plate, no more than 9 of the

10
wells should contain the rare target molecule, severely limiting the dynamic range and
amount of heterogeneity that can be assessed. One possibility to circumvent these issues is
the use of a larger plate or multiple plates. However, many plates are needed to
significantly improve the sensitivity, and doing so would be both cost and time-prohibitive
in reagent consumption and excessively long reaction times. Thus, while the DREAMing
technique provides a means of evaluating methylation at single-copy sensitivity, the
unavailability of commercial high-density, HRM-capable instrumentation restricts its use
for many research and clinical applications.
Overview of dissertation
The goal of this dissertation is to provide a facile means of detecting and
quantifying rare and heterogeneous genetic and epigenetic biomarkers in complex samples
among a high background population. To address this technological gap, I utilized a
comprehensive bottom-up approach involving both hardware and software solutions aimed
at addressing these technical challenges. This was achieved by design and fabrication of a
microfluidic platform called HYPER-Melt (High-density Enumeration and Profiling by
Melt), consisting of a 4096 nanoliter-well static array microfluidic device and optical-
thermal platform for digital PCR and digital HRM. This high-density array can digitize and
analyze thousands of individual molecules while limiting reagent consumption to that of a
typical microtiter well, and provide an absolutely quantitative measure of sequence
heterogeneity within a target locus throughout a molecular population. The presented all-
in-one chip design is simple to fabricate and use, offers a consolidated workflow, enables

11
rapid and automatic loading and digitization, and is robust to reaction conditions. The
optical-thermal setup minimizes light scattering and thermal instability, and I introduce a
post-processing software solution that can be employed to circumvent irregularities
imposed by hardware limitations thereby permitting reproducible HRM-curve acquisition.
I incorporated the DREAMing technique into the HYPER-Melt platform to achieve
highly parallelized assessment of intermolecular methylation variation at single-copy
sensitivity. The capabilities of this platform were validated through serial dilutions of
mixed epialleles, with demonstrated detection limits as low as 1 methylated variant in
2,000,000 unmethylated templates (0.00005%) of a classic tumor suppressor gene,
CDKN2A (p14ARF).
Next, I improved the applicability of this platform towards detection of rare
biomarkers by improving the efficiency of target detection. By implementing a multilayer
device design and other geometric strategies, flow through the device can be passively
manipulated to encourage less sample waste. I demonstrated improvements in loading and
detection efficiency of the platform, resulting in an increased detection efficiency from
15% to 80%. Furthermore, I describe a novel capture device that can bridge the digital melt
platform with existing commercial technologies for wider adoption and higher-throughput
towards large patient cohorts.
Next, I expanded the capabilities of the platform by enabling the assessment of
methylation heterogeneity of biomarker panels through development of a dual-probe
identification scheme that is fundamentally scalable to high degrees of multiplexing. The
strategy involves ratiometric probe-based identification, incorporating “wobble” bases in

12
order to form methylation-agnostic probes. In addition, I designed and developed a
multicolor imaging platform to enable rapid target identification, capable of wide-field
fluorescence imaging of up to four colors.
Finally, I assessed the clinical utility of this platform as a novel screening tool for
cancer in complex biological fluids. First, I present a digital assay for and N-myc
downstream-regulated gene 4 (NDRG4), a tumor suppressor gene that is commonly
methylated in colorectal cancer. I discriminated methylation patterns of the NDRG4 locus
in liquid biopsies of healthy and colorectal cancer patients. Next, I present a high-
throughput device for assessment of methylation biomarkers in DNA extracted from Pap
Specimens in both healthy and ovarian cancer patients.
Overall, the HYPER-Melt platform allows for extremely sensitive quantification
and analysis of methylation heterogeneity, and provides multi-dimensional information
about single molecules that could offer greater understanding of intermolecular variability
with respect to biological processes such as carcinogenesis and development.
Specific Aims:
1. Develop a microfluidic platform capable of ultra-sensitive detection and HRM-
based discrimination of locus-specific sequence modifications.
1.1 Develop and fabricate a microfluidic device for evaporation-resistant dPCR
1.2 Design and construct a thermal-optical platform for parallelized, high-resolution melt
curve acquisition
1.3 Develop scalable image processing and data analysis pipeline for epiallelic
discrimination

13
2. Develop a high-throughput device for efficient sample loading and compatibility
with commercial instrumentation.
2.1 Improve microfluidic array to detect and discriminate rare epialleles with minimal
sample loss
2.2 Perform ultra-high throughput droplet-based epiallelic discrimination for commercial
compatibility
2.3 Develop image segmentation method for real-time droplet analysis
3. Develop the capability for assessment of methylation patterns of a panel of
biomarkers.
3.1 Demonstrate feasibility of ratiometric fluorescence multiplexing scheme
3.2 Construct multicolor fluorescence optical instrumentation
4. Assess the performance of quantifying DNA methylation heterogeneity in complex
samples in noninvasive sampling approaches.
4.1 Detect and quantify methylation heterogeneity of lung cancer markers on circulating
DNA from liquid biopsies
4.2 Detect and quantify methylation heterogeneity of ovarian cancer markers in cervical-
vaginal fluid

14
Figure 1.1. Genetic Variability in Tissue Stages
The genetic variability of cancer is predicted to be highest at precancerous stages, just
before neoplastic transformation. Therefore, genetic variability may be a candidate
biomarker for early cancer detection.

15
Figure 1.2: Bisulfite Conversion of DNA
After bisulfite conversion, unmethylated cytosines are converted to uracil, but methylated
cytosines are not. After PCR, this results in a sequence change.

16
Table 1. Methylation Detection Methods
Existing technologies for quantifying methylation are assessed for their sensitivity and
quantitation of heterogeneity. Red indicates insufficient performance and green indicates
sufficient.

17
Chapter 2
HIGHLY PARALLELIZED MOLECULE-BY-
MOLECULE ANALYSIS WITH DIGITAL
MICROFLUIDICS
Microfluidics and Digital Technologies
Many diseases constitute intermolecular heterogeneity early in development as a
fundamental means to acquire a selective advantage and proliferate. Notably, even
infrequent outliers in a population can significantly alter clinical outcome. To better
understand cellular or molecular populations on a molecule-by-molecule basis requires
efficient methods of single-molecule analyses. Traditional PCR analysis techniques, such
as quantitative PCR (qPCR), detect an ensemble measurement of all molecules present in a
solution. Due to the requirement of standards for quantification, qPCR is only semi-
quantitative. Furthermore, when target molecules exist in a high background, qPCR often
demonstrates insufficient sensitivity for detection. To perform a true molecule-by-molecule

18
analysis, each molecule must be segregated from the rest of the population. In traditional
formats, physical separation of every molecule in solution is unpractical and requires
exhaustive use of reagents and materials.
The advent of digital microfluidic technologies has significantly improved single
molecule detection and analysis. Microfluidics enables rapid manipulation of small
volumes of fluid, thereby facilitating digitization of individual molecules into discrete
chambers. The ability to compartmentalize samples into droplets for high-throughput
measurements has greatly improved sensitivity towards detection of rare molecules and has
opened doors for new insights into single cell and single molecule analyses [64]–[68].
Digital analysis provides much higher sensitivity as well as absolute quantification; thus is
ideally suited for detection of rare molecules and quantification of intermolecular
heterogeneity.
Two primary strategies have been proposed for microfluidic digitization of samples
into small volumes. The first is a static array, in which the fluid is loaded into a low-
aspect-ratio planar device and subsequently divided into individual chambers of sub-
microliter volumes. Alternatively, a volume of aqueous solution may be serially emulsified
into droplets. Droplet platforms have fundamentally higher throughput potential, but often
involve more complex instrumentation and are not suited towards real-time analyses.
Therefore, we focus our attention primarily on the static microchamber strategy to achieve
real-time molecule-by-molecule profiling.
There are two fundamental challenges in performing digital PCR (dPCR) on sub-
microliter volumes. First, the small volumes are highly susceptible to evaporation, thus
19
eliminating any signal. Second, the individual reaction chambers must remain robustly
digitized throughout the reaction to prevent cross-contamination and false positives.
Several microfabricated chips for digital PCR have been proposed by other laboratories.
To address evaporation, most of them involve a complicated fabrication step to insert an
evaporation barrier [69], [70]. While effective, this step complicates the fabrication process
and is not scalable. To digitize the chambers, most designs utilize mechanically-intensive
micro-valves for partitioning [69]. Actuated microfluidic valves require increased
complexity in microfabrication and in device operation. During the repeated fabrication
step, multiple layers, a valve and a fluidic layer, must be fabricated and aligned. Then, in
order to actuate the valves, a complex pressure regulation system with multiple inputs and
outputs is required. Thus, the complex fabrication and operational equipment have hitherto
significantly hindered adoption of digital analysis techniques.
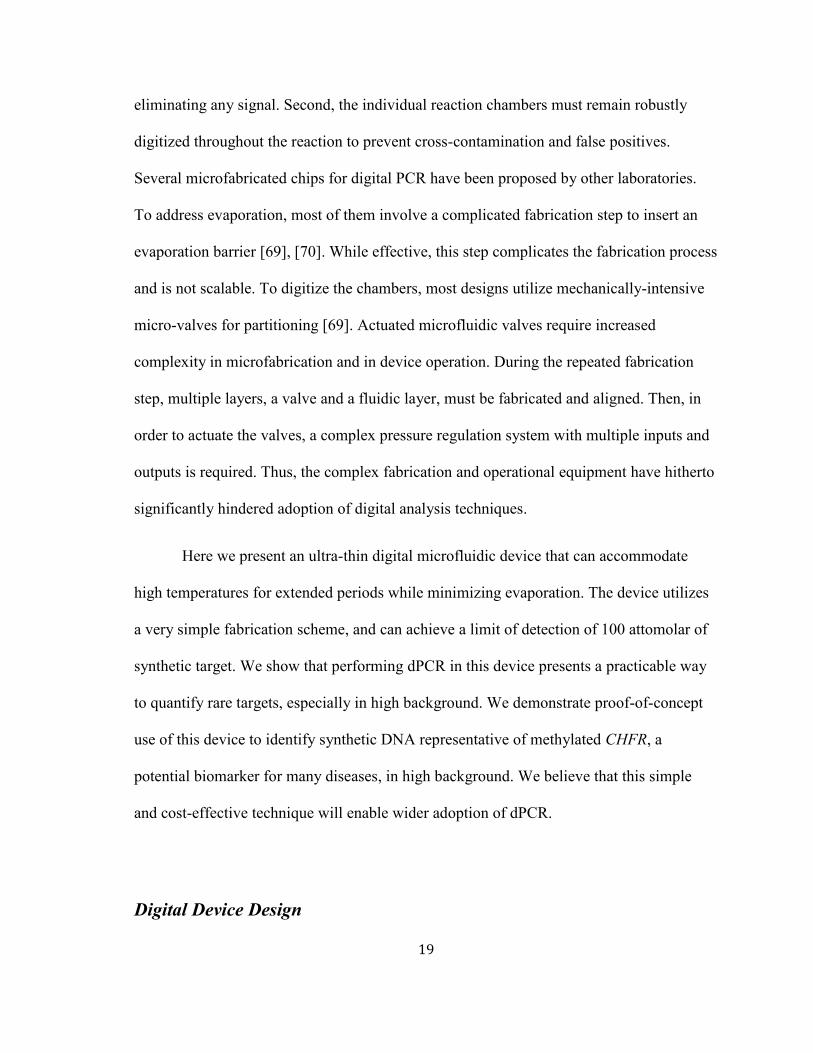
Here we present an ultra-thin digital microfluidic device that can accommodate
high temperatures for extended periods while minimizing evaporation. The device utilizes
a very simple fabrication scheme, and can achieve a limit of detection of 100 attomolar of
synthetic target. We show that performing dPCR in this device presents a practicable way
to quantify rare targets, especially in high background. We demonstrate proof-of-concept
use of this device to identify synthetic DNA representative of methylated CHFR, a
potential biomarker for many diseases, in high background. We believe that this simple
and cost-effective technique will enable wider adoption of dPCR.
Digital Device Design

20
We sought to prevent evaporation without the need for specialized equipment or
materials and without the addition of layers that may introduce noise in the fluorescence
signal. The design presented here emphasizes simplicity and avoids such complications by
utilizing a single fabrication layer, surface-tension partitioning, and readily available
laboratory equipment. Furthermore, surface tension-based partitioning can be scaled to
higher density arrays and higher degrees of digitization in future work.
In our device, sample loss and optical scattering were mitigated by the development
and use of an ultra-thin fabrication technique (Figure 2.1) to reduce the external volume of
PDMS. We aimed to fabricate a single pattern layer with <25 µm between the height of the
pattern and the surface of the PDMS. However, PDMS membranes with a thickness of less
than ~100 µm experience strong adhesion to a high-aspect-ratio silicon mold, and are
likely to tear during removal, damaging both the mold and chip. Therefore, our technique
utilizes a sacrificial PDMS layer to enable imprinted-release of the 60 µm pattern layer
from the mold without tearing and with high reproducibility. The incorporation of the
ultra-thin pattern layer, a glass coverslip, and hydration lines effectively prevents
evaporation during digital PCR [71], minimizes optical interference, and reduces thermal
deviation, critical to digital melt analysis.
We next sought to validate this design for its two primary functions: (1) to examine
whether the new fabrication method sufficiently inhibited evaporation and permitted
repeated thermal cycling and (2) whether dPCR could be executed on the device.
Device Loading and Evaporation Reduction

21
To provide simplicity in operation, the device utilizes a vacuum-assisted loading
method followed by surface-tension partitioning to rapidly fill and digitize each
microchamber. Samples were initially prepared by mixing the reagents and sample off-
chip. The chip undergoes desiccation after fabrication to produce a negative pressure
differential across the seal of the inlet (Figure 2.2). When punctured, the sample was drawn
into the device by the force of the vacuum, filling all the wells in less than five seconds.
Next, an oil-based solution is pressure-driven through the channels. Surface tension
between the partitioning oil and the aqueous reaction mixture prevents the oil from
entering the wells, thus isolating and digitizing the template molecules, typically in less
than 3 minutes. During the PCR reaction, the oil remains pressurized to prevent the sample
from exiting into the channels. The addition of PDMS in the partitioning oil produces a
solidified, permanent barrier between reaction chambers that is maintained throughout the
assay. This technique allows the microfluidic chip to be easily transported for digital melt
or other analysis without requiring continuous pressurization, and minimizes
contamination risk by locking the post-PCR samples in place.
The simple, thin-chip microfabrication technique employed reduced the
evaporation by an order of magnitude compared to traditional microfluidic devices, which
overcomes a critical problem for high temperature assays. Given the same reaction
conditions, an average of 8% evaporation can be seen per well on the thin chip, whereas
80% of the reaction evaporates after 60 cycles on a device with standard thickness (Figure
2.3). This reduction allows for assays that require many cycles, such as high-sensitivity
single-molecule analyses, to be completed on the microfluidic chip.

22
Digital PCR
After amplification, fluorescent images of the device were acquired from a
Typhoon scanner. The resultant image was loaded into Matlab for analysis, and the
average fluorescence of each well was calculated. Each well may be identified by a
binarization of the grayscale image using an automatic threshold defined by Matlab’s built-
in Otsu method. After processing, plotting the average fluorescent intensity of each well
produces a bimodal histogram, (Figure 2.4. and an average signal to background ratio of
10:1 was calculated. A sample raw image can be seen in Figure 2.4. The two populations
are separated by Matlab’s multithresh, and the resulting number of positive and negative
wells are counted. The occupancy can be calculated using the equation
Occupancy = Ntotal * LN (Ntotal/Nnegative ) ,
which assumes a Poisson distribution of positive target throughout the wells of the
chip, where N is the number of wells.
The microfluidic device can be used to perform digital PCR across a range of
concentrations. The segmentation of the reaction mixture into many wells reduces the
background such that single events become quantifiable. We demonstrated digital PCR for
concentrations ranging from 100 – 0.1 fM. The calculated results closely match the
expected results, as shown in Figure 2.5. A linear fit of the data produces a line with R2 =
0.999 and a slope of 0.88. These results indicate that the device is incredibly precise,
although roughly 10% of the target DNA may be lost during sample preparation or during
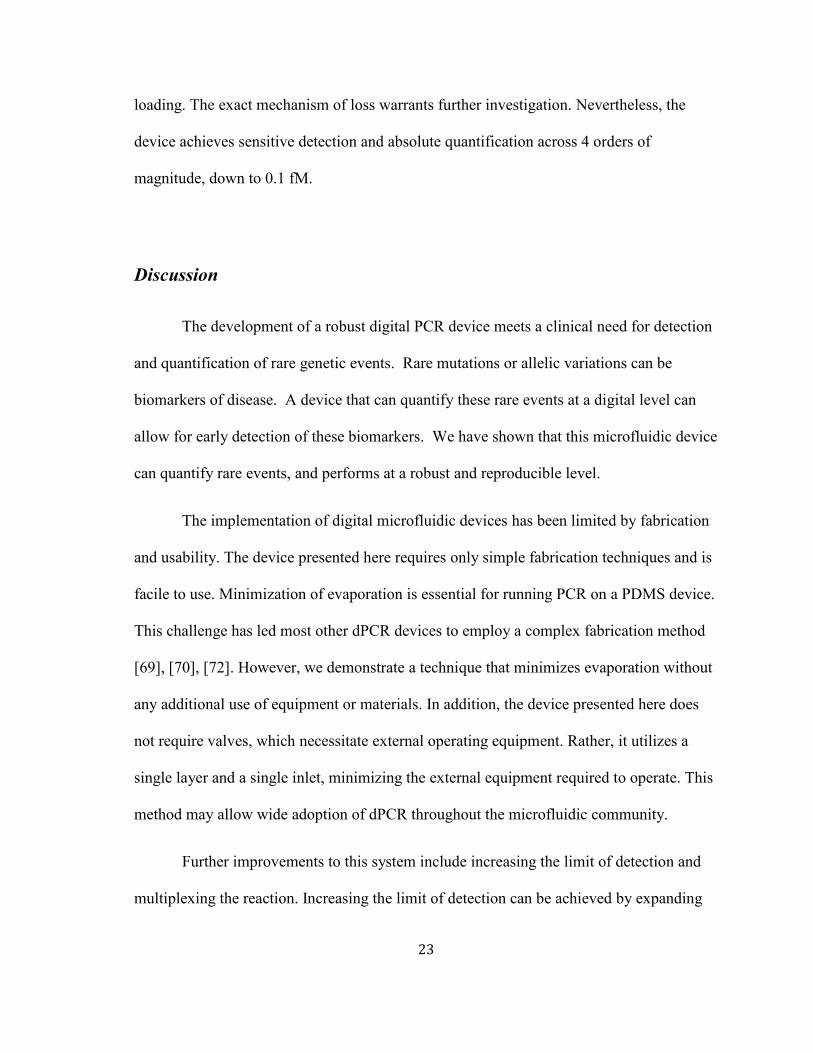
23
loading. The exact mechanism of loss warrants further investigation. Nevertheless, the
device achieves sensitive detection and absolute quantification across 4 orders of
magnitude, down to 0.1 fM.
Discussion
The development of a robust digital PCR device meets a clinical need for detection
and quantification of rare genetic events. Rare mutations or allelic variations can be
biomarkers of disease. A device that can quantify these rare events at a digital level can
allow for early detection of these biomarkers. We have shown that this microfluidic device
can quantify rare events, and performs at a robust and reproducible level.
The implementation of digital microfluidic devices has been limited by fabrication
and usability. The device presented here requires only simple fabrication techniques and is
facile to use. Minimization of evaporation is essential for running PCR on a PDMS device.
This challenge has led most other dPCR devices to employ a complex fabrication method
[69], [70], [72]. However, we demonstrate a technique that minimizes evaporation without
any additional use of equipment or materials. In addition, the device presented here does
not require valves, which necessitate external operating equipment. Rather, it utilizes a
single layer and a single inlet, minimizing the external equipment required to operate. This
method may allow wide adoption of dPCR throughout the microfluidic community.
Further improvements to this system include increasing the limit of detection and
multiplexing the reaction. Increasing the limit of detection can be achieved by expanding

24
the grid of wells, therefore increasing the partitioning of the sample. One challenge in
incorporating an increased number of reaction wells is the resolution of the imaging
system. A new, ultra-high resolution imaging mechanism is required in order to increase
well density without expanding the size of the chip beyond feasible dimensions.
Multiplexing the reactions on the device becomes less challenging with a high-resolution
imaging system. Without separation of targets, however, care must be taken to avoid
nonspecific amplification. Nevertheless, this method of fabrication will drive adaptation
and progress in the field of digital PCR.
In this work, we have applied a unique fabrication method to build ultra-thin
PDMS-based microfluidic devices for dPCR. The method can be adopted in any laboratory
and obviates the need for complicated processes such as CVD or spin-coating of polymers,
thereby limiting the time and cost of fabrication, as well as making dPCR technology more
accessible. Wider adoption of this sensitive and powerful technology may facilitate
advances in detection of rare biomarkers.
Methods
Device Fabrication
The device consists of five layers, a break-out of which is shown in Figure 2.2A.
One blank wafer is spun with 15:1 PDMS at 2100 rpm and another blank is spun with 6:1
PDMS at 100 rpm, which serves as a temporary layer. After baking for six minutes, the 6:1
blank layer is peeled from the wafer and placed over the 15:1 PDMS. This combination
bakes for six more minutes to loosely bond the two PDMS layers. The two bonded PDMS
25
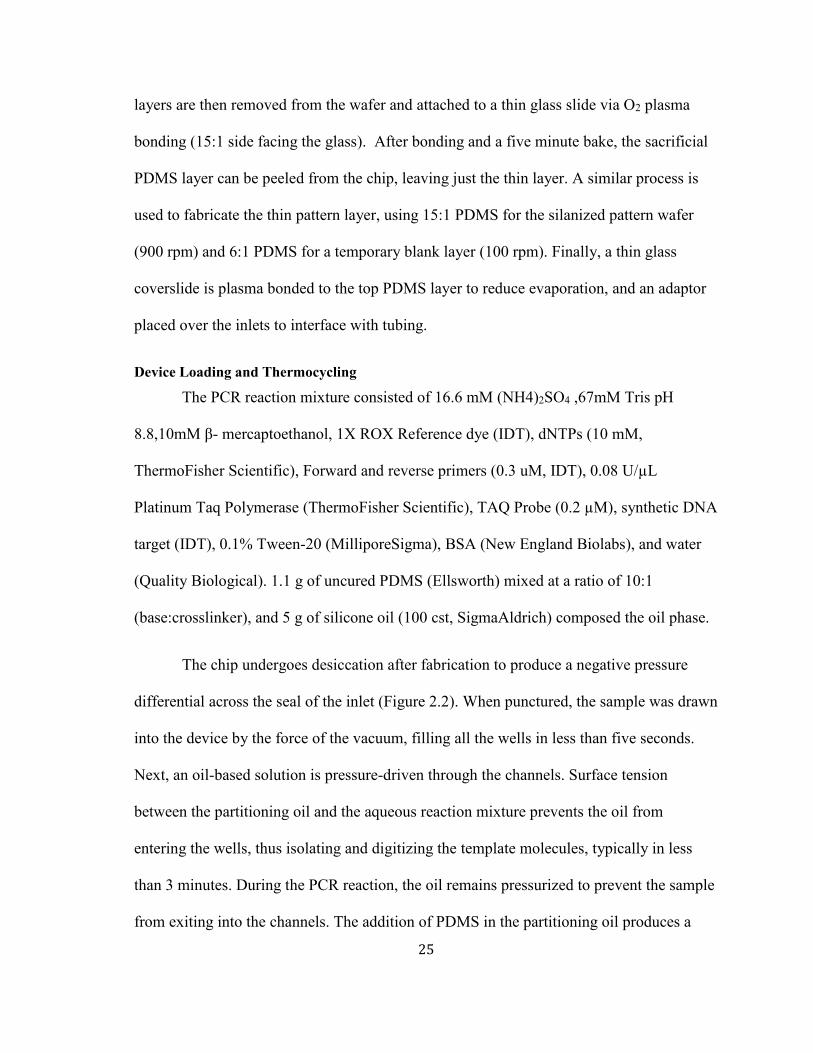
layers are then removed from the wafer and attached to a thin glass slide via O2 plasma
bonding (15:1 side facing the glass). After bonding and a five minute bake, the sacrificial
PDMS layer can be peeled from the chip, leaving just the thin layer. A similar process is
used to fabricate the thin pattern layer, using 15:1 PDMS for the silanized pattern wafer
(900 rpm) and 6:1 PDMS for a temporary blank layer (100 rpm). Finally, a thin glass
coverslide is plasma bonded to the top PDMS layer to reduce evaporation, and an adaptor
placed over the inlets to interface with tubing.
Device Loading and Thermocycling
The PCR reaction mixture consisted of 16.6 mM (NH4)2SO4 ,67mM Tris pH
8.8,10mM β- mercaptoethanol, 1X ROX Reference dye (IDT), dNTPs (10 mM,
ThermoFisher Scientific), Forward and reverse primers (0.3 uM, IDT), 0.08 U/µL
Platinum Taq Polymerase (ThermoFisher Scientific), TAQ Probe (0.2 µM), synthetic DNA
target (IDT), 0.1% Tween-20 (MilliporeSigma), BSA (New England Biolabs), and water
(Quality Biological). 1.1 g of uncured PDMS (Ellsworth) mixed at a ratio of 10:1
(base:crosslinker), and 5 g of silicone oil (100 cst, SigmaAldrich) composed the oil phase.
The chip undergoes desiccation after fabrication to produce a negative pressure
differential across the seal of the inlet (Figure 2.2). When punctured, the sample was drawn
into the device by the force of the vacuum, filling all the wells in less than five seconds.
Next, an oil-based solution is pressure-driven through the channels. Surface tension
between the partitioning oil and the aqueous reaction mixture prevents the oil from
entering the wells, thus isolating and digitizing the template molecules, typically in less
than 3 minutes. During the PCR reaction, the oil remains pressurized to prevent the sample
from exiting into the channels. The addition of PDMS in the partitioning oil produces a

26
solidified, permanent barrier between reaction chambers that is maintained throughout the
assay.
The device is thermocycled on a flatbed peltier for up to 60 cycles (5 minutes of
95°C, then 60 cycles of 15 seconds at 95°C and 60 seconds at 60°C).
Imaging and Image Processing
Chips are imaged on a Typhoon 9410 Variable Mode Imager at 10 µm resolution.
Fluorescent images are obtained for both the TaqMan probe (FAM) and the reference dye
(ROX). Following detection, the images are imported into Matlab for processing and
analysis. A mask is overlaid with the image file. The resulting image contains fluorescent
data from only the areas of interest. The central pixels of each well are used to measure
average intensity. Matlab’s built-in bimodal population separation function, multithresh, is
used to set a threshold for positive wells. Finally, the number of positive and negative
wells are counted, and occupancy is calculated assuming a Poisson distribution of reaction
mixture throughout the device.

27
Figure 2.1. Ultra-Thin Microfabrication
(A,B) A sacrificial layer was temporarily bonded to the ultra-thin pattern layer by a brief
bake step. This enabled separation of the joint PDMS layers from the mold without tearing
of the PDMS. (C) The ultra-thin pattern layer was then O2-plasma bonded to a PDMS-
spin-coated glass slide. (D) After a brief bake step, the sacrificial layer could be removed.
(E) Finally, a thin glass coverslide and tubing adapter were O2-plasma bonded to the
surface. This figure is reprinted with permission from reference [73].

28
Figure 2.2. Microfluidic device design and operation.
(A) Breakout of the microfluidic chip. The layers include a PDMS-coated glass slide,
single PDMS pattern layer, thin glass coverslide, and PDMS tubing adapter for the inlet,
outlet, and hydration line. (B) A single ultra-thin pattern layer and hydration line
effectively prevent evaporation through the permeable material. (C) The chip is desiccated
to produce a negative pressure differential across the inlet. When punctured, the sample
mixture automatically loads into the chambers. Next, a partitioning fluid is pressurized
through the channels to isolate the reaction chambers. This figure is reprinted with
permission from reference [73].

29
Figure 2.3. Evaporation during PCR.
Thick chips fabricated using conventional techniques experienced 80% evaporation. In
contrast, the thin chips only experienced 8% volume loss after 60 cycles of thermal cycling
(5 minutes of 95°C, then 60 cycles of 15 seconds at 95°C and 60 seconds at 60°C).
0
0.2
0.4
0.6
0.8
1
0 10 20 30 40 50 60 70
Vo
lum
e (
V/V
0)
Cycle number
Thick Chip
Thin Chip

30
A
B
Figure 2.4. Digital PCR Results
(A) Two overlaid fluorescent images of the microfluidic chip acquired by a Typhoon
Scanner. The signal image (green) was obtained with 526 nm emission and 488 nm filter,
and is overlaid with the reference image (red). After Matlab processing, average intensities

31
of each well are obtained (B). The sample result shown had an expected occupancy of
0.48 copies/µL and a measured occupancy of 0.44 copies/µL.

32
Figure 2.5. Digital Quantification Accuracy
A comparison of expected and measured copies per well. The expected value was
calculated based on the stock concentration and dilution in the reaction mixture. The
measured value is obtained from digital counting of positive wells adjusted by Poissonian
occupancy.
33
Chapter 3
MICROFLUIDIC DIGITAL HIGH RESOLUTION
MELT
High-throughput Parallelized Real-time Analysis
Variability in gene regulation is a fundamental characteristic of biology, allowing
cellular adaptation in many states such as development, stress response, and survival. One
prominent manifestation of this variability with respect to human health is Darwinian
selection within human disease [74]–[76]. From bacterial infections to cancer, diseased
populations rely on the ability to generate different phenotypes in order to respond and
thrive in their environment [77]–[80]. Hence, many diagnostic principles rely upon the
detection of genetic and epigenetic biomarkers, which often consist of minor DNA
variations that occur even down to the single nucleotide level, such as mutations, deletions,
frame shifts, and methylation, that provide selective advantage [1], [16], [81]. Likewise, in
many cases, early detection and diagnosis largely improves the patient’s prognosis and
34
survivability [82]. Although the advent of so-called “digital” analysis technologies has
furthered the detection of rare modifications in a binary manner, the stochastic and variable
nature of disease onset and progression could be better understood with a more multi-
dimensional analysis approach. Thus, a system that enables both rare detection and
population profiling on a molecule-by-molecule basis could greatly aid in detection and
understanding of disease.
High resolution melt (HRM) is a facile technique that enables multi-dimensional
DNA sequence interrogation through measurement of sequence-dependent denaturation
with a dsDNA intercalating dye, which could be powerful if applied at a digital level.
Where there exist some commercial technologies for digital PCR, there does not yet exist a
commercially available system for digital HRM (dHRM). Droplet based technologies, such
as Biorad and Raindance systems, rely on a single-point readout, which is not suitable for
real-time monitoring of fluorescence intensity. Fluidigm and Life Technologies are not
equipped for real-time monitoring and precise temperature control. Furthermore, their
cartridges utilize micro-valves for digitization, which require complex external machinery
and operation, and are too costly for disposable use, a requirement to prevent
contamination in ultra-sensitive analysis. Therefore, they fail to meet several design
criteria, such as compatibility with available platforms (often require their own
custom/proprietary equipment), scalability to higher throughput, and sufficient input
volume.
To perform highly parallelized copy-by-copy DNA molecular profiling, we
developed a digital microfluidic platform called HYPER-Melt (High-density Profiling and
35
Enumeration by Melt). HYPER-Melt provides a facile means of detecting and assessing
sequence variations of thousands of individual DNA molecules through digitization in a
nano-well microchip array, allowing amplification and interrogation of individual template
molecules by detecting high-resolution melt fluorescence changes due to sequence-
dependent denaturation. As a model application, HYPER-Melt is used here for the
detection and assessment of intermolecular heterogeneity of DNA methylation within the
promoters of classical tumor suppressor genes. The capabilities of this platform are
validated through serial dilutions of mixed epialleles, with demonstrated detection limits as
low as 1 methylated variant in 2,000,000 unmethylated templates (0.00005%) of a classic
tumor suppressor gene, CDKN2A (p14ARF). The clinical potential of the platform is
demonstrated using a digital assay for NDRG4, a tumor suppressor gene that is commonly
methylated in colorectal cancer, in liquid biopsies of healthy and colorectal cancer patients.
Overall, the platform provides the depth of information, simplicity of use, and single-
molecule sensitivity necessary for rapid assessment of intermolecular variation
contributing to genetic and epigenetic heterogeneity for challenging applications in
embryogenesis, carcinogenesis and rare biomarker detection.
Overview of Epiallelic Profiling by HYPER-Melt
To achieve high-density molecular profiling, we developed a microfluidic chip and
associated instrumentation for digitization and interrogation of individual DNA sequences
(Figure 3.1). The chip is first rapidly loaded with the reaction mix containing rare epiallele
targets (Figure 3.1A). The chip is then placed on a flatbed heater to perform PCR and

36
HRM. A mirrorless interchangeable lens camera (MILC) acquires images of the entire chip
at each temperature increment during the melt process (Figure 3.1B). The images are
processed and analyzed for each reaction chamber to procure a melt curve derivative, from
which the location of the peak defines the melt temperature (Figure 3.1C). Finally, the melt
temperatures of all the amplicons were calculated to catalog the initial template
methylation variants, and compiled in a histogram for quantitative methylation
heterogeneity analysis (Figure 3.1D).
Assessment of DNA methylation heterogeneity follows the assay principles laid out
in our previous report [63]. Briefly, primers were developed such that they provide
methylation-preferred amplification, in which all epiallelic variants of the target sequence
are amplified, with a significant bias toward the amplification of the partially and fully
methylated template molecules. This strategy greatly increases detection sensitivity in the
presence of a high background of unmethylated DNA. Post-PCR, HRM analysis is
performed by observing the release of a DNA-saturating dye (e.g., EvaGreen) during
temperature ramping [83]. As the temperature is increased, the amplicons denature,
resulting in a measurable decrease in fluorescence. The temperature at which exactly half
of the template strands of a particular amplicon become denatured is termed the melt
temperature (Tm) for that target-sequence. Following bisulfite conversion, methylated
templates exhibit an increased Tm due to the greater stability of C- versus T-base stacking
[84].
In the digital methylation profiling assay, reaction volumes containing both
unmethylated DNA and a single rare epiallele produce a melt curve with two peaks. The

37
left-most peak pertains to the unmethylated/background DNA. The right-most peak
corresponds to the rare epiallele, whose methylation density can then be resolved by its Tm.
Due to the digitization of differentially methylated epialleles, HYPER-Melt provides
absolute quantitation of all methylated variants and overall methylation heterogeneity.
The dynamic range of HYPER-Melt and other digital approaches can be described
by the Poisson distribution: 𝑃(𝑛, 𝜆) = (𝜆𝑛𝑒−𝜆)/𝑛!, where the probability that any given
chamber will contain 𝑛 copies depends on 𝜆, the average concentration in copies per
chamber volume. For the principle of HYPER-Melt to apply, each chamber may contain
no more than one rare methylated variant. By definition, the dynamic range of the device
scales with the total number of chambers available. Our proof-of-concept design contains
4096 wells per microfluidic chip, which facilitates detection and discrimination of over
1500 heterogeneously methylated variants simultaneously, and can be readily scaled to
higher quantities.
Design of Thermo-Optical Platform
To date, one of the greatest challenges preventing other researchers and commercial
imaging modalities from developing a digital melt platform is the high-throughput imaging
of a high-density array of sub-microliter volume chambers. The endeavor proved
particularly challenging because it incorporated the balance of two typically competing
imaging strategies: small-volume real-time fluorescence monitoring and rapid wide-field-
of-view acquisition.
38
Small-Volume Real-Time Image Acquisition
Reductions in reaction volume challenge the capabilities of most continuous
fluorescence monitoring equipment. For example, even commercial instruments, such as
the Biorad, struggle to produce high-fidelity melt curve results when reaction volumes are
decreased below 10 uL. Many of the reported real-time fluorescence tracking microfluidic
chips have a very limited number of chambers, use complex imaging components, do not
track volumes below tens of nanoliters, and do not have single molecule starting
concentrations [60], [85]–[87]. Realization of nano-or micro-liter imaging therefore comes
at the expense of field-of-view.
Wide Field-of-View
Large array image acquisition typically requires the use of a microarray scanner or
another such imaging setup that includes motion and panning of either the camera or object
of interest and subsequent image stitching in order to image the entire volume at high
resolution and sensitivity [69], [88]. Another alternative is the use of multiple imaging
setups [89]. Although these methods can be very effective at end-point detection, there is a
large time cost involved in real-time imaging. Longer melt durations induce photo-
bleaching, compound the challenge of maintaining thermal uniformity, and decrease
throughput. Thus, these methods are not suitable for a high throughput digital melt
platform.
To achieve a digital melt platform capable of high-throughput imaging of a high-
density array of sub-microliter volume chambers we sought a compromise between two,
often competing, challenging imaging goals: small-volume real-time fluorescence
monitoring and rapid wide-field-of-view acquisition.
39
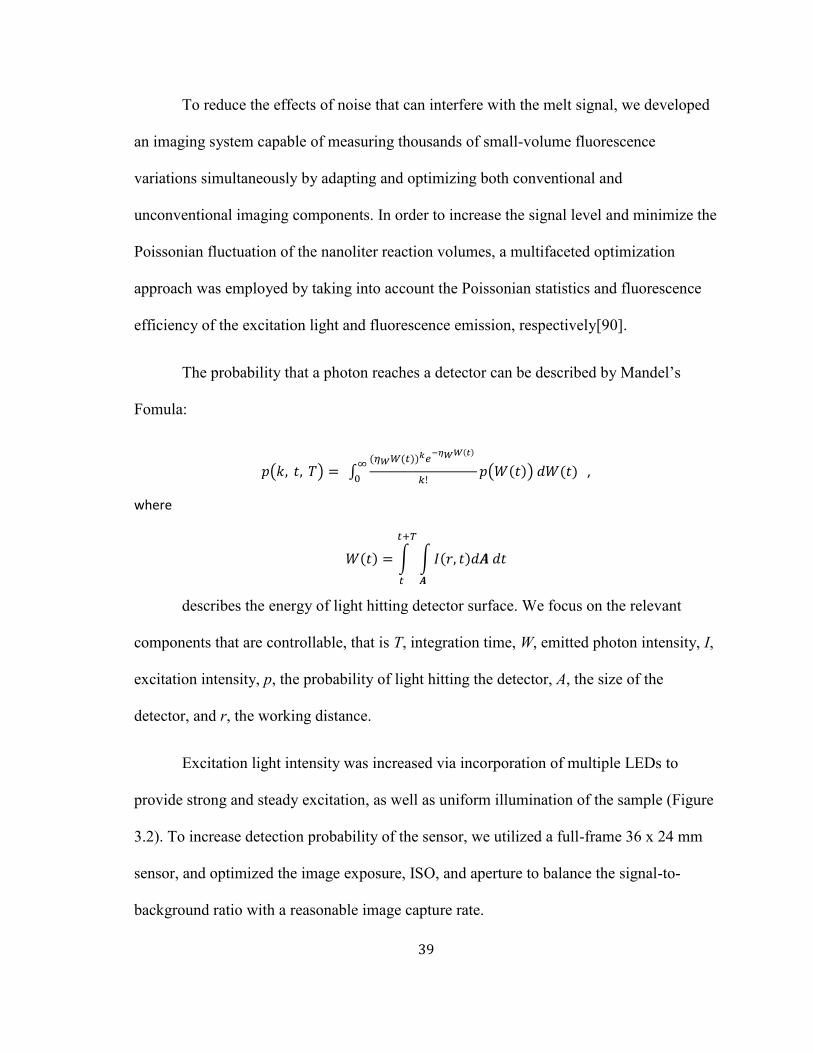
To reduce the effects of noise that can interfere with the melt signal, we developed
an imaging system capable of measuring thousands of small-volume fluorescence
variations simultaneously by adapting and optimizing both conventional and
unconventional imaging components. In order to increase the signal level and minimize the
Poissonian fluctuation of the nanoliter reaction volumes, a multifaceted optimization
approach was employed by taking into account the Poissonian statistics and fluorescence
efficiency of the excitation light and fluorescence emission, respectively[90].
The probability that a photon reaches a detector can be described by Mandel’s
Fomula:
𝑝(𝑘, 𝑡, 𝑇) = ∫(𝜂𝑊𝑊(𝑡))𝑘𝑒
−𝜂𝑊𝑊(𝑡)
𝑘!𝑝(𝑊(𝑡)) 𝑑𝑊(𝑡)
∞
0 ,
where
𝑊(𝑡) = ∫ ∫ 𝐼(𝑟, 𝑡)𝑑𝑨 𝑑𝑡
𝑨
𝑡+𝑇
𝑡
describes the energy of light hitting detector surface. We focus on the relevant
components that are controllable, that is T, integration time, W, emitted photon intensity, I,
excitation intensity, p, the probability of light hitting the detector, A, the size of the
detector, and r, the working distance.
Excitation light intensity was increased via incorporation of multiple LEDs to
provide strong and steady excitation, as well as uniform illumination of the sample (Figure
3.2). To increase detection probability of the sensor, we utilized a full-frame 36 x 24 mm
sensor, and optimized the image exposure, ISO, and aperture to balance the signal-to-
background ratio with a reasonable image capture rate.
40
In order to perform on-chip heating, we devised a strategy to address local non-
uniformities and thermal fluctuations that commonly occur in commercial flatbed heaters,
which can greatly compromise data integrity in highly temperature-critical applications
such as HRM. To help reduce thermal variations, we employed thermally-stabilizing heat
block layers, comprising a flatbed adapter, thermal paste contact enhancer, and a silicon
wafer to efficiently transfer heat evenly across its surface. The final stabilizing layer is the
glass slide of the digital melt chip itself. Previous attempts used thin glass slides (0.01mm),
albeit rapidly conductive, lack rigidity and endured bowing during temperature ramping,
thus affecting the heat transfer. Therefore, we substituted a thicker, more rigid glass slide
(1mm) to provide thermal dissipation, improve robustness of the chip handling, and
achieve more efficient fabrication. The additional thermal stabilization layers increased the
thermal uniformity of the chip by 172.3% (Figure 3.3B). With the current setup, melt
curves were acquired in just under 10 minutes with a 0.2ᵒC temperature resolution and a
Signal to Noise ratio of 5.60 (Figure 3.3C,D).
Validation of HYPER-Melt System
To assess the intermolecular heterogeneity of the amplicons, images of the entire
chip were collected during temperature ramping (Figure 3.4). All pictures were aligned to
the first image using an open-source Automated Image Registration program (AIR) [91].
Next, the pixel-space locations of each well were semi-automatically identified by a
customized Matlab program. The user selects the four corner points of the array image,
from which a script generates a linearly scaled mask of the array. Misalignment between

41
the chip and camera detector is initially corrected by applying a homography
transformation of the array mask using the four user-selected points and the generated
corners. The well boundaries are then shrunk by 10% on each side so that only the central
mass of the mixture is used for measurement. Finally, each well mask within the grid is
locally optimized in a 5x5 pixel neighborhood to correct for any additional warping and to
identify the center of each well (Figure 3.5).
Once the grid mask is defined, it is propagated throughout each image to obtain the
fluorescence intensity values from each pixel at each time point. The outlying points from
each well are removed, and the remaining intensity values from each frame within the
temperature interval were averaged to obtain a raw curve. Several filters were tested in
order to ascertain those that best preserved the integrity of the raw data. A combination of
a low-pass filter and Savitz-Golay filter were found to best remove additional noise while
still preserving melt information. Next, the derivative was calculated to find the
temperature at the inflection point of the melt curve termed the “melt temperature” (Tm). A
digital melt histogram was created that reveals the four distinct populations, which can be
readily separated by simple thresholding. The methylation density of the original template
in each reaction volume was then classified by its melt temperature, providing a
quantitative analysis of methylation heterogeneity on a locus-specific, molecule-by-
molecule basis.
To assess the capabilities of the HYPER-Melt platform, synthetic targets
representative of various bisulfite-converted sequences of the tumor suppressor gene,
CDKN2A (p14ARF), were used as a model system. Four methylation densities were

42
analyzed: 0%, 33%, 67% and 100%. The unmethylated (0%) sequence represented the
background population and was set to 500 copies per nL. The three methylated variants
were digitized on chip, amplified and identified by HYPER-Melt. The detected number of
targets for each epiallele was calculated by the number of positive melt-discriminated wells
while accounting for a Poisson distribution.
In terms of sensitivity, the platform demonstrated absolute quantitation, as the
calculated number of copies closely matched the expected number (Figure 3.6). The
average number of copies detected represents the combined average of the three epiallelic
variants detected per experiment. The experiments for each of 0, 1, and 10 expected copies
were repeated. A linear fit produces a slope of 0.91, suggesting that overall, 91% of the
expected DNA was detected, with an R2 value of 0.97. This discrepancy likely represents
slight material deformation which deviates from the expected geometry used during
calculations. The results of this analysis demonstrate that the HYPER-Melt platform
provides robust, absolute quantitation over five orders of magnitude, attaining accurate
HRM-based detection down to single copy sensitivity.
A serial dilution of methylated variants at concentrations of 0, 1, 10, 100, and 1000
copies/chip was performed in the presence of the 2 million unmethylated epialleles (Figure
3.7). Representative traces of fluorescence signals from individual wells are shown for
each test (Figure 3.7B), which were classified by melt temperature via thresholding and
color-coded by methylation density. Once discriminated by melt temperature, the digital
result was converted to a methylation density heatmap (Figure 3.7C), which was then
further quantified and analyzed via a methylation heterogeneity histogram (Figure 3.7D).

43
The master mix was divided such that the same reaction volume was loaded into the chip
as well as a control benchtop reaction for validation of the PCR and melt success (Figure
3.7E).
Overall, the specificity of the HYPER-Melt platform for rare heterogeneously
methylated epialleles was demonstrated down to fractions as low as 1 in 2 million
unmethylated copies, or 0.00005%. Even higher specificities are ostensibly achievable by
the HYPER-Melt platform as it is only limited by the appropriate dynamic range of the
application. Heterogeneously methylated epialleles can be readily differentiated with <
1°C resolution, enabling sequence-specific discrimination of < 4 CpG cites.
Discussion
The HYPER-Melt platform provides a practical and rapid technique for absolutely
quantitative assessment of intermolecular variability in DNA methylation levels of a target
locus with a demonstrated sensitivity of 1 in 2 million background copies at < 1˚C
resolution (~4 CpG-sites). Its clinical applicability was demonstrated with commensurate
performance, achieving 20-300X more sensitivity than the gold standard (qMSP), for
assessment of methylation heterogeneity of NDRG4 in liquid biopsies. HYPER-Melt was
also compared to more sensitive methods (i.e. ddPCR), where it demonstrated more
sensitive detection and discrimination of heterogeneous targets (Figure 3.8). There are
number of key innovations that, when combined, enabled achievement of significantly
higher HRM sensitivities than previously demonstrated in the literature.

44
The development of a wide-field-of-view imaging platform is critical to achieving
real-time fluorescence monitoring of such a large array of nanoliter reaction chambers.
Present commercial digital PCR technologies suffer from a number of key drawbacks and
are not yet suitable for digital HRM applications. Droplet-based technologies, such as the
QX200 (Bio-Rad) and Raindance systems, rely on a single-point readout, which is not
amenable for real-time monitoring of fluorescence intensity. QuantStudio 12K Flex
(ThermoFisher) and Biomark (Fluidigm) are not equipped for precise temperature control,
and the high cost of their OpenArray (ThermoFisher) and Digital Array IFC (Fluidigm)
cartridges undermines their clinical attractiveness. Many of the reported real-time
fluorescence tracking microfluidic chips have a limited number of chambers [85], [86], use
complex imaging components [60], do not track volumes below tens of nanoliters and do
not demonstrate digital starting concentrations [85]–[87]. Other microfabricated chip
designs for digital PCR involve a complicated fabrication step to insert an evaporation
barrier [69], [70], or utilize mechanically-intensive micro-valves for partitioning [69].
Multi-layer micro-valve partitioning strategies suffer from complex fabrication methods, a
limiting valve footprint that reduces scalability potential, and require intricate operational
instrumentation. Large array image acquisition techniques usually necessitate the use of a
microarray scanner or similar instrumentation that includes motion and panning of either
the camera or object of interest, followed by subsequent image stitching or the use of
multiple imaging setups in order to image the entire volume at sufficient resolution and
sensitivity [69], [88],[89]. Although these methods can be very effective at end-point
detection, in real-time imaging they accrue costs of time, photo-bleaching, and thermal
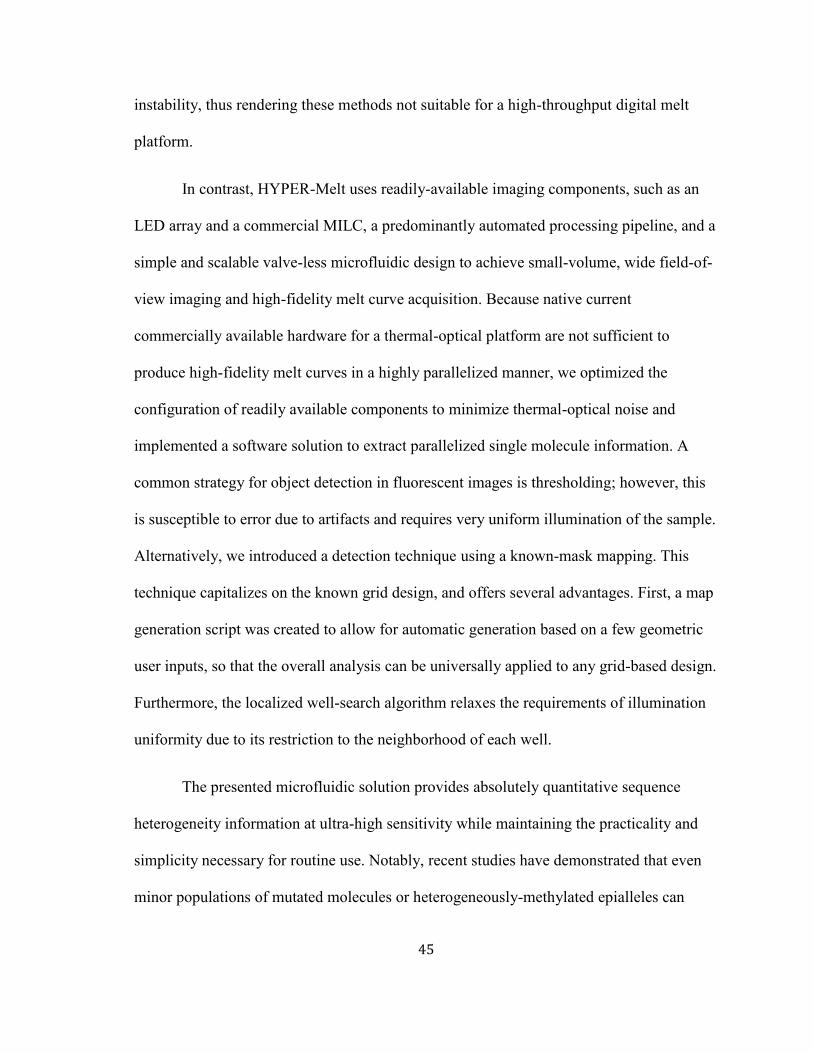
45
instability, thus rendering these methods not suitable for a high-throughput digital melt
platform.
In contrast, HYPER-Melt uses readily-available imaging components, such as an
LED array and a commercial MILC, a predominantly automated processing pipeline, and a
simple and scalable valve-less microfluidic design to achieve small-volume, wide field-of-
view imaging and high-fidelity melt curve acquisition. Because native current
commercially available hardware for a thermal-optical platform are not sufficient to
produce high-fidelity melt curves in a highly parallelized manner, we optimized the
configuration of readily available components to minimize thermal-optical noise and
implemented a software solution to extract parallelized single molecule information. A
common strategy for object detection in fluorescent images is thresholding; however, this
is susceptible to error due to artifacts and requires very uniform illumination of the sample.
Alternatively, we introduced a detection technique using a known-mask mapping. This
technique capitalizes on the known grid design, and offers several advantages. First, a map
generation script was created to allow for automatic generation based on a few geometric
user inputs, so that the overall analysis can be universally applied to any grid-based design.
Furthermore, the localized well-search algorithm relaxes the requirements of illumination
uniformity due to its restriction to the neighborhood of each well.
The presented microfluidic solution provides absolutely quantitative sequence
heterogeneity information at ultra-high sensitivity while maintaining the practicality and
simplicity necessary for routine use. Notably, recent studies have demonstrated that even
minor populations of mutated molecules or heterogeneously-methylated epialleles can

46
have direct clinical implications. For example, intermediate DNA methylation
heterogeneity is predictive of metastatic versus localized clones in Ewing sarcoma [27] and
observations of methylation reprogramming on a single CpG site basis in Acute Myeloid
Leukemia (AML) patients emphasize that molecular heterogeneity plays an important role
in tumor progression and adaptation to the microenvironment [28]. APC mutations at
levels as low as 0.01% could be indicative of early colorectal cancer [92]. HYPER-Melt
provides an enabling platform for similar studies looking to examine the role of rare,
heterogeneous genetic or epigenetic aberrations on a molecule-by-molecule basis without
excessive cost and time.
The capabilities of the HYPER-Melt platform were demonstrated with the
DREAMing assay [63], designed to detect methylation density of rare molecules amongst
a background of unmethylated or perceived healthy molecules. The primers were designed
to introduce an amplification bias towards the rare molecules, allowing single-copy
detection even in a high background. This approach achieves highly sensitive, absolute
quantitation of the digitized methylated variants. There are some drawbacks of this
approach, such as the lack of quantitativeness towards the background molecules due to
lack of digitization. The Tm corresponds to the number of CpGs that are methylated, which
may include several permutations depending on the locus. Further analysis would be
required to identify those exact CpG sites. We previously described how a linear
regression can be modeled between control points with an in silico model (such as uMelt
[93]) [63]. Such a model specifies the confidence interval of methylation density at each
melt temperature and identifies differentiable patterns. A number of factors affect the
resolution of the DREAMing assay that should be taken into account when choosing a

47
locus, as outlined in our previous manuscript [63]. For example, the methylation density of
loci that are shorter and have fewer CpGs can be better resolved than longer and denser
sequences. The resolution can be tailored by designing primers around the region of
interest.
The increased sensitivity, as well as the comprehensive methylation density
information realized by HYPER-Melt, provides the opportunity to set more quantitative,
multi-parameter threshold values for clinical analysis. Already, DNA methylation has been
a subject of some treatment strategies which are clinically available [11], [12]. A facile
means of assessing epigenetic heterogeneity, such as the one presented here, might be
employed for extending methylation assays from mere detection of the presence of
methylation to use as a means of real-time monitoring of tumor progression, evolution and
response to therapy. An underlying premise of precision medicine is that most or all cancer
cells in a patient share a given targetable genetic (or epigenetic) defect. However, most
cancers exhibit significant intratumoral heterogeneity, increasing the likelihood of resistant
clones or subclones [94]. Therefore, there is increasing need for genetic and epigenetic
profiling of intercellular heterogeneity to identify these resistant clones when applying
therapeutic regimens. HYPER-Melt provides a simple means of profiling intermolecular
heterogeneity, and, due to its high sensitivity, may thereby enable identification of even
rare, potentially-resistant subclones.
HYPER-Melt is readily extendable to many other applications beyond DNA
hypermethylation. The ability to fully digitize samples with HYPER-Melt while
maintaining considerable dynamic range allows absolute quantification for all methylation

48
patterns without bias, thereby enabling the assessment of hypomethylation in CpG-sparse
loci, which commonly occurs during carcinogenesis [9], [14], [16], [27]. Other
applications of fully digital HRM include ultrasensitive detection of rare genetic/epigenetic
variants, including mutation and single-nucleotide polymorphism (SNP) detection [95]–
[97]. Furthermore, digital melt curve analysis also provides considerable advantages over
digital PCR-based approaches by allowing facile verification of PCR products, a critical
feature for avoiding false positives in rare target detection and diagnostics. Intermolecular
variability is of great interest in other applications such as embryogenesis [98],
carcinogenesis [1], [2], [4], and regulatory circuitry [32], [79], for which HYPER-Melt
provides a practical and facile means of further investigation.
There are a few drawbacks in the current platform that are of note. One
fundamental issue with the microfluidic platform is the potential disparity between sample
volume and reaction volume. While our chip was specifically designed to achieve
compatibility with existing bisulfite conversion kits, larger samples would likely require
incorporation of a concentration method, such as the previously-described, Methylation-
On-Beads technique [99]. The reported benefits of the platform are limited to examining a
single target in a single sample, which restricts the clinical applications of this platform to
those with a well-defined, highly specific locus of interest. Alternatively, multiplexing
could be achieved by splitting samples into subarrays, but would require the use of greater
sample volumes or additional wells available for digitization to maintain assay
performance metrics. Furthermore, the current chip is limited in throughput to the
assessment of a single sample per run. Even though eight samples can be run per day, each
requires an individual chip, thus the platform has relatively low sample throughput.

49
However, this limitation is similar to many other digital real-time analysis or sequencing
technologies, in which the sensitivity can be increased by dedicating more of the reaction
space to a single sample.
In conclusion, HYPER-Melt provides an all-in-one analysis platform of molecular
profiling and heterogeneity analysis. The platform allows deep insight at the single copy
level of any target of interest. Overall, this platform has the potential to detect
intermolecular variability at ultra-high sensitivity even in difficult and highly-
heterogeneous samples, allowing more comprehensive investigation of the dynamics and
stochasticity of DNA molecular heterogeneity. Furthermore, the practicality and high
digitization power of the platform offers a tool for rapid and efficient DNA heterogeneity
analysis by rapidly interrogating hundreds to thousands of individual molecules in parallel.
Materials and Methods
Chip Fabrication
Microfluidic chips were fabricated using standard photolithography and soft
lithography techniques. To fabricate the reusable master mold, a silicon wafer was
dehydrated and oxygen plasma treated (Technics PE-IIA) at 80 W for 1 minute. SPR220-7
photoresist (Microchem) was spun at 2600 rpm for 1 minute and then soft baked at 115⁰C
for 20 minutes. The wafer was then exposed to the channel pattern using a mask aligner at
1150 J/cm2 and developed in CD26. After a hard bake at 200⁰C for 6 hours, SU-8 3050
was spun on the wafer at 2600 rpm for 1 minute. After a soft bake at 95⁰C for 20 minutes,

50
the wafer was aligned to the well array mask, exposed at 300 J/cm2, developed, and baked
at 200ᵒC for 1 hour.
Each microfluidic chip was fabricated from this mold using soft lithography and
our unique ultra-thin ≈80 µm layering technique. The wafer was first silanized to protect
the photoresist layers. A 15:1 mixture of poly dimethyl siloxane (PDMS, Ellsworth) was
spun on the pattern at 700 rpm, while a 6:1 mixture of PDMS was spun on a blank wafer.
Both were baked for 6 minutes at 80ᵒC. The blank, sacrificial PDMS layer was then
removed and overlaid on the pattern layer, and baked briefly again. A blank glass slide
(Ted Pella) was cleaned with water and dried. 15:1 PDMS was spun on the glass slide at
2100 rpm; then baked at 80ᵒC for 6 minutes. Next, the two partially-bonded PDMS layers
on the pattern wafer could be removed jointly. The pattern PDMS layer and the blank
PDMS layer on the glass slide were both oxygen plasma treated at 40 W for 45 seconds,
then bonded. After bonding, the sacrificial PDMS layer was peeled and removed from the
pattern. Finally, a glass coverslip and tubing adapter layer were oxygen plasma bonded to
the top surface of the chip. The chip was then baked at 80ᵒC overnight, sealed with a piece
of thin adhesive tape over the inlet and outlet, and desiccated for a minimum of two hours
before use.
Genomic and Synthetic Control DNA
All synthetic control DNA was obtained from Integrated DNA Technologies (IDT)
and used at concentrations based on the manufacturer’s specifications. Human male
genomic DNA (Promega) and Epitect unmethylated control DNA (Qiagen) were used as
unmethylated control genomic DNA. Enzymatically CpG-methylated HeLa genomic DNA
(New England BioLabs) was used as a fully-methylated control. Control genomic DNA

51
was bisulfite converted using the EZ DNA Methylation-Lightning Kit (Zymo Research)
according to the manufacturer’s protocol and eluted into volumes ranging from 12 – 25 µl.
Post-bisulfite treatment yields were quantified by MethyLight using primer and probe
sequences for beta-actin recognizing both methylated and unmethylated templates: actin-
sense 5’- TAG GGA GTA TAT AGG TTG GGG AAG TT -3’; actin-antisense 5’- AAC
ACA CAA TAA CAA ACA CAA ATT CAC -3’, spanning a 103-bp region
(chr7:5,532,169-5,532,271), and 100nM probe, 5’- \56-FAM\ TGT GGG GTG \ZEN\
GTGATGGAGGAGGTTTAG \3IABkFQ\ -3’. Assays were performed using 10X Master
Mix to yield a final volume of 25 µl and final working concentrations of 16.6mM
(NH4)2SO4, 67mM Tris pH 8.8, 6.7mM MgCl2 10mM 𝛽-mercaptoethanol, 200µM of each
deoxynucleotide triphosphate (dNTP) and 0.04 U/µl of Platinum Taq polymerase
(ThermoFisher Scientific). Cycling conditions were 95˚C for 5 minutes, followed by 50
cycles of (95˚C for 5 seconds, 60˚C for 30 seconds and 72˚C for 30 seconds). Standards for
quantification were created by serial dilution of a 104-bp synthetic target equivalent to the
bisulfite-converted locus.
Sample Loading and Digitization
The PCR and HRM master mixes were prepared to yield final working
concentrations of 1.66 mM (NH4)2SO4, 6.7 mM Tris pH 8.8, 2.7 mM MgCl2, 1 mM β-
mercaptoethanol, 300 nM primers (IDT, Table 2), 200 µM dNTPs (Thermofisher), 1X
ROX (Thermofisher), 0.04 U/µL Platinum Taq DNA polymerase (Thermofisher), 1
mg/mL BSA (NEB), 0.01% Tween 20 (Sigma Aldrich), and 1X Evagreen (Biotium). This
master mix was drawn into microcentrifuge tubing (Cole Parmer) using a syringe. Due to
the desiccation, a negative pressure differential existed inside the microfluidic chip seal.

52
When the needle of the tubing punctured the seal, the sample was drawn into the wells.
Partitioning fluid, consisting of 5 g Silicone oil and 1 g PDMS (10:1), was then pressurized
through the channels. Due to surface tension, the fluid did not enter the wells, and served
to isolate the reaction chambers and digitize the sample throughout the 4096 wells. During
PCR, the partitioning fluid was pressurized at one end, and sealed at the other.
Furthermore, the PDMS in the oil solidified over the course of the PCR reaction,
producing a permanent barrier.
Digital PCR and Digital Melt
The chip was then placed on a flatbed thermal cycler (Proflex). Thermal contact
was ensured by use of FC-40 oil between the glass slide and the heating surface. A PCR
program then ran for 60 cycles of 95°C, TA (where TA is the annealing temperature for the
DREAMing primers), and 72°C for 30 seconds each. The annealing temperature, which
controls the amplification bias of the primers to methylated vs unmethylated targets as
previously described[63], was optimized for reduced bias to provide more uniform
amplification of heterogeneously-methylated epialleles (Figure 3.9). The TA was 63°C for
the p14ARF assay and 57°C for the NDRG4 assay. Next, the chip was removed from the
heater, disconnected from the tubing, and taken to the digital melt platform (Figure 3.2A).
The chip was secured to a flatbed heater with tape. The wells were illuminated by an
expanding blue LED array (Thorlabs). Wide field-of-view imaging captured the
fluorescence of all 4096 wells simultaneously by use of a Sony ILCE with a 50mm lens
(Canon), coupled to a green filter (Omega Optical). The chip underwent temperature
ramping at a rate of 0.1°C/sec from 70°C to 95°C. Images were captured at 1 Hz with a

53
0.8” exposure. An unmethylated control was run before and after each serial dilution to
verify the absence of contamination.
Image Processing and Data Analysis
After collection, the images were aligned to correct for any thermally induced
movement via an open-source automated program, Automated Image Registration (AIR)
[91]. The remainder of the analysis was performed with a custom-developed Matlab script
(Figure 3.5). The user selects the four corners of the chip in order to generate a virtual
mask outlining the expected well locations. Once generated, the virtual mask was mapped
to the acquired image via a homography transformation to correct for the non-parallel
relationship between the signal and imaging surfaces. Finally, well-by-well
transformations were performed by locally optimizing the signal over a 5-by-5 pixel
neighborhood. The overall image contained 4240 x 2832 pixels, yielding approximately
200 pixels/well.
Once well locations were determined, the virtual mask was propagated throughout
all of the collected images and captured the signal intensity of the 200 pixels in each well.
Fluorescence intensity values within a well at each time point were checked for outliers
and then averaged. Time points were then sorted by temperature, and each signal within
0.3°C was further averaged. Finally, a low-pass and Savitzky-Golay filter was performed
on each well to produce a melt curve. The negative derivative of this signal was taken, and
then corresponding peak(s) determined the melt temperature of the amplicon in each well.
Only the right-most peak is used for discernment in each well to avoid any potential signal
from heteroduplex formation. Simple thermal calibration was performed by taking
advantage of the DREAMing assay principles [63], namely a known background
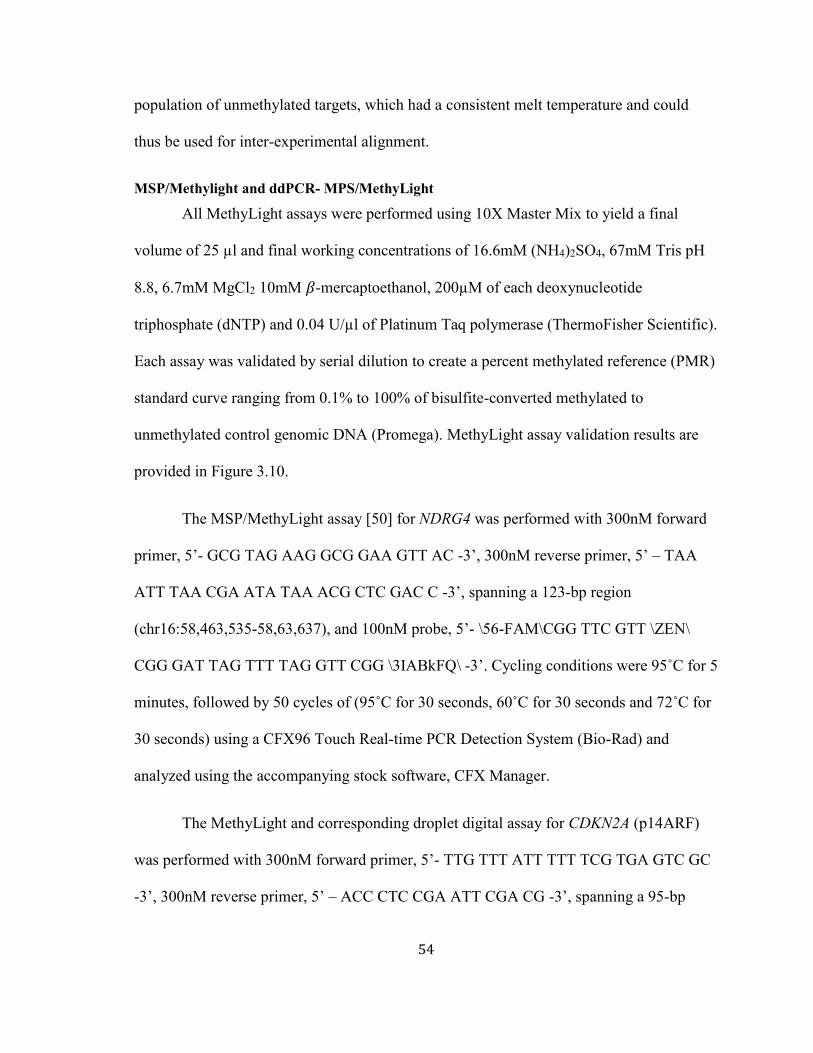
54
population of unmethylated targets, which had a consistent melt temperature and could
thus be used for inter-experimental alignment.
MSP/Methylight and ddPCR- MPS/MethyLight
All MethyLight assays were performed using 10X Master Mix to yield a final
volume of 25 µl and final working concentrations of 16.6mM (NH4)2SO4, 67mM Tris pH
8.8, 6.7mM MgCl2 10mM 𝛽-mercaptoethanol, 200µM of each deoxynucleotide
triphosphate (dNTP) and 0.04 U/µl of Platinum Taq polymerase (ThermoFisher Scientific).
Each assay was validated by serial dilution to create a percent methylated reference (PMR)
standard curve ranging from 0.1% to 100% of bisulfite-converted methylated to
unmethylated control genomic DNA (Promega). MethyLight assay validation results are
provided in Figure 3.10.
The MSP/MethyLight assay [50] for NDRG4 was performed with 300nM forward
primer, 5’- GCG TAG AAG GCG GAA GTT AC -3’, 300nM reverse primer, 5’ – TAA
ATT TAA CGA ATA TAA ACG CTC GAC C -3’, spanning a 123-bp region
(chr16:58,463,535-58,63,637), and 100nM probe, 5’- \56-FAM\CGG TTC GTT \ZEN\
CGG GAT TAG TTT TAG GTT CGG \3IABkFQ\ -3’. Cycling conditions were 95˚C for 5
minutes, followed by 50 cycles of (95˚C for 30 seconds, 60˚C for 30 seconds and 72˚C for
30 seconds) using a CFX96 Touch Real-time PCR Detection System (Bio-Rad) and
analyzed using the accompanying stock software, CFX Manager.
The MethyLight and corresponding droplet digital assay for CDKN2A (p14ARF)
was performed with 300nM forward primer, 5’- TTG TTT ATT TTT TCG TGA GTC GC
-3’, 300nM reverse primer, 5’ – ACC CTC CGA ATT CGA CG -3’, spanning a 95-bp

55
region (chr9:21,994,226-21,994,310), and 100nM probe, 5’- \56-FAM\ TAC GAC CCG
\ZEN\ CCG CGA AT \3IABkFQ\ -3’. MethyLight cycling conditions were 95˚C for 5
minutes, followed by 50 cycles of (95˚C for 30 seconds, 60˚C for 30 seconds and 72˚C for
30 seconds). MethyLight was performed using a CFX96 Touch Real-time PCR Detection
System (Bio-Rad) and analyzed using the accompanying stock software, CFX Manager.
For ddPCR, mastermix was prepared with Bio-Rad Supermix 1X according to Bio-
Rad instructions. Mixed epiallelic targets were diluted to 40, 400, and 4000 copies per 20
uL, and background unmethylated targets were diluted to 2000000 copies per 20 uL.
ddPCR was performed in for each dilution in duplicate, with and without the background
DNA. Droplets were generated with the QX200 Droplet Generator (Bio-Rad), amplified in
a 96-well plate (Bio-Rad) thermal cycler (Applied Biosystems), and detected via the
QX200 Droplet Reader. Cycling conditions were 95oC for 10 min, 40 cycles of (94oC for
30 seconds, 60oC for 1 minute), 98oC for 10 min, at a ramp rate of 2oC/second, as
recommended by the manufacturer. Thresholding was performed across all reads by the
proprietary Bio-Rad Software to obtain the copy number detected per reaction volume (20
uL) (Figure 3.8).

56
Figure 3.1. HYPER-Melt workflow.
(A) The reaction and target mixture, prepared on benchtop, is loaded into the microfluidic
chip where rare methylated epialleles are digitized. (B) The chip is then placed on a flatbed
heater to undergo PCR amplification followed by the Melt reaction, in which a MILC
captures fluorescent images of the array during temperature ramping. (C) The images are
analyzed to find the melt temperature, which corresponds to the initial template sequence.
(D) A molecular heterogeneity histogram reveals different populations, which can be
separated by thresholding and classified by methylation density, providing a quantitative

57
analysis of the molecular heterogeneity of the sample. This figure is reprinted with
permission from reference [73].

58
Figure 3.2. Illumination Optimization.
Several illumination strategies were tested in order to maximize the desired signal, i.e. the
melt denaturation peak, and minimize isothermal noise. The signal was defined as the
average peak height of positive wells throughout the chip. The noise was defined as the
average standard deviation of brightness values within each temperature increment before
the melt temperature. Counterintuitively, switching from a Laser to LED decreased the
intra-temperature-increment noise observed during the melt reaction. The final design
utilized an LED array. This figure is reprinted with permission from reference [73].

59
Figure 3.3. Digital Melt Platform
(A) The heating components consisted of a commercial thermal cycler with a 96-well plate
to flatbed adapter and a silicon wafer, to which the microfluidic chip was secured. The chip
was illuminated by an LED array and filter. Fluorescence detection occurred via a 12
Mpixel CMOS MIL camera coupled to a filter and focusing lens. (B) Melt temperature
variation across the chip after loading and digitization with benchtop-amplified PCR
LED array
Excitation filter
Microfluidic chip
12 Mpixel CMOS
50 mm Focusing Lens
Emission filter
Silicon wafer
Heat block adapter Thermal
cycler
Before Thermal Optimization
After Thermal Optimization
⁰C
µm µm
⁰C
µm µm
Approximate Electromagnetic Noise
3 x
Signal (Positive) to Background (Negative)
Noise ≈ 1.51
Signal Level
Signal to Noise
Signal = 6.90 SNR = 5.60
Average Curve
95% CI
Average Melt Peak
C D
A B

60
product of a single DNA target. The addition of thermally stabilizing layers and fabrication
modification of a thicker glass slide greatly improved thermal stability. (C) The positive
vs. negative signal was characterized by digitally amplifying the target on-chip. (D) The
signal to noise characterization of the on-chip DREAMing reaction was assessed by
comparing the average standard deviation of each temperature interval of the overall
average melt curve to the overall average peak height of positive wells. This figure is
reprinted with permission from reference [73].

61
Figure 3.4. Melt curve acquisition and discrimination by melt temperature.
(A) Fluorescent images are acquired of the entire chip at each temperature interval to
visualize denaturation of the amplicons (subset shown). (B) The fluorescence data of each
well is filtered and plotted against temperature to produce a melt curve. The inflection
point of the curve is defined as the melt temperature (Tm) of the template sequence. The Tm
is then used to discriminate the methylation density of the original template epiallele. This
figure is reprinted with permission from reference [73].
Unmethylated
100% Methylated
A
B

62
Figure 3.5. Pixel-Space Definition Mapping.
(A) The user selects four control points from the image acquired by the camera and the
generated grid image based on the chip mask design which are used to compute the
homography transformation of the grid to correct for linear misalignment between imaging
and signaling planes. (B) Next, due to nonlinear nonuniformities in the chip, a local
optimization of brightness over a 5-by-5 pixel neighborhood is performed to improve
alignment. (C) The optimized grid captures more fluorescence information than native
transformation. This figure is reprinted with permission from reference [73].

63
Figure 3.6. Detected vs. expected DNA copy number.
Mixed epialleles were diluted into a background of 2 million unmethylated templates.
After amplification and HRM-based discrimination, the detected copy number of each
epiallele were calculated according to a Poisson distribution. The average epiallelic
detected copy number was compared to the expected. The array chip demonstrates linearity
from ~1 to 1000 copies. This figure is reprinted with permission from reference [73].

64
Figure 3.7. HYPER-Melt analysis.
(A) HYPER-Melt was used to analyze p14ARF synthetic sequences ranging in copy
numbers of 0 to 1000 of each epiallelic species in 2 million unmethylated background
molecules. (B) A subset of melt curve derivatives from each serial dilution, color-coded by
melt temperature, demonstrate methylation-density-independent amplification of all
species as well as single-copy sensitivity. (C) The digital heatmap reflects the methylation
density of the template molecule in each well. (D) The populations of the four epiallelic
species can be quantified and assessed upon inspection and thresholding of the DREAM
histogram. (E) Corresponding bulk analysis validates amplification, but demonstrates

65
limited sensitivity due to the low-copy-number methylated peaks being eclipsed by the
high background. This figure is reprinted with permission from reference [73].

66
Figure 3.8. Comparison of HYPER-Melt with ddPCR.
To create an unbiased comparison between HYPER-Melt and other sensitive assays such
as ddPCR, we designed synthetic targets with degenerate C/T bases in all CpG sites,
representative of completely random methylation in the primer and target regions for

67
p14ARF. HYPER-Melt was performed following the same protocol as before at target copy
numbers of 40 and 400 per chip in a background of 2 million unmethylated DNA copies.
MSP primers were designed for p14ARF, and ddPCR was run for target copy numbers of
40, 400, and 4000 per run in a background of 2 million unmethylated. We were unable to
perform the 4000-copy reaction in the chip because it exceeds the dynamic range. (A)
HYPER-Melt detected ~25-120-fold more copies overall than ddPCR, which is expected
due to the low probability of the presence of a fully methylated target in each reaction.
Additionally, HYPER-Melt provides sequence information of each copy detected (B). (C)
ddPCR was performed for fully methylated targets, both with and without background, to
validate the MSP assay. (D) Fluorescent readout information from ddPCR. Each dot
represents the fluorescence from a single droplet. This figure is reprinted with permission
from reference [73].

68
Figure 3.9. Annealing Temperature On-Chip Optimization.
Optimization of the methylation bias, defined here as the relative peak height ratio between
methylated and unmethylated targets, was performed by running DREAMing on-chip at
multiple annealing temperatures. The optimal bias that still amplified unmethylated DNA
occurred at 63 ⁰C. This figure is reprinted with permission from reference [73].

69
Figure 3.10. Validation of MSP Assay
(A) Validation of NDRG4 MSP/MethyLight assay. (B) Validation of CDKN2A
MSP/MethyLight assay.

70
Figure 3.11. Data Processing Filter Optimization

71
Several filters were analyzed for reduction of noise in the optical signal. Each filter was
assessed for (A) maintaining the integrity of the raw data and (B) reducing the melt
temperature deviation within a single population on the device. Overall, a quartic savitsky-
golay filter proved the best suited for HYPER-Melt.

72
Figure 3.12. Genomic Validation of HYPER-Melt Platform
(A) HYPER-Melt analysis of bisulfite-converted EpiTect DNA (Qiagen). Bisulfite
conversions were performed using EZ DNA Methylation-Lightning Kit (Zymo). (B)
HYPER-Melt analysis of enzymatically-methylated (Sigma-Aldrich), bisulfite-converted
DNA. (C) HYPER-Melt analysis of human male genomic DNA from random donors
(Promega). This figure is reprinted with permission from reference [73].

73
Table 2. Assay primers and synthetic targets
The p14ARF gene sequence is shown above. Primers were designed previously to achieve
methylation-preferred amplification. The region within the primers contains 13 possible
methylation sites, of which these 4 were chosen for demonstration of HIPR-Melt analysis.
NDRG4 primers sequences are shown for amplification of cell-free DNA from liquid
biopsies.

74
Chapter 4
HIGHLY EFFICIENT DIGITAL MICROFLUIDICS BY
PASSIVE GEOMETRIC IMMOBILIZATION
Disparity in sample-to-analysis volumes
Liquid biopsies contain a treasure of genetic and epigenetic biomarkers that contain
information for the detection and monitoring of human disease. DNA methylation is an
epigenetic modification that is critical to determining cellular phenotype and often
becomes altered in many disease states. In cancer, aberrant DNA methylation contributes
to carcinogenesis and can profoundly affect tumor evolution, metastatic potential, and
resistance to therapeutic intervention. However, current technologies are not well-suited
for quantitative assessment of DNA methylation heterogeneity, especially in challenging
samples such as liquid biopsies with low DNA input and high background. We present a
multilayer microfluidic device for quantitative analysis of DNA methylation by digital
PCR and high resolution melt (HRM). The multilayer design facilitates high-density array
digitization aimed at maximizing sample loading efficiency. The platform achieves highly
parallelized digital PCR-HRM-based discrimination of rare heterogeneous DNA

75
methylation as low as 0.0001% methylated/unmethylated molecules of a classic tumor
suppressor gene, CDKN2A (p14ARF).
The HYPER-Melt platform offers a novel method of highly sensitive analysis and
quantification of methylation heterogeneity suitable for detection of rare biomarkers in
liquid biopsies [73]. However, while promising, this method, like most array-based
techniques, analyzes a small percentage of the consumed sample, thereby discarding many
of the precious disease-derived molecules and their presumed clinical insight [70], [100],
[101]. Recently, digital technologies have been used to demonstrate that as few as 7
copies/mL of mutated PIK3CA can indicate therapeutic resistance in breast cancer [102],
and 2 copies/2 mL of hypermethylated vimentin is present in early stage colon cancer [56],
illustrating the scarcity of these biomarkers and the need for thorough inspection of plasma
samples.
A limited number of existing designs have attempted to address the issue of sample
throughput, but do not demonstrate performance at high temperature [103], [104], cannot
guarantee complete digitization [105], or have limited imaging capacity [104]. Therefore,
there exists a need for a microfluidic device capable of highly efficient sample
compartmentalization and detection of rare molecules.
In this study, we present a multilayer microfluidic device for efficient trapping and
parallelized DNA methylation analysis of single molecules in picoliter-sized chambers.
The multilayer design facilitates efficient digitization of DNA molecules into 13,000 wells.
We demonstrate the utility of this digital PCR- high resolution melt (HRM) platform
through discrimination of partially and fully methylated epialleles of a tumor suppressor

76
gene, CDKN2A (p14ARF) amongst a high background of unmethylated DNA. The ultrahigh
sensitivity of this platform provides a means for quantitative assessment of DNA
methylation heterogeneity of rare molecules such as those found in liquid biopsies.
Multilayer geometric manipulation
To achieve high-efficiency and high-density methylation profiling, we developed a
multilayer microfluidic chip for digitization and interrogation of individual DNA
sequences. The device consists of two PDMS pattern layers oriented such that the features
are in contact. The lower PDMS layer, containing 13,000 750 pL-sized chambers or wells,
sits below the channel layer, overlapping at the inlets to each chamber (Figure 4.1A). Two
glass slides sandwich the device, and PDMS adapters provide the loading interface (Figure
4.1B). The reaction mix rapidly enters the desiccated device through the channels and fills
the wells (Figure 4.1C). Next, a partitioning oil flows through the evacuated channels, thus
isolating and digitizing the individual molecules.
Most array-based technologies suffer from sample loss during loading or
digitization processes [70], [100], [101]. Previously, our device design comprised of
parallelized straight channels with perpendicular inlet orientation [73]. During vacuum-
assisted loading, the fluid rapidly filled the channels before saturating the wells,
disqualifying approximately 89% of the sample for analysis. To minimize loss due to
channel bypassing, we sought to implement a design that retards flow through the channels
while maintaining or increasing the fill velocity of each well.

77
The multilayer design promotes efficient loading through two primary mechanisms.
First, the curved channel design directs fluid to flow towards the walls of the channels
where the inclined inlets for the chambers are located. The presented curved, single-
channel design constantly redirects flow, increasing flow resistance in the direction of the
channel. Second, the ratio of the well height (hw) to the channel height (hc) can be tuned to
adjust the relative force of the vacuum in the direction of the wells (Fvacuum,w) with respect
to the channel (Fvacuum,c).
Modeling and simulation of 2-dimensional device geometries
To model the effects of the channel and inlet device geometries on the flow profile,
two-dimensional multiphase fluid simulations of the sample loading into different channel
and inlet geometries were conducted with COMSOL Multiphysics. First, we compared the
curved channel to a straight channel under conditions simulating vacuum-assisted loading.
Initially, the inlet of the main channel was filled with water (aqueous phase) and the rest of
the geometry was occupied by low pressure air (gas phase). The modeled curved channel is
a 180° semi-circle. Both channels were 10 mm in overall length and 0.1 mm wide.
Two physical models were involved in the models: First, the laminar two-phase
flow, level set model was used to track the interface between two immiscible fluids. It
solved Navier-Stokes equations for the conservation of momentum and a continuity
equation for the conservation of mass. The interface position was tracked by solving a
transport equation for the level-set function in COMSOL:
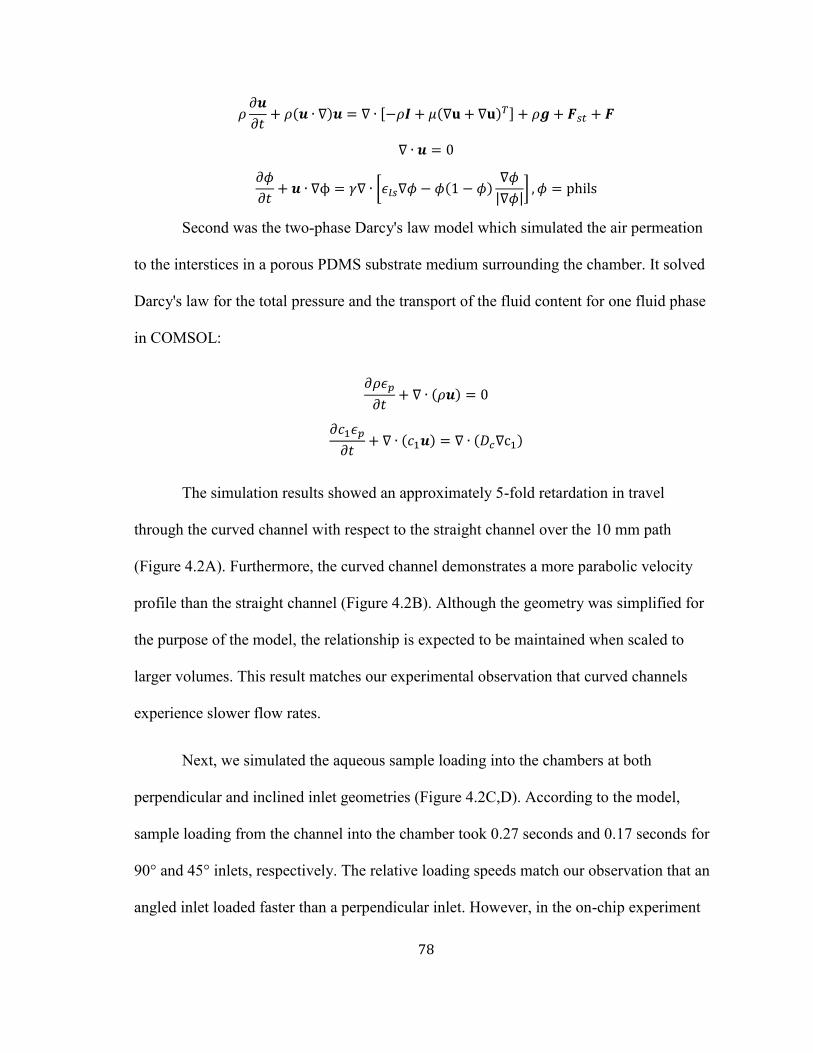
78
𝜌𝜕𝒖
𝜕𝑡+ 𝜌(𝒖 ∙ ∇)𝒖 = ∇ ∙ [−𝜌𝑰 + 𝜇(∇𝐮 + ∇𝐮)𝑇] + 𝜌𝒈 + 𝑭𝑠𝑡 + 𝑭
∇ ∙ 𝒖 = 0
𝜕𝜙
𝜕𝑡+ 𝒖 ∙ ∇ϕ = 𝛾∇ ∙ [𝜖𝑙𝑠∇𝜙 − 𝜙(1 − 𝜙)
∇𝜙
|∇𝜙|] , 𝜙 = phils
Second was the two-phase Darcy's law model which simulated the air permeation
to the interstices in a porous PDMS substrate medium surrounding the chamber. It solved
Darcy's law for the total pressure and the transport of the fluid content for one fluid phase
in COMSOL:
𝜕𝜌𝜖𝑝
𝜕𝑡+ ∇ ∙ (𝜌𝒖) = 0
𝜕𝑐1𝜖𝑝
𝜕𝑡+ ∇ ∙ (𝑐1𝒖) = ∇ ∙ (𝐷𝑐∇c1)
The simulation results showed an approximately 5-fold retardation in travel
through the curved channel with respect to the straight channel over the 10 mm path
(Figure 4.2A). Furthermore, the curved channel demonstrates a more parabolic velocity
profile than the straight channel (Figure 4.2B). Although the geometry was simplified for
the purpose of the model, the relationship is expected to be maintained when scaled to
larger volumes. This result matches our experimental observation that curved channels
experience slower flow rates.
Next, we simulated the aqueous sample loading into the chambers at both
perpendicular and inclined inlet geometries (Figure 4.2C,D). According to the model,
sample loading from the channel into the chamber took 0.27 seconds and 0.17 seconds for
90° and 45° inlets, respectively. The relative loading speeds match our observation that an
angled inlet loaded faster than a perpendicular inlet. However, in the on-chip experiment

79
we observed that loading could take as long as 5-15 seconds. This deviation can be
attributed to the driving force variation in the sample digitization process. Specifically,
absolute pressure within the air phase of the chip increases as the sample loads, resulting in
a reduction in the pressure differential driving the liquid as it moves from the sample inlet
to outlet. Thus, it takes a shorter time to fill a chamber close to the inlet when compared to
those located near the outlet. Nonetheless, the essential features of the sample loading and
digitization presented by the simulation were in good agreement with our experimental
observations.
Loading efficiency in 2D vs. 3D device
Experimentally, we sought to quantitatively assess the loading efficiency of the
multilayer curved channel device (hw = 2*hc) as compared to the identical pattern in a
single layer (hw = hc). Images were acquired of each device during loading. A single, fixed
well was chosen for the time course study, beginning at the point the liquid first passes the
well inlet. At each subsequent time point, the filled area of the well was compared to the
volume of fluid that had continued along the channel, which we termed the “waste
volume” (Figure 4.3A). The single layer device had a waste volume of 0.93 µL, 12% of the
input volume (8 µL), whereas the multilayer produced only 0.34 µL, 4% (Figure 4.3B).
Furthermore, the multilayer device filled each well ~3 times faster than the single layer,
resulting in significantly higher loading efficiency of the sample.

80
The multilayer architecture also offers several advantages for partitioning and assay
performance. The device utilizes a vertical compartmentalization strategy that
complements the densities of the entrapped materials, namely the reaction fluid (ρfl ≈ 1
g/mL), the partitioning oil (100 cst silicone oil [Sigma-Aldrich], ρoil = 0.967 g/mL), and air
(ρair = 0.001 g/mL). Since ρfl > ρoil >> ρair, the partitioning oil drives any remaining
reaction fluid from the channels down into the wells. Air, which notoriously prevents
successful high-temperature reactions in enclosed devices, rises up to the channels, and is
ejected by the partitioning oil (Figure 4.4). The environment is thus robust to amplification
via high temperature assays such as PCR.
Reducing PDMS distortion and misalignment
Despite the advantages of the multilayer device, achieving reliable and repeatable
fabrication was nontrivial. PDMS distortion with respect to its mold is a well-known
challenge in multilayer soft lithography. Several attempts have been made to address the
issue, namely by characterizing the distortion ratio [106], developing intricate fabrication
techniques [107], and including tolerances into the design [108]. The presented multilayer
design requires strict alignment of two peeled PDMS layers, which eliminates simple
scaling as an option. In order to maintain high efficiency in loading and a high-density
array footprint, large error tolerances were also not a viable option. Therefore, we
investigated the relationship between distortion and PDMS height.

81
PDMS patterns of various heights were aligned and compared to the pattern mask
using a laser microscope (Keyence VK-X100) (Figure 4.5A). For both mold heights, we
observed a clear trend that smaller PDMS heights led to more predictable and less overall
distortion (Figure 4.5B). By reducing the PDMS height to 26 µm, the distortion could be
reduced to ≈0.32%, with a standard deviation of 0.015%. To achieve consistent results
across layers and thereby minimize misalignment, an ultra-thin soft lithography fabrication
technique was implemented (Figure 4.6). This ultra-thin technique is simple and obviates
the need for any additional materials during fabrication. The evaporation potential is
minimized by reducing the volume of porous hydrogel above the wells. Although
alignment of the two layers requires a trained user, misalignment can be effectively
reduced by minimizing the PDMS distortion from the mold.
Highly efficient detection of DNA methylation
To demonstrate the overall detection efficiency of the device, fixed amounts of
synthetic DNA representative of fully methylated CDKN2A (p14ARF), a well-established
methylation biomarker for various cancer types [109], were digitized on the device. 8 µL
of reaction mix were prepared containing a serial dilution of methylated p14ARF from
≈1000 to 100 copies. Fluorescent images were acquired after PCR amplification to
quantify the number of detected methylated targets on the multilayer device (Figure 4.7A).
The absolute copy number detected closely matched the expected amount loaded into the
chip for each dilution.

82
The results demonstrate an ultimate detection efficiency of 70-80%, and detection
of as few as 100 copies in 8 µL (Figure 4.7A). The reference channel was used to calculate
the DNA concentration from the filled wells. The results demonstrate the high accuracy of
the digital system at 93% (Figure 4.7B). The 7% loss is considered inherent to the system,
and may occur due to sample preparation or the material properties of the device.
Therefore, the average loading efficiency of the multilayer device is 80% (Figure 4.7C),
which is 7 times higher than our previous work.
The high detection efficiency of this system qualifies it as a suitable method for
detection of rare molecules in liquid biopsies. The reported average detection efficiency of
73% includes all potential sources of loss or variability. No system can be expected to be
100% efficient, as single copies of DNA can be lost in preparation steps, pipetting, freeze-
thaw cycle, etc. Nevertheless, these improvements on loading and detection efficiency are
important steps in advancing the clinical utility of this digital melt platform.
Epiallelic discrimination by digital melt
A key benefit of the HYPER-Melt platform is the ability to not only detect and
enumerate target molecules, but also to enable genotyping of a target locus. As shown
previously [63], in the case of DNA methylation, HRM can be used to readily determine
the methylation density of each detected epiallele. We used this paradigm to demonstrate
epiallelic discrimination in the present device by loading and digitizing samples containing
synthetic oligonucleotide targets representative of bisulfite-converted sequences of

83
heterogeneously-methylated p14ARF epialleles at methylation densities of 33%, 67% and
100%, as well as an unmethylated (0%) population representing background DNA from
ostensibly healthy, noncancerous cells.
Following amplification, the device was taken to the digital melt platform for
parallelized melt curve acquisition. The negative derivative of the curve was taken to
determine the melt temperature (“peak”) of each amplicon. Amplification and HRM of the
unmethylated control DNA at a concentration of 500 copies/nL, or 4 million copies
resulted in an even distribution of positive wells containing a homogenous population of
amplicons exhibiting melt centered at 83˚C (Figure 4.8A). Next, 400 copies of each
methylated epiallele were digitized amongst the 8 million copy background. The melt
temperature was calculated for each amplicon, and the corresponding methylation density
was distinguished by thresholding. A methylation heatmap was then generated to provide a
quantitative metric of the methylation heterogeneity of the sample (Figure 4.8B).
Representative traces of each epiallelic population demonstrate the high sensitivity of this
digital melt platform, and a sequence resolution of ≈4 CpG sites.
The ability to perform HRM-based discrimination enables rare and heterogeneous
population analysis in an all-in-one platform, for which this is no current commercially
available alternative. The impact of methylation heterogeneity in cancer and development
is only just beginning to be elucidated. Several models have predicted that differential
methylation occurs very early in carcinogenesis [29], [110]. This platform provides a
simple, low-cost tool for quantification of rare DNA methylation heterogeneity.

84
In conclusion, we presented a multilayer microfluidic device that achieves efficient
and highly sensitive detection and discrimination of DNA methylation heterogeneity of
rare molecular populations. The curved channels and multilayer architecture improved
loading efficiency up to 7x more than our previous design. The digital melt platform
provides a rapid and facile technique for parallelized sequence interrogation at the single-
copy level, allowing a comprehensive analysis of DNA methylation heterogeneity,
especially in challenging samples such as liquid biopsies. We hope this technology can be
applied to potentially improve sensitivity in cancer detection and therapeutic monitoring,
and to provide insight into molecular mechanisms of tumor evolution.
Methods
Device Fabrication
Molds were fabricated with SU-8 photoresist (MicroChem) via standard
photolithography. Silicon wafers were dehydrated for at least 4 hours at 200°C, then
oxygen-plasma treated at 80 W for 1 minute (Technics PE-IIA). For the well layer, SU-8
3050 was spin-coated at 1800 rpm for 1 min, soft-baked at 95°C for 27 min, and exposed
at 175 J/cm2. For the channel layer, SU-8 3025 was spin-coated at 1800 rpm for 1 min,
soft-baked at 95°C for 14 min, and exposed at 150 J/cm2. Both molds were then baked at
95°C for 5 min, developed with SU-8 developer (MicroChem), and baked at 200°C for 1
hr.
PDMS devices were fabricated with an adapted ultra-thin soft lithography
technique (Fig. S1). PDMS (Ellsworth) at a ratio of 15:1 elastomer base to curing agent

85
was spin-coated on the well and channel pattern layers at 700 and 900 rpm respectively. A
sacrificial layer of 6:1 PDMS was spin-coated on a blank wafer at 100 rpm. All were baked
for 6 min at 80°C. The sacrificial layer was then removed, placed on the pattern layer, and
temporarily bonded by baking at 80°C for 6 min. Both joint layers were then removed
from the mold. The well layer was bonded to the glass slide by oxygen-plasma bonding at
80 W for 1 min. Next the wells and channel layers were oxygen- plasma treated, aligned,
and bonded. Finally, the sacrificial layer was removed, and coverglass and adapters were
oxygen-plasma bonded to the top surface.
Modeling and Simulation
Two-dimensional multiphase fluid simulations of the sample loading into a single
side chamber were conducted with a CFD package (COMSOL Multiphysics® v. 5.2.
COMSOL AB, Stockholm, Sweden). The model comprised of a laminar two-phase flow
level set and two-phase Darcy’s law models. Additional parameters and a detailed model
description are given in the supplementary information (Table 3).The geometric
parameters, chamber inlet angle and channel curvature, were varied to assess loading speed
of a single well and fluid velocity along the channel (Fig. S2).
Digital PCR and Melt
The reaction mix was prepared off-chip to yield final working concentrations of
1.66 mM (NH4)2SO4, 6.7 mM Tris pH 8.8, 2.7 mM MgCl2, 1 mM β- mercaptoethanol, 300
nM primers (IDT), 200 µM dNTPs (Thermofisher Scientific), 1X ROX (Thermofisher
Scientific), 1.2 U/µL Platinum Taq DNA polymerase (Thermofisher Scientific), 1 mg/mL
BSA (NEB), 0.01% Tween 20 (Sigma Aldrich), and 1X Evagreen (Biotium). The device
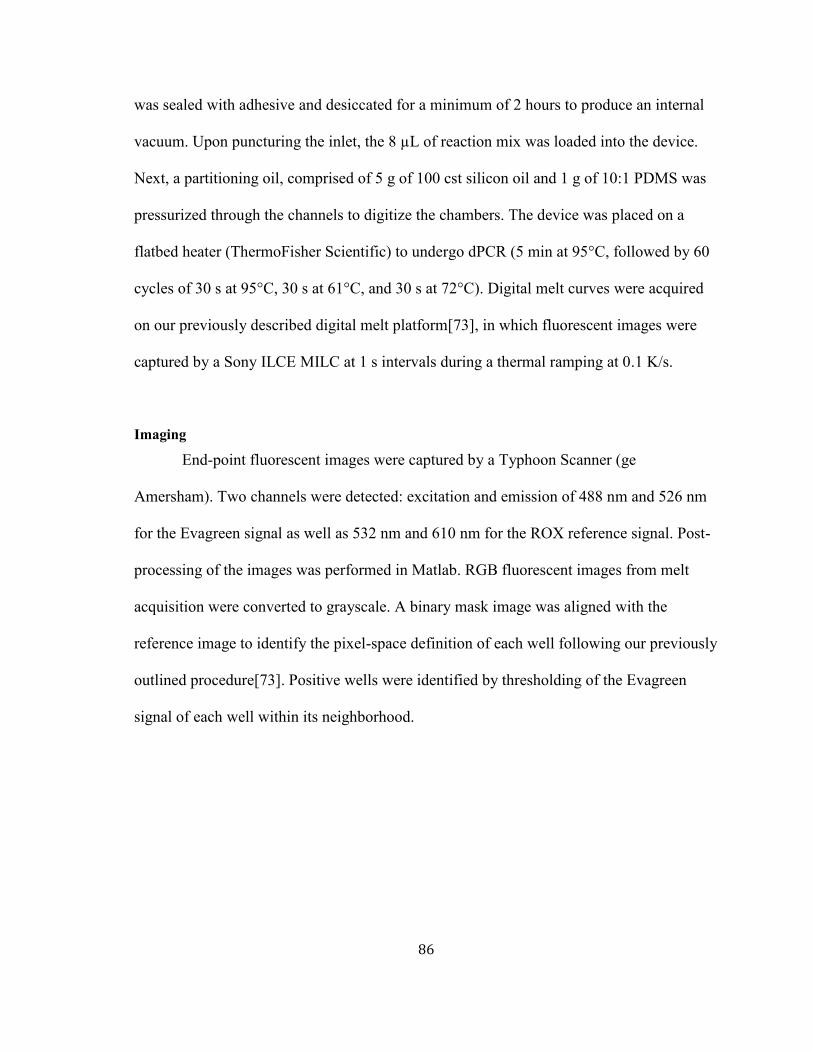
86
was sealed with adhesive and desiccated for a minimum of 2 hours to produce an internal
vacuum. Upon puncturing the inlet, the 8 µL of reaction mix was loaded into the device.
Next, a partitioning oil, comprised of 5 g of 100 cst silicon oil and 1 g of 10:1 PDMS was
pressurized through the channels to digitize the chambers. The device was placed on a
flatbed heater (ThermoFisher Scientific) to undergo dPCR (5 min at 95°C, followed by 60
cycles of 30 s at 95°C, 30 s at 61°C, and 30 s at 72°C). Digital melt curves were acquired
on our previously described digital melt platform[73], in which fluorescent images were
captured by a Sony ILCE MILC at 1 s intervals during a thermal ramping at 0.1 K/s.
Imaging
End-point fluorescent images were captured by a Typhoon Scanner (ge
Amersham). Two channels were detected: excitation and emission of 488 nm and 526 nm
for the Evagreen signal as well as 532 nm and 610 nm for the ROX reference signal. Post-
processing of the images was performed in Matlab. RGB fluorescent images from melt
acquisition were converted to grayscale. A binary mask image was aligned with the
reference image to identify the pixel-space definition of each well following our previously
outlined procedure[73]. Positive wells were identified by thresholding of the Evagreen
signal of each well within its neighborhood.

87
Figure 4.1. Multilayer Device Geometry
(A) The device consists of 2 PDMS layers sandwiched between glass slides. The curved
channel sits above the wells. (B) The device is fully loaded with dye from a single inlet
and semi-circle bifurcation. (C) Reagents are loaded into a vacuumed device, filling the
wells. Oil is pressurized through the channel for partitioning and to eject excess air. This
figure is reprinted with permission from reference [111].

88
Channel-chamber with straight conjunction
Channel-chamber with 45° conjunction
Straight main channel
180° curved main channel
Geometry
Channel: w=100μm, h=50μm. Chamber: w=h=80μm
Channel: w=100μm, h=50μm. Chamber: w=h=80μm
Channel: w=20mm, h = 0.1mm
Channel: l=20mm, h = 0.1mm, d1 =6.42mm, d2=6.32mm
Physical model 1
Laminar Two-Phase Flow, Level Set
Laminar Two-Phase Flow, Level Set
Laminar Two-Phase Flow, Level Set
Laminar Two-Phase Flow, Level Set
Fluid properties
Fluid 1: air. Fluid 2: water. T=293.15K, built-in density and dynamic viscosity
Fluid 1: air. Fluid 2: water. T=293.15K, built-in density and dynamic viscosity
Fluid 1: air. Fluid 2: water. T=293.15K, built-in density and dynamic viscosity
Fluid 1: air. Fluid 2: water. T=293.15K, built-in density and dynamic viscosity
Inlet condition Laminar inflow V=0.05m/s
Laminar inflow V=0.05m/s
Laminar inflow V=0.001m/s
Laminar inflow V=0.001m/s
Outlet condition
Pressure P0= 0, Suppress backflow
Pressure P0= 0, Suppress backflow
Pressure P0= 0, Suppress backflow
Pressure P0= 0, Suppress backflow
Wall condition Wetted wall: θw=90°, β=5μm
Wetted wall: θw=90°, β=5μm No slip No slip
Physical model 2
Two-phase Darcy's law
Two-phase Darcy's law N/A N/A
Porous media properties
Dc=500μm^2/s, Kr1=0.2, Kr2= 0.01
Dc=500μm^2/s, Kr1=0.2, Kr2= 0.01 N/A N/A
Inlet condition Normal inflow V=0.5mm/s
Normal inflow V=0.5mm/s N/A N/A
Outlet condition
Pressure P2= -0.01atm
Pressure P2= -0.01atm N/A N/A
Mesh 1849 domain & 207 boundary elements
2144 domain & 219 boundary elements
7256 domain & 1458 boundary elements
3046 domain & 1010 boundary elements
Time stepping method generalized-alpha generalized-alpha generalized-alpha generalized-alpha
Time step size 0.01s 0.01s 0.1s 0.1s
Time 10s 10s 10s 10s
Table 3. Parameters involved in the two-dimensional multiphase fluid model of the sample
digitization in COMSOL

89
Figure 4.2. Simulation Results
(A) COMSOL simulation results of sample loading in 180° curved vs. linear main
channels with same length by two-dimensional water-air multiphase flow CFD analysis.
(B) Aqueous sample velocity profiles of each channel geometry after the channel was
filled with the aqueous sample. COMSOL simulation results of sample digitization by two-
dimensional water-air multiphase flow CFD analysis before (t0), (C) Straight (D) 45°
inclined chamber filling; shown are the color contours of the water volume fraction
ranging from blue = air to red = water (refer to the color legend) and the water/air
interface. The vectors show the flow velocity in the whole geometry. This figure is
reprinted with permission from reference [111].

90
Figure 4.3. 2D vs. 3D Comparison of Fill Rate and Waste Vlume
(A) Continuous images were acquired during loading of dye into a single layer and
multilayer device. A timer starts when the dye first passes the single observation well, and
ends when the well is fully filled. (B) The fill rate, time to fill a single 750 pL well, is
much faster for the multilayer device. The waste volume, volume of liquid that is in the
channels past the observation well at the time of fully filled, is lower for the multilayer
device than the single layer. This figure is reprinted with permission from reference [111].
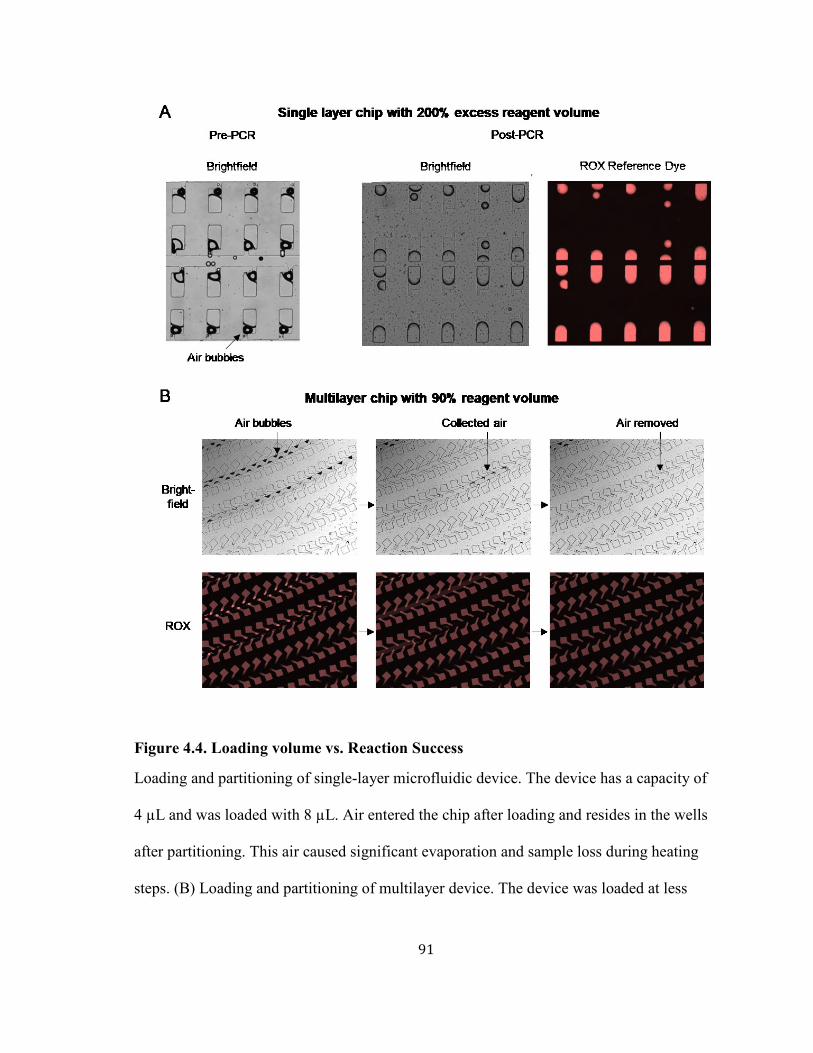
91
Figure 4.4. Loading volume vs. Reaction Success
Loading and partitioning of single-layer microfluidic device. The device has a capacity of
4 µL and was loaded with 8 µL. Air entered the chip after loading and resides in the wells
after partitioning. This air caused significant evaporation and sample loss during heating
steps. (B) Loading and partitioning of multilayer device. The device was loaded at less

92
than full capacity to minimize loss. Air collects in the channels and is removed by oil
partitioning. This figure is reprinted with permission from reference [111].

93
Figure 4.5. PDMS Warping vs. Thickness
(A) The PDMS pattern was aligned against the mask to measure the percent distortion. (B)
The distortion was compared at different PDMS thicknesses for molds of two different
resist heights. This figure is reprinted with permission from reference [111].

94

95
Figure 4.6. Multilayer Fabrication Protocol
Ultra-thin layers of PDMS were spun on each pattern mold, and removed by temporary
bonding of a sacrificial layer. The two patterns were then oxygen-plasma treated, aligned,
and bonded. Finally, a coverglass and adapters where oxygen-plasma bonded. This figure
is reprinted with permission from reference [111].
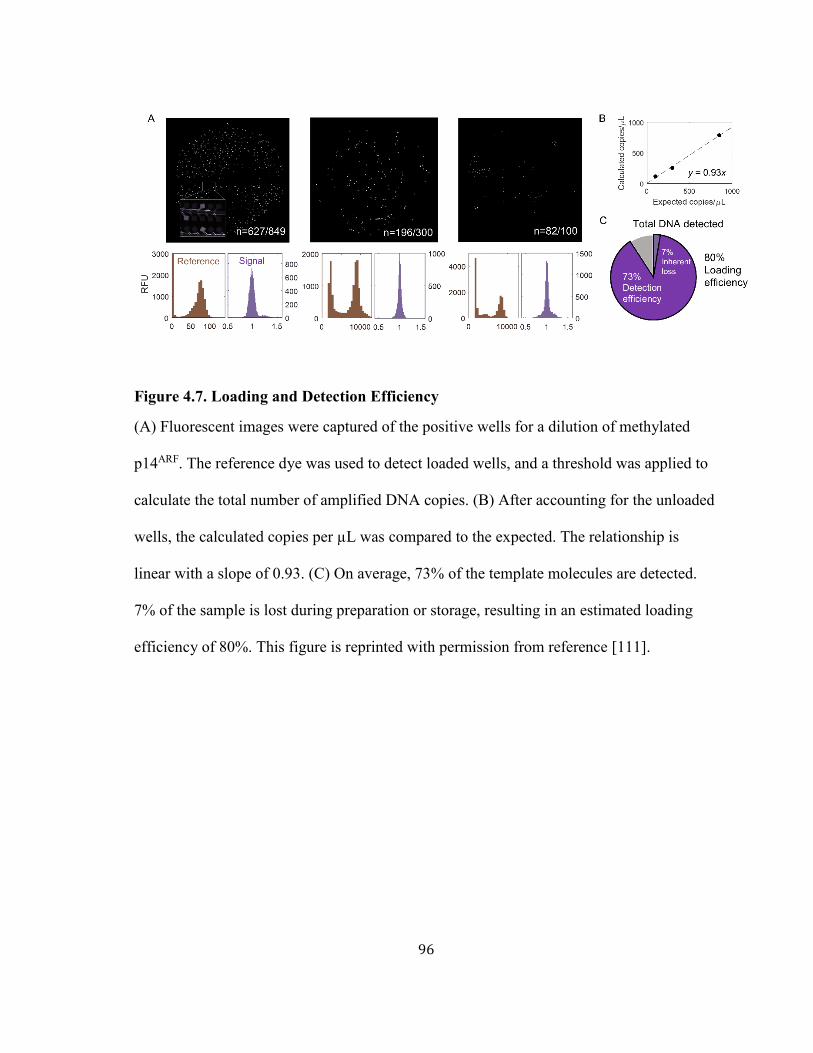
96
Figure 4.7. Loading and Detection Efficiency
(A) Fluorescent images were captured of the positive wells for a dilution of methylated
p14ARF. The reference dye was used to detect loaded wells, and a threshold was applied to
calculate the total number of amplified DNA copies. (B) After accounting for the unloaded
wells, the calculated copies per µL was compared to the expected. The relationship is
linear with a slope of 0.93. (C) On average, 73% of the template molecules are detected.
7% of the sample is lost during preparation or storage, resulting in an estimated loading
efficiency of 80%. This figure is reprinted with permission from reference [111].
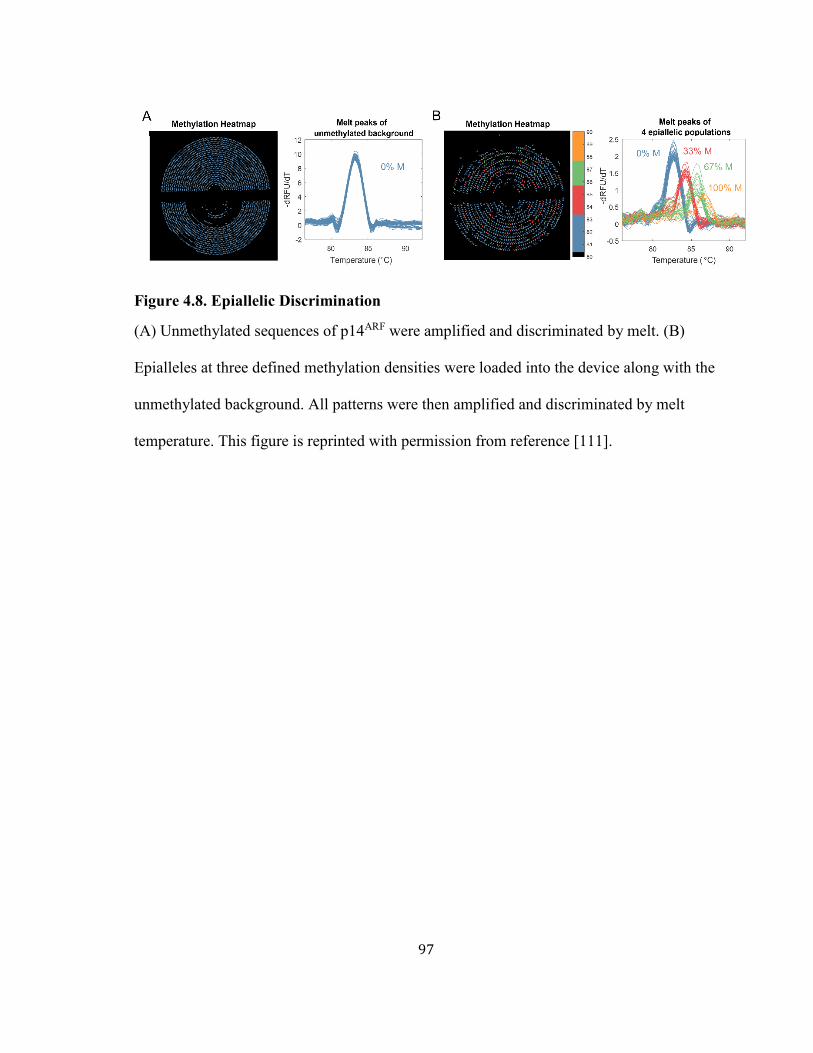
97
Figure 4.8. Epiallelic Discrimination
(A) Unmethylated sequences of p14ARF were amplified and discriminated by melt. (B)
Epialleles at three defined methylation densities were loaded into the device along with the
unmethylated background. All patterns were then amplified and discriminated by melt
temperature. This figure is reprinted with permission from reference [111].
98
Chapter 5
DROPLET DIGITAL HIGH RESOLUTION MELT
Overview of Droplet technologies
Clinical adoption of new technologies requires both strong analytical capabilities as
well as sufficient throughput for patient or sample load, a factor that is often overlooked in
development of microfluidic platforms. Despite advances in microchamber real-time
analysis platforms, such static arrays will always be limited in throughput compared to
droplet technologies. The ability to serially generate as many droplets as needed provides
for fundamentally unlimited sensitivity and much higher throughput. Thus, many
laboratories are realizing widespread adoption of commercial droplet digital PCR (ddPCR)
platforms.
Droplet microfluidic platforms have greatly enhanced the throughput and
sensitivity of single-molecule and single-cell analyses. However, real-time analyses of
individual droplets remain challenging. Most droplet microfluidic platforms have

99
fundamental drawbacks that undermine their utility toward applications that rely on real-
time monitoring to identify rare variants, such as bacterial persistence, drug discovery,
antibody production, epigenetic biomarker analyses, etc. We present a platform for high-
density droplet trapping and real-time analysis with 100% loading and trapping efficiency
at a packing density of 110,000 droplets per in2. To demonstrate real-time analysis
capabilities, we perform digital PCR and parallelized digital high-resolution melt curve
acquisition on droplets to discriminate methylation levels of a tumor suppressor gene,
CDO1, on a molecule-by-molecule basis. We hope that this platform, which is compatible
with a large range of droplet sizes and generation technologies, may facilitate high-
throughput real-time analyses on a molecule-by-molecule or cell-by-cell basis of
heterogeneous populations.
Droplet platforms have been used to detect and analyze nucleic acid and protein
biomarkers as well as single cells with drastically higher sensitivities than bulk methods
[64], [112]–[116]. Furthermore, with advances in droplet microfluidic technologies,
commercial platforms like BioRad QX200 ddPCR and RainDance RainDrop have become
turnkey tools for a wide range of clinical applications, such as copy number variation
[117]–[119], biomarker detection [120]–[123], gene expression analysis [124]–[126], and
pathogen detection [127], [128].
Despite their tremendous advantages in sensitivity and throughput, most existing
droplet platforms rely on sequential measurements of each droplet and its assay reactants at
a single predetermined time point (“endpoint analysis”) [129]–[132]. This limitation
precludes their utility in biological assays that rely on or benefit from time-resolved

100
measurements of reactants (“real-time analysis”), such as molecular profiling using
melting curve analysis [60], [63], [73], [111], [133]–[135], cell growth monitoring [136],
[137], and enzyme kinetics observations [58], [138]–[140].
For effective real-time analysis of individual droplets, it is advantageous to
immobilize the droplets such that they can be easily monitored over the course of the
assay. However, previous attempts at developing such a real-time droplet analysis platform
have resulted in a tradeoff, in which there is a reduction in either throughput or droplet
capture efficiency. To ensure trapping of many or most of the droplets in a reaction, some
methods directly generate droplets into a chamber or reservoir for reaction and analysis
[59], [103], [141]–[143]. However, once loaded, these devices are sealed and droplet
generation halted while all required reaction steps are performed in the chamber.
Therefore, these “on-chip” methods are inherently limited in throughput, as the entire
device is restricted to a single run of a single condition or sample, especially for multistep
assays that contain time-consuming reaction or incubation steps. Even with multiple
devices, the number of reactions or samples that may be parallelized is constrained by the
two-dimensional surface area of commercial heaters. Moreover, the footprint of these
chambers may be inefficiently utilized, as they retain the immiscible oil phase used in
droplet generation.
In contrast, trapping strategies that are fundamentally compatible with “off-chip”
droplet production allow high-throughput parallelization of time-limiting reaction steps on
conventional 96- or 384-well plates before subsequently attempting to capture the droplets
in an array/chip for analysis. These methods potentially enable simultaneous assessment of

101
multiple reactions, a range of reaction conditions, or large patient/sample cohorts for time-
limiting reaction steps in a high-throughput manner that is favorable for translational
potential. In addition, the throughput of subsequent real-time analyses can be further
enhanced by incorporating multiple trapping units on a single device. However, current
“off-chip” trapping designs have poor capture efficiencies, only capturing and analyzing a
small percentage of overall droplets [58], [136], [144]–[146], as a large number of droplets
tend to bypass the storage chambers and are lost when loading the array.
Ultimately, loss in either throughput or droplet capture efficiency undermines the
utility of current platforms towards clinical analyses of rare molecules or biomarkers and
applications that require real-time monitoring to identify extremely rare variants, such as
bacterial persistence [147], drug discovery [148], directed evolution [149], antibiotic
resistance [150], and circulating biomarker analysis [63], [73], [110], [111], [133]. To
overcome this tradeoff, we have developed a real-time droplet platform that enhances the
overall throughput of droplet real-time analyses by maximizing space utilization,
operational flexibility, and capture efficiency.
Herein we present a microfluidic platform with 100% loading efficiency for high-
density droplet trapping and real-time monitoring that is universally compatible with other
droplet systems. The platform consists of a microfluidic droplet trapping device and a
thermal-optical platform for parallelized real-time analyses across a wide range of
temperatures. The trapping device employs a simple, passive immobilization strategy that
is fundamentally compatible with any droplet size, and therefore is congruent with existing
commercial droplet platforms.

102
Highly efficient loading and capturing of droplets via pseudo-sieve
The presented platform enables high-density trapping and immobilization of
droplets for real-time monitoring and detection of rare molecules or variants. The platform
consists of two main components: (1) the droplet trapping and immobilization device,
which loads and immobilizes droplets at 100% efficiency by means of a sieve-like floor,
and (2) the thermal-optical imaging platform, which acquires fluorescent images of all
droplets within the device at specified temperatures. We implement this platform to
perform high resolution melt (HRM) analysis for detection and discrimination of rare
methylated biomarkers.
We previously developed a technique termed DREAMing, Discrimination of Rare
EpiAlleles by Melt, as a facile means of detecting various methylation patterns on a
molecule-by-molecule basis amongst high background [63]. Briefly, the technique utilizes
methylation-preferred or methylation-agnostic primers to amplify all bisulfite-converted
methylation patterns of a given locus at single-copy sensitivity. Next, the sequences are
discriminated by HRM by observing the sequence-dependent release of a DNA
intercalating dye during thermal ramping. However, this technique performs quasi-digital
analysis via conventional multiwell plates with limited dynamic range of detection and
sensitivity, thereby undermining its practicality for clinical use. To address this, we
developed a microfluidic digital array platform called HYPER-Melt in which we
implement this technique in a high density array of nanowells [73]. This microfluidic
digital array platform enables detection and discrimination of methylated variants at
103
frequencies as low as 0.00005%. We then further improved the platform by increasing the
loading efficiency from 12% to 80% [111]. However, this on-chip integrated system
suffers from low throughput due to minimal parallelization of the time-consuming PCR
step (three hours) required before dHRM analysis (five minutes).
Therefore, we sought to implement this technique on a digital droplet platform in
order to significantly improve performance in terms of sensitivity and throughput. Whereas
the array-based device is limited to performing ~4 to 6 PCR reactions in parallel on a
single thermocycler, a commercial ddPCR system such as the BioRad QX200 may digitize
as many as 8 samples into droplets at once, and can perform the time-limiting PCR step on
as many as 96 samples simultaneously. By incorporating off-chip PCR thermocycling with
a multi-module droplet trapping device and HRM platform, the system can realize both
higher loading efficiency and much higher throughput.
To perform droplet digital HRM (ddHRM), we compartmentalized the reaction mix
into droplets by flow-focusing. Droplets for each sample to be analyzed were loaded into a
well of a 96-well plate and amplified by PCR in parallel on a thermal cycler. Next, droplets
were loaded into the trapping device, and melt curves were acquired from each amplicon
via the thermal-optical platform. After analysis, a population profile of various methylation
levels was generated for each sample.
Device Architecture
100% Efficient Loading and Trapping Mechanism

104
The high-density packing device consists of a glass microscope slide at the base
and two PDMS layers, an upper droplet chamber and a lower pseudo-sieve floor (Figure
5.1A). Up to five modules may be assembled in parallel onto a single glass slide as needed.
Within each module, the pseudo-sieve layer is comprised of tightly spaced eight-sided
polygonal posts (Figure 5.1B). The intermittent top surfaces of each post are defined as the
“floor” of the droplet chamber. The continuous surface at the bottom, between each post, is
considered the “basement” of the device. A “highway”, or space without posts, runs
between columns at approximately each third of the device to evenly space the droplets
and relieve pressure.
The grid-like arrangement of the posts creates an array of gaps in the floor of
diameter dg between the corners of each post. Upon entering the chamber, the height of the
ceiling (hc) is less than the spherical height of each droplet, such that droplets are under
slight compression between the ceiling and the floor (Figure 5.1C). Droplets favor
placement over the gaps due to the decrease in surface tension [145]. The tight spacing
between posts prevents droplets from escaping below the chamber into the basement of the
device, whereas any excess oil between droplets may pass between the posts, through the
basement, to the outlet of the device (Figure 5.1D).
Droplets are pressure-loaded into the device inlet with a syringe pump (Figure
5.1E). Upon reaching the droplet chamber, droplets self-assemble into a grid-like
arrangement over the posts. Once reaching the end or side walls of the chamber, droplets
are unable to escape, thereby demonstrating 100% efficiency in loading. Excess space

105
occupied by oil in the droplet chamber can be removed through the basement to achieve
100% efficiency in trapping at a packing density of 110,000 droplets per in2 (Figure 5.1F).
Scalable Droplet Capacity
In most single-point disseminating loading mechanisms, wherein droplets are
propelled by pressure-driven flow, a pressure gradient develops as more droplets
accumulate downstream and offer resistance. Since the pressure is greatest at the inlet, this
limitation is known as “back-pressure.” Excess back-pressure is a common problem in
many microfluidic trapping systems which limits the total amount of droplets that can be
loaded while maintaining droplet stability [139]. In earlier generations of the device
design, we observed increased compression of droplets due to pressure during filling of the
final corners of the device, especially at the center regions on each end (Figure 5.2A),
which could compromise droplet integrity.
To address this, we implemented “highways” to reduce back-pressure and to
facilitate even distribution of droplets throughout the device chamber during loading. The
highways run through the initial 75% of the device, whereupon they cease to ensure
trapping at the distal end. After implementing highways between each third of the device,
droplets were observed to exhibit uniform, minimal compression throughout the device
(Figure 5.2B, Figure 5.3). Therefore, the device design is fundamentally scalable to higher
droplet capacities.
High-throughput real-time melt curve methylation profiling from droplets

106
Although the key goal in developing this device was to provide real-time
monitoring capabilities, the device and imaging platform may also be utilized for highly
accurate quantification and detection of rare molecules. While current commercial
platforms may include separate fluorescent readout instrumentation, they provide no means
of visual inspection and droplets are irrecoverable after analysis. Droplets in the high-
density packing device may be quantified with any fluorescence platform as well as bright-
field microscopy to allow for visual inspection of the droplets.
To validate the accuracy of the system, a serial dilution of synthetic DNA,
representative of bisulfite-converted 100% methylated CDO1, was partitioned into 500 pL
droplets, amplified in a 96-well plate, and then loaded onto the trapping device. The device
was placed on the thermal-optical platform to acquire a single wide-field fluorescent
image. The droplets were segmented in ImageJ, whereupon the number of positive droplets
was calculated from the Poissonian occupancy equation. The assay was also cross-
validated by performing the same protocol in bulk and with the Biorad QX200 system
(Figure 5.4).
The expected occupancy of the synthetic target ranged from 11% to 0.04%. The
calculated vs. expected occupancies are shown in Figure 5.5 (log-log). The lower
occupancies were repeated thrice while the higher occupancies were tested once. A linear
regression curve was fit in Matlab, producing a slope of 0.98 with an R2 of 0.99. These
results demonstrate the utility of this platform for highly accurate droplet quantification,
and provide a simple alternative to complex commercial droplet readers.
System Versatility
107
Due to the wide range of applications utilizing droplet technology, a fundamental
aspect of the device design was versatility in droplet generation platforms and in droplet
size. Therefore, we assessed the loading performance of our device across a range of
common droplet volumes. Devices capable of producing 100 pL, 600 pL, and 1000 pL
droplets using flow-focusing discretization were designed. The devices included geometric
modifications of the flow-focusing nozzle used in devices we have previously developed
[151]–[153]. Droplets were also generated using the BioRad QX200 platform and assessed
for compatibility with the trapping device and real-time system. The device demonstrated
100% efficiency in loading of droplets ranging from 100 pL to 1 nL (Figure 5.6).
The increasing number of applications of droplet technology may be attributed to
the increased availability and reliability of commercial droplet platforms [154], such as
BioRad’s QX200 droplet system and RainDance’s RainDrop Plus platform. In addition,
increased research into surfactants and other droplet stabilizers [65], [100], [149], [155]
has propelled the development of microfabricated droplet generation systems [65]–[67],
[156]–[158]. With this device, we demonstrate loading and analysis of droplets generated
by both our microfluidic droplet generation device as well as droplets generated by the
Biorad QX200 system. By integrating this device with other droplet systems, real-time
analysis of droplets can be achieved without compromising throughput.
Droplet Immobilization and Real-time Imaging
For time-lapse analyses of densely-packed systems, droplet immobilization is
critical to reduce the computational burden of droplet identification and ensure analytical

108
confidence. We demonstrate droplet immobilization on the device by evaluating the
position of post-PCR droplets in time-lapse fluorescent images during thermal ramping. A
mastermix was prepared with synthetic DNA representative of bisulfite-converted
methylated CDO1, from which 600 pL droplets were generated in a flow-focusing device.
After ddPCR in a 96-well plate, the droplets were loaded into the trapping device. The
device was sealed on both ends and placed on the thermal-optical platform.
Fluorescent images were acquired of the droplet trapping chamber during thermal
ramping (Figure 5.7). A grid is superimposed over a sub-region of the device to illustrate
the relative position of droplets between frames. Even at high temperatures, droplets
remain immobilized and stable, validating the robustness of the trapping mechanism. This
simple immobilization technique does not require any external equipment, and provides a
facile means to maintain discretization of signals from adjacent droplets in densely-packed
high-throughput systems.
Parallelized Droplet Digital High Resolution Melt (ddHRM)
We illustrate the potential utility of this platform towards analysis of heterogeneous
populations by performing droplet digital High Resolution Melt (ddHRM) to discriminate
molecule-by-molecule methylation patterns of bisulfite-converted DNA. Synthetic DNA
molecules representative of bisulfite-converted 0%, 50%, and 100% methylated CDO1
were digitized into 600 pL droplets. Droplets were then aliquoted into a 96-well plate and
amplified in a thermal cycler following a standard PCR protocol with methylation-

109
preferred primers as previously described [63]. Next, droplets were loaded onto the droplet
trapping device and placed on the thermal-optical platform for HRM analysis.
Wide-field fluorescent images of the droplet trapping region were acquired at 0.3°C
intervals during temperature ramping. To extract information from each individual droplet,
the images were first segmented in ImageJ (Figure 5.8) to identify the position of each
droplet (Figure 5.9A). Next, an automated Matlab script extracts the fluorescent
information from each droplet at each temperature interval to generate melt curves (Figure
5.9B). The peak of the negative derivative of each curve defines the melt temperature (Tm)
of each sequence. A digital melt histogram then displays the Tm of each amplicon, which
clearly depicts three distinct populations. The methylation density of each droplet can then
be classified by its Tm, providing a quantitative population profile of methylation
heterogeneity.
The system exhibits a high signal-to-background ratio of 1.9, and analysis of
surrounding negative droplets shows minimal change over the course of HRM acquisition
(Figure 5.10). Fluorescence leakage or diffusion between droplets was not observed,
however, these system characteristics should be assessed for each application, as different
assays, reaction mixes, or oil compositions may result in different behavior.
DNA methylation is one of the most-commonly studied epigenetic alterations in
cancer progression [8], [11], [15], [16]. Recent studies have shown that variable
methylation levels within a locus correlate with disease progression [27], [28].
Furthermore, many models predict that methylation levels are highly variable early in

110
carcinogenesis [29], [31], [110]. We hope that this device and platform will enable further
study into the effects of variable methylation on cancer etiology.
We developed a high-density droplet trapping device and thermal-optical platform
for time-lapse analyses of up to 30,000 droplets in parallel. Single molecules of DNA were
compartmentalized, amplified, and quantified at high accuracy across three orders of
magnitude at concentrations as low as 0.8 copies per µL. We demonstrated the utility of
this platform by profiling variable methylation levels of a tumor suppressor gene (CDO1)
with ddHRM. To our knowledge, this represents the first demonstration of ddHRM.
The pseudo-sieve functionality of the droplet chamber enables 100% loading and
trapping efficiency, thus the device is highly suitable for analysis of rare molecules or
variants. The simple, passive immobilization strategy is compatible with droplets of
different sizes and many readily-available imaging modalities. We demonstrated effective
mitigation of back-pressure, indicating that the design is readily-scalable to higher droplet
capacities and throughput.
There are aspects of the device design that could see readily-achievable
improvements. First, droplets have the potential to be recovered by reversing the direction
of flow in the device. Second, the throughput may be further increased in both sample
number and droplet capacity. Within a chamber, although the scaling potential is not
expected to be limited by back-pressure, a larger droplet chamber with a high aspect ratio
(w/h) may experience sagging during fabrication. This could be simply addressed by
incorporating support posts throughout the larger device. Finally, higher resolution
photolithography techniques may be utilized to produce finer spacing in the pseudo-sieve

111
layer. This would permit even smaller droplets to be captured and analyzed in the trapping
region. Incorporating this improvement may also lead to increased dynamic range and
sensitivity of the platform. We hope that researchers may utilize this technique to develop
better understanding of population heterogeneity and improve detection of rare biomarkers.
Methods
Device Fabrication
Two photomasks were designed in L-Edit v16.0 (Tanner EDA, Wilsonville, OR,
USA) for the upper chamber and for the pseudo-sieve post array and were printed onto
high-quality transparency (CAD/Art Services, Bandon, OR, USA). To fabricate the molds,
two silicon wafers were dehydrated for at least 6 hours, and oxygen-plasma treated at 85 W
for 1 min (Technics PE-II, San Jose, CA, USA). For the upper chamber, SU-8 3050
(MicroChem, Woburn, MA, USA) was spun at 3000 rpm for 30 s, baked at 65°C for 1 min
and 95°C for 15 min, and exposed at 180 mJ/cm2. For the pseudo-sieve layer, the SU-8
3025 (MicroChem, Woburn, MA, USA) was spun at 1800 rpm for 30 s, baked at 65°C for
1 min and 95°C for 14 min, and then exposed at 175 mJ/cm2. Following exposure, both
wafers were baked for 1 min at 65°C and 5 min at 95°C, developed with SU-8 developer,
and baked at 200°C for 1 hr.
The devices were fabricated from the master molds through soft lithography with
30 g of PDMS (Ellsworth Adhesives, Germantown, WI, USA), mixed at a ratio of 10:1
(w/w) with curing agent. The two layers were oxygen-plasma treated at 40 W for 45 s for
bonding. A glass microscope slide (#26007, TedPella, Redding, CA, USA) and a

112
coverglass slip (#260340, TedPell, Redding, CA, USA) were then oxygen-plasma treated
at 40 W for 45 s and bonded to the bottom and top of the device, respectively. The devices
were baked overnight at 80°C, and desiccated for 2 hours. Prior to use, FC-40 oil was
vacuum-loaded into the device.
Droplet Generation and ddPCR
The aqueous phase was first drawn into a 100-cm-long section of Tygon tubing
(#EW-06419-01, Cole-Parmer, Vernon Hills, IL, USA) with an inner diameter of 500 μm.
The Tygon tubing section was then connected to a Hamilton 1000 glass syringe
(SKU#20998, Sigma-Aldrich, St. Louis, MO, USA) containing FC-40 oil (SKU#F9755,
Sigma-Aldrich, St. Louis, MO, USA), which served as the displacement fluid for injecting
the aqueous phase into the device using a syringe pump (Harvard Apparatus, Holliston,
MA, USA) at a flow rate of 640 μL/h. Droplet generation oil was injected into the device
using a separate syringe pump at 2400 μL/h. Generated droplets were collected from the
device’s outlet into a 1.5 mL DNA LoBind Tube (#022431021, Eppendorf, Hauppauge,
NY, USA).
Device loading was observed using a custom microscope with a 4 x objective lens
(UPlanFl 4×/0.13 NA, Olympus, Tokyo, Japan) and a CMOS camera (#DCC1545M,
ThorLabs, Newton, NJ, USA).
Image analysis
113
To perform droplet segmentation and identification, the first 10 images were loaded
into ImageJ and averaged56. The resulting image underwent morphological opening,
followed by a morphological segmentation of radius gradient 1 to segment and identify
each droplet57. The droplet mask was then exported to Matlab for analysis along with the
subsequent images. An automated script MATLAB (MathWorks, Natick, MA, USA)
extracted the average raw fluorescence for each droplet at each temperature point and
binned the values in 0.3°C intervals to generate a melt curve for each droplet. After
Savitzky-Golay filtering of each curve, the negative derivative was taken to identify the
peak, or melt temperature (Tm) of the droplet amplicon. The methylation density of the
amplicon in each droplet was identified by thresholding.

114
Figure 5.1. Droplet Trapping Device Architecture
(A) The high-density trapping device may incorporate up to five modules as needed. Each
module consists of a glass slide, PDMS sieve layer, and PDMS chamber layer with access
ports. (B) A top view of the pseudo-sieve geometry shows the tightly spaced posts. Two
highways run through each third of the device. (C) Droplets sit in the chamber above the
posts. (D) Droplets are loaded until the chamber is full. Excess oil may pass through the

115
posts to the outlet. (E) Droplets are pressure loaded into the inlet, and self-assemble into a
grid while loading. Droplets are trapped against the walls and immobilized. Since no
droplets may escape, the device exhibits 100% loading efficiency. (F) The removal of
excess oil removes wasted space between droplets, such that they may be packed in a high-
density array for highly efficient loading. This figure is reprinted with permission from
reference [159].

116
Figure 5.2. Back-Pressure Relief
(A) Droplets loaded into previous versions of the device (without highways) experience
compression. Compression was most significant in the central lanes of the device.
Snapshots are shown of the proximal and distal areas. (B) With highways to help spread
the flow of droplets evenly, droplets remain uniform throughout the device and experience
only minimal compression due to high-density packing. This figure is reprinted with
permission from reference [159].

117
Figure 5.3. Fully loaded device with 500pL droplets
Droplets were generated by flow-focusing, and underwent ddPCR in a BioRad C1000
Touch Cycler. Droplets were then loaded into the trapping device with a syringe pump.
Once, loaded, the device was sealed on both ends. Images were taken under an Olympus
microscope with a 4X objective and stitched together using ImageJ. This figure is reprinted
with permission from reference [159].

118
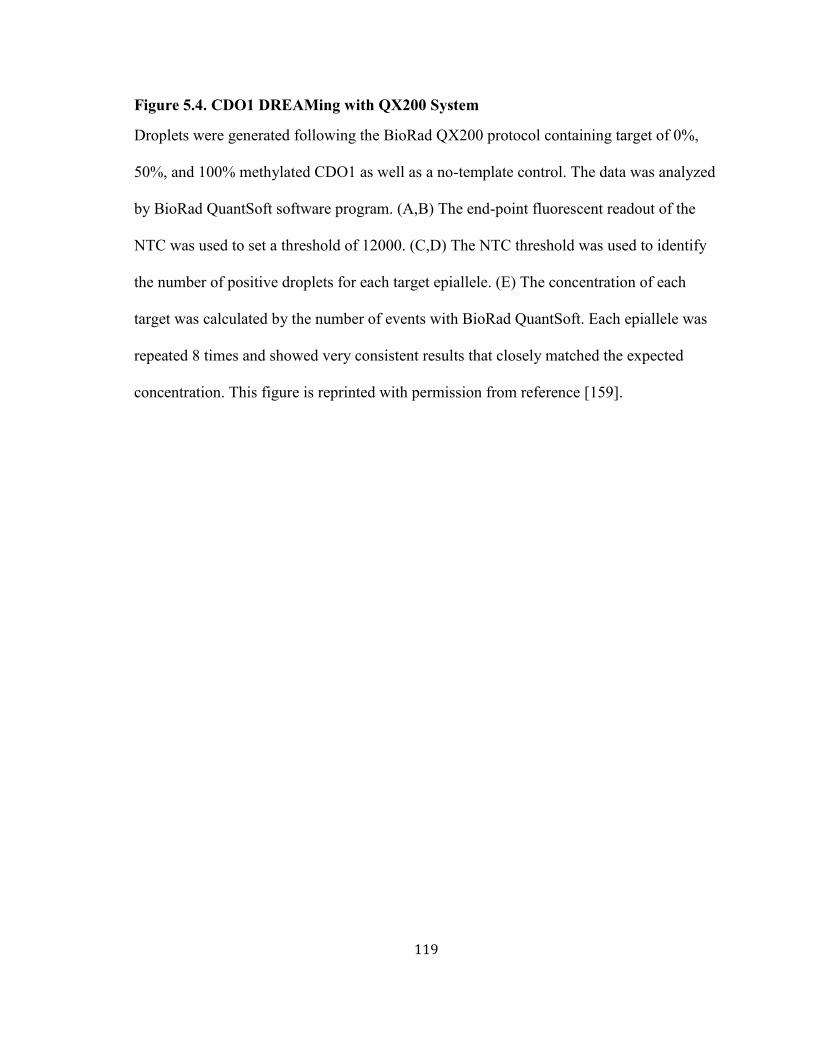
119
Figure 5.4. CDO1 DREAMing with QX200 System
Droplets were generated following the BioRad QX200 protocol containing target of 0%,
50%, and 100% methylated CDO1 as well as a no-template control. The data was analyzed
by BioRad QuantSoft software program. (A,B) The end-point fluorescent readout of the
NTC was used to set a threshold of 12000. (C,D) The NTC threshold was used to identify
the number of positive droplets for each target epiallele. (E) The concentration of each
target was calculated by the number of events with BioRad QuantSoft. Each epiallele was
repeated 8 times and showed very consistent results that closely matched the expected
concentration. This figure is reprinted with permission from reference [159].

120
Figure 5.5. Quantification Accuracy
(A) Droplets were generated with target copies of bisulfite-converted methylated CDO1 at
occupancies (λ) spanning 4 order of magnitude, from 0.04% to 11%. After PCR, the
droplets were loaded into the trapping device and their fluorescence imaged with a wide-
field camera. Droplets were identified and counted in ImageJ. (B) The occupancy was
calculated from the Poissonian occupancy based on the ratio of negative to total droplets
and compared to the expected occupancy. The lower two and highest occupancies were

121
repeated twice. A linear fit was applied to the log-log curve of expected vs. calculated over
the serial dilution. The slope of 0.98 is within 2% of the ideal slope of 1, and a R2 value of
0.99 indicates an excellent fit. This figure is reprinted with permission from reference
[159].

122
Figure 5.6. Size Versatility
120 pL and 600 pL droplets were generated with our flow-focusing device. 1000 pL
droplets were generated by the QX200 ddPCR system. Each droplet size underwent the
same PCR protocol in a 96-well plate, and were subsequently loaded into the trapping
device for imaging. Fluorescence images were acquired with the same wide-field camera
and macro lens and the same working distance. Bright-field images were all acquired under
an Olympus microscope at 4X magnification. All systems were compatible with the range
of droplet sizes. This figure is reprinted with permission from reference [159].
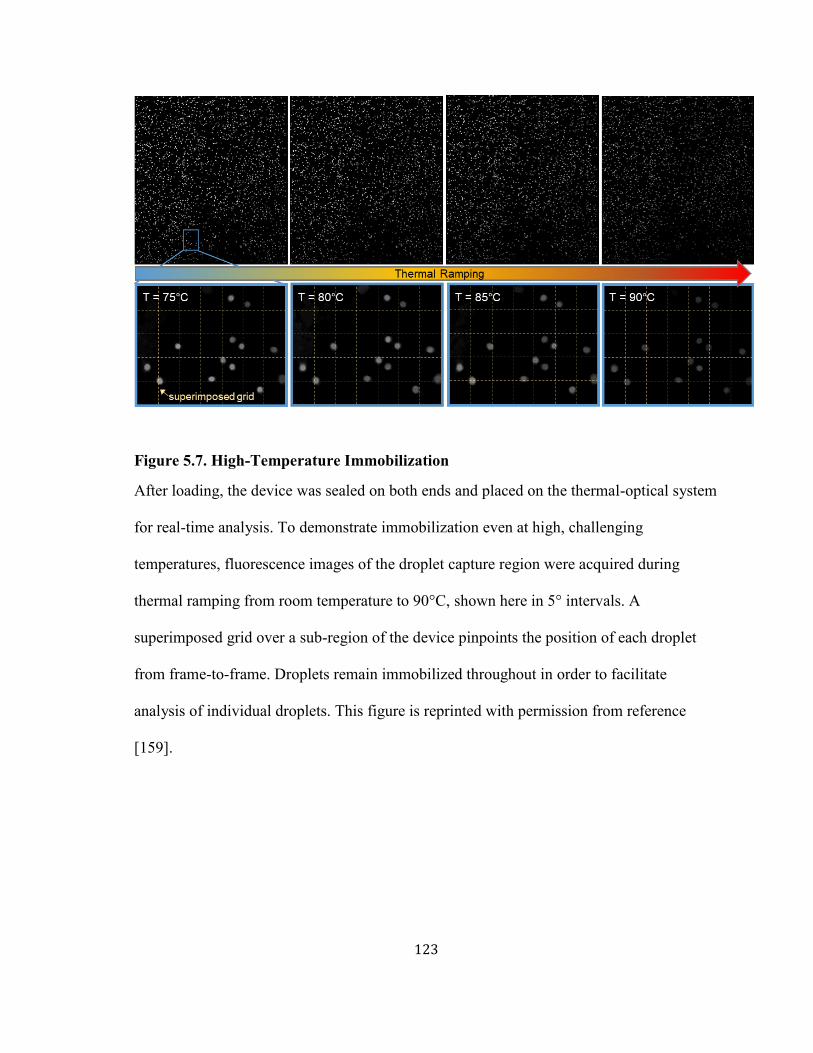
123
Figure 5.7. High-Temperature Immobilization
After loading, the device was sealed on both ends and placed on the thermal-optical system
for real-time analysis. To demonstrate immobilization even at high, challenging
temperatures, fluorescence images of the droplet capture region were acquired during
thermal ramping from room temperature to 90°C, shown here in 5° intervals. A
superimposed grid over a sub-region of the device pinpoints the position of each droplet
from frame-to-frame. Droplets remain immobilized throughout in order to facilitate
analysis of individual droplets. This figure is reprinted with permission from reference
[159].

124
Figure 5.8. Image Processing and Droplet Segmentation
Droplet segmentation was performed in ImageJ. The first ten fluorescent images were
averaged together to increase the signal to background ratio. A morphological opening
filter was applied to the resultant image using MorphoLibJ. Morphological segmentation
then identified each droplet. A numeric label was assigned to each droplet, and a labeled
mask was generated and exported to Matlab for quantification and melt curve analysis.
This figure is reprinted with permission from reference [159].

125
Table 4. Synthetic Sequences of CDO1

126
Figure 5.9. Droplet Digital High Resolution Melt
(A) Fluorescence images of droplets containing amplicons of mixed epialleles were
acquired during temperature ramping. Each epiallele denatures at distinct temperatures,
measured as a loss of fluorescence of the dsDNA intercalating dye (Evagreen). (B) The
average fluorescence of each droplet is plotted against temperature to obtain a melt curve.
The negative derivation of the curve contains a peak, which is identified as the melt
temperature (Tm) of the sequence. By identifying the Tm of each amplicon, a profile of the
methylation heterogeneity within the sample may be obtained and analyzed. This figure is
reprinted with permission from reference [159].

127
Figure 5.10. SNR and Fluorescence Leakage Analysis
(A) Negative droplets surrounding the positive amplicons were identified to analyze the
background signal. (B) The system demonstrates a signal-to-background of 1.9 at 80°C.
(C) Closer inspection of background droplet fluorescence shows a slight decrease over the
course of the experiment, indicating no decrease of the overall SNR and no observable
fluorescence leakage between droplets. This figure is reprinted with permission from
reference [159].
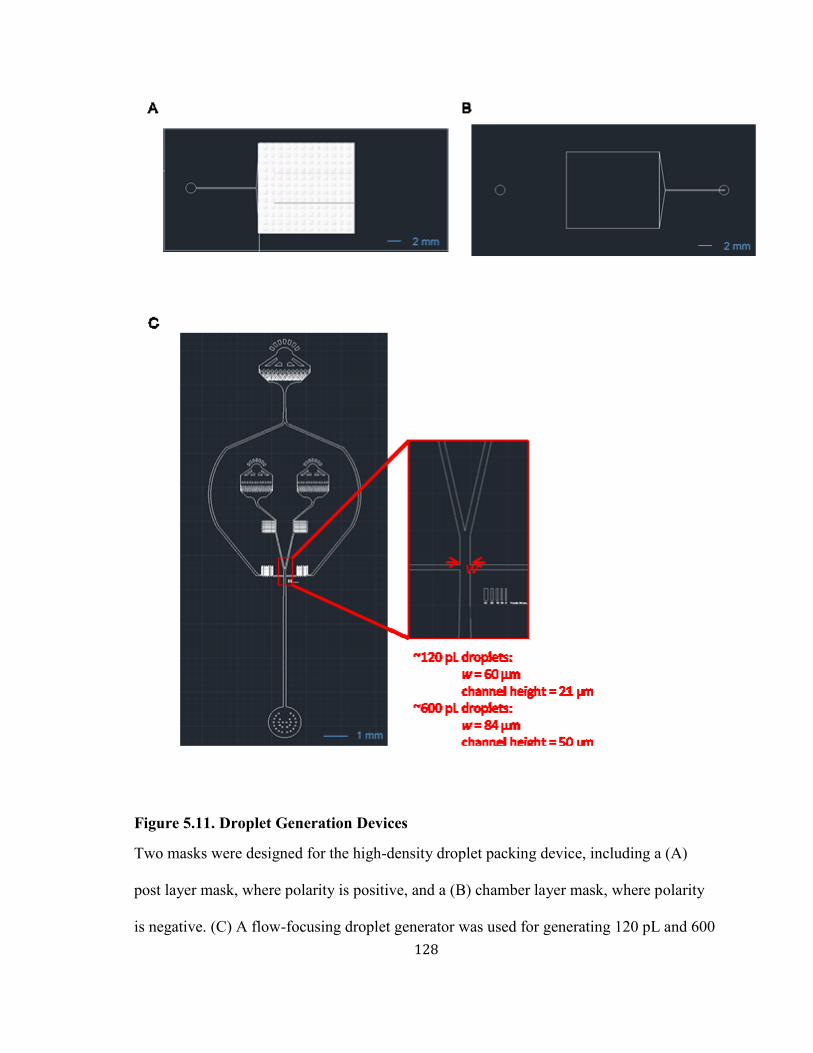
128
Figure 5.11. Droplet Generation Devices
Two masks were designed for the high-density droplet packing device, including a (A)
post layer mask, where polarity is positive, and a (B) chamber layer mask, where polarity
is negative. (C) A flow-focusing droplet generator was used for generating 120 pL and 600

129
pL droplets. The nozzle width and channel height were custom-tuned in order to achieve
the desired droplet volume. This figure is reprinted with permission from reference [159].

130
Chapter 6
ASSESSMENT OF BIOMARKER PANELS
Diagnostic advantages of biomarker panel assessment
Diagnostic tests for a given disease are scored by two metrics: (1) The percentage
of positive test results from a truly positive sample set. This is known as the “True
Positive Rate” (TPR), and is also referred to as the sensitivity of a test or biomarker. (2)
The percentage of positive test results from a negative or healthy sample set. This is known
as the “False Positive Rate” (FPR), and is referred to as the specificity of an assay. A
perfect diagnostic test will score a perfect TPR of 1 and a perfect FPR of 0. A TPR of less
than 1 indicates that either test cannot detect low levels of a biomarker or that the particular
biomarker is not present in all of the disease instances. A FPR be above zero indicates that
the biomarker can also be found naturally in the healthy population. Most diagnostic tests
are not ideal, in that there is some overlap between the cancerous and healthy populations.
Thus, a threshold must be determined that defines both the TPR and FPR. To visualize the

131
performance of a test, researchers most often use what is known as the “Receiver
Operating Characteristics” curve, a plot of 1-FPR vs. TPR. The area under the curve
(AUC) determines the probability that a test with be able to distinguish between disease
and healthy.
Cancers express large amounts of both intra- and inter- tumor heterogeneity,
leading most scientists to believe that pathogenesis may occur via a variety of different
pathways. Thus when aiming for early detection, a single biomarker is likely to be
insufficient for much of the population. Cancers have also been shown to express both
epigenetic intra-tumor heterogeneity, that is epigenetic differences between patients, as
well as inter-tumor heterogeneity, that is epigenetic differences within clones of a single
tumor. For example, lung cancer exhibits significant genetic and epigenetic heterogeneity,
which presents a challenge for development of a successful screening technique [160].
Several groups have investigated screening for lunch cancer methylation biomarkers in
noninvasive bodily fluids such as plasma and sputum [161]–[163]; these studies have
illustrated that detection of biomarker panels from at least 3-5 genes is required for
clinically actionable sensitivity and specificity, although there is still room for
improvement. Furthermore, studies have shown that early in carcinogenesis, but before
malignancy, methylation levels may be highly variable in tumors levels [20], [30], [31].
This suggests that quantification of methylation variability within these panels may further
improve diagnostic accuracy.
Perhaps one factor contributing to the imperfect sensitivity of these techniques is
the low levels of methylation in these fluids. Current technologies are ill-suited to quantify

132
methylation variability in complex solutions where the target molecules may be rare and
infrequent. Sequencing, although comprehensive, is limited in sensitivity and is unpractical
for routine use. Digital PCR technologies, such as droplet digital PCR, are limited to
binary assessments of known target sequences, and thus are not suited for detection of
variably modified loci. Thus there is a need for a more sensitive technique that can
simultaneously assess a panel of methylation biomarkers.
To satisfy the requirement for simultaneous biomarker assessment, some
researchers have proposed spatial separation as a simple means to enable multiplex
analysis with PCR-based methods, but this comes at a sacrifice of efficiency. Spatial
separation inherently requires more reaction volume and therefore intrinsic waste, as only
minor percentages of the sample input are interrogated for a single marker. Due to the
scarcity of biomarkers in noninvasive fluids, this method is unsuitable for early detection
of large panels of rare molecules in complex fluids such sputum and plasma.
The most common and straightforward method of multiplex analysis within a
single PCR-based assay is to use different color probes for each target. Typically, taq-man
probes are used, which include a fluorophore and quencher at either end of a DNA
sequence corresponding to its target, such that the fluorescence emission cannot be
detected in its natural state. The probe anneals to its single-stranded DNA target sequence
during the PCR reaction. As the Taq polymerase performs extension over that region, the
probe sequence is cleaved, enabling the fluorescence emission to be detected.
Single color-per-target multiplexing is limited by the spectral overlap of known
fluorophores within the visible electromagnetic spectrum. Even with advanced optical

133
setups, typically this method is limited to the detection of 4-5 targets, which may not be
sufficient for diagnostic confidence. In commercial digital PCR (dPCR) systems such as
the BioRad QX200 and Fluidigm BioMark HD, only up to 2 or 3 fluorescent channels are
available for detection.
Several attempts have been made to expand the multiplexing capacity of digital
PCR systems, but none are capable of simultaneous quantification of methylation
heterogeneity. For example, several methods of multiplexing by detecting melt profiles of
taq-man probes or molecular beacons have been proposed, but these methods require an
abundance of single-stranded DNA, produced by asymmetric PCR, and thus are
incompatible with intercalating dye-based HRM, which requires double-stranded DNA
[125], [164], [165]. Alternatively, it has been proposed that using different concentrations
of probe permits identification of different targets in the same color by detecting different
fluorescent intensities, however this technique has only been demonstrated for detection of
known sequences [66], [166].
Previously, we developed a facile molecule-by-molecule sequence analysis
platform called HYPER-Melt [73]. Through digitization of single molecules into
individual microchambers, methylation patterns could be interrogated by digital melt curve
acquisition. This technique demonstrated very high sensitivity, 0.00005%
methylated/unmethylated, but was limited to a single target locus. Herein, we expand this
technique to simultaneously detect multiple target loci, thereby improving its potential
clinical utility.

134
We present a methylation-agnostic ratiometric multiplexing scheme to enable high-
degree multiplexing of different targets as well as sequence profiling with HYPER-Melt
within a single assay. This simple technique can be prepared as an all-in-one reaction,
requires no additional reaction steps, and includes straightforward analysis. Methylation-
agnostic probes were developed to identify their loci independent of its methylation
pattern. Bisulfite-converted sample was loaded into a microfluidic array to digitize each
target locus (Figure 6.1A). Using a dual-fluorophore ratiometric analysis scheme enables a
high-degree of multiplexing, which grows exponentially with each additional color (Figure
6.1B). Finally, the methylation profile of each loci can be determined simultaneously
through discrimination by HYPER-Melt (Figure 6.1C).
Variable Sequence (Methylation-agnostic) Probe Scheme
In order to identify a panel of loci with unknown methylation patterns, we first
sought to overcome the challenge of designing probes specific to variable sequences. After
bisulfite conversion, potential methylation sites in a sequence (CpG sites) may be either
converted to uracil, replaced by thymine during PCR, or remain as a cytosine. Therefore,
any sequence with n possible methylation sites may result in 2n sequences after bisulfite
conversion. In many cases, finding a suitably long template without these variable sites is
impossible, thus it is necessary to identify multiple patterns.
To address this, we developed fluorescent probes with so-called “wobble bases”
incorporated at each methylation-dependent base in the target locus (Figure 6.2). These
“wobble bases” are equimolar mixtures of either cytosine or thymine. Ultimately this

135
results in equimolar probe amounts for each possible bisulfite-converted sequence. The
resulting probe solution is thus “agnostic” to target epiallele methylation status, allowing
its identification regardless of template methylation pattern.
Ratiometric Multiplexing Scheme
We next coupled this agnostic probe design to a ratiometric fluorescence
multiplexing scheme to achieve a solution that provides high multiplexing capability while
maintaining compatibility with dsDNA binding dyes, thereby allowing both simultaneous
identification and HYPER-Melt analysis of many epiallelic gene targets (Figure 6.3A). For
each target, two probes comprising identical sequences are designed but are differentially
labeled with two different fluorophore-quencher pairs, such as yellow and red. This allows
the probes to be mixed at a distinct red-to-yellow (R:Y) molar ratio to create a specific
fluorescence signature for each target locus. Multiplexing can thus be achieved by
assigning probe-pairs with a distinct R:Y ratio to target each of the genes in a panel (Figure
6.3B).
This technique is simple in analysis, as it only requires two-color detection, but
scalable to high degrees of multiplexing. There is no fundamental limit to the number of
ratios that can be designed, thus the actual limit of multiplex capacity per probe-pair will
depend on the resolution and dynamic range of the detector. Furthermore, for each
additional probe color, the multiplexing capacity of this system will increase exponentially.
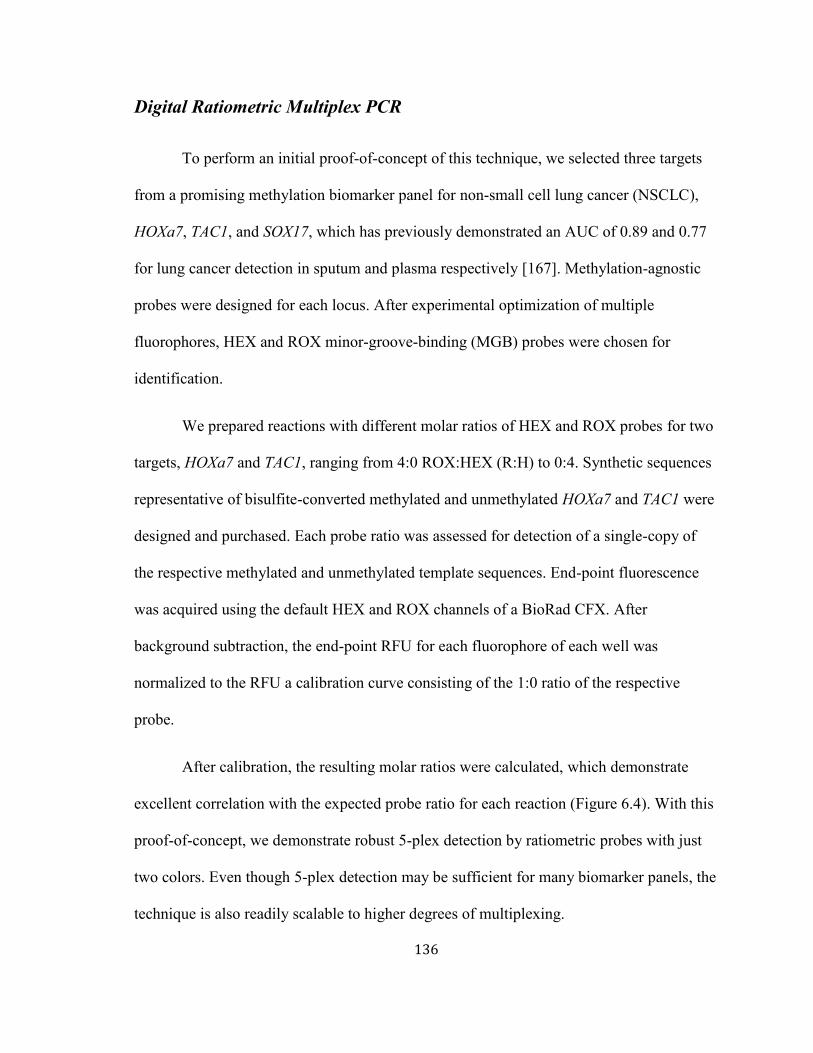
136
Digital Ratiometric Multiplex PCR
To perform an initial proof-of-concept of this technique, we selected three targets
from a promising methylation biomarker panel for non-small cell lung cancer (NSCLC),
HOXa7, TAC1, and SOX17, which has previously demonstrated an AUC of 0.89 and 0.77
for lung cancer detection in sputum and plasma respectively [167]. Methylation-agnostic
probes were designed for each locus. After experimental optimization of multiple
fluorophores, HEX and ROX minor-groove-binding (MGB) probes were chosen for
identification.
We prepared reactions with different molar ratios of HEX and ROX probes for two
targets, HOXa7 and TAC1, ranging from 4:0 ROX:HEX (R:H) to 0:4. Synthetic sequences
representative of bisulfite-converted methylated and unmethylated HOXa7 and TAC1 were
designed and purchased. Each probe ratio was assessed for detection of a single-copy of
the respective methylated and unmethylated template sequences. End-point fluorescence
was acquired using the default HEX and ROX channels of a BioRad CFX. After
background subtraction, the end-point RFU for each fluorophore of each well was
normalized to the RFU a calibration curve consisting of the 1:0 ratio of the respective
probe.
After calibration, the resulting molar ratios were calculated, which demonstrate
excellent correlation with the expected probe ratio for each reaction (Figure 6.4). With this
proof-of-concept, we demonstrate robust 5-plex detection by ratiometric probes with just
two colors. Even though 5-plex detection may be sufficient for many biomarker panels, the
technique is also readily scalable to higher degrees of multiplexing.

137
Microfluidic Digital N-plex Panel Identification
Next we validated the use of different probe ratios for multiplex target
identification in a highly parallelized microfluidic array. A single module of the
microfluidic array consists of 10,000 nano-liter sized chambers arranged in a single-layer
grid. A single device may hold up to 4 modules in parallel for high-throughput testing. The
devices were fabricated via ultra-thin soft lithography, vacuum-loaded, and partitioned
following our previously reported techniques [73].
First, each target was interrogated independently among mixed probes to establish
a reference standard. The devices underwent dPCR on a standard flatbed thermal cycler.
Afterwards, the devices were imaged for end-point probe fluorescence by a typhoon
scanner for two channels, Cy3 and Cy3-FRET. The negative wells for each device served
as the background, and were used to correct for any module-to-module variability and for
normalization of the positive wells.
A grid mask was mapped to the resultant fluorescence image to identify each well.
A semi-automated program using four-corner selection was utilized to perform a
homography transformation to align the mask to the image, as we have described
previously [73]. Due to the intrinsic warping that occurs during soft lithography, this
technique initially resulted in many wells with poor alignment. To address this, an
interpolative algorithm was developed to predict the variable warping across the device.
The vectorized fluorescent gradient for each predicted well position was acquired, and
used for a two-step warping correction in both the horizontal and vertical directions. For

138
correction in the vertical direction, the vectorized y-gradient of each row was averaged and
plotted against horizontal row number. A 4th-degree polynomial was fit to these points and
the roots identified. Each row of wells was then translated up or down depending on the
calculated magnitude of the average gradient at that point. Finally, neighborhood
optimization was then used to correct for any nonlinear warping effects.
The central pixels of each well were averaged together to provide the end-point
RFU per well. This process was repeated for the second fluorescence image. To determine
if either the HEX or ROX channel were susceptible to spectral overlap from the
intercalating dye (Evagreen), reactions were prepared with and without Evagreen and
imaged under both probe channels after amplification. Neither channel appeared to exhibit
nonspecific fluorescence emission from the Evagreen intercalating dye (Figure 6.5A).
Finally, ROX RFU vs. HEX RFU scatterplots were generated to determine the confidence
bounds of each probe ratio (Figure 6.5B). Each probe ratio is distinct and without overlap.
Next, mixed target loci were digitized in a single module with probe ratios of 1:3
for TAC1 and 5:1 for HOXa7. Following dPCR, the module was imaged under HEX and
ROX fluorescent channels, and the probe ratio for each amplicon was calculated.
Comparison of the mixed loci demonstrates excellent agreement with the individually
acquired probe results, validating the proof-of-principle that this method is suitable for
multiplex identification (Figure 6.5B).
Microfluidic Digital N-plex assessment of methylation heterogeneity

139
Besides having a high degree of multiplexing capacity, the distinct advantage of
this ratiometric probe technique is its compatibility with HYPER-Melt discrimination of
locus-specific epialleles. After amplification, the device is placed on a thermal-optical
platform for simultaneous melt curve acquisition from each amplicon as described
previously [73]. Briefly, fluorescent images are acquired at 0.3°C temperature intervals
from 75°C to 95°C. The average fluorescence of each well is extracted and plotted against
temperature to produce a melt curve. The negative derivation of this curve contains a peak,
which defines the melt temperature (Tm) of the template molecule. This Tm correlates
with the original methylation density of the locus. For each amplicon, aggregating the Tm-
methylation pattern and the probe-ratio-ID thereby enables methylation profiling for
multiple targets.
To validate the performance of this device, synthetic sequences representative of
bisulfite-converted fully methylated epialleles of two loci, HOXa7 and TAC1, were
synthesized and assessed. Each epiallele was digitized in the microfluidic array and
amplified. Following amplification, melt curves were acquired for each amplicon, and a
Tm histogram depicts the methylation profile of each sample (Figure 6.5C). The template
methylation pattern of each amplicon can readily be identified by thresholding. The
platform demonstrates high melt temperature uniformity for each epiallele.
Discussion
The report represents the first platform to demonstrate digital multiplexed
molecule-by-molecule analysis of methylation heterogeneity. This platform enables

140
parallelized in-depth analysis into the mechanisms of two well-established phenomena of
early disease progression: increasing epigenetic variability as well as the accumulation of
aberrant regulation among several loci. Studying the methylation heterogeneity of multiple
loci in parallel can provide greater insights into disease progression as well as increase the
fidelity of molecular diagnostic techniques.
Genetic and epigenetic variability is an integral part of disease progression [1],
[16]. Several models have predicted that increasing variability in DNA methylation occurs
in precursor regions, before the onset of disease [29], [30], [110], [168]. The precise effects
of this variability are only just beginning to be scrutinized. The paucity of current studies
may be due to insufficient technology for quantitative, multidimensional analysis.
Assessment of methylation heterogeneity of rare molecules is challenging and
unpractical with current commercial techniques. Targeted bisulfite sequencing could detect
variability of multiple loci, however its high cost and complexity are often deterrents.
Furthermore, its limited sensitivity would restrict its use to abundant samples such as tissue
biopsies, which is ill-suited towards early detection of disease. A simpler, more sensitive
technology that is becoming routine in research laboratories is ddPCR. However, detection
of variable sequences with ddPCR would require probes for each sequence. Although
feasible, each assay would be complex, and each variable-sequence probe would reduce
the capability for multiplex analysis of different loci.
The ultimate goal of this work is to facilitate early detection of disease. Due to the
myriad of possible tumorigenesis pathways and heterogeneity of disease, a single
biomarker is unlikely to provide diagnostic utility in a large population. Especially in early

141
phases of disease, before malignancy, a diagnostic panel should assess the regulation of
several pathways, as natural redundancies require several pathways to be disrupted before
malignancy [169]. However, multiplex biomarker detection of rare molecules is
challenging.
In noninvasive sampling techniques, such as plasma or cell-free DNA, tumor-
derived molecules can be very infrequent, requiring larger than usual volumes of sample to
be collected in order to capture these molecules. In such a case, the efficient use of the
sample is critical to ensure that biomarkers are not excluded from analysis. Multiplex
techniques that require physical partitioning of the sample are susceptible to lost
information due to inefficient interrogation of the entire sample. The microfluidic
multiplex digital melt platform presented here uses ratiometric probes to overcome that
hurdle, enabling sensitive interrogation of all designated biomarkers.
Recent studies have shown promising results using methylation as a biomarker for
early-stage NSCLC [161]–[163]. Our platform offers orders of magnitude higher
sensitivity over traditional techniques as well as multidimensional analysis of n-plex gene
panels. Ultimately, we hope that the capabilities of this platform manifest in improved
diagnostic performance and thus improved clinical outcomes.

142
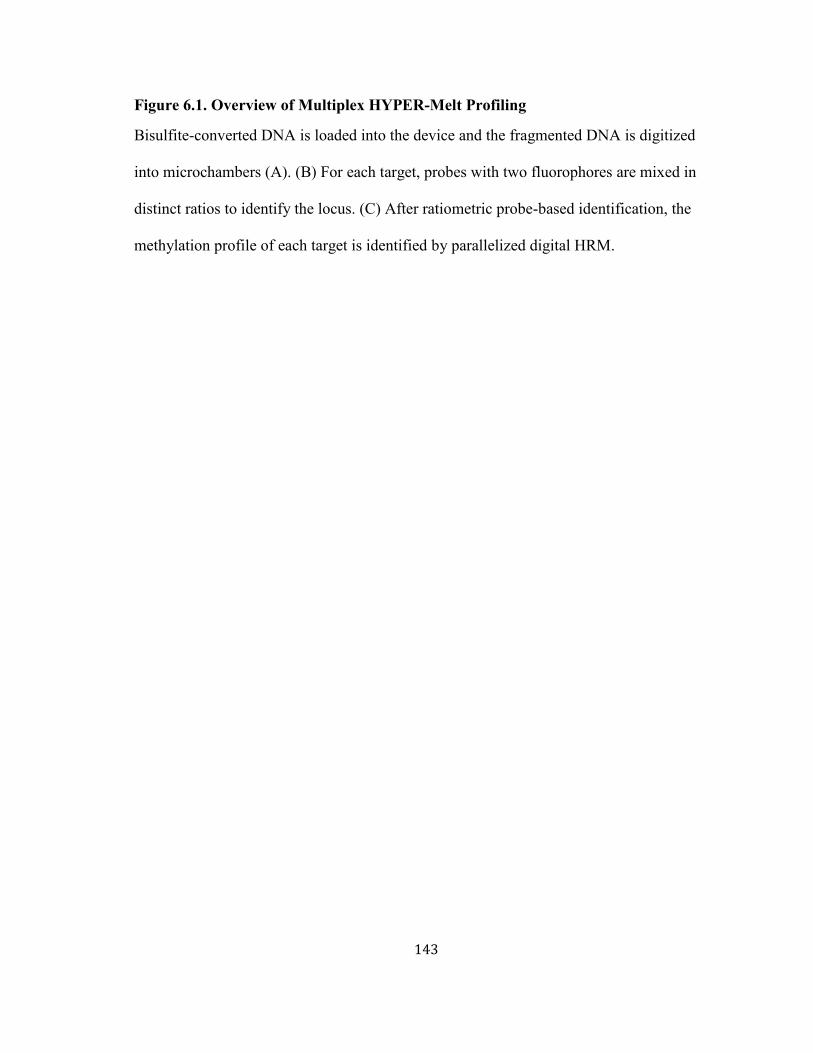
143
Figure 6.1. Overview of Multiplex HYPER-Melt Profiling
Bisulfite-converted DNA is loaded into the device and the fragmented DNA is digitized
into microchambers (A). (B) For each target, probes with two fluorophores are mixed in
distinct ratios to identify the locus. (C) After ratiometric probe-based identification, the
methylation profile of each target is identified by parallelized digital HRM.

144
Figure 6.2. Methylation-agnostic probes
After bisulfite conversion, many possible sequences exist per locus. Wobble bases at
potential methylation sites enable methylation-agnostic probe detection.

145
Figure 6.3. Highly multiplexed ratiometric probe scheme
For each target a distinct ratio of Yellow:Red probes are prepared (A), enabling high
degrees of multiplexing with just two fluorophores (B).

146
Figure 6.4. Ratiometric Identification principle
Five different ratios were prepared for each of two targets to demonstrate the ratiometric
principle of identification. The calculated ratios closely match the target ratio, and cluster
closely to enable ready identification.

147
Figure 6.5. Simultaneous Locus Identification and Profiling
(A) Targets were digitized in the microfluidic device. In the first module, only Evagreen
intercalating dye was used. In the second module, evagreen and specific probes were
combined. The images of Cy3 and Cy3Fret channels demonstrate negligible background

148
fluorescence overlap with the Evagreen dye. (B) Two targets were digitized at differing
fluorescence ratios, first separately, and then combined. The calculated ratio of the
multitarget assay matches that of the references. (C) Melt curves acquired from the two
targets enable epiallelic profiling.
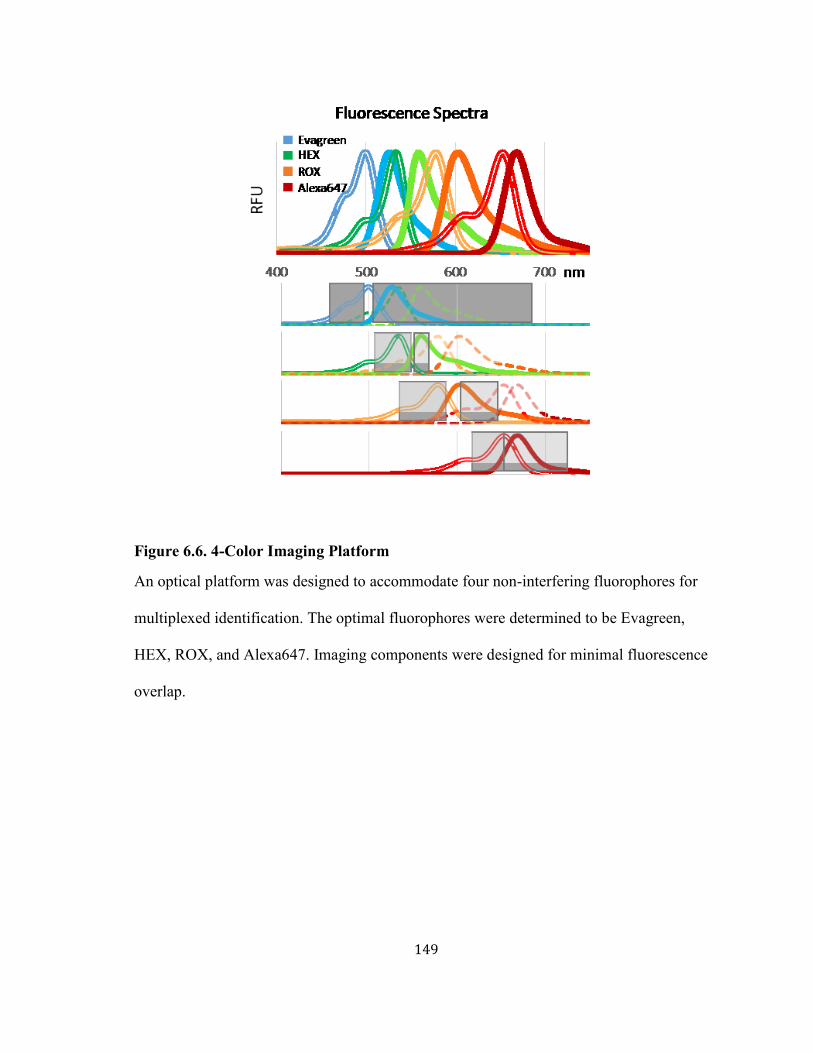
149
Figure 6.6. 4-Color Imaging Platform
An optical platform was designed to accommodate four non-interfering fluorophores for
multiplexed identification. The optimal fluorophores were determined to be Evagreen,
HEX, ROX, and Alexa647. Imaging components were designed for minimal fluorescence
overlap.
150
Chapter 7
ANALYSIS OF METHYLATION HETEROGENEITY
IN COMPLEX SAMPLES
Challenges and Advances in screening techniques
For almost all cancers, earlier detection leads to a higher chance of survival. To this
end, routine screening is highly recommended for cancers that can be detected early,
before symptoms arise. For example, the 5-year survival rate of colorectal cancer is 90%
when detected in early stages [170]. However, this rate drops to 15-70% if the cancer is
diagnosed at a later stage when the cancer has started to spread.
The most sensitive screening test for colorectal cancer is an optical colonoscopy,
which detects 95% of colorectal cancers [171]. The US Preventative Services Task Force
(USPSTF) recommends that persons over age 50 receive a colonoscopy every 5-10 years.
However, adherence to this screening method is hindered by the invasiveness of the

151
procedure, timeliness, and cost. To address this, many other noninvasive screening
methods for colorectal cancer have been proposed and analyzed [171].
Two of the most prominent noninvasive screening tests are the Fecal
Immunochemical Test (FIT) and multi-target testing [171], [172]. Both methods involve
detection of proteins or genetic and epigenetic markers in noninvasive fluid samples. The
multi-target testing, now marketed as Cologuard ®, includes two methylation biomarkers
[172]. Such a noninvasive screening method could encourage stronger adherence to routine
screening, and, if positive, could serve as an early warning that warrants further tests, such
as a colonoscopy. Therefore, there is a need for sensitive technologies to detect rare
biomarkers within noninvasive fluids to facilitate routine screening.
One noninvasively collectable sample media that traverses the most surface area
and through most other tissues throughout the body is blood. Recently, it has been
discovered that all cells release cell-free DNA into the plasma, which retains the
characteristics of its source tissue [33]–[35], [42], [173]. Since then, there has been an
explosion of research into identifying biomarkers in the blood plasma for many types of
cancer, including colorectal cancer [92], [173]–[177]. Of the promising biomarkers that
have been identified, many include hypermethylated regions of DNA such as tumor
suppressor genes [17], [56], [175]–[181]. We believe that the HYPER-Melt technology
could offer improved sensitivity over current techniques. Therefore, we sought to validate
the HYPER-Melt technology in complex biological fluids to assess its potential utility for
early detection and screening.

152
Methylation heterogeneity in plasma samples from liquid biopsy
We sought to demonstrate the potential clinical utility of the platform by employing
HYPER-Melt for the analysis of methylation heterogeneity of a cfDNA biomarker of
colorectal cancer (CRC) from liquid biopsies of cancer-free volunteers compared with
patients diagnosed with metastatic CRC (mCRC).We chose to interrogate the methylation
patterns of N-Myc downstream-regulated gene 4 (NDRG4), which has been implicated in
neurite outgrowth and cellular differentiation via the regulation of transcription factors
[182], and whose in-tissue clinical sensitivity for CRC is 86% [183], [184]. DREAMing
primers for NDRG4 were designed and optimized to achieve single-copy sensitivity, as
previously described [63].
cfDNA from the blood of four cancer-positive patients and four ostensibly healthy
volunteers was extracted, purified and underwent bisulfite conversion (Figure 7.1), as
detailed elsewhere [63]. Each sample was amplified, melted, and analyzed using the same
protocol as described previously [73]. Methylation patterns from each sample are found in
Figure 7.2. For comparison, each sample was also assessed for NDRG4 methylation using
quantitative methylation specific PCR (qMSP) [49], [50]. Of the four CRC-positive
patients, three of four were clearly positive for NDRG4 methylation by HYPER-Melt, only
one of which showed clear positivity with the NDRG4 qMSP assay (Figure 7.3).
Interestingly, of the four samples from healthy volunteers, one was positive for NDRG4
methylation by HYPER-Melt, albeit at very low levels of low to intermediate methylation.
From these data, it is readily apparent that HYPER-Melt exhibits both considerably
higher analytical sensitivity when compared to qMSP. This is not unexpected, as MSP is

153
designed to ostensibly only detect fully or very heavily methylated epialleles. In practice,
however, most MSP-based assays can still amplify heterogeneously-methylated epialleles,
albeit at much lower sensitivity and efficiency. Hence, samples such as CRC 1, that exhibit
significant copy numbers of low and medium-density methylation by HYPER-Melt,
exhibit weak, non-quantitative positivity by qMSP [185]. In all, HYPER-Melt
demonstrated 20-300X or more analytical sensitivity than the qMSP assay in all
methylation-positive samples. The greater analytical sensitivity of HYPER-Melt resulted
in detection of NDRG4 methylation in two additional CRC-positive patients (CRC1 and
CRC2) that are negative or nearly negative by qMSP. While clearly beneficial in the case
of the CRC-positive patients, HYPER-Melt also detected methylation in one of the healthy
controls. The presence of very low copy numbers of heterogeneously-methylated NDRG4
epialleles in sample N1, a 50-year-old male, may be due to natural methylation
heterogeneity resulting from early-stage epigenetic drift [110].
In terms of potential clinical use, one of the highly-touted advantages of liquid
biopsies is the ability to ostensibly sample overall tumor heterogeneity using a simple
blood draw. However, the extremely low copy numbers of circulating tumor DNA
(ctDNA) within the overall cfDNA samples, make assessment of this heterogeneity
extremely challenging. As a proof of concept, the potential power of our platform was
demonstrated by using such liquid biopsy samples. Overall, the considerable dynamic
range of the platform allowed ultra-sensitive detection of heterogeneous NDRG4 epialleles
down to 1 in 2 million unmethylated epialleles and in clinical plasma samples at
concentrations of less than 150 copies per mL of plasma. HYPER-Melt also demonstrates
robustness against multiple samples and targets, providing more information about cfDNA
154
epiallelic fractions than either MSP or traditional DREAMing while achieving over 100-
fold greater sensitivity.
Challenges and Advances in Ovarian Cancer Screening
The most common form of ovarian cancer is high-grade serous carcinoma
(HGSOC), which accounts for about ¾ of all ovarian cancers [186], [187]. HGSOC is very
aggressive and most often diagnosed in the advanced stages, which may contribute to the
low survival rate of 31% [186], [188], [189]. Ultrasound analysis in conjunction with
detection of the protein CA-125 has been investigated as a biomarker for early cancer
detection; however, the poor specificity of the test resulted in no increased survival
probability from screening [188]. Therefore, the USPSTF recommends against this
screening method, hence there is currently no screening method available.
In recent studies on the etiology of HGSOC, it has been shown that most
carcinomas originate in the fallopian tube as serous tubal intraepithelial carcinomas
(STICs) [187], [190]–[192]. However, unlike cancers arising in readily accessible tissues,
such as the colon, breast, cervix, and lung, which are amenable to biopsy screening, the
fallopian tubes and ovaries are not readily accessible for screening by optical or biopsy
methods. The high mortality and incidence rate of this disease have thus prompted many
investigations into molecular biomarkers for ovarian and other gynecological cancers.
Cellular migration from the ovary to the uterus is a naturally occurring process
during ovulation. Observations of routine Pap specimens have shown that some women

155
present with abnormal glandular cells. Of these abnormal specimens, more than a third
were also shown to have pre-invasive disease as well as invasive carcinomas of nearby
tissues such as the ovary, endometrium, and cervix [193]. This has led investigators to
hypothesize that tumor-derived cells or DNA could be found in the cells and cervical-
vaginal fluid routinely collected in a Pap specimen.
Recently, a new deep sequencing method called “PapSEEK” has been used to
interrogate DNA in Pap specimens for mutations specific to ovarian and endometrial
cancer [194], [195]. Using a mutation panel, researchers were able to identify tumor-
specific mutations in 33-45% of ovarian cancer specimens and 81-93% of endometrial
cancers with extremely high sensitivity (>99%) in late stage as well as early stage disease
[194], [195]. These promising results indicate routine Pap specimen analysis could be a
new avenue for ovarian cancer detection and screening.
Despite the exciting results, the sensitivity toward ovarian cancer remains low, and
could benefit from more sensitive detection techniques or biomarkers. Tumor-derived or
STIC-derived cells in Pap specimens may be eclipsed by the high background from healthy
epithelia, necessitating an extremely sensitive detection technique. Furthermore, many
studies have investigated the utility of methylation biomarkers for ovarian cancer detection
[196]–[200], and have found much higher prevalence of hypermethylation in tumor
suppressor gene panels, even up to 90% sensitivity and 100% specificity in limited cohorts
[201]. Recent studies indicate that locus-specific hypermethylation can be identified in
HGSOC precursor lesions, STICs [202], indicating the potential for early detection.
Moreover, variable methylation could be an even earlier indication of disease

156
gynecological disease [30], and epigenetic reprogramming is an integral part of ovarian
cancer progression [203].
To this end, we applied the HYPER-Melt platform for detection of rare methylated
epialleles in DNA acquired from Pap specimens. We identified target loci that were
previously reported to demonstrate 100% specificity towards ovarian cancer tissue in a
methylation EPIC BeadArray cohort [204]. DREAMing assays were developed for the top
performing loci. Finally, the assays were validated on the HYPER-Melt platform, and the
clinical utility was validated with Pap specimens from both ovarian cancer and healthy
patients, outperforming the gold standard, MSP, in diagnostic performance.
Methylation heterogeneity in Pap Specimens
To identify promising target loci, our collaborators previously performed genome-
wide methylation analysis of ovarian cancer using the latest-generation Methylation EPIC
BeadArray platform in a cohort of 60 malignant and 36 healthy gynecological mucosal
samples [202]. After selecting for 100% specificity, DREAMing assays were developed
for the top performing loci and validated for detection of ovarian cancer in a 90-patient
tissue cohort, demonstrating 100% sensitivity and specificity. Furthermore, methylation
within these loci were detectable in 9 of 9 laser capture microdissected (LCM) ovarian
cancer precursor serous tubal intraepithelial carcinoma (STIC) lesions and 0 of 12 LCM
cancer-free fallopian tube, suggesting that they are very early events in HGSOC
development.

157
As a proof-of-concept for this project, we developed a DREAMing as well as a
qMSP assay for IRX2, one of the top performing biomarkers in our initial panel. The
DREAMing assay was validated on the HYPER-Melt platform. The platform itself was
expanded to accommodate high-throughput sample analysis. Each device consisted of 3
modules, each containing 20,000 1 nanoliter-sized microchambers. Sample preparation,
loading, dPCR and dHRM procedures followed those in our previous report [73].
To validate the robustness of the platform to DNA extracted from Pap specimens,
we analyzed the methylation heterogeneity of IRX2 in 3 specimens from HGSOC patients
and 6 specimens from matched healthy patients. Heterogeneously methylated DNA was
detected and quantified in all of the ovarian cancer patients (Figure 7.4). DNA from the
healthy patients was also detected and the patterns identified on the HYPER-Melt
platform. To assess the potential clinical utility of the system, we compared the normalized
amount of highly methylated DNA per µL for each sample. The HYPER-Melt platform
detected overall higher amounts of methylated DNA in the cancer specimens than the
healthy for all samples (Figure 7.5). By setting a threshold of 8 copies/ µL, the results
demonstrate 100% sensitivity and 100% specificity.
The samples were also asses by the gold standard, qMSP, for fully methylated
epialleles. Comparing the results from the two platforms, qMSP identified 1 of 3 samples
as positive, and was negative for all of the healthy samples, resulting in 33% sensitivity
and 100% specificity (Figure 7.5). The HYPER-Melt platform clearly demonstrates higher
sensitivity and more comprehensive analysis than qMSP. These results suggest that

158
utilization of the HYPER-Melt platform with Pap specimens could greatly improve
diagnostic performance over traditional techniques.
Although promising, these results are from a limited sample cohort. Further
assessment of the HYPER-Melt platform towards detection of HGSOC from Pap specimen
methylation markers is ongoing with a larger patient cohort. The results presented here
include data from only one epigenetic marker. If the specificity or sensitivity is challenged
in the larger cohort, additional markers could readily be interrogated in the platform to
improve clinical performance. Furthermore, the feature-space available within the
HYPER-Melt datasets is only just beginning to be explored. Future work may uncover new
insights from epiallelic heterogeneity within samples.
Methods
Plasma Samples
All blood samples from patients diagnosed with metastatic colorectal cancer
(mCRC) were obtained through a study with approval by the MD Anderson Institutional
Review Board, and all participants provided written informed consent (NCT01730586).
Blood samples were collected at baseline from mCRC patients prior to clinical trial
treatment. Blood samples of cancer-free individuals were obtained from outpatients of
Johns Hopkins Community Physicians, with approval by the Johns Hopkins Medicine
Institutional Review Board. All participants provided written informed consent. mCRC
and cancer-free patient characteristics are provided in Figure 7.1. All blood samples were
collected in Cell Preparation Tubes (BD, Franklin Lakes, NJ) and processed within one

159
hour with centrifugation (3000 g) for 30 minutes and then plasma was aliquoted to 1.8 mL
cryovials and stored at -80°C until analysis.
All cfDNA was extracted using 2 ml NeoGeneStar Circulating Cell Free DNA Kit
(NeoGeneStar, Somerset, NJ) according to the manufacturer’s instructions. Briefly, 2.0 mL
of plasma was stabilized with Pretreatment Buffer and then digested in a solution
containing 1X Protease Buffer and 100 µl of Proteinase K (Invitrogen). DNA was then
extracted with supplied chaotropic salts and washed by a series of magnetic decantation
steps and eluted into 20 µl of DNA elution buffer (Zymo Research, Irvine, CA). Extracted
cfDNA was quantified by quantitative PCR (qPCR) using primers recognizing β-Globin,
Forward Primer: 5’- TGA AGG CTC ATG GCA AGA AAG – 3’, Reverse Primer: 5’ –
GAG GTT GTC CAG GTG AGC CA – 3’. PCR performed using 10X PCR Buffer
(ThermoFisher Scientific) to yield a final volume of 25 µl and final working concentration
3.5mM MgCl2, 200µM of each deoxynucleotide triphosphate (dNTP) and 0.04 U/µl of
Platinum Taq polymerase (ThermoFisher Scientific). Cycling conditions were 95˚C for 5
minutes, followed by 50 cycles of (95˚C for 5 seconds, 65˚C for 30 seconds and 72˚C for
30 seconds). Standards for quantification were created by serial dilution of human male
genomic DNA (Promega). The resulting DNA was bisulfite converted using the EZ DNA
Methylation-Lightning Kit (Zymo Research) according to the manufacturer’s protocol and
eluted into a final volume of 12 µL. Final BST-cfDNA yields were quantified by β-Actin
PCR, as described for control DNA above.
Pap Specimens
Pap specimens were collected by collaborators at Johns Hopkins hospital. The
specimens were fixated in methanol upon collection. DNA was extracted from the cell

160
pellet following the NeoGeneStar extraction kit protocol. Next, the samples were bisulfite-
converted using the EZ DNA Methylation-Lightning Kit (Zymo Research) according to the
manufacturer’s protocol and eluted into a final volume of 25 µL. 1-2 µL were used for
analysis in MSP, while 7-10 µL were used for analysis on the HYPER-Melt platform.

161
Figure 7.1. Clinical Sample Workflow and Patient Characteristics
(A) Workflow from sample collection to HYPER-Melt analysis. (B) Biological
information for each patient from whom plasma samples were extracted and analyzed. The
plasma volume for each sample collected was 2 mL. Concentration was estimated from
BST Actin results.

162
Figure 7.2. NDRG4 Copies Detected in Plasma Samples
HYPER-Melt was performed on plasma from colorectal cancer patients and normal/
healthy samples for the NDRG4 gene. The methylation density of each molecule was
classified by melt temperature. (A, B) HYPER-Melt heatmaps and heterogeneity analysis

163
of copies detected from plasma of colorectal patients (D, E) as wells as healthy volunteers.
This figure is reprinted with permission from reference [73].

164
Figure 7.3. Liquid Biopsy (cell-free DNA) biomarker detection and analysis via
HYPER-Melt.
Methylation data acquired for the NDRG4 locus from DNA extracted from plasma
samples from both metastatic colorectal cancer and normal patients. (A) Three different
levels of methylation density (Low, Medium, Heavy) were identified for each patient via
the HYPER-Melt platform. The total number of methylated epialleles detected from each

165
patient sample was compared to that of the gold standard, MSP. HYPER-Melt histograms
show the number of copies detected at each epiallelic fraction from plasma from (B) CRC
patients and (C) healthy volunteers. This figure is reprinted with permission from reference
[73].

166

167
Figure 7.4. Methylation Heterogeneity in Pap specimens
DNA was extracted from Pap specimens, bisulfite-converted, and interrogated for
methylation heterogeneity of IRX2 on the HYPER-Melt platform. Various levels of DNA
methylation could be detected in cancer and in healthy samples.

168
Figure 7.5. Methylated IRX2 in Cancer and Healthy Patients
The amount of heavily methylated DNA in copies/µL was calculated for all patients.
Setting a threshold of 8 copies/µL produces 100% sensitivity and 100% specificity.
Corresponding MSP results were positive for 1 out of 3 cancer patients.

169
Chapter 8
CONCLUSION
This dissertation describes the development of a digital microfluidic platform that
performs ultra-sensitive intramolecular profiling through highly parallelized real-time
analyses. Accessibility and facile operation were key design criteria for this platform,
which were incorporated through use of a single-layer microarray design coupled with a
simple ultra-thin fabrication protocol. The device can be rapidly loaded and digitized by
surface-tension, a facile and scalable method. I demonstrated that this platform, termed
HYPER-Melt (High-density Profiling and Enumeration by Melt) is capable of quantifying
locus-specific methylation heterogeneity and detection of rare epialleles at fractions as low
as 1 in 2,000,000 background molecules, or 0.00005%.
The capabilities of the HYPER-Melt platform were then expanded by increasing
the efficiency of target capture as well as the sample throughput. Geometric manipulation
of the fluid in a multilayer device improved loading efficiency to 80%. This dissertation

170
also reports the first demonstration of droplet digital high-resolution melt. I invented a
microfluidic pseudo-sieve that achieved 100% efficiency in droplet loading and
immobilization of droplets during high-temperature melt analysis. This device can be used
in combination with commercial droplet techniques to greatly increase the throughput of
epiallelic profiling. Finally, this platform demonstrated robustness towards complex
clinical fluids. The HYPER-Melt platform achieved higher sensitivity and more
comprehensive analysis in detecting methylation than the gold standard, MSP, in cell-free
DNA in plasma as well as with DNA extracted from Pap specimens.
This platform is ideally suited towards applications that require real-time
monitoring to identify rare variants, such as circulating biomarker detection, bacterial
persistence, antibiotic susceptibility, drug discovery, and directed evolution. Here, the
HYPER-Melt platform was applied to the assessment of methylation heterogeneity, a
phenomena that occurs early in carcinogenesis but is not yet fully understood. The system
resolved methylation differences of 4 CpGs within a locus. Recent studies suggest that
changes at this level may have a significant effect on cancer progression. The principle
advantages of this platform over current technologies are the high sensitivity for detection
of rare molecules, and the simple, economic ability to profile variable sequence patterns.
Sequencing remains the most suitable technology for comparing sequence variability in
abundant starting material, whereas ddPCR has the fundamentally highest sensitivity
towards ultra-rare detection. HYPER-Melt represents a facile profiling technique that
combines ultra-high sensitivity with locus-specific sequencing capabilities, designed to be
applied towards methylation profiling of a limited number of loci within samples
containing scarce or rare biomarkers.

171
Future work could include efforts to increase the throughput of the device as well
as relaxing the device storage requirements. Despite the demonstrated improvements in
throughput, the current system is limited in practicality to assessment of 10-20 samples per
day. This restriction limits its utility towards assessment of large patient cohorts.
Improvements to the optical resolution and thermal uniformity of the platform may
increase the capability of the platform to assess hundreds of samples per day, which would
much be more attractive for clinical utility. In addition, the current loading method requires
the device to be kept under vacuum, which mandates a limited timeframe between
atmospheric exposure and loading. Eliminating the need for a vacuum could make the
system more robust to a wider variety of users. Such improvements would facilitate more
widespread adoption of this technology.
The ultimate long-term goal of this platform is to facilitate early cancer detection
through screening for biomarkers in noninvasive fluids. Therefore, future studies should
assess large patient cohorts to identify suitable biomarkers or biomarker panels within
these fluids. Currently, efforts are ongoing to determine its potential for detection of lung
cancer markers in plasma as well as ovarian cancer markers in Pap specimens. Biostatistic
analytical tools should be developed to take advantage of the comprehensive datasets
provided by the HYPER-Melt platform.
In conclusion, HYPER-Melt provides an all-in-one platform for quantitative
molecular profiling and heterogeneity analysis. The platform allows deep insight at the
single copy level of any target of interest. Furthermore, the practicality and high
digitization power of the platform offers a tool for rapid and efficient DNA sequence

172
heterogeneity analysis by rapidly interrogating hundreds to thousands of individual
molecules in parallel. Overall, this platform has the potential to detect intermolecular
variability at ultra-high sensitivity even in difficult and highly-heterogeneous samples,
allowing more comprehensive investigation of the dynamics and stochasticity of DNA
molecular heterogeneity.
173
References
[1] B. Vogelstein, N. Papadopoulos, V. E. Velculescu, S. Zhou, L. A. Diaz, and K. W. Kinzler, “Cancer genome landscapes.,” Science, vol. 339, no. 6127, pp. 1546–58, 2013.
[2] R. Burrell, N. McGranahan, J. Bartek, and C. Swanton, “The causes and consequences of genetic heterogeneity in cancer evolution,” Nature, vol. 501, 2013.
[3] J. Iranzo, I. Martincorena, and E. V. Koonin, “Cancer-mutation network and the number and specificity of driver mutations,” Proc. Natl. Acad. Sci. U. S. A., vol. 115, no. 26, pp. E6010–E6019, Jun. 2018.
[4] H. Easwaran, H. C. Tsai, and S. B. Baylin, “Cancer Epigenetics: Tumor Heterogeneity, Plasticity of Stem-like States, and Drug Resistance,” Molecular Cell, vol. 54, no. 5. pp. 716–727, 2014.
[5] S. B. Baylin and P. A. Jones, “Epigenetic determinants of cancer,” Cold Spring Harb. Perspect. Biol., vol. 8, no. 9, pp. 1–36, 2016.
[6] W. A. Flavahan, E. Gaskell, and B. E. Bernstein, “Epigenetic plasticity and the hallmarks of cancer,” Science, vol. 357, no. 6348. 2017.
[7] S. Negrini, V. G. Gorgoulis, and T. D. Halazonetis, “Genomic instability — an evolving hallmark of cancer,” Nat. Rev. Mol. Cell Biol., vol. 11, no. 3, pp. 220–228, Mar. 2010.
[8] J. Sandoval and M. Esteller, “Cancer epigenomics: Beyond genomics,” Current Opinion in Genetics and Development, vol. 22, no. 1. pp. 50–55, 2012.
[9] A. Portela and M. Esteller, “Epigenetic modifications and human disease,” Nat. Publ. Gr., vol. 28, 2010.
[10] J. D. Choi and J.-S. Lee, “Interplay between Epigenetics and Genetics in Cancer,” Genomics Inform., vol. 11, no. 4, p. 164, 2013.
[11] M. A. Dawson and T. Kouzarides, “Cancer Epigenetics: From Mechanism to Therapy,” Cell, vol. 150, pp. 12–27, 2012.
[12] V. Santini, H. M. Kantarjian, and J.-P. Issa, “Changes in DNA Methylation in Neoplasia: Pathophysiology and Therapeutic Implications,” Ann. Intern. Med., vol. 134, no. 7, p. 573, Apr. 2001.
[13] M. Esteller, “Molecular Origins of Cancer Epigenetics in Cancer,” N Engl J Med, vol. 358, pp. 1148–59, 2008.
[14] M. Szyf, “DNA methylation and cancer therapy,” Drug Resistance Updates, vol. 6, no. 6. pp. 341–353, 2003.
[15] J. G. Herman and S. B. Baylin, “Gene Silencing in Cancer in Association with Promoter Hypermethylation,” n engl j med, vol. 34921349, pp. 2042–54, 2003.
[16] P. a Jones and S. B. Baylin, “The fundamental role of epigenetic events in cancer.,” Nat. Rev. Genet., vol. 3, no. 6, pp. 415–28, 2002.
[17] S. A. Belinsky, “Gene-promoter hypermethylation as a biomarker in lung cancer,” Nat. Rev. Cancer, vol. 4, no. 9, pp. 707–717, 2004.
[18] S. B. Baylin and J. E. Ohm, “Epigenetic gene silencing in cancer - A mechanism for early
174
oncogenic pathway addiction?,” Nat. Rev. Cancer, vol. 6, no. 2, pp. 107–116, 2006. [19] T. E. Bartlett et al., “Epigenetic reprogramming of fallopian tube fimbriae in BRCA
mutation carriers defines early ovarian cancer evolution,” Nat. Commun., 2016. [20] A. E. Teschendorff et al., “Epigenetic variability in cells of normal cytology is associated
with the risk of future morphological transformation,” Genome Med., vol. 4, no. 3, 2012. [21] A. E. Teschendorff et al., “DNA methylation outliers in normal breast tissue identify field
defects that are enriched in cancer,” Nat. Commun., 2016. [22] A. P. Feinberg and B. Tycko, “The history of cancer epigenetics,” Nat. Rev. Cancer, vol. 4,
no. 2, pp. 143–153, 2004. [23] H. Suzuki et al., “Epigenetic inactivation of SFRP genes allows constitutive WNT signaling
in colorectal cancer,” Nat. Genet., vol. 36, no. 4, pp. 417–422, Apr. 2004. [24] H. S. Melkonyan et al., “SARPs: A family of secreted apoptosis-related proteins
(cloningsecreted proteinsfrizzled homologue),” 1997. [25] P. B. Gupta et al., “Stochastic state transitions give rise to phenotypic equilibrium in
populations of cancer cells.,” Cell, vol. 146, no. 4, pp. 633–44, Aug. 2011. [26] D. A. Landau et al., “Locally Disordered Methylation Forms the Basis of Intratumor
Methylome Variation in Chronic Lymphocytic Leukemia,” Cancer Cell, vol. 26, no. 6, pp. 813–825, Dec. 2014.
[27] N. C. Sheffield et al., “DNA methylation heterogeneity defines a disease spectrum in Ewing sarcoma,” Nat. Med., vol. 23, no. 3, pp. 386–395, 2017.
[28] S. Li et al., “Distinct evolution and dynamics of epigenetic and genetic heterogeneity in acute myeloid leukemia,” Nat. Med., vol. 22, pp. 792–799, 2016.
[29] W. Timp and A. P. Feinberg, “Cancer as a dysregulated epigenome allowing cellular growth advantage at the expense of the host,” Nat. Rev. Cancer, vol. 13, no. 7, pp. 497–510, Jun. 2013.
[30] A. E. Teschendorff et al., “The Dynamics of DNA Methylation Covariation Patterns in Carcinogenesis,” PLoS Comput. Biol., vol. 10, no. 7, 2014.
[31] A. E. Teschendorff and M. Widschwendter, “Differential variability improves the identification of cancer risk markers in DNA methylation studies profiling precursor cancer lesions,” Bioinformatics, vol. 28, no. 11, pp. 1487–1494, 2012.
[32] H. H. McAdams and A. Arkin, “It’s a noisy business! Genetic regulation at the nanomolar scale,” Trends in Genetics, vol. 15, no. 2. pp. 65–69, 1999.
[33] L. A. Diaz and A. Bardelli, “Liquid Biopsies: Genotyping Circulating Tumor DNA,” J. Clin. Oncol., vol. 32, no. 6, pp. 579–586, Feb. 2014.
[34] C. D. M. Campos, J. M. Jackson, M. A. Witek, and S. A. Soper, “Molecular Profiling of Liquid Biopsy Samples for Precision Medicine,” Cancer J., vol. 24, no. 2, pp. 93–103, 2018.
[35] D. A. Haber and V. E. Velculescu, “Blood-based analyses of cancer: circulating tumor cells and circulating tumor DNA.,” Cancer Discov., vol. 4, no. 6, pp. 650–61, Jun. 2014.
[36] P. Podlesniy and R. Trullas, “Biomarkers in cerebrospinal fluid: Analysis of cell-free circulating mitochondrial dna by digital PCR,” in Methods in Molecular Biology, vol. 1768, Humana Press, New York, NY, 2018, pp. 111–126.
[37] L. Gorgannezhad, M. Umer, M. N. Islam, N.-T. Nguyen, and M. J. A. Shiddiky, “Circulating tumor DNA and liquid biopsy: opportunities, challenges, and recent advances in detection technologies,” Lab Chip, vol. 18, p. 1174, 2018.
[38] A. Agarwal, M. Balic, D. El-Ashry, and R. J. Cote, “Circulating Tumor Cells: Strategies for Capture, Analyses, and Propagation,” Cancer Journal (United States), vol. 24, no. 2. pp. 70–77, 2018.

175
[39] M. Chimonidou et al., “DNA methylation of tumor suppressor and metastasis suppressor genes in circulating tumor cells.,” Clin. Chem., vol. 57, no. 8, pp. 1169–77, Aug. 2011.
[40] T. Forshew et al., “Noninvasive Identification and Monitoring of Cancer Mutations by Targeted Deep Sequencing of Plasma DNA,” Sci. Transl. Med., vol. 4, no. 136, p. 136ra68, 2012.
[41] D. T. Miyamoto, D. T. Ting, M. Toner, S. Maheswaran, and D. A. Haber, “Single-Cell Analysis of Circulating Tumor Cells as a Window into Tumor Heterogeneity.,” Cold Spring Harb. Symp. Quant. Biol., vol. 81, pp. 269–274, Jan. 2016.
[42] E. Crowley, F. Di Nicolantonio, F. Loupakis, and A. Bardelli, “Liquid biopsy: monitoring cancer-genetics in the blood,” Nat. Rev. Clin. Oncol., vol. 10, no. 8, pp. 472–484, 2013.
[43] X. Han, J. Wang, and Y. Sun, “Circulating Tumor DNA as Biomarkers for Cancer Detection,” Genomics, Proteomics and Bioinformatics, vol. 15, no. 2. pp. 59–72, 2017.
[44] M. Ignatiadis, M. Lee, and S. S. Jeffrey, “Circulating tumor cells and circulating tumor DNA: Challenges and opportunities on the path to clinical utility,” Clinical Cancer Research, vol. 21, no. 21. pp. 4786–4800, 2015.
[45] H. Schwarzenbach, D. S. . B. Hoon, and K. Pantel, “Cell-free nucleic acids as biomarkers in cancer patients.,” Nat. Rev. Cancer, vol. 11, no. 6, pp. 426–37, 2011.
[46] G. Sharma, S. Mirza, C. P. Prasad, A. Srivastava, S. D. Gupta, and R. Ralhan, “Promoter hypermethylation of p16INK4A, p14ARF, CyclinD2 and Slit2 in serum and tumor DNA from breast cancer patients,” Life Sci., vol. 80, no. 20, pp. 1873–1881, 2007.
[47] T. Xu et al., “Cross-Platform Comparison of Four Leading Technologies for Detecting EGFR Mutations in Circulating Tumor DNA from Non-Small Cell Lung Carcinoma Patient Plasma,” Theranostics, vol. 7, no. 76, pp. 1437–1446, 2017.
[48] P. Ulz, E. Heitzer, J. B. Geigl, and M. R. Speicher, “Patient monitoring through liquid biopsies using circulating tumor DNA,” Int. J. Cancer, vol. 141, no. 5, pp. 887–896, May 2017.
[49] J. G. Herman, J. R. Graff, S. Myohanen, B. D. Nelkin, and S. B. Baylin, “Methylation-specific PCR: a novel PCR assay for methylation status of CpG islands.,” Proc. Natl. Acad. Sci., vol. 93, no. 18, pp. 9821–9826, 1996.
[50] C. A. Eads et al., “MethyLight: a high-throughput assay to measure DNA methylation,” Nucleic Acids Res., vol. 28, no. 8, p. e32, 2000.
[51] M. Zeschnigk, S. Böhringer, E. A. Price, Z. Onadim, L. Masshöfer, and D. R. Lohmann, “A novel real-time PCR assay for quantitative analysis of methylated alleles (QAMA): analysis of the retinoblastoma locus.,” Nucleic Acids Res., 2004.
[52] C. A. Eads, “MethyLight: a high-throughput assay to measure DNA methylation,” Nucleic Acids Res., 2000.
[53] T. Mikeska, C. Bock, H. Do, and A. Dobrovic, “DNA methylation biomarkers in cancer: progress towards clinical implementation,” Expert Rev. Mol. Diagn., vol. 12, no. 5, pp. 473–487, 2012.
[54] C. Alkan, S. Sajjadian, and E. E. Eichler, “Limitations of next-generation genome sequence assembly,” Nature Methods. 2011.
[55] N. Rieber et al., “Coverage Bias and Sensitivity of Variant Calling for Four Whole-genome Sequencing Technologies,” PLoS One, 2013.
[56] M. Li et al., “Sensitive digital quantification of DNA methylation in clinical samples,” Nat. Biotechnol., vol. 27, no. 9, pp. 858–863, Sep. 2009.
[57] M. Yu et al., “Methylight droplet digital PCR for detection and absolute quantification of infrequently methylated alleles,” Epigenetics, 2015.
176
[58] L. Labanieh, T. N. Nguyen, W. Zhao, and D. K. Kang, “Floating droplet array: An ultrahigh-throughput device for droplet trapping, real-time analysis and recovery,” Micromachines, vol. 6, no. 10, pp. 1469–1482, 2015.
[59] X. Bian et al., “A microfluidic droplet digital PCR for simultaneous detection of pathogenic Escherichia coli O157 and Listeria monocytogenes,” Biosens. Bioelectron., vol. 74, pp. 770–777, 2015.
[60] D. A. Selck and R. F. Ismagilov, “Instrument for real-time digital nucleic acid amplification on custom microfluidic devices,” PLoS One, vol. 11, no. 10, 2016.
[61] D. O. Velez et al., “Massively parallel digital high resolution melt for rapid and absolutely quantitative sequence profiling,” Sci. Rep., vol. 7, p. 42326, Feb. 2017.
[62] Y. Shimazaki, J. Tanaka, Y. Kohara, M. Kamahori, and T. Sakamoto, “Parallel Evaluation of Melting Temperatures of DNAs in the Arrayed Droplets through the Fluorescence from DNA Intercalators,” Anal. Chem., vol. 89, no. 12, pp. 6305–6308, 2017.
[63] T. R. Pisanic et al., “DREAMing: a simple and ultrasensitive method for assessing intratumor epigenetic heterogeneity directly from liquid biopsies.,” Nucleic Acids Res., vol. 43, no. 22, p. e154, Dec. 2015.
[64] A. M. Kaushik, K. Hsieh, and T.-H. Wang, “Droplet microfluidics for high-sensitivity and high-throughput detection and screening of disease biomarkers,” Wiley Interdiscip. Rev. Nanomedicine Nanobiotechnology, p. e1522, May 2018.
[65] A. B. Theberge et al., “Microdroplets in microfluidics: An evolving platform for discoveries in chemistry and biology,” Angew. Chemie - Int. Ed., vol. 49, no. 34, pp. 5846–5868, 2010.
[66] Y. Ding, J. Choo, and A. J. DeMello, “From single-molecule detection to next-generation sequencing: microfluidic droplets for high-throughput nucleic acid analysis,” Microfluid. Nanofluidics, vol. 21, no. 3, p. 58, 2017.
[67] T. W. Murphy, Q. Zhang, L. B. Naler, S. Ma, and C. Lu, “Recent advances in the use of microfluidic technologies for single cell analysis,” Analyst, vol. 143, no. 1. pp. 60–80, 2018.
[68] K. Choi, A. H. C. Ng, R. Fobel, and A. R. Wheeler, “Digital Microfluidics,” Annu. Rev. Anal. Chem. is online Annu. Rev. Anal. Chem, vol. 5, pp. 413–440, 2012.
[69] K. a Heyries et al., “Megapixel digital PCR.,” Nat. Methods, vol. 8, no. 8, pp. 649–651, 2011.
[70] Q. Zhu et al., “Digital PCR on an integrated self-priming compartmentalization chip,” Lab Chip, vol. 14, no. 6, pp. 1176–1185, 2014.
[71] H. Zec, C. O’Keefe, P. Ma, and T. Wang, “Ultra-Thin, Evaporation-Resistent Pdms-Devices for Absolute Quantification of Dna Using Digital Pcr,” Transducers, pp. 536–539, 2015.
[72] J.-Y. Cheng, C.-J. Hsieh, Y.-C. Chuang, and J.-R. Hsieh, “Performing microchannel temperature cycling reactions using reciprocating reagent shuttling along a radial temperature gradient,” 2005.
[73] C. M. O’Keefe, T. R. Pisanic, H. Zec, M. J. Overman, J. G. Herman, and T. H. Wang, “Facile profiling of molecular heterogeneity by microfluidic digital melt,” Sci. Adv., vol. 4, no. 9, pp. 6459–6485, 2018.
[74] D. P. Cahill, K. W. Kinzler, B. Vogelstein, and C. Lengauer, “Genetic instability and darwinian selection in tumours,” Trends in Biochemical Sciences, vol. 24, no. 12. 1999.
[75] J. W. Pepper, C. Scott Findlay, R. Kassen, S. L. Spencer, and C. C. Maley, “Cancer research meets evolutionary biology.,” Evol. Appl., vol. 2, no. 1, pp. 62–70, Feb. 2009.
[76] P. D. Sniegowski, P. J. Gerrish, and R. E. Lenski, “Evolution of high mutation rates in experimental populations of E. coli,” Nature, vol. 387, no. 6634, pp. 703–705, Jun. 1997.
[77] E. Kussell, “Phenotypic Diversity, Population Growth, and Information in Fluctuating

177
Environments,” Science (80-. )., vol. 309, no. 5743, pp. 2075–2078, Sep. 2005. [78] M. Acar, J. T. Mettetal, and A. van Oudenaarden, “Stochastic switching as a survival
strategy in fluctuating environments,” Nat. Genet., vol. 40, no. 4, pp. 471–475, Apr. 2008. [79] A. Eldar and M. B. Elowitz, “Functional roles for noise in genetic circuits.,” Nature, vol.
467, no. 7312, pp. 167–73, Sep. 2010. [80] R. A. Burrell, N. McGranahan, J. Bartek, and C. Swanton, “The causes and consequences of
genetic heterogeneity in cancer evolution,” Nature. 2013. [81] A. Goriely, G. A. T. Mcvean, M. Röjmyr, B. Ingemarsson, and A. O. M. Wilkie, “Evidence for
Selective Advantage of Pathogenic FGFR2 Mutations in the Male Germ Line,” 2003. [82] R. L. Siegel, K. D. Miller, and A. Jemal, “Cancer statistics, 2016,” CA. Cancer J. Clin., vol. 66,
no. 1, pp. 7–30, Jan. 2016. [83] K. Ririe, R. Rasmussen, and C. Wittwer, “Product differentiation by analysis of DNA
melting curves during the polymerase chain reaction,” Anal. Biochem., vol. 245, pp. 154–160, 1997.
[84] P. Yakovchuk, E. Protozanova, and M. D. Frank-Kamenetskii, “Base-stacking and base-pairing contributions into thermal stability of the DNA double helix,” Nucleic Acids Res., vol. 34, no. 2, pp. 564–574, Jan. 2006.
[85] Y. Zhang, Y. Zhu, B. Yao, and Q. Fang, “Nanolitre droplet array for real time reverse transcription polymerase chain reaction,” Lab Chip, vol. 11, no. 8, p. 1545, 2011.
[86] H.-B. Liu, N. Ramalingam, Y. Jiang, C.-C. Dai, K. M. Hui, and H.-Q. Gong, “Rapid distribution of a liquid column into a matrix of nanoliter wells for parallel real-time quantitative PCR,” Sensors Actuators B, vol. 135, pp. 671–677, 2009.
[87] T. Morrison et al., “Nanoliter high throughput quantitative PCR,” Nucleic Acids Res., vol. 34, no. 18, 2006.
[88] H. Ma, K. Y. Horiuchi, Y. Wang, S. A. Kucharewicz, and S. L. Diamond, “Nanoliter Homogenous Ultra-High Throughput Screening Microarray for Lead Discoveries and IC 50 Profiling,” Assay Drug Dev. Technol., vol. 3, no. 2, 2005.
[89] N. R. Beer et al., “On-chip single-copy real-time reverse-transcription PCR in isolated picoliter droplets,” Anal. Chem., vol. 80, no. 6, pp. 1854–1858, 2008.
[90] Y. Chen, J. D. Müller, P. T. C. So, and E. Gratton, “The Photon Counting Histogram in Fluorescence Fluctuation Spectroscopy,” Biophys. J., vol. 77, no. 1, pp. 553–567, Jul. 1999.
[91] M. J. Woods RP, Grafton ST, Watson JDG, Sicotte NL, “Automated image registration: II. Intersubject validation of linear and nonlinear models.,” J. Comput. Assist. Tomogr., vol. 2, pp. 153–165, 1998.
[92] F. Diehl et al., “Detection and quantification of mutations in the plasma of patients with colorectal tumors,” Proc. Natl. Acad. Sci., vol. 102, no. 45, pp. 16368–16373, 2005.
[93] Z. Dwight, R. Palais, and C. T. Wittwer, “uMELT: prediction of high-resolution melting curves and dynamic melting profiles of PCR products in a rich web application,” Bioinformatics, vol. 27, no. 7, pp. 1019–1020, Apr. 2011.
[94] N. Amirouchene-Angelozzi, C. Swanton, and A. Bardelli, “Tumor evolution as a therapeutic target,” Cancer Discovery, vol. 7, no. 8. pp. 805–817, 2017.
[95] A. N. Abou Tayoun, P. R. Burchard, A. M. Caliendo, A. Scherer, and G. J. Tsongalis, “A multiplex PCR assay for the simultaneous detection of Chlamydia trachomatis, Neisseria gonorrhoeae, and Trichomonas vaginalis,” Exp. Mol. Pathol., vol. 98, no. 2, pp. 214–218, 2015.
[96] J. Gonzalez-Bosquet et al., “Detection of Somatic Mutations by High-Resolution DNA Melting (HRM) Analysis in Multiple Cancers,” PLoS One, vol. 6, no. 1, p. e14522, Jan. 2011.

178
[97] G. H. Reed and C. T. Wittwer, “Sensitivity and specificity of single-nucleotide polymorphism scanning by high-resolution melting analysis.,” Clin. Chem., vol. 50, no. 10, pp. 1748–54, Oct. 2004.
[98] K. Osafune et al., “Marked differences in differentiation propensity among human embryonic stem cell lines.”
[99] B. Keeley et al., “Extraction and processing of circulating DNA from large sample volumes using methylation on beads for the detection of rare epigenetic events,” Clin. Chim. Acta, vol. 425, pp. 169–175, Oct. 2013.
[100] Y. Fu et al., “A microfluidic chip based on surfactant-doped polydimethylsiloxane (PDMS) in a sandwich configuration for low-cost and robust digital PCR,” Sensors Actuators B Chem., vol. 245, pp. 414–422, Jun. 2017.
[101] A. M. Thompson et al., “Self-digitization chip for single-cell genotyping of cancer-related mutations,” PLoS One, vol. 13, no. 5, p. e0196801, May 2018.
[102] I. Garcia-Murillas et al., “Mutation tracking in circulating tumor DNA predicts relapse in early breast cancer,” Sci. Transl. Med., vol. 7, no. 302, 2015.
[103] H. Boukellal, E. Selimović, Y. Jia, G. Cristobal, and S. Fraden, “Simple, robust storage of drops and fluids in a microfluidic device,” Lab Chip, vol. 9, no. 2, pp. 331–338, 2009.
[104] T. Schneider, G. S. Yen, A. M. Thompson, D. R. Burnham, and D. T. Chiu, “Self-digitization of samples into a high-density microfluidic bottom-well array,” Anal. Chem., vol. 85, no. 21, pp. 10417–10423, 2013.
[105] Q. Zhu et al., “Lab on a Chip A scalable self-priming fractal branching microchannel net chip for digital PCR †,” vol. 17, p. 1655, 2017.
[106] S. W. Lee and S. S. Lee, “Shrinkage ratio of PDMS and its alignment method for the wafer level process,” Microsyst. Technol., vol. 14, no. 2, pp. 205–208, Oct. 2007.
[107] C. Moraes, Y. Sun, and C. A. Simmons, “Solving the shrinkage-induced PDMS alignment registration issue in multilayer soft lithography,” J. Micromechanics Microengineering, vol. 19, p. 6, 2009.
[108] J. S. Marcus, W. F. Anderson, and S. R. Quake, “Microfluidic single-cell mRNA isolation and analysis,” Anal. Chem., vol. 78, no. 9, pp. 3084–3089, 2006.
[109] M. Esteller et al., “Hypermethylation-associated Inactivation of p14 ARF Is Independent of p16 INK4a Methylation and p53 Mutational Status 1,” CANCER Res., vol. 60, pp. 129–133, 2000.
[110] T. R. Pisanic, P. Athamanolap, and T. H. Wang, “Defining, distinguishing and detecting the contribution of heterogeneous methylation to cancer heterogeneity,” Seminars in Cell and Developmental Biology, vol. 64. pp. 5–17, 2017.
[111] C. M. O’Keefe, D. Giammanco, S. Li, T. R. Pisanic, and T. H. J. Wang, “Multilayer microfluidic array for highly efficient sample loading and digital melt analysis of DNA methylation,” Lab Chip, 2019.
[112] D. Pekin et al., “Quantitative and sensitive detection of rare mutations using droplet-based microfluidics,” Lab Chip, vol. 11, no. 13, pp. 2156–2166, 2011.
[113] V. Yelleswarapu, J. R. Buser, M. Haber, J. Baron, E. Inapuri, and D. Issadore, “Mobile platform for rapid sub–picogram-per-milliliter, multiplexed, digital droplet detection of proteins,” Proc. Natl. Acad. Sci., vol. 116, no. 10, pp. 4489–4495, 2019.
[114] J. Shuga et al., “Single molecule quantitation and sequencing of rare translocations using microfluidic nested digital PCR,” Nucleic Acids Res., vol. 41, no. 16, pp. 1–11, 2013.
[115] H. Zec, D. J. Shin, and T.-H. Wang, “Novel droplet platforms for the detection of disease biomarkers,” Expert Rev. Mol. Diagn., vol. 14, no. 7, pp. 787–801, Sep. 2014.

179
[116] S. Y. Teh, R. Lin, L. H. Hung, and A. P. Lee, “Droplet microfluidics,” Lab on a Chip, vol. 8, no. 2. pp. 198–220, 2008.
[117] L. M. Boettger, R. E. Handsaker, M. C. Zody, and S. A. McCarroll, “Structural haplotypes and recent evolution of the human 17q21.31 region,” Nat. Genet., vol. 44, no. 8, pp. 881–885, Aug. 2012.
[118] L. Miotke, B. T. Lau, R. T. Rumma, and H. P. Ji, “High sensitivity detection and quantitation of DNA copy number and single nucleotide variants with single color droplet digital PCR,” Anal. Chem., vol. 86, no. 5, pp. 2618–2624, Mar. 2014.
[119] J. Beck et al., “Genome Aberrations in Canine Mammary Carcinomas and Their Detection in Cell-Free Plasma DNA,” PLoS One, vol. 8, no. 9, p. e75485, Sep. 2013.
[120] J. A. Beaver et al., “Detection of Cancer DNA in Plasma of Patients with Early-Stage Breast Cancer,” Clin. Cancer Res., vol. 20, no. 10, pp. 2643–2650, May 2014.
[121] G. Zhu et al., “Highly Sensitive Droplet Digital PCR Method for Detection of EGFR-Activating Mutations in Plasma Cell–Free DNA from Patients with Advanced Non–Small Cell Lung Cancer,” J. Mol. Diagnostics, vol. 17, no. 3, pp. 265–272, May 2015.
[122] H.-G. Goh et al., “Sensitive quantitation of minimal residual disease in chronic myeloid leukemia using nanofluidic digital polymerase chain reaction assay,” Leuk. Lymphoma, vol. 52, no. 5, pp. 896–904, May 2011.
[123] J. B. Jackson, D. S. Choi, J. D. Luketich, A. Pennathur, A. Ståhlberg, and T. E. Godfrey, “Multiplex Preamplification of Serum DNA to Facilitate Reliable Detection of Extremely Rare Cancer Mutations in Circulating DNA by Digital PCR.,” J. Mol. Diagn., vol. 18, no. 2, pp. 235–43, Mar. 2016.
[124] P. S. Mitchell et al., “Circulating microRNAs as stable blood-based markers for cancer detection,” Proc. Natl. Acad. Sci., vol. 105, no. 30, pp. 10513–10518, Jul. 2008.
[125] G. P. McDermott et al., “Multiplexed Target Detection Using DNA-Binding Dye Chemistry in Droplet Digital PCR,” Anal. Chem., vol. 85, no. 23, pp. 11619–11627, Dec. 2013.
[126] I. C. Gilg et al., “Differential gene expression is tied to photo chemical efficiency reduction in virally infected Emiliania huxleyi,” Mar. Ecol. Prog. Ser., vol. 555, pp. 13–27, 2016.
[127] A. D. Tadmor, E. A. Ottesen, J. R. Leadbetter, and R. Phillips, “Probing Individual Environmental Bacteria for Viruses by Using Microfluidic Digital PCR,” Science (80-. )., vol. 333, no. 6038, pp. 58–62, Jul. 2011.
[128] S. Pholwat, S. Stroup, S. Foongladda, and E. Houpt, “Digital PCR to Detect and Quantify Heteroresistance in Drug Resistant Mycobacterium tuberculosis,” PLoS One, vol. 8, no. 2, p. e57238, Feb. 2013.
[129] F. Schuler et al., “Digital droplet PCR on disk,” Lab Chip, vol. 16, no. 1, pp. 208–216, 2016. [130] X. Leng and C. J. Yang, “Agarose droplet microfluidics for highly parallel and efficient
single molecule emulsion PCR.,” Methods Mol. Biol., vol. 949, no. 21, pp. 413–422, 2013. [131] B. J. Hindson et al., “High-throughput droplet digital PCR system for absolute quantitation
of DNA copy number,” Anal. Chem., vol. 83, no. 22, pp. 8604–8610, 2011. [132] J. Chen et al., “Capillary-based integrated digital PCR in picoliter droplets,” Lab Chip, vol.
18, no. 3, pp. 412–421, 2018. [133] S. I. Fraley et al., “Universal digital high-resolution melt: a novel approach to broad-based
profiling of heterogeneous biological samples,” Nucleic Acids Res., vol. 41, no. 18, pp. e175–e175, Oct. 2013.
[134] N. Andini et al., “Microbial Typing by Machine Learned DNA Melt Signatures,” Sci. Rep., vol. 7, p. 42097, Feb. 2017.
[135] P. Athamanolap et al., “Trainable High Resolution Melt Curve Machine Learning Classifier

180
for Large-Scale Reliable Genotyping of Sequence Variants,” PLoS One, vol. 9, no. 10, p. e109094, Oct. 2014.
[136] E. L. Jackson-Holmes, T. C. McDevitt, and H. Lu, “A microfluidic trap array for longitudinal monitoring and multi-modal phenotypic analysis of individual stem cell aggregates,” Lab Chip, vol. 17, no. 21, pp. 3634–3642, 2017.
[137] C. L. Hansen et al., “High-throughput analysis of single hematopoietic stem cell proliferation in microfluidic cell culture arrays,” Nat. Methods, 2011.
[138] S. L. Sjostrom, H. N. Joensson, and H. A. Svahn, “Multiplex analysis of enzyme kinetics and inhibition by droplet microfluidics using picoinjectors3,” vol. 13, p. 1754, 2013.
[139] C. H. J. Schmitz, A. C. Rowat, S. Köster, and D. A. Weitz, “Dropspots: a picoliter array in a microfluidic device,” Lab Chip, vol. 9, no. 1, pp. 44–49, 2009.
[140] S. S. Terekhov et al., “Microfluidic droplet platform for ultrahigh-throughput single-cell screening of biodiversity,” Proc. Natl. Acad. Sci., vol. 114, no. 10, pp. 2550–2555, 2017.
[141] Z. Hua et al., “Multiplexed Real-Time Polymerase Chain Reaction on a Digital Microfluidic Platform,” Anal. Chem, vol. 82, no. 6, pp. 2310–2316, 2010.
[142] D. A. Selck and R. F. Ismagilov, “Instrument for real-time digital nucleic acid amplification on custom microfluidic devices,” PLoS One, vol. 11, no. 10, pp. 1–20, 2016.
[143] A. C. Hatch et al., “1-Million droplet array with wide-field fluorescence imaging for digital PCR,” Lab Chip, vol. 11, no. 22, p. 3838, 2011.
[144] S. H. Kim, S. Iwai, S. Araki, S. Sakakihara, R. Iino, and H. Noji, “Large-scale femtoliter droplet array for digital counting of single biomolecules,” Lab Chip, vol. 12, no. 23, pp. 4986–4991, 2012.
[145] P. Abbyad, R. Dangla, A. Alexandrou, and C. N. Baroud, “Rails and anchors: guiding and trapping droplet microreactors in two dimensions,” Lab Chip, vol. 11, no. 5, pp. 813–821, 2011.
[146] A. Huebner et al., “Static microdroplet arrays: a microfluidic device for droplet trapping, incubation and release for enzymatic and cell-based assays,” Lab Chip, vol. 9, no. 5, pp. 692–698, 2009.
[147] N. Q. Balaban, J. Merrin, R. Chait, L. Kowalik, and S. Leibler, “Bacterial persistence as a phenotypic switch,” Science (80-. )., vol. 305, no. 5690, pp. 1622–1625, 2004.
[148] N. Safa, M. Vaithiyanathan, S. Sombolestani, S. Charles, and A. T. Melvin, “Population-based analysis of cell-penetrating peptide uptake using a microfluidic droplet trapping array,” Anal. Bioanal. Chem., 2019.
[149] F. Courtois et al., “An integrated device for monitoring time-dependent in vitro expression from single genes in picolitre droplets,” ChemBioChem, vol. 9, no. 3, pp. 439–446, 2008.
[150] P. Athamanolap, K. Hsieh, L. Chen, S. Yang, and T.-H. Wang, “Integrated Bacterial Identification and Antimicrobial Susceptibility Testing Using PCR and High-Resolution Melt,” Anal. Chem, vol. 89, p. 33, 2017.
[151] K. E. Mach, A. M. Kaushik, K. Hsieh, P. K. Wong, T. H. Wang, and J. C. Liao, “Optimizing peptide nucleic acid probes for hybridization-based detection and identification of bacterial pathogens,” Analyst, 2019.
[152] W. Guan, L. Chen, T. D. Rane, and T. H. Wang, “Droplet Digital Enzyme-Linked Oligonucleotide Hybridization Assay for Absolute RNA Quantification,” Sci. Rep., 2015.
[153] A. M. Kaushik, K. Hsieh, L. Chen, D. J. Shin, J. C. Liao, and T. H. Wang, “Accelerating bacterial growth detection and antimicrobial susceptibility assessment in integrated picoliter droplet platform,” Biosens. Bioelectron., 2017.
[154] M. Baker, “Digital PCR hits its stride,” Nat. Methods, vol. 9, no. 6, pp. 541–544, 2012.
181
[155] K. Yin et al., “Stable Colloidosomes Formed by Self-Assembly of Colloidal Surfactant for Highly Robust Digital PCR,” Anal. Chem., p. acs.analchem.9b00470, 2019.
[156] G. Du, Q. Fang, and J. M. J. den Toonder, “Microfluidics for cell-based high throughput screening platforms-A review,” Analytica Chimica Acta, vol. 903. pp. 36–50, Jan-2016.
[157] R. R. Pompano, W. Liu, W. Du, and R. F. Ismagilov, “Microfluidics using spatially defined arrays of droplets in one, two, and three dimensions.,” Annu. Rev. Anal. Chem. (Palo Alto. Calif)., vol. 4, pp. 59–81, 2011.
[158] H. N. Joensson and H. Andersson Svahn, “Droplet microfluidics-A tool for single-cell analysis,” Angewandte Chemie - International Edition, vol. 51, no. 49. pp. 12176–12192, 2012.
[159] C. M. O’Keefe, A. M. Kaushik, and T. H. Wang, “Highly Efficient Real-Time Droplet Analysis Platform for High-Throughput Interrogation of DNA Sequences by Melt,” Anal. Chem., vol. 91, no. 17, pp. 11275–11282, 2019.
[160] T. Reungwetwattana, S. J. Weroha, and J. R. Molina, “Oncogenic pathways, molecularly targeted therapies, and highlighted clinical trials in non-small-cell lung cancer (NSCLC),” Clinical Lung Cancer, vol. 13, no. 4. pp. 252–266, Jul-2012.
[161] S. Guo et al., “Identification and validation of the methylation biomarkers of non-small cell lung cancer (nsclc),” Clin. Epigenetics, vol. 7, no. 1, pp. 2–9, 2015.
[162] A. Hulbert et al., “Early detection of lung cancer using DNA promoter hypermethylation in plasma and sputum,” in Clinical Cancer Research, 2017, vol. 23, no. 8, pp. 1998–2005.
[163] K. Lokk et al., “Methylation markers of early-stage non-small cell lung cancer,” PLoS One, vol. 7, no. 6, 2012.
[164] S. Chakravorty et al., “Rapid universal identification of bacterial pathogens from clinical cultures by using a novel sloppy molecular beacon melting temperature signature technique,” J. Clin. Microbiol., vol. 48, no. 1, pp. 258–267, 2010.
[165] Q. Huang, Z. Liu, Y. Liao, X. Chen, Y. Zhang, and Q. Li, “Multiplex Fluorescence Melting Curve Analysis for Mutation Detection with Dual-Labeled, Self-Quenched Probes,” PLoS One, vol. 6, no. 4, p. e19206, Apr. 2011.
[166] E. Zonta et al., “Multiplex Detection of Rare Mutations by Picoliter Droplet Based Digital PCR: Sensitivity and Specificity Considerations,” PLoS One, vol. 11, no. 7, 2016.
[167] A. Hulbert et al., “Early detection of lung cancer using DNA promoter hypermethylation in plasma and sputum,” in Clinical Cancer Research, 2017.
[168] A. E. Teschendorff et al., “Epigenetic variability in cells of normal cytology is associated with the risk of future morphological transformation,” Genome Med., vol. 4, no. 24, Mar. 2012.
[169] S. Ramón y Cajal et al., “Clinical implications of intratumor heterogeneity: challenges and opportunities,” Journal of Molecular Medicine. 2020.
[170] Cancer.org, “Survival Rates for Colorectal Cancer,” Cancer, 1996. [Online]. Available: https://www.cancer.org/cancer/colon-rectal-cancer/detection-diagnosis-staging/survival-rates.html. [Accessed: 05-Feb-2020].
[171] A. B. Knudsen et al., “Estimation of Benefits, Burden, and Harms of Colorectal Cancer Screening Strategies,” JAMA, vol. 315, no. 23, pp. 2595–2609, Jun. 2016.
[172] T. F. Imperiale et al., “Multitarget Stool DNA Testing for Colorectal-Cancer Screening,” no. 14, Apr. 2014.
[173] T. Venesio, G. Siravegna, A. Bardelli, and A. Sapino, “Liquid Biopsies for Monitoring Temporal Genomic Heterogeneity in Breast and Colon Cancers.,” Pathobiology, 2017.
[174] V. Taly et al., “Multiplex picodroplet digital PCR to detect KRAS mutations in circulating

182
DNA from the plasma of colorectal cancer patients,” Clin. Chem., vol. 59, no. 12, pp. 1722–1731, 2013.
[175] M. L. Thomas and P. Marcato, “Epigenetic modifications as biomarkers of tumor development, therapy response, and recurrence across the cancer care continuum,” Cancers, vol. 10, no. 4. Multidisciplinary Digital Publishing Institute, p. 101, 01-Apr-2018.
[176] V. Constâncio et al., “Early detection of the major male cancer types in blood-based liquid biopsies using a DNA methylation panel.”
[177] H. Luo et al., “Circulating tumor DNA methylation profiles enable early diagnosis, prognosis prediction, and screening for colorectal cancer,” 2020.
[178] Z. Lin et al., “Combined Detection of Plasma ZIC1, HOXD10 and RUNX3 Methylation is a Promising Strategy for Early Detection of Gastric Cancer and Precancerous Lesions.,” J. Cancer, vol. 8, no. 6, pp. 1038–1044, 2017.
[179] Z. Li et al., “Methylation analysis of plasma cell-free DNA for breast cancer early detection using bisulfite next-generation sequencing,” Tumor Biol, vol. 37, no. 10, pp. 13111–13119, Oct. 2016.
[180] A. Di Meo, J. Bartlett, Y. Cheng, M. D. Pasic, and G. M. Yousef, “Liquid biopsy: A step forward towards precision medicine in urologic malignancies,” Molecular Cancer, vol. 16, no. 1. BioMed Central Ltd., 14-Apr-2017.
[181] C.-X. Song et al., “5-Hydroxymethylcytosine signatures in cell-free DNA provide information about tumor types and stages,” Cell Res., vol. 27, no. 10, pp. 1231–1242, Oct. 2017.
[182] T. Ohki, S. Hongo, N. Nakada, A. Maeda, and M. Takeda, “Inhibition of neurite outgrowth by reduced level of NDRG4 protein in antisense transfected PC12 cells,” Dev. Brain Res., vol. 135, pp. 55–63, 2002.
[183] D. A. Ahlquist et al., “Next-generation stool DNA test accurately detects colorectal cancer and large adenomas.,” Gastroenterology, vol. 142, no. 2, pp. 248–56; quiz e25-6, Feb. 2012.
[184] V. Melotte et al., “N-Myc Downstream-Regulated Gene 4 ( NDRG4 ): A Candidate Tumor Suppressor Gene and Potential Biomarker for Colorectal Cancer,” JNCI J. Natl. Cancer Inst., vol. 101, no. 13, pp. 916–927, Jul. 2009.
[185] T. Mikeska, I. L. Candiloro, and A. Dobrovic, “The implications of heterogeneous DNA methylation for the accurate quantification of methylation,” Epigenomics, vol. 2, no. 4, pp. 561–573, 2010.
[186] R. Siegel, C. Desantis, and A. Jemal, “Colorectal Cancer Statistics, 2014,” CA Cancer J. Clin., vol. 64, no. 1, pp. 104–17, 2014.
[187] S. I. Labidi-Galy et al., “High grade serous ovarian carcinomas originate in the fallopian tube,” Nat. Commun., vol. 8, p. 1093, Dec. 2017.
[188] L. A. Torre et al., “Ovarian cancer statistics, 2018,” CA. Cancer J. Clin., vol. 68, no. 4, pp. 284–296, 2018.
[189] R. D. Cress, Y. S. Chen, C. R. Morris, M. Petersen, and G. S. Leiserowitz, “Characteristics of Long-Term Survivors of Epithelial Ovarian Cancer.”
[190] R. J. Kurman and I. M. Shih, “Molecular pathogenesis and extraovarian origin of epithelial ovarian cancer - Shifting the paradigm,” Human Pathology. 2011.
[191] N. N. Nik, R. Vang, I.-M. Shih, and R. J. Kurman, “Origin and Pathogenesis of Pelvic (Ovarian, Tubal, and Primary Peritoneal) Serous Carcinoma,” Annu. Rev. Pathol. Mech. Dis., 2014.
[192] R. J. Kurman and I. M. Shih, “The dualistic model of ovarian carcinogenesis revisited,
183
revised, and expanded,” Am. J. Pathol., 2016. [193] C. P. DeSimone, M. E. Day, M. M. Tovar, C. S. Dietrich, M. L. Eastham, and S. C. Modesitt,
“Rate of pathology from atypical glandular cell Pap tests classified by the Bethesda 2001 nomenclature,” Obstet. Gynecol., vol. 107, no. 6, pp. 1285–1291, Jun. 2006.
[194] I. Kinde et al., “Evaluation of DNA from the papanicolaou test to detect ovarian and endometrial cancers,” Sci. Transl. Med., 2013.
[195] Y. Wang et al., “Evaluation of liquid from the Papanicolaou test and other liquid biopsies for the detection of endometrial and ovarian cancers.,” Sci. Transl. Med., vol. 10, no. 433, p. eaap8793, 2018.
[196] I. M. Shih et al., “Distinct DNA methylation profiles in ovarian serous neoplasms and their implications in ovarian carcinogenesis,” Am. J. Obstet. Gynecol., 2010.
[197] C. A. Barton, N. F. Hacker, S. J. Clark, and P. M. O’Brien, “DNA methylation changes in ovarian cancer: Implications for early diagnosis, prognosis and treatment,” Gynecologic Oncology. 2008.
[198] M. A. Earp and J. M. Cunningham, “DNA methylation changes in epithelial ovarian cancer histotypes,” Genomics, vol. 106, no. 6, pp. 311–321, Dec. 2015.
[199] O. Koukoura, D. A. Spandidos, A. Daponte, and S. Sifakis, “DNA methylation profiles in ovarian cancer: Implication in diagnosis and therapy (Review),” Molecular Medicine Reports. 2014.
[200] C. C. Chang et al., “The feasibility of detecting endometrial and ovarian cancer using DNA methylation biomarkers in cervical scrapings,” J. Gynecol. Oncol., 2018.
[201] G. S. Watts, B. W. Futscher, N. Holtan, K. Degeest, F. E. Domann, and S. L. Rose, “DNA methylation changes in ovarian cancer are cumulative with disease progression and identify tumor stage,” 2008.
[202] T. R. Pisanic et al., “Methylomic analysis of ovarian cancers identifies tumor-specific alterations readily detectable in early precursor.”
[203] T. E. Bartlett et al., “Epigenetic reprogramming of fallopian tube fimbriae in BRCA mutation carriers defines early ovarian cancer evolution,” Nat. Commun., vol. 7, no. May, 2016.
[204] T. R. Pisanic et al., “Methylomic analysis of ovarian cancers identifies tumor-specific alterations readily detectable in early precursor lesions,” Clin. Cancer Res., vol. 24, no. 24, pp. 6536–6547, Aug. 2018.

184
Johns Hopkins University
School of Medicine
Department of Biomedical Engineering
Clark Hall, Room 122
Baltimore, MD 21218
Curriculum Vitale
Christine Mangione O’Keefe 514 South Washington Street
Baltimore, MD 21231
(410) 419-9650
EDUCATION
Johns Hopkins University, Ph.D. in Biomedical Engineering, March 2020 (expected)
School of Medicine, Department of Biomedical Engineering, GPA: 3.9
University of Maryland, College Park, B.S. in Bioengineering, May 2013
University Honors College, A. James Clark School of Engineering, Summa Cum Laude, GPA: 4.0
BIOGRAPHICAL SKETCH
Christine O’Keefe received her PhD in Biomedical Engineering from Johns Hopkins University.
During her undergraduate studies, she designed an RF-based tracking device to monitor
endotracheal tube positioning and prevent distal migration into the lungs during intubation. She
also developed an ode-based computational model of neuronal outgrowth in response to calcium
gated ion channel activity. While pursuing her graduate degree, Christine developed a microfluidic
platform to detect and quantify epigenetic heterogeneity with respect to DNA methylation,
particularly for rare species identification in liquid biopsies. She has gained extensive experience in
microfabrication, assay optimization, thermal stabilization, image processing, and data processing
and analysis methods. She is part of a cancer research team using the microfluidic digital HRM
platform to investigate the utility of epigenetic heterogeneity in diagnostics, theranostics, and
mechanistic studies.
AWARDS AND FELLOWSHIPS
National/ International
Siebel Scholar Award, 2019
Transducers/Eurosensors Best Paper, 2019
P.E.O. PSA Scholar Fellowship, 2018
MicroTAS Travel Award, 2018
BMES Graduate Design and Research
Award, 2017
University-wide
Institute of NanoBioTechnology Annual
Graduate Poster Competition, 1st Place, 2019
Institute of NanoBioTechnology Business
Pitch Competition, 1st Place, 2019
NIH Biomedical Engineering Training Grant,
Johns Hopkins University, 2013

185
Graduate Research Fellowship, National
Science Foundation, 2014-2018
Banneker/Key Scholarship, 2009-2013
Maryland Distinguished Scholar, 2009-2013
National Merit Scholar, 2009-2013
Primannum Honor Society, 2009
Fischell Department of Bioengineering
Outstanding Senior Award, 2013
RESEARCH EXPERIENCE
Department of Biomedical Engineering, School of Medicine, Johns Hopkins University
Doctoral Research 2013-
present
Research Advisor: Dr. Tza-Huei “Jeff” Wang
Developed imaging system and biological assay for ultra-sensitive high-throughput
epigenetic identification of DNA methylation biomarkers in circulating DNA
Developed simple and facile soft lithography microfabrication technique for PDMS-based
microfluidic chips to withstand high temperature assays
Computational investigation of image processing and data filtering techniques for high-
throughput analysis of large microarray fluorescence images
Automated serial sample loading system for high throughput screening of reagents on a
droplet digital BioMEMs device
Developed an image processing pipeline for segmentation, filtering, and co-registering
uCT and uMR images of angiogenesis in mouse tumors
Department of Systems Biology, George Mason University and University of Maryland, Baltimore
Undergraduate Research June 2012-December
2012
Research Advisor: Dr. Saleet Jafri
Modeled dynamics of the development of the human neuronal growth cone using ode
computational models in Matlab and Fortran
Department of Kinesiology, University of Maryland, College Park
Undergraduate Research October 2011- May
2012
Research Advisor: Dr. John Jeka
Measured effects of cerebellum frequency stimuli on postural control using a Vicon system
TEACHING EXPERIENCE
Johns Hopkins University
Teaching Assistant, Cell and Tissue Engineering Lab, Fall 2018, Spring 2019
Gave introductory lectures on microfabrication, its techniques and applications
Led team-based laboratory exercises in photolithography, soft lithography, and metal
etching
Developed discussion questions for exams and laboratory reports
Teaching Assistant, Biomedical Engineering Modeling & Design, Fall 2017
Directed laboratory experiments developing and testing models of human kinetics

186
Led discussion sections
Graded laboratory reports
Teaching Assistant, Systems Pharmacology and Personalized Medicine, Spring 2017
Developed rubric for computational assignments modeling pharmacokinetics
Graded homework assignments and assisted with project completion
Teaching Assistant, Cell and Tissue Engineering Lab, Spring 2017
Led cleanroom laboratory exercises in photolithography and soft lithography techniques
Developed discussion questions and graded lab reports
United States Naval Academy
Intern, Summer 2010
Led summer project for high school students in designing and constructing a SeaPerch
underwater navigation robot
University of Maryland, College Park
Teaching Fellow, Women in Engineering, Summer 2010
Lead multidisciplinary engineering lab projects including building a solar powered car,
animation using Scratch, Dance pad Mania using electrical circuits for middle school
students
PROFESSIONAL EXPERIENCE
Enterprise Sciences
Intern, December 2012-August 2013
Developed interactive software and ran experiments with novel blood clotting devices
Developed and performed automated data analysis procedures
Prepared daily reports of experimental performance and statistical analysis
GO Consulting, Inc.
Social Media and Website Analytics Manager, 2005-present
Developed and administered client social media accounts
Analyzed website and social media traffic data and presented quarterly analytics reports
ACADEMIC SERVICE
Johns Hopkins University
Biomedical Engineering Extramural Development in Graduate Education (EDGE) President 2017-2018, Treasurer 2015-2017, Director of Public Relations 2013-2015
Coordinated efforts to educate graduate students in predominantly non-academic career
paths
Hosted speakers to discuss professional development, career paths, and career milestones
Facilitated Ph.D.-level internships with companies related to biomedical engineering
Co-hosted a career fair geared toward biomedical scientists and Ph.D. graduates
Managed the budget through the administrative “Systems, Applications, and Products in
Data Processing” (SAP) system and processed reimbursements
STEM Achievement in Baltimore City Elementary School Students (SABES)
Mentor, 2016-2018

187
Led semester-long projects that teach engineering concepts and community involvement to
elementary students at Baltimore city elementary schools
Women in Science and Engineering Mentorship Program (WISE)
Mentor, 2019
Mentored high school student over a semester-long project to fabricate and test a
microfluidic device and understand the research process in biomedical engineering
University of Maryland, College Park
Flexus Women in Engineering Living & Learning Community
Tutor, 2010-2012
Tutored freshmen and sophomore women in engineering and STEM classes
PUBLICATIONS
Journal papers:
O’Keefe C., Pisanic T., Zec H., Overman M., and Wang T.-H. Facile Profiling of Molecular
Heterogeneity by Microfluidic Digital Melt. Science Advances, 4, (September 2018),
eaat6459.
O’Keefe C., Giammanco D., and Wang T.-H. Multilayer digital device for highly efficient capture
and parallelized analysis of rare molecules. Lab on a Chip, 19, (January 2019), 444, doi:
10.1039/c8lc01189c
O’Keefe C., Li, S., and Wang T.-H. Digital DNA sequence profiling of rare epigenetic cancer
biomarkers in a highly parallelized microfluidic platform. Analytical Chemistry, 91, (July
2019), 11275-11282, doi: 10.1021/acs.analchem.9b02346.
Athamanolap, P., Hsieh W., O’Keefe C., Zhang Y., Wang T-.H. Nanoarray digital PCR with high-
resolution melt enables broad bacteria identification and pheno-molecular antimicrobial
susceptibility test. Analytical Chemistry, 91, (September 2019), 12784-12792, doi:
10.1021/acs.analchem.9b02344.
O’Keefe C., Zhang Y., Pisanic T., Herman, J., and Wang T.-H. Ratiometric Probe-ID Scheme for
Multiplexed Analysis of Methylation Heterogeneity by Microfluidic Digital Melt.
(Manuscript in preparation).
O’Keefe C., Pisanic T., Zhang Y., Wang T.-L., Wang Y., and Wang T.-H. Sensitive Analysis of
Methylation Heterogeneity in Pap specimens for Detecting Ovarian Cancer. (Manuscript
in preparation).
Peer reviewed conference paper
Zec, H., O’Keefe, C., Ma, P., Wang, T.H. Ultra-Thin, Evaporation-Resistant PDMS Devices for
Absolute Quantification of DNA Using Digital PCR. Proc. 18th International Conference
on Solid-State Sensors, Actuators and Microsystems (Transducers 2015), p.536-539,
2015, doi: 10.1109/TRANSDUCERS.2015.7180979
O’Keefe, C., Pisanic, T., and Wang, T.H. Digital High Resolution Melt Platform for Assessing
Epigenetic Heterogeneity on a Microfluidic Chip. Proc. 21st International Conference on

188
Miniaturized Chemical and Biochemical Analysis Systems (micro-TAS 2017), p. 1267-
1268, 2017
O’Keefe, C. and Wang, T.H. Digital High-Resolution Melt Platform for Rapid and Parallelized
Molecule-by-Molecule Genetic Profiling. Proc. 40th Annual International Conference of
the IEEE Engineering in Medicine and Biology Society (EMBC 2018), p. 5342-5345,
2018, doi: 10.1109/EMBC.2018.8513609
O’Keefe C., Li, S.., and Wang T.-H. High-throughput real-time profiling of rare molecules with
highly efficient droplet digital microfluidics. Proc. 20th International Conference on Solid-
State Sensors, Actuators and Microsystems (Transducers 2019)
PATENT APPLICATIONS
U.S. Patent Application 62870258: High-Throughput Microfluidic Platform for High-Density
Immobilization and Parallelized Quantitative Real-Time Measurements of Droplets.
O’Keefe, C., Wang, T.H., Kaushik, A., (Filed July 3, 2019). Patent Pending.
CONFERENCE PRESENTATIONS
Oral
O’Keefe C., Pisanic T., Athamanolop P., Zec H., and Wang T.-H. Microfluidic Digital Melt Array
for Accessing Rare Methylation Biomarkers in Cancer. Paper presented to Biomedical
Engineering Society Annual Meeting. Minneapolis, Minnesota. (October 2016)
O’Keefe C., Pisanic T., and Wang T.-H. Ultra-Sensitive Digital Detection of Epigenetic DNA
Methylation Heterogeneity. Paper presented to Biomedical Engineering Society Annual
Meeting. Phoenix, Arizona (October 2017)
Poster
Pisanic T., O’Keefe C., Athamanolap P., Poh W., Chen C., Hulbert A., Brock M., Herman J., and
Wang T.-H. Digital Detection of DNA Methylation Heterogeneity from Liquid Biopsies.
Poster presented to Johns Hopkins Institute for NanoBioTechnology and Physical
Sciences-Oncology Center Annual Symposium Poster Session. Baltimore, Maryland. (May
2017)
O’Keefe C., Pisanic T., and Wang T.-H. Profiling Molecular Heterogeneity by Microfluidic
Digital Melt. Poster presented to Women in STEM Symposium. Baltimore, Maryland
(April 2018)
O’Keefe C., Pisanic T., and Wang T.-H. Profiling Rare Molecules by Digital Melt. Poster
presented to Johns Hopkins Institute for NanoBioTechnology Annual Symposium Poster
Session. Baltimore, Maryland. (May 2019)
PROFESSIONAL ASSOCIATIONS/ MEMBERSHIPS
Member, Theta Tau, Eta Delta Chapter, 2011 – present

189
Student Member, Biomedical Engineering Society, 2013 – present
Student Member, IEEE EMBC, 2018
Student Member, Women in Engineering, 2011 – present