a mesoscale convective complex type storm … · a mesoscale convective complex type storm over the...
TRANSCRIPT

·~ ..
',":4,
NOAA Technical Memorandum NWS WR-196
A MESOSCALE CONVECTIVE COMPLEX TYPE STORM OVER THE DESERT SOUTHWEST
Salt Lake City, Utah April 1986
u.s. DEPARTMENT OF I COMMERCE
National Oceanic and
Atmospheric Administration I National Weather
Service

NOAA TECHNICAL MEMORANDA National Weather Service, Western Region Subseries
The National Weather Service (NWS) Western Region (WR) Subseries provides an informal medium for the documentation and quick dissemination of result~ not appropriate, or not yet ready, for formal publication. The series is used to report on work in progress, to describe technical procedures and pract1 ces, or to relate progress to a limited audience. These Technical Memoranda will report on investigations devoted primarily to regional and local problem> of interest mainly to personnel, and hence will not be widely distributed.
Papers 1 to 25 are in the former series, ESSA Techni ca 1 Memoranda, Western Region Techni ca 1 Memoranda (WRTM); papers 24 to 59 are in the former series, ESSA Technical Memoranda, Weather Bureau Technical Memoranda (WBTM). Beginning with 60, the papers are part of the series, NOAA Technical Memorada NWS. Out-of-print memoranda are not 1 isted.
Papers 2 to 22, except for 5 (revised edition), are available from the National Weather Service Western Region, Scientific Services Division, P. 9· Box 11188 Federal Building, 125 South State Street, Salt Lake City, Utah 84147. Paper 5 (revised edition), and all others beginning with 25 ar~.,il~aJ.ll!ble from the National Technical Information Service, U. S. Department of Commerce, Sills Building, 5285 Port Royal Road, Springfield, Virginia~~d. blPrices vary for all paper copy; $3.50 microfiche. Order by accession number shown in parentheses at end of each entry.
ESSA Technical Memoranda (WRTM)
2 Climatological Precipitation Probabilities. Compiled by Lucianne Miller, December 1965. 3 western Region Pre- and Post-FP-3 Program, December 1, 1965, to February 20, 1966. Edward D. Diemer, March 1966. 5 Station Descriptions of Local Effects on Synoptic Weather Patterns. Phi 1 i p Williams, Jr., Apri 1 1966 (revised November 1967 ,October 1969). ( PB-17800) 8 Interpreting the RAREP. Herbert P. Benner, May 1966 (revised January 1967). 11 Some Electrical Processes in the Atmosphere. J. Latham, June 1966. 17 A Digitalized Summary of Radar Echoes within 100 Miles of Sacramento, California. J. A. Youngberg and L. B. Overaas, December 1966. 21 An Objective Aid for Forecasting the End df East Winds in the Columbia Gorge, July through October. D. John Coparani s, April 1967. 22 Derivation of Radar Horizons in Mountainous Terrain. Roger G. Pappas, April 1967.
ESSA Technical Memoranda, Weather Bureau Technical Memoranda (WBTM)
25 Veri fi cation of Operati anal Probability of Preci pi tati on Forecasts, April 1966-March 1967. W. W. Dickey, October 1967. (PB-176240) 26 A Study of Winds in the Lake Mead Recreation Are~. R. P. Auguli_s. ~anuary 1968. {PR-'77830) 28 weather Extremes. R. J. Schmidli, April 1968 Revi'Seu· ~·r.ch ] 9Rf.) · (' 29 Small-Scale Analysis and Prediction. Philip Wiliams, Jr., May 1'908. · .. ' · • P817S<4?1=;\ 30 Numerical Weather Prediction and Synoptic Meteorology. Capt. Thomas D. Murphy, U.S.A.F.; May 11J~. ""(J1bl673365) 31 Precipitation Detection Probabilities by Salt Lake ARTC Radars. Robert K. Belesky, July 1968. (PB-179084) 32 Probability Forecasting--A Problem Analysis with Reference to the Portland Fire Weather District. Harold S. Ayer, July 1968. (PB-179289) 35 Joint ESSA/FAA ARTC Radar Weather Surveillance Program. Herbert P. Benner and DeVon B. Smith, December !968 (revised June 1970). AD-681857) 36 Temperature Trends in Sacramento--Another Heat Island. Anthony D. Lentini, February 1969. (PB-183055) 37 Disposal of Logging Residues without Damage to Air Quality. Owen P. Cramer, March 1969. (PB-1B3057) 39 Upper-Air Lows over Northwestern United States. A. L. Jacobson, April 1969. (PB-184296) 40 The Man-Machine Mix in Applied Weather Forecasting in the 1970's. L. W. Snellman, August 196g, (PB-18506B) 42 Analysis of the Southern California Santa Ana of January 15-17, 1966. Barry B. Aronovitch, August 196g. ( PB-185670) 43 Forecasting Maximum Temperatures at Helena, Montana. David E. Olsen, October 1g59, (PB-185762) 44 Estimated Return Periods for Short-Duration Precipitation in Arizona. Paul C. Kangieser, October 195g, (PB-187763) 46 Applications of the Net Radiometer to Short-Range Fog and Stratus Forecasting at Eugene, Oregon. L. Vee and E. Bates, December 1g69. (PB-190476) 47 Statistical Analysis as a Flood Routing Tool. Robert J. C. Burnash, December 1969. (PB-18B744) 48 Tsunami. Richard P. Augulis, February 1970. (PB-190157) 4g Predicting Precipitation Type. Robert J. C. Burnash and Floyd E. Hug, March 1g70. (PB-190962) 50 Statistical Report on Aeroallergens (Pollens and Molds) Fort Huachuca, Arizona, 1969. Wayne S. Johnson, April 1970. (PB-191743) 51 Western Region Sea State and Surf Forecaster's Manual. Gordon C. Shields and Gerald B. Burdwell, July 1970. (PB-193102) 52 Sacramento Weather Radar Climatology. R. G. Pappas and C. M. Veliquette, July 1g7Q, (PB-193347) 54 A Refinement of the Vorticity Field to Delineate Areas of Significant Precipitation. Barry B. Aronovitch, August 1970. 55 Appli~ation of the SSARR Model to a Basin without Discharge Record. Vail Schermerhorn and Donal W. Kuehl, August lg7o. (PB-1943g4) 56 Areal Coverage of Precipitation in Northwestern Utah. Philip Williams, Jr., and Werner J. Heck, September 1g70. (PB-1943B9) 57 Preliminary Report on Agricultural Field Burning vs. Atmospheric Visibility in the Willamette Valley of Oregon. Earl M. Bates and David 0. Chilcote,
September 1970. (PB-lg4710) 58 Air Pollution. by Jet Aircraft at Seattle-Tacoma Airport. Wallace R. Donaldson, October 1g7o. (COM-71-00017) 59 Application of PE Model Forecast Parameters to Local-Area Forecasting. Leonard W. Snellman, October 1g7o. (COM-71-00016)
NOAA Technical Memoranda (NWS WR)
60 An Aid for Forecasting the Minimum Temperature at Medford, Oregon. Arthur W. Fritz, October Jg7o. (COM-71-00120) 63 700-mb Warm Air Advection as a Forecasting Tool for Montana and Northern Idaho. Norris E. Woerner, February 1971. (COM-71-00349) 64 Wind and Weather Regimes at Great Falls, Montana. Warren B. Price, March 1971. 66 A Preliminary Report on Correlation of ARTCC Radar Echoes and Precipitation. Wilbur K. Hall, June 1971. (COM-71-00829) 69 National Weather Service Support to Soaring Activities. Ellis Burton, August 1971. (COM-71-00956) 71 Western Region Synoptic Analysis-Problems and Methods. Philip Williams, Jr., February 1972. (COM-72-10433) 74 Thunderstorms and Ha i1 Days Probabilities in Nevada. Clarence M. Sakamoto, April 1972. (COM-72-10554) 75 A Study of the Low Level Jet Stream of the San Joaquin Valley. Ronald A. Willis and Philip Williams, Jr., May 1972. (COM-72-10707) 76 Monthly Climatological Charts of the Behavior of Fog and Low Stratus at Los Angeles International Airport. Donald M. Gales, July 1972. (COM-72-11140) 77 A Study of Radar Echo Distribution in Arizona During July and August. John E. Hales, Jr., July 1g72, (COM-72-11136) 78 Forecasting Precipitation at Bakersfield, California, Using Pressure Gradient Vectors. Earl T. Riddiough, July 1g72. (COM-72-11146) 79 Climate of Stockton, California. Robert C. Nelson, July 1972. (COM-72-10920) 80 Estimation of Number of Days Above or Below Selected Temperatures. Clarence M. Sakamoto, October 1972. (COM-72-10021) 81 An Aid for Forecasting Summer Maximum Temperatures at Seattle, Washington. Edgar G. Johnson, November 1972. (COM-73-10150) 82 Flash Flood Forecasting and Warning Program in the Western Region. Philip Williams, Jr., Chester L. Glenn, and Roland L. Raetz, December 1972,
(revised March 1g78). (COM-73-10251) . 83 A Comparison of Manual and Semiautomatic Methods of Digitizing Analog Wind Records. Glenn E. Rasch, March 1973. (COM-73-1066g) 86 Conditional Probabilities for Sequences of Wet Days at Phoenix, Arizona. Paul C. Kangieser, June 1g73, (COM-73-11264) 87 A Refinement of the Use of K-Values in Forecasting Thunderstorms in Washington and Oregon. Robert Y. G. Lee, June 1g73, (COM-73-11276) 3g Objective Forecast Precipitation over the Western Region of the United States. Julia N. Paegle and Larry P. Kierul ff, Sept. 1g73. ( COM-73-11946/3AS) 91 Arizona "Eddy" Tornadoes. Robert S. Ingram, October 1973. (COM-73-10465) g2 Smoke Management in the Willamette Valley. Earl M. Bates, May 1974. (COM-74-11277/AS) 93 An Operational Evaluation of 500-mb Type Regression Equations. Alexander E. Macponald, June 1g74, (COM-74-11407/AS) g4 Conditional Probability of Visibility Less than One-Half Mile in Radiation Fog at Fresno, California. John D. Thomas, August 1g74, (COM-74-11555/AS) g5 Map Type Preci pi tati on Probabil it'ies for the Western Region. Glenn E. Rasch and Alexander E. MacDonald, February 1g75. (COM-75-10428/AS) g7 Eastern Pacific Cut-Off Low of April 21-28, 1974. William J. Alder and George R. Miller, January 1976. (PB-250-711/AS) 98 Study on a Significant Precipitation Episode in Western United States. Ira S. Brenner, April 1976. (COM-75-1071g/AS) g9 A Study of Flash Flood Susceptibility--A Basin in Southern Arizona. Gerald Williams, August 1g75, (COM-75-11360/AS) 102 A Set of Rules for Forecasting Temperatures in Napa and Sonoma Counties. Wesley L. Tuft, October 1975. (PB-246-g02/AS) 103 Application of the National Weather Service Flash-Flood Program in the Western Region. Gerald Williams, January 1g75, (PB-253-053/AS) 104 Objective Aids for Forecasting Minimum Temperatures at Reno, Nevada, During the Summer Months. Christopher D. Hi 11 , January 1g75. ( PB-252-866/AS) 105 Forecasting the Mono Wind. Charles P. RU:scha, Jr., February 1g75, (PB-254-650) 106 Use of MOS Forecast Parameters in Temperature Forecasting. John C. Plankinton, Jr., March 1g75, (PB-254-649) 107 Map Types as Aids in Using MOS PoPs in· Western United States. Ira s. Brennerl August 1976. (PB-259-594) lOB Other Kinds of Wind Shear. Christopher D. Hill, August 1g75, (PB-260-437/AS 10g Forecasting North Winds in the Upper Sacramento Va 11 ey and Adjoining Forests. Christopher E. Fontana, September 1g75. ( PB-273-677 /AS) 110 Cool Inflow as a Weakening Influence on Eastern Pacific Tropical Cyclones. Wi 11 i am J. Denney, November 1g75. ( PB-264-655/AS) 112 The MAN/MOS Program. Alexander E. MacDonald, February 1g77, (PB-265-g41/AS) 113 Winter Season Minimum Temperature Formula for Bakersfield, California, Using Multiple Regression. Michael J. Oard February 1977. (PB-273-6g4/AS) 114 Tropical Cyclone Kathleen. James R. Fors, February 1977. (PB-273-676/AS) ' 116 A Study of Wind Gusts on Lake Mead. Bradley Colman, April 1g77, (PB-268-847) 117 The Relative Frequency of Cumulonimbus Clouds at the Nevada Test Site as a Function of K-Value. R. F. Quiring, April 1977. (PB-272-831) 118 Moisture Distribution Modification by Upward Vertical flotion. Ira S. Brenner, April 1g77. (PB-268-740) 119 Relative Frequency of Occurrence of Warm Season Echo Activity as a Function of Stability Indices Computed from the Yucca Flat, Nevada, Rawinsonde.
Darryl Randerson, June 1977. (PB-271-2g0/AS)

APPENDIX B. TOTAL RAINFALL M~UNTS FOR AUGUST 10, 1981
Total rainfal I amounts in inches for August 10, 1981 from National Climatological D~ta Center Records for August 1981. Data listing is chronological, from stations first experiencing the storm to the last. ----·--·----··---
Approx. Tot. Tot. Map Amt. Map Amt. Time
CGMJ) Ne_v_a.d_(J_ . C.U:t.a.hJ ___ . I D Ra I n. . _ . . . . . . A.r. i .zona .. _. _____ ___lQ__ •.. Ra.i.o
1800
1900
2000
2100
2200
2300
0000
0100
0200
0300
0400
0500
0600
Sunnyside Adaven Lake Valley Spring Val ley State Park Tempiute Pioche Key Pittman Caliente Modena, Utah Enterprise, Utah Pahranagut W.L. Refuge Elgin Gunlock, Utah St. George, Utah Logandale Un. Exp. Farm Val ley of Fire State Pk. Sunrise Manor (Las Vegas) Las Vegas Sou I der City
Search I i ght
SUN 0.59 ADV 0
0 1. 08 0.07
POC 0.61 KEY 1.50 CAL 0.14
1.42 0.80
PWR 0.35 0 0.32 0.30
LOG 1.20 VFR 3.05
o. 14 LAS 0. 07
0.23
0.22
54
Beaver Dam Pipe Springs Nat. Mon.
Willow Beach Pierce Ferry Tuweep SupaI Bright Angel Grand Canyon Nat. Pk. Peach Springs Bu II head City Kingman Se Iigman Seligman (13 m i SSW) Lake Havasu Wikiup Wa I nut Creek Chino Valley Alamo Dam Hillside (4 mi NNE) Jerome Prescott Beaver Creek Walnut Grove Cor dee
BDM 0.55 1.57
0.98 PRF 1.16 TWP 1.52
1.34 RS 0.83
0.80 PSS 0.55
0.38 IGM 0.47 SEL 0.89 SLG 0.80
0.01 0.71
\'/NT 0.50 0. 11 0.28 0.47 1. 72
PRC 0.22 0.39 1.32 0.03

53

---
52
-\ __ __:.....
- I· .. I . '

. : ..
~~ I~
51

APPENDIX A. AIR ROUTE TRAFFIC CONTROL RADAR CHARTS FOR 10 AUGUST 1981
50

Sakamoto, C. M., 1972: Thunderstorm and hail days probabi I ities in Nevada. NOAA Tec;bn_Lcs;~J __ Memorandum _NW_S_.W.R.7.4, 25 pp.
Schaefer, J. T., 1974: The I ife cycle of the dry! ine • ..J .. ~_8.pJ~L. Meteorol., .U, 444-449.
Scofield, R. A., and 01 rver, V. J., 1977: A scheme for estimating convective rainfall from satellite imagery •. NOAA . .Te.c.h.n.l.c.a.J_~~-and_um NESS 86, Washington, D.C., 47 pp.
Stackpole, J.D., 1967: Numerical analysis of \ltmospherlc soundings, .J .... Appl. Meteorol .... , §, 464-467.
49

ldso, S. B., 1975: Arizona weather watchers: past and present. Weatherwls_~,
28, 56-60.
__________ , Ingram, R. S., and Pritchard, J. M., 1972: An American haboob. 6ul 1. Amer. Meteorol. Soc., 53, 930-935.
Maddox, R. A., 1983: Large scale meteorological conditions associated with midlatitude, mesoscale convective complexe~ ~~ Wea. Rev., 111, 1475-1493.
, 1980: fvlesosca I e convective comp I exes. Bu I I • Amer. ~-'leteoro I • ~~ §1, 1374-1387.
________ , 1976: An evaluation of tornado proximity wind and stability data. ,Mp.n.., Wea. Rev., 104, 133-142.
National Weather Service, 1981: Report on the Moapa Val ley flash flood August 10, 1981. Western Region Headquarters, Salt Lake City, UT, 23 pp.
Orlanskl, 1., 1975: A rational subdivision of scales for atmospheric processes. 6u II. Amer.~j"eoroi,._So~, .5.6, 527-530.
Petterssen, S., 1956: Weather Analysis and Forecasting. McGraw-HI! I Book Company, Inc., New York, 428 pp.
Randerson, D., 1984: _A!mosoherJc .. S.cJ.en.£e and Power Production, DE84005177 CDOE/TIC-27601), National Technical Information Service, U.S. Dept. of Commerce, Springfield, VA, 850 pp.
________ , 1982: Approximations to the peak surface wind gusts from desert thunderstorms. NOAA Technical }~mg~ndum NWS WR-176, National Weather Service Western Region, Salt Lake City, UT, 16 pp.
__________ , 1977: Spatial varlabil lty of warm season echo activity as a function of two stabil lty indices computed from the Yucca Flat, Nevada, radiosonde. Mbn. Wea~~~ 1Q2, 1590-1593.
---------~ 1976a: Meteorological analysis for the Las Vegas, Nevada,flood of 3 July, 1975. Mo~. Wea. Rev., lQi, 719-727.
----------• 1976b: Summertime radar echo distributions of moist convection over southern Nevada and adjacent areas for 1971 and 1972. NOAA Technical Memorandum ERL ARL-58, Air Resources Laboratory, Las Vegas, Nevada, 37 pp.
Reynolds, D. W., and Yonder Haar, T. H., 1979: Sate! lite support to HIPLEX: summary of results 1976-1978. Final report, Bureau of Reclamation Contract #6-07-DR-20020, Colorado State University, Ft. Col !Ins, CO, 89 pp.
Rhea, J. 0., 1966: A study of thunderstorm formation along-dry I lnes. J. Appl •. Meteorol., 2, 59-63.
Ronne, E. E., 1971: Precipitation detection probabil !ties by Los Angeles ARTC radars. NOAA Techn l caJ_M~.rn.org_n.dJJID...lJliS WE.61, 14 pp.
48

REFERENCES
Bailey, H. P., 1966: The Climate of Southern Cal lfornia, University of Cal ffornia Press, Los Angeles, 87 pp.
Bartels, D. L., Skradski, J. M., and Menard, R. D., J984: Mesoscale convective systems: A satef I fte-data-based cf imatology. Wf,A TechnL~&~L!:'leiD.QC.Q.D..d_um. J:.R.L ESG-8, Boulder, CO, 58 pp.
Beebe, R. G., 1958: research airplane.
An instabi I ity I ine development as observed by the tornado J. MeteorQI~, J,, 278-282.
Blake, D., 1923: Sonora storms. Mon. Wea~-B~YL, 21, 585-588.
Benner, H. P., 1965: Evaluation of the operational feasibil lty of uti I izing ARTC radar at Sa It Lake City for weather surve iII ance. Weather Bureau Western Region pub I icatlon; 31 pp.
Brenner, I. A., 1974: A surge of maritime tropical air- Gulf of Cal ifornfa to the southwestern United States. Mon. We9. R9VA, 1Q2, 375-389.
Cylke, T., 1984: Mesoscale analysis of a flash flood producing thunderstorm complex In southern Nevada. ~OL-Reglon Techni~~t No. 84-29, Salt Lake City, Utah, 5 pp.
Fujita, T. T., 1978: Manual of Qow..o.bJ.t.C~.:t..Jdentfticatjon for Project NlffiClh Sate! I fte and Mesometeorofogy Research Project, Dept. of Geophysical Sciences, University of Chicago, Chicago, IL, 104 pp.
____ , 1958: Struct.ure and movement of a dry front. Bull. Am. Mef~rol. Soc., 22, 574-582.
George, J. J., 1960: Weather Eorecasttng for Aeronautics, Academic Press, 673 pp.
Glancy, P. A., 1981: Personal Communication.
Grebe, R., 1982: An outl lne of severe focal storms with the morphology of associated radar echoes. ~ Iechnlcal Memorandum NWSTC-1, 80 pp.
Hales, J. E., 1975: A severe southwest desert thunderstorm: 19 August 1973. Mon. Wea. Rey., l.QJ, 344-351.
___________ , 1974: Southwestern United States summer monsoon source- Gulf of Mexico or Pacific Ocean? ~~~1. Meteorol., ~. 341-342.
_ , 1972: A study of radar echo distribution In Arizona during July and August. ~IechDJ~~-~randum NWSWR-77, 21 pp.
Henry, W. K., and Thompson, A. H., 1963: The Texas dew-point front as seen by TIROS-1, Scientific Report No. 3. Texas A&M Research Foundation, Col lege Station, Texas, 28 pp.
47

ACKNOWLEDGEMENTS
A special thanks to Mr. Patrick Glancy, U.S. Department of the Interior, Geological Survey, for reviewing the manuscript and for the valuable rainfal I data he contributed from the bucket survey he and his staff conducted in the storm area. Appreciation is also extended to Dr. Charles B. Pyke, U.S. Army Corps of Engineers, Los Angeles District for his review and helpful comments. Valuable review comments were also provided by Dr. Jan-Hwa Chu and Mr. Douglas Soule' of WSNSO, and by Mr. Glenn Lussky, NWS/WRH. My sincere gratitude to Ms. B. K. Parker, who not only typed the manuscript, but also lavished considerable time proofreading and checking format requirements.
46

sand, and surface wind gusts of 25 to 30 m/s (50 to 60 kts) accompanied this storm. Maximum rainfall totals were probably 1.5 to 3.0 in (38 to 76 mm) in the Cal rente/Pioche area. Rainfal I totals In the Las Vegas Val ley were in the 0.1 to 0.5 in (2.5 to 12.7 mm) range. Some street flooding did occur In Las Vegas and electric power supplies were disrupted.
The climatology of MCC type storms over the southwestern United States and northwestern Mexico Is unknown. Based on personal review of satellite imagery of the the past 10 yr and on I imlted written documentation <Cylke, 1984 and Hales, 1975), It appears that these large, wei I organized thunderstorms may occur more frequently than expected over the southwestern United States. More complete documentation of these storms Is needed by hydrologists who are assigned the task of designing flood control systems and by meteorologists who must forecast their occurrence and alert the general pub I lc.
45

above mean sea level, the following conclusions were made:
1. Below the cloud bases the mean Inflow wind was from 215° at 10 rr.'s with essentially no direction or speed shear In the vertical.
2. Mean environmental cloud-layer winds were from 300° at 12 m/s with very I ittle direction or speed shear through the layer.
3. Storm movement was from 345° at 15 m/s or 45° to the right of the direction of the mean environmental cloud-layer winds.
4. Sub-cloud layer air therefore had a strong component of relative motion toward the approaching storm. Consequently, a zone of strong enhancement of vertical motion existed along and to the right (west side) of the MCC. The coldest cloud tops and heaviest ralnfal I occurred along and to the east of this convergence zone.
Total ralnfal I amounts of 3 to 6 in (76 to 152 mm) occurred to the southwest of Glendale. As much as 6 to 6.5 in (152 to 165 mm) appears to have fallen near Ute, while 3.05 In (77.5 mm) fel I in a rain gauge located in the Val ley of Fire State Park. Rainfal I rates were estimated to be 3 to 4 in/hr (76 to 102 mm/hr) or more. This Intense ralnfal I caused extensive flooding in the Moapa area. Calculations made from field survey measurements by the USGS showed that many normally dry stream beds experienced streamflow rates of 5,000 to 10,000 ft 3/s (142 to 283 m3/s). A maximum streamflow rate of about 50,000 ft 3/s (1,560 m3/s) Is estimated to have occurred near the mouth of the Cal lfornia Wash• Much property damage and Joss of I lvestock was attributed to the flooding.
On the right flank of the MCC, strong surface outflow winds of 50 to 70 kts (26 to 36 m/s) caused property damage, power blackouts, and injuries from flying debris. Many boats were damaged by strong winds on Lake Mead. In addition, dense clouds of blowing dust and sand were generated, I imiting visibil lty to Jess than 3 ml (4.8 km) for 45 to 60 min in Las Vegas.
MCC type storms have Important societal consequences In the desert southwest. The accompanying heavy precipitation can cause devastating flash floods If the storm passes over a populated area. Much property damage and loss of I lfe can occur (Randerson, 1976a). The strong surface winds can destroy buildings, cause flying debris, and raise dense clouds of blowing dust and sand, thereby reducing local vislbll !ties to zero. Blowing dust and sand and strong winds are hazardous to airplanes, to boats, and to vehicular traffic. The strong winds, heavy rain, and cloud-to-ground I ightning can disrupt electric power suppl les in an area where many homes and businesses are "alI electric".
The level of experience and awareness of the potential dangers of MCC type storms in the desert southwest may be low because many people have moved into this area recently. Upon seeing the desert conditions, some may erroneously assume that heavy rain, strong surface winds, flash flooding, and I ightning don't occur often and are not serious problems. An educational program may be needed to raise awareness.
It Is important to note that a very similar type storm developed north of Glendale on June 30, 1984 <Cylke, 1984). Locally heavy rain, blowing dust and
44

Figure 25. Infrared sate! lite Imagery w!th MB enhancement for 06462, 11 August 1981, or 2246 PST, 10 August.
43

Figure 24. Infrared satel I ite imagery with MB enhancement for 0446Z, 11 August 1981, or 2046 PST, 10 August.
42

where Cal lfornia Wash crosses the highway (Figure 21). To the south of Glendale, in the Val ley of Fire Wash (Figure 21), a streamflow rate of about 20,000 ft 3/s (566 m3/s) was calculated where the wash flowed under Nevada State Highway 167. At this point a culvert was completely destroyed. Alo~ the same stream, the culverts on Nevada State Highway 169, In the Val ley of Flre State Park, were also totally destroyed. The USGS is assembling a separate report on this storm. According to the National Weather Service (1981) "the flooding and high wind caused 10's of mil lions of dol Iars worth of damage to the Moapa area, Lake Mead Recreation Area, and Las Vegas."
Flooding was reported to the west of Kingman, Arizona, In the Kingman Dally Miner. The newspaper reported that Arizona Highway 68 was closed due to flooding In the Sacramento and Twin Washes.
N. Dissipation \
As the MCC continued moving southeastward, cloud tops began to warm after 0400Z (2000 PST>. Figures 24 and, 25 clearly demonstrate this thermal change. In addition, the outflow winds from the storm system began to move out ahead of the MCC cloud mass between 0100 and 0200Z (1700 and 1800 PST>. The accompanying gust front can be easily Identified In Figures 24 and 25. As It moved out ahead of the MCC, the gust front did not appear to Initiate any significant new convection. The gust front was Identifiable In the sate! lite imagery from 0446Z (2046 PST) until nearly 0900Z (0100 PST>. It appears that as the outflow from the MCC began to move away from the MCC, the MCC began to dissipate. Debris clouds from the MCC were identifiable on sate! I lte Imagery until approximately 1500Z (0700 PST) on 11 August.
I I I. CONCLUSIONS
A large, long-! lved, mesoscale convective weather system developed over east central Nevada on 10 August 1981. This storm system satisfied many of the criteria associated with Mesoscale Convective Complexes (Maddox, 1980). These criteria are rigid. Consequently, with some flexlbll ity, an analysis of alI available meteorological data In conjunction with satel I lte imagery and radar data indicate that this storm qualified for a S mesoscale (Orlanski, 1975) system or an MCC. The only MCC characteristic not met was duration criteria 8 (Maddox, 1980) which was met for only 5 hr not ~6 hr.
MCC development occurred ahead of a southeastwardly moving short-wave trough. Rapid development took place In the early afternoon as an upper tropospheric jet of westerly winds ahead of the trough moved over low-level warm, moist air covering extreme southeastern Nevada. As the MCC generated it moved south-southeastward at an average speed of 40 km/hr (25 mph). Strong convergence occurred on the right flank (w~-+ side) of the MCC and along a tight moisture gradient located sl lghtly northeast vf Las Vegas. Strong mass convergence developed along this tight gradient where relatively dry southwesterly flow of 5 to 10 m/s met strong (20 to 30 mi.;:;) and relatively cold northeasterly outflow air from the MCC. Very cold cloud tops (Tbb =-65°C) developed and intense rain fel I to the northeast of this strong convergence zone.
Based on the OOOOZ (1600 PST) winds-aloft data (see Table 2) and on the assumption that cloud bases In the MCC were at or near the 10,000-ft level
41
Confidence in the distribution and Intensity of the rainfal I amounts is relatively high. The areal coverage of the heavy ( 2.1.0 in) precipitation is belleved to be wei I formed. Not only was a bucket survey conducted to define ralnfal I amounts, but also an assessment was made of the condition of the soil and of numerous dry washes tn the area of Interest. Remember, no rain had fallen In this area since mid July. Outside of the one-inch contour in Figure 22, I lttle or no stream flow was noted and the ground was observed to be relatively dry with a lack of marked ril I cuts in the soil. In addition, there were no muddy areas where water had puddled. Considerable soil and vegetation damage was identified within the one-inch contour. A large area to the east of Glendale and to the north of the Colorado River was surveyed for additional heavy flooding. No signs of flooding were found; however, this area is sparsely populated and difficult to access. Consequently, It Is not known with certainty If any other areas of very heavy ( .2.~. 0 in) raIn occurred e I sew here. The cl lmatological data for northwestern Arizona did contain a ralnfal I total of 1.52 in (38.6 mm) at Tuweep. This station was located under a very cold cloud top at 0146Z (1746 PST, Figures 9 and 20).
Rainfal I rates with this storm were difficult to determine quantitatively because of the lack of recording rain gauges. However, one station, the Logandale University Experiment Farm, located on the eastern edge of the heaviest rainfall, had a recording rain gauge. Data from this station indicated a raintal I rate of 0.8 in (20 mm) of rain In 15 min (3.2 in/hr) between 0045 and 0100Z (1645 and 1700 PST). A total ralnfal I of 1.2 In (30.5 mm) was measured at this station. This rainfal I rate Is consistent with that estimated for the storm.
The isohyetal field in Figure 22 was planlmetered to obtain an estimate of the tota I vo I ume of water deposited on the ground and ava i I ab I e for f I·ood i ng before infiltration. Within the 1.0 in (2.54 em) contour, the total volume of water was approximately 5 X 10⁸ m3 (4 X 10 5 acre ft). To compare the rainfal I volume of this storm with the Las Vegas storm of 3 July, 1975 CRanderson, 1976a), the position of the 0.5-Jn contour had to be estimated. For this purpose, the 0.5-Jn contour was assumed to be concentric with the 1.0-ln contour and to have a gradient equivalent to that between the 1.0 and 2.0 in lsohyets. Planlmetry showed that within the 0.5-ln contour the total volume of water was approximately 7 X 10⁸ m3 (6 X 10 5 acre ft), or, roughly 109 m3 within the precision of the data and the isohyetal analysis. In the Las Vegas storm of 3 July, 1975, similar calculations showed.that 2.3 X 10⁷m3 (1 .9 X 104 acre ft) of water were available to the natural drainage channels In a period of 2 to 4 hr (Randerson, 1976a). Consequently, based on the volume of ralnfal I water produced; the storm of 10 August 1981, was 30 times larger than the 1975 storm. Within the half-Inch contour, the intense rainfal I in the Ute area produced approximately 5 X 10⁸ m3 (4 X 10 5 acre ft) of water while roughly 2 X 10⁸ m3
(1.6 X 10⁵ acre ft) fel I In the vicinity of the Val ley of Fire State Park.
M. Streamflow
According to calculatl6ns and measurements made by the USGS (Glancy, 1981 ), streamflow rates of 5,000 to 10,000 ft 3 /s (142 to 283 m3 /s) occurred in many of the dry washes to the southwest of the Logandale/Glendale area. Extensive flooding occurred along the Cal Jfornla Wash and In the vicinity of Ute. A maximum stream flow rate of about 50,000 ft 3 /s (1,557 m3 /s) was estimated to have occurred on the Cal lfornla Wash to the south of Moapa <Glancy, 1981). Flood waters 2 to 4ft (0.6 to 1.2 m) deep were reported to have covered Interstate 15
40

;;. ...... 4 ,,.
~~r~· : ... ~~ :~-if:r;:'·, • . ·~ .. ~~ ... ~·--·:. .
Figure 23. Comparative photographs of a damaged (top) and undamaged (bottom) Spanish Dagger plant located in the area of large hail near Ute, Nevada (Figure 21),
39

DRY GROUND
DRY GROUND
5 0 I I I I
5
i a I
SCALE(km)
15
I
1 N I
~
I
DRY
DRY
Figure 22. lsohyetal analysis of the total precipitation pattern produced by the Intense ralnfal I from the MCC of 10 August 1981. The background for this figure Is that rn Figure 21. Contours are In inches. Station letters correspond to the bucket survey site letters tabulated In Table 3.
38

A:--.... ___ , .............. . A ti A ····• ..•
A •• ~ A " ••. _ _,...- ... - • .. A A 1\ •• ,·'~ '\
A" •'A" : , , "' 1\ ......... : ... .. ~ ...
' \t. \~
•• ;4
\':$! '.~
\? .,•,
A 1\ _.. ... .•...
""" " \ 1\ --........ .... • ............ -······-:.:::::·
5
I
.... _..... ~~ ... ~'9",-···· ... ~/ ....... ~./ -··· -·-·-·····-·····~;"
~~ ...., :
J .. \ .! 1
UTE :• .... -··: _, .. ···-·····-.,. ....
0 5 10
I I I SCALE (km)
A 11 II 1\ NORTH 1\1\ A MUDDY
MOUNTAINS 1\ A 11 1\ 1\
1\ 1\
A , A ..---"'2
15 20
I I
1 N I
Figure 21. Geographical locations of key potnts of interest for the flooding produced by the heavy rainfal I generated by the MCC of 10 August 1981.
37

2246Z
ENHANCEMENT SCALE (MB, 1981)
4: -32.2 to - 41.2°C 5: -42.2 to - 52.2°C 6: -53.2 to - 58.2°C 7: -59.2 to - 62.2°C 8: -63.2 to - 80.2°C
0046Z
o.s. I \
~01 \ I I I I I I I I ... _ ...
2346Z
TOTAL RAINFALL (INCHES)
0146Z
Figure 20. Composite of hourly satellite Infrared temperature measurements for the period of the most Intense surface weather conditions. The total precipitation analysis from Figure 19 Is reproduced In the middle for easy reference.
36

the MCC. Figure 19 shows that rainfal I amounts in excess of 1 in (25.4 mm) accompanied the storm. The area enclosed within this one inch contour is approximately 25,000 km 2
• Figure 20 helps to den·onstrate that this area corresponds nicely with the occurrence of very cold cloud-top temperatures. The large precipitation area shown in Figure 19 (and detailed Jn Figure 22) is approximately 50 times lar8~r than the one generated by the heavy thunderstorms that occurred over Las Vegas on 3 July, 1975 CRanderson, 1976a).
One area of extremely ireavy rainfall was Identified. This area Is enclosed within the three-Inch Jsohyetal contour in Figures 19 and 20. Identification of this area was ~.ubstantlated by extensive property damage due to flooding in the Moapa/Overton area and to the disruption of vehicle traffic on Interstate Highway 15 (see Figure 21 for geographic locations). Quantitative estimates of the spatial distribution and total point rainfal I amounts within this area are based on bucket survey data, on interviews with local residents, on a survey of the occurrence of streamflow In the normally dry washes, and on an assessment of property damage. Based on alI the available Information, It appears that 3 to 6 in (75 to 150 mm) of precipitation could have fat len to.the southwest of the Logandale/Glendale area.
Field surveys conducted after the storm Indicated that torrential rain probably fel I around Ute, Nevada, and over the Val ley of Fire State Park (figure 21). Severe flooding occurred in these areas with water flowing over several miles of Interstate 15. Most of this rainwater flowed north and east Into the Muddy River. The heavy rain that fel I on the Val ley of Fire State Park flowed eastward through Overton, Nevada, and east-southeastward Into Lake Mead. Overton suffered extensive flood damage to homes and businesses. Farms along the Muddy River between Moapa and Overton suffered heavy flood damage and loss of I lvestock. Approximately 500 cows died In the flood waters (National Weather Service, 1981). Bucket-survey data collected by the USGS Indicated that as much as 6 In (152 mm) of rain may have fallen near Ute. This survey Is believed to be rei !able because It had not rained In the area of Interest since mid July. One properly exposed rain gauge was located within the area of heavy ralnfal I at the Val ley of Fire State Park. A total of 3.05 In (77.5 mm) was col Jected In this gauge, but a smal I amount of the rainwater was spll led In the measurement process. Consequently, slightly more than 3.05 In actually fel I. An lsohyetal analysis of the estimated distribution of the heavy rain is given in Figure 22. The lsohyetal pattern has an elI lptlcal shape with the major axis oriented northwest-southeast. Thus, the axis of heaviest rainfal I was oriented para! lei to the storm track.
Hall was observed along the storm track across southern Nevada. The only official report of hail was from LSV, located northeast of downtown Las Vegas. At 0035Z (1635 PST), LSV reported a severe (T+) thunderstorm with hail onefourth Inch In diameter, vlslbll tty zero In blowing sand, and surface wind gusts of 58 kts (30 m/s). Larger hall, estimated to be 1 to 3 In (25 to 76 mm) in diameter was reported by residents In the Glendale area. Some of these Individuals reported "large styrofoam-type balls floating In the flood water." Approximately 12 km southwest of Glendale, near Ute, desert yucca plants (Spanish Daggers) were damaged by large hall (Figure 23). These plants are rugged and can withstand considerable abuse; consequently, the breaking of their spears Is thought to be significant and Is bel leved to have been caused by large ha 1 I stones.
35

Figure 19. Analysis of the total precipitation In Inches for 10 August 1981 In the vicinity of the MCC. To convert from Inches to mil llmeters, multiply Inches by 25.4.
34

L. Precipitation
Precipitation dat~ were extracted from the August 1981 climatological data booklets for Arizona, Cal lfornla, Nevada, and Utah. These data are tabulated in Appendix B. Supplemental data came from a bucket survey conducted by the U.S. Geological Survey (Glancy, 1981) for southern Nevada. These bucket survey data are I isted In Table 3.
An isohyetal analysis of the total precipitation pattern resulting from the storm of 10 August 1981 is shown In Figure 19. For consistency, the analytical results are presented on a sate! I ite-map background, thereby facti itating the ease of comparison between sate! I lte and precipitation data. Some of the rainfa! I was not caused by the MCC. For example, the large area enclosed in the one-Inch contour in southwestern Utah, and the smal I maximum in central Arizona, \vere both contaminated by thunderstorm rainfall from early in the day. However, the analyzed field over southern Nevada and northwestern Arizona was due to
Table 3. Bucket Survey Precipitation Data for August 10, 1981*
Site Letter <See Fjg. 22)
A
B
c
D
E
F
G
H
J
K
Container Descriotlon
52-cm diameter vertically standing can
52-cm diameter vertically standing can
15-cm diameter vertically standing can
Average of 8 vertically standing cans
6.7-cm vertically standing cup
Standard rain gauge; Val ley of Fire State Park
9.8-cm vertically standing cans
12.2-cm vert I ca I I y standing can
7.9-cm vertically standing glass jar
Distinct high-water line In vertically standing 5-gal Jon can. Top of can was squashed, suggesting that the catch area was reduced.
Logandale University Experiment Station
* Data provided by Pat Glancy, USGS, Carson City, NV.
33
Precipitation in Cmm)
1.4
0.7
1 .3
0.7
1.9
3.0
4.0
3.0
1 • 9
6.5
1 .2
36)
18)
( 33)
( 18)
( 48)
( 76)
(1 02)
( 76)
( 48)
( 165)
( 30)

KM TIME (GMT) 50 0 50 19 20 21 22 23 00 01 02 03 04 05 06 07 08 09
PRCP.
SUN
KEY • POC . 0
PWR • CAL
LOG . • BOM 0 VFR
TWP PRF • •
IGM .Pss
(0.59)
(0.81) (1.50) (0.14) (0.35)
(1.20) (0.55) (3.05)
(1.52) (1.15)
(0.42) (0.55)
LVS 0035Z 1/2 T•ABN
WIND 0340G50
SATELLITE
MB ENHANCEMENT LG = -42 to -52°C DG = -53 to -58°C B = -59 to -62°C w = -6 .. :~ -sooc
0 SGL (0.89)
• SLG
•WNT
•PRC
•PHX KM
50 0 50
• SUN
KEY • PIO .
• CAL
PWR
LOG • • BOM • VFR
PRF TWP • •
IGM PSS • • SGL
• • SLG
•WNT
• PAC
(0.88)
(0.50)
(0.22)
NO DATA
11 12 13 14 15 16 17 18 19 20 21 22 23 00 01 PST
Figure 18. Composite of the time changes In the cloud-top temperatures (top) and radar echoes (bottom) along the track of the MCC. Total precJpltatlon amounts In Inches are plotted for staTions located along the storm track (top left margin). The length scale represents distance east or west of the storm track for the locations of the precipitation data.
32

temperature decreased from a maximum of 39°C (103°F) prior to thunderstorm activity to 28°C (83°F) during a thunderstorm. A minimum temperature of 23°C (74°F) was observed during thunderstorm activity at DRA. Figure 1 ~· demonstrates i-hai' these sharp temperature fal Is were accompanied by marked rises in surface pressure.
Randerson (1982) and others have related thunderstorm-induced surfacetemperature fal Is to the maximum observed speed of the surface win~ gust from the outflow. Pronounced temperature fal Is such as those observed at LSV and LAS have been associated with outflow wind speeds of'26 to 36 m/s (50 to 70 kts). Peak wind gusts observed and estimated to have occurred with the MCC fel I within this range.
K. Satellite and Radar Data
Satellite and radar plots are displayed separately in Figure 18. The satel I ite data make up the top half of Figure 18 and include some total rainfal I amounts which are I isted in the left-hand margin (see Appendix B for city name codes). The. radar analysis is in the bottom half of the figure. In general, both data sets were produced once an hour on the half hour. After 0415Z (2015 PST) the IR sate! I ite Imagery was available at half-hour intervals. The temporal and spatial evolution of the central part of the storm is summarized by the analysis in Figure 18. This figure was constructed by first Identifying the path of the center of the storm across the ground. Then, the width of the storm cloud was noted for times corresponding to sate! I lte and radar data collection times. This procedure was accompl !shed by plotting the storm track line on each satell lte or radar picture, overlaying the time I lne onto the newly plotted storm track I lne, and marking the storm cloud boundaries and physical characteristics onto the corresponding time I lne. This procedure was repeated for alI the available satellite and radar data. The plotted data were then analyzed, producing the patterns shown In Figure 18. Pertinent surface observations and radar Intensity Information were added along the appropriate time I lnes.
Detailed analyses of the Infrared imagery of the storm cloud-top temperatures showed that the coldest black body temperatures occurred between 2300 and 0500Z (1500 and 2100 PST). Cloud-top temperatures of •63 to -65°F occurred over and near stations that reported the heaviest ralnfal I (see Figure 20). Because of the poor resolution of the satel I lte Imagery, It could not be determined If "overshooting" occurred along the top of the storm cloud.
The radar data Indicated significant thunderstorm activity occurred within the storm cloud. Available radar charts are included In Appendix A. By 1935Z (1135 PST), a very heavy <TRW++) thunderstorm was Indicated to the south of Ely. By 2035Z (1235 PST), very heavy thunderstorms had developed in this evolving storm system. At 2035Z (1235 PST> a cloud top of 46,000 ft was reported by radar observers. Very heavy to Intense thunderstorm CTRWX) activity was detected between 2035 and 0135Z (1235 and 1735 PST> In southern Nevada. Later, at both 0235 and 0335Z (1835 and 1935 PST), radar reports Indicated extreme CTRWXX) thunderstorm activity over northwestern Arizona.
A comparison of the satellite and radar analyses In Figure 18 illustrates several Important points. The most Intense radar echoes appear to I le along or Just ahead of the axis of coldest cloud tops. The area of heaviest ralnfal I appears to be under, or very near, the coldest cloud tops.
31

moisture content appeared to be sl lghtly to the west of that at the 850-mb level CF!gure 5) and extended northward across extreme southeastern Nevada. This position difference may be an artifact of the analyses ~!nee the data are not dense enough to provide high resolution of the three-dimensional structure of the moisture field. However, the available surface dat~ show that in the Las Vegas val ley the surface dew-point reached a maximum of 16~c (62°F) at 1400Z (0600 PST) at LSV while on the NTS it reached 12°C (55°F) at 1600Z (0800 PST) at DRA. Afterwards, surface dew-points decreased (Figure i~) to near 8°C (48°F) at LAS, LSV, and DRA just prior to the arrival of the strong ~urface outflow accompanying the MCC.
Mixing ratios associated with these changes In dew-point temperature were calculated. Prior to the drying that accompanied the southwesterly flow across southern Nevada, mixing ratios were 10 to 11 g/kg. With the development of southwesterly flow, mixing ratios decreased to 7 to 8 g/kg within about one hour. At OOOOZ (1600 PST) the mixing ratio at LAS was 7.4 g/kg while 22.5 km northeast at LSV it was 10.7 g/kg for a mixing ratio gradient of 0.15 g/kg/km. Within one hour, from OOOOZ to 0100Z (1600 to 1700 PST>, the mixing ratio at LSV decreased by 3.5 g/kg, corresponding to a 10°F drop In dew-point temperature. More gradual changes were observed at DRA. With the arrival of the outflow from the MCC, mixing ratio values Increased rapidly to 11 to 12 g/kg in precipitation.
Analyses of hourly surface data tend to show the development of a tight dew-point gradient across southern Nevada (Figures 15, 16, and 17). The role, If any, played by this tight gradient is not clear. However, the relationship between dry I lnes and severe thunderstorms has been recognized for many years (e.g., Beebe, 1958; Fujita, 1958; Henry and Thompson, 1963; Rhea, 1966; and others). Schaefer (1974) demonstrated that the boundary between dry and moist air can be nearly vertical above the ground but it is not clear if this type structure occurred with this storm.
The marked east-west gradient of elevated dew points across the NTS (Figure 17) Is based on sate! I lte and radar observations of convective clouds. Furthermore, the dew-point temperature at ORA decreased to 7°C (45°F) by 0100Z (1700 PST) and then Increased to 17°C (62°F) by 0300Z (1900 PST) as the moist outflow from thunderstorms spread southward across the NTS. Thunderstorm activity began at ORA at 0130Z (1730 PST) and moved southeastward.
J. Surface Temperature
Pronounced temperature drops occurred at weather stations located under and near the MCC. For example, at LSV the temperature dropped from 42°C (108°F) at OOOOZ (1600 PST) to 26°C (79°F) at 0100Z (1700 PST>. Shortly after the rain began, the temperature dropped to 24°C (75°F) at 0255Z (1855 PST) for a total temperature decrease of 18°C (33°F). At LAS the temperature fel I from 42°C C107°F) just prior to the arrival of the gust front to 28°C (83°F) one hour later, to 22°C (72°F) at 0350Z (1950 PST) after It started raining at 0301Z (1901 PST). Therefore, at LASP the total cool lng caused by the outflow was 20°C (35°F). At PRC the temperature fel I from 22°C (72°F), 3 hours before the arrival of the gust front, to 14°C (58°F) at 0400Z (2000 PST) in a moderate thunderstorm. The gust front arrived at BLH at 0632Z (2232 PST). Between 0555Z (2155 PST) and 0647Z (2247 PST) the temperature dropped 6°C (10°F). At ORA the
30

Figure 17. The OOOOZ, 11 August 1981 (or 1600 PST, 10 August) analysis of surface dew-point temperature (°F). Surface data and the frontal position are both plotted in the standard format. The leading edge of the outflow from the MCC is also plotted in southern Nevada and northwestern Arizona.
29

75 1n
570=
~60 ..
Figure 16. The 1800Z (1000 PST) analysis of surface dew-point Temperature (°F) for 10 August 1981. Surface data and the frontal position are both plotted In the standard format.
28
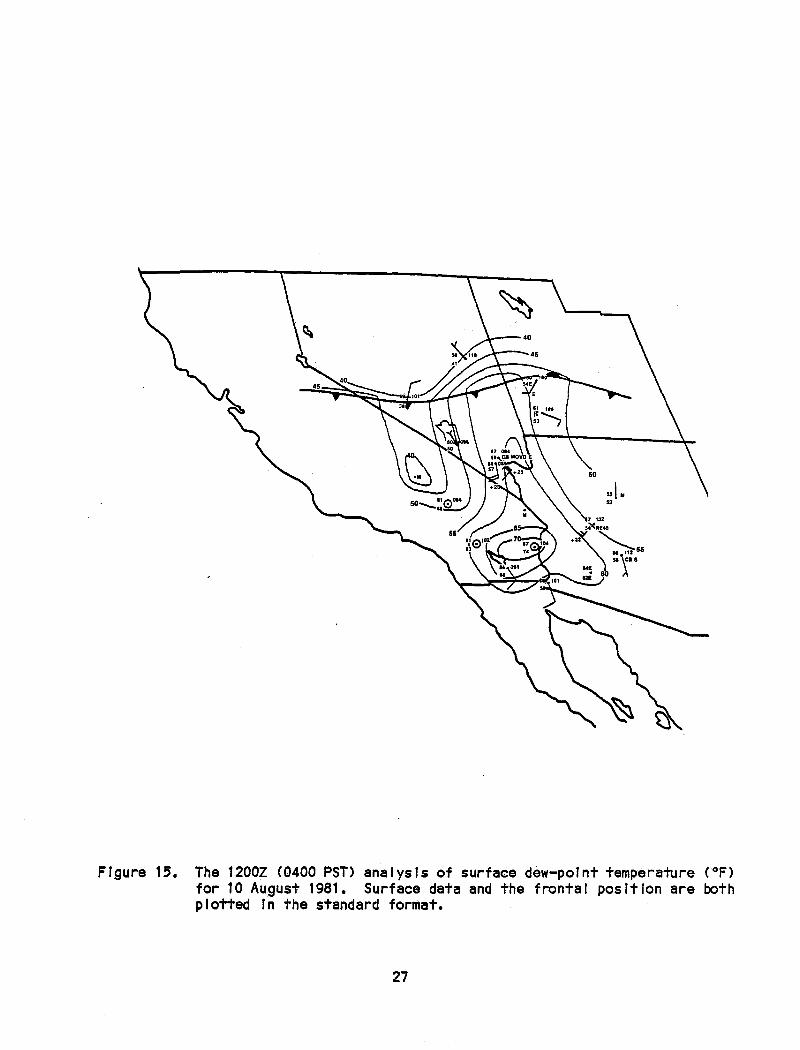
FJgure 15. The 1200Z (0400 PST) analysts of surface dew-point temperature (°F) for 10 August 1981. Surface data and the frontal posltlon are both plotted Jn the standard format.
27

Prescott, Arizona, approximately 3 hr later with a peak wind gust from the north of 25 m/s (48 kts). As the storm moved southward the gust front arrived at Blythe, Cal lfornia, at 0632Z (2232 PST) where a peak gust of 23 m/s (45 kts) was observed from the northeast. The outflow air continued to spread southward and wind speeds weakened (Figure 13). According to available data, after 0800Z (0000 PST, 11 August) the gust front became unidentifiable along a I ine from south of Phoenix to south of Yuma, Arizona, or approximately along the route of Interstate Highway 8.
Between 0100 and 0200Z <1700 and 1800 PST), the gust front moved out ahead of the MCC cloud visible in the satell lte imagery (Figure 18). This separation appears to have occurred as the MCC reached maximum intensity. Perhaps this phenomenon marks the beginning of the dissipation phase of an MCC.
An unofficial report of the storm appeared on the front page of the Kingman Paily Mln~r dated 11 August 1981. From this news report It appears that the gust front arrived In the Kingman Area at about 0230Z (1930 PST). This time is consistent with satel I lte and radar data. The strong surface winds were accompanied by blowing dust. A thunderstorm occurred approximately "2 hours" after the arrival of the gust front. The strong winds were reported to have "caused only minor damage" in the Kingman area.
Based on satel I ite Imagery, radar data, and surface observations, hourly positions of the leading edge of the gust front are shown in Figure 13. This figure illustrates that the outflow from the MCC spread rapidly southward. It traveled a total distance of nearly 575 km in approximately 12 hr for an average speed of 48 km/hr (30 mph). In many places the strong surface winds were accompanied by dense blowing dust and sand (Figures 3, 13 and 14) that reduced surface visibilities to zero. For example, in Las Vegas the surface visibility at LAS was ..:s,3 ml (4.8 km) for 45 to 60 -min.
H. Station Pressure
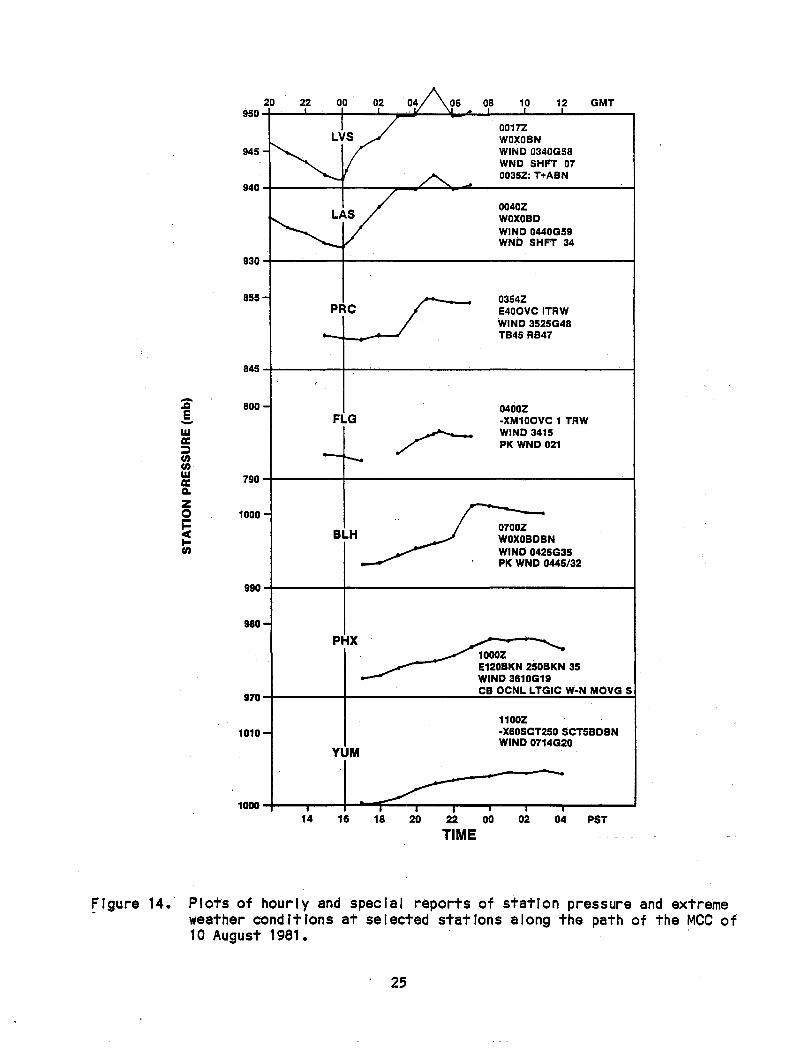
A characteristic of Intense thunderstorms is a pronounced pressure jump accompanying the arrival of cold outflow air. Large pressure jumps were detected at stations located near the path of the MCC. Figure 14 !I lustrates the hourly changes In the station pressure at seven weather stations affected by the storm. Maximum hourly pressure rises of 3 to 5 mb/hr were measured at LSV, PRC, BLH, and ORA {not shown). Although large, these pressure jumps are less than those reported by Hales (1975) who described an Intense, long- I ived thunderstorm system that moved westward across Arizona. Figure 14 shows that the strongest surface winds occurred at those stations experiencing the largest pressure rises. Barometers located at stations near the edge of the dissipating outflow air mass (FLG, PHX, YUM) detected very smal I pressure increases with the accompanying wind shift.
I. Surface Moisture
Changes in the surface-level moisture field are illustrated clearly by comparing Figures 15 through 17. Figure 15 Is an analysis of the observed surface dew-point temperatures for 1200Z (0400 PST), Figure 16 is for 1800Z (1000 PST) just prior to rapid cumulonimbus development, and Figure 17 is for OOOOZ (1600 PST) just before the thunderstorm activity reached LAS, LSV, and ORA. Figures 15 and 16 show that at the surface the axis of maximum atmospheric
26
~lgure 14.
20 22 950
945
940
930
855
845
-.CI 800 E FLG -w a: :::1 en en w 790 a: a. z 0 1000
~ BLH ... en
990
980
PHX
970
1010
YUM
14 16 18
08 10 12 GMT
0017Z WOXOBN WIND 0340G58 WND SHFT 07 0035Z: T+ABN
0040Z WOXOBD WIND 0440G59 WND SHFT 34
0354Z E400VC ITRW WIND 3525G48 TB45 RB47
0400Z -XM100VC 1 TRW
~ WIND 3415 PK WND 021
0700Z WOXOBDBN WIND 0425G35 PK WND 0445/32
1000Z E120BKN 250BKN 35 WIND 3810G19 CB OCNL L TGIC W-N MOVG S
1100Z ·X80SCT250 SCT5BDBN WIND 0714G20
20 22 00
TIME 02 04 PST
Plots of hourly and special reports of station pressure and extreme weather conditions at selected stations along the path of the MCC of 10 August 1981.
25

Figure 13. Estimated hourly positions of the leading edge of the strong outflow wfnds from the MCC of 10 August 1981. Times are in GMT; subtract 8 hrs to get PST.
24

Table 2.
ft(x1 0 3 )
Sfc 4 5 6 7 8 9
10
The OOOOZ winds aloft from Desert Rock, NV (ORA), elevation 3,298 ft MSL. The MCC cloud base Is assumed to be at an altitude of 10,000 ft (3050 m) MSL. AI I elevations (H) are above mean sea level. The tropopause was located just below the 50,000-ft (15,240-~) level.
Sub-cloud Winds Eny I ronmental Cloud-layer Wjnds
DDD/SS H DDD/SS
km deg/ms- 1 ft Cx1 0 3 ) km deg/ms- 1
1.0 180/9 15 4.6 290/11 1.2 215/9 20 6.1 310/14 1.5 215/10 25 7.6 305/16 1.8 215/12 30 9.1 300/15 2. 1 215/12 35 1 o. 7 310/13 2.4 215/11 40 12.2 305/11 2.7 210/10 45 13.7 285/7 3.0 240/9 50 15.2 015/4
pronounced enhancement of the flow of warm, moist air Into the storm, thereby helping vigorous updraft motion that might have been lnltlated by strong thermal instabil tty. The large vertical wind shears observed In the environmental cloud-layer winds near Intense mid-western states thunderstorms (e.g., see Maddox, 1976) were not observed In this case.
G. Surface Wind
As Is typical with Intense thunderstorms, a wei 1-deflned wind shift or gust front accompanied the MCC. A gust front Is the leading edge of a thunderstorm downdraft that spreads out horizontally near the ground. The gust front is the Interface between the warm, moist air flowing toward the storm and the cold, moist downdraft air flowing out of the storm. The downdraft appears to have its origin In the mid-troposphere where dry environmental air can be drawn into the storm. As this air enters the rear of the storm It receives precipitation from above and Is cooled further by evaporation. This cooling Increases the negative buoyancy of the dry air, causing the chilled air to accelerate toward the ground.
Strong outflow winds were detected along the storm track (Figures 3, 13 and 14). At 2355Z (1555 PST) the weather station closest to the MCC CNel I Is AFB, LSV) experienced a wind shift from the south-southwest at 7 m/s (14 kts) to the north-northeast at 21 m/s (40 kts) with gusts to 26 m/s (51 kts) at 0007Z C1607 PST>. A peak wind gust of 30 m/s (58 kts) occurred at 0017Z (1617 PST>. Twenty-seven minutes after the gust front struck LSV It reached McCarran International Airport CLAS) at 0034Z (1634 PST). A peak wind gust of 30 m/s (59 kts) was measured at LAS at 0040Z (1640 PST>. The outflow arrived at
23

42 30__/
Figure 12. The 200-mb chart for OOOOZ, 11 August 1981 (1600 PST, 10 August). Height contours In meters are the soltd I lnes. The position of the MCC l s portrayed by the seal I oped area. The sea I loped contour represents Tbb =-53.2° to -58.2°C, and the shaded area Tbb =-59.2° to -62.2°C.
22

Figure 11. The 850-mb chart for OOOOZ, 11 August 1981 (1600 PST, 10 August). Height contours In 10 1s of meters are solid lines. Data are plotted tn the standard format. The map background Is the same as that for alI the satel I lte Images.
21

Based on the above definitions and observations, it is concluded that the storm of 10 August was an MCC. Indeed, it may have been a mini-MCC, but the duration, size, and weather accompanying this large convective cloud cluster were significant from a meteorological, hydrological, and societal perspective.
F. Upper-Air Analyses
Upper-air sounding data for OOOOZ (1600 PST) help portray the atmos~"~ricflow regime associated with the developing MCC. The OOOOZ (1600 PST), 850-mb chart (Figure 11) shows that the wei !-developed frontal wave present at 1200Z (0400 PST, Figure 5) had maintained its intensity and moved slowly eastward during the intervening 12-hr period. The cold front moved southward across Nevada, bringing strong northeasterly flow to the eastern slopes of the Sierras. These winds induced orographic cumulonimbus over the Sierras (see Figures 8 and 9).
In the upper troposphere (Figure 12), at OOOOZ (1600 PST), a deep closed low was located just northwest of SLC at the 200-mb level. Figure 12 represents the flow near the top of the MCC. The contour analysis in this figure indicates that the flow over Utah and Nevada was strong westerly with a region of difluence located over the MCC generation area. Based on the contour analysis, geostrophic wind speeds in the area between ELY and DRA are likely to have been near 25 m/s (50 kts). Consequently, the MCC developed to the right of a smal I jet and below an area of upper-tropospheric difluence.
A weak, low-level, southwesterly jet probably existed over southern Nevada at OOOOZ (1600 PST). The OOOOZ winds-aloft sounding from DRA showed that below 12,000 ft (4,000 m) MSL the maximum wind speed was 12 m/s (23 kts) at both the 1,800- and 2,100-m (6,000- and 7,000-ft) levels MSL or approximately 900 to 1,200 m (3,000 to 4,000 ft) above ground level CAGL). Wind towers on high <2,100-m MSL) terrain in the northern part of the NTS confirmed the existence of such wind speeds. Wind directions were generally southwesterly. Prior to the arrival of the strong surface outflow from the thunderstorm, surface winds at two weather stations In the Las Vegas val ley were reported to be southwesterly 5 to 13 m/s (10 to 25 kts>. Boundary-layer theory predicts that above the ground, wind directions should have been southwesterly at slightly faster speeds (e.g. Randerson, 1984).
Vertical wind shear may have been a contributing factor in the development and maintenance of the MCC. The only winds-aloft data near the MCC are those from the OOOOZ (1600 PST) DRA rawlnsonde (Table 2). Just prior to OOOOZ, the westward edge (Figure 8) of the MCC was 55 km east of DRA while the center of the storm was at a distance of roughly 220 km. Based on ceiling observations during the thunderstorm activity at DRA, LAS, and LSV, it can be assumed that the base of the MCC was near 10,000-ft (3050-m) MSL. Using this assumption, the data in Table 2 Indicate that the mean subcloud winds were approximately 215° at 10 m/s while the mean environmental cloud-layer winds were 300° at 12 m/s. The difference between these two mean winds yields 85° of veering between the subcloud winds and the environmental cloud-layer winds. Storm movement was from 345° at 15 m/s, or 45° to the right of the direction of the mean environmental cloud-layer winds and at a speed approximating wind speeds in the middle troposphere. Consequently, the subcloud air layer had a strong component of relative motion toward the approaching storm. Such motion probably caused
20

AREA (km2)
108 ~--~--~----~--~--~----~--~--~----~---,
102 ~--~--~----~--_.--~----~--_.--~----~--~ 14 22
15 23
16 00
17 18 01 02
TIME
19 03
20 04
21 05
22 PST 06 GMT
Figure tO. Graphical representation of the temporal change In the total area enclosed within three separate equivalent black body temperature CTbb) regimes visible In the Infrared satellite Images with MB enhancement.
19
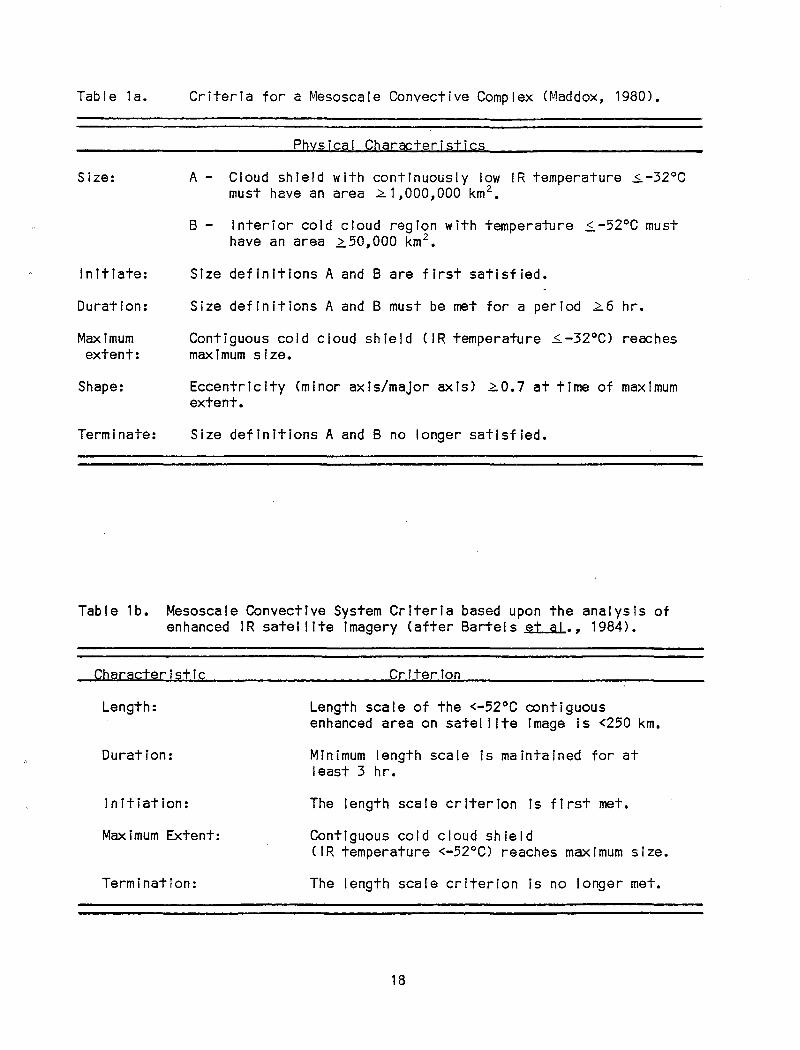
Table 1a.
Size:
Initiate:
Duration:
Maximum extent:
Shape:
Terminate:
Criteria for a Mesoscale Convective Complex (Maddox, 1980).
Physical Characterjstjcs
A- Cloud shield with continuously low IR temperature s..-32°C must have an area 2.. 1, 000,000 km 2
•
B- Interior cold cloud region with temperature .$..-52°C must have an area .?:.50,000 km 2
•
Size definitions A and Bare first satisfied.
Size definitions A and B must be met for a period 2..6 hr.
Contiguous cold cloud shield CIR temperature s..-32°C) reaches maximum size.
Eccentricity (minor axis/major axis) 2.0.7 at time of maximum extent.
Size definitions A and B no longer satisfied.
Table 1b. Mesoscale Convective System Criteria based upon the analysis of enhanced IR satellite Imagery (after Bartels et al., 1984).
Character j st i c
Length:
Duration:
lnltiatlon:
Maximum Extent:
Termination:
Criterion
Length scale of the <-52°C contiguous enhanced area on satellite image Ts <250 km.
Minlmum length scale is maintained for at least 3 hr.
The length scale criterion Is first met.
Contiguous cold cloud shield CIR temperature <-52°C) reaches maximum size.
The length scale criterion Is no longer met.
18

Figure 9. Infrared satellite Imagery with MB enhancement for 0146Z, 11 August 1981, or 1746 PST, 10 August 1981.
17

Figure 8. Infrared satellite imagery with MB enhancement for 2346Z (1546 PST), 10 August 1981.
16

Cumulonimbus development In eastern Nevada coincided with several Important developments In the atmosphere. It appears to have occurred in a region of positive vorticity advection, strong upward motion, and low-level moisture convergence. It took place ahead of a surface wave on a cold front, and It may have been enhanced by Intense surface heating. For example, the maximum temperature !n LAS before the thunderstorm was 42°C (107°F).
E. Mature Stage
Between 2000Z (1200 PST> and 0200Z (1800 PST), the convective, mesoscale weather system continued to grow In horizontal area and cloud-top temperatures continued to cool. Based on these two measures, the storm appears to have reached maximum Intensity between approximately OOOOZ (1600 PST) and 0400Z (2000 PST>. Figures 8 and 9 show the IR imagery for the storm at 2346Z and 0146Z (1546 and 1746 PST) respectively.
Maddox (1980) used size and duration criteria to identify a Mesoscale Convective Complex or MCC (Table 1a). His requirement that a large part of MCC cloud shields have a Tbb ~ -52°C indicates that the system Is active and that precipitation Is fat I lng over a large area. According to Maddox, the scale of an MCC Is huge relative to Individual thunderstorms. For example, mature air mass thunderstorms have a cold (Tbb s -32°C) cloud-shield area of roughly 700 km 2
• Multicel I thunderstorms have corresponding average cloud-top areas of 1400 km 2 (Reynolds and Yonder Haar, 1979). In Table 1a, notice that the size of an MCC cloud shield exceeds that of an Individual thunderstorm by more than two orders of magnitude.
Based on the criteria listed In Table 1a, the convective weather system of 10 August appears to qualify marginally as a smal I MCC. Figure 10 shows that size criteria A and Its duration requirement are met. The area enclosed within the -32°C Isotherm Is 10 5 km 2 or greater for at least 8 hr. Size criteria B Is met for only 5 hr, one hour short of the minimum 6-hr duration criteria. The contiguous cloud shield with Tbb ~ -32°C reached a maximum size of approximately 2.1 X 10 5 km 2 at 0300Z (1900 PST>. At this time the shape criteria (Table 1a) was met. Consequently, the only physical requirement not met was the duration criteria for size category B which terminated one hour early.
Bartels et al. (1984) proposed a different set of criteria for mesoscale convective systems <Table 1b). The storm of 10 August appears to have satisfied most of these criteria. The duration scale was satisfied, however, the length scale of the s 52°C contiguous area was exceeded slightly.
Me~oscale space and time scales were defined by Orlanskl (1975). He defined S scale phenomena as having characteristic times of 5 to 24 hr and horizontal scales of 20 to 200 km. The storm of 10 August had a duration of ~pproxfmately 15 hrs. The maximum horizontal extent of the IR Tbb s 52°C a.ea was nearly 250 km from 0146 to 0246Z (1746 to 1846 PST>. Maddox (1980), Bartels et al. (1984), and others have recognized that the~ 52°C cumulonimbus cloud-top isotherm Is often associated with deep, precipitating convective clouds. Consequently, it Is selected here to represent the spatia! scale of the storm system. For most of the storm lifetime the cross-sectional length of the area enclosed within this isotherm was <200 km.
15

surface observations of the bases of the thunderstorms that developed in the Las Vegas area (see paragraph F). Based on the OOOOZ (11 August) sounding, the I ifted Index over southern Nevada and northwestern Arizona could have Jeen -8 with 9 9 =26°C. These conditions would have produced a very large area of positive buoyancy throughout the middle and upper troposphere. The t0~s of the thunderstorms would have been near the 13,500-m (45,000-ft) level with cloud-top temperatures of -60° to -65°C. These values are consistent with sate! I lte observations (see paragraph K).
D. Storm Development
After 2000Z (1200 PST), thunderstorms started to develop rapidly and grow in areal extent south of Ely. This development is portrayed neatly by changes in the clouds shown in the Infrared sate! I lte pictures of Figures 1 and 2. In Figure 1, the two large cumulonimbus clouds in eastern Nevada had cloud-top temperatures of -42° to -52°C, corro~pc~d!ng to an altitude range of roughly 10,500 to 11,700 m (34,000 to 38,000 ft) above mean sea level CMSL). One hour later (Figure 2), the two Individual cumu!on!mbus had canso! !dated !r.to one large cloud mass and the cloud-top temperature had cooled. The dark-gray shading corresponds to equivalent black body tempe~atures of -53° to -58°C or approximately 11,700 to 13,000 m (38,000 to 42,000 ft) MSL. Two very cold tops are seen as black spots within the dark gray shading. These two points have a Tbb of -63° to -80°C. Based on a computer analysis of cloud-top temperatures and on the OOOOZ (1600 PST) temperature sounding for DRA (Figure 7), the T bb was near -65°C.
The horizontal area of the cloud tops In Figure 1 (I ight-gray shading T bb ..s -32°C) Is near I y 1 04 km2
• * One hour I ater this area grew to 2 X 10⁴ km2 and the new colder cloud tops (Tbb ..$.-52°C) covered an area of roughly 4 X 10³ km2 *. The Tbb ~-32°C Is near the 300-mb level (see Figure 7}. Mass divergence of the cloud top with this temperature can be calculated from (Af 1 CdA/dt), yielding 1.85 X 1o- 4 s- 1 near the 300-mb level. This value represents an approximate mass balance with the convergence derived for the 850-mb level (see Divergence section).
Radar data collected at approximately 2030Z (see Appendix A) corresponds closely with the 2046Z (1246 PST) sate! I lte picture (Figure 2). Radar reflectivities Indicated a "very heavy" thunderstorm (TRW++) below the cold CTbb=-53° to -58°C) cloud tops. A TRW++ corresponds approximately to VIP level 4 or to 2.2 to 4.5 in/hr (56 to 144 mm/hr) of precipitation at the ground (Grebe, 1982). No such precipitation amounts were reported or measured below this thunderstorm; however, one station under this echo, Key Pittman, Nevada CKEY), did receive a dally total of 1.5 In (38 mm). A post-storm weather summary prepared by J. W. Corey, a Lead Forecaster at the Reno, Nevada, WSFO, indicated that 0.7 in (17.8 mm) of rain tel I at Key Pittman in 20 min for a rainfal I rate of 2.1 in/hr (53 mm/hr). Radar reports indicated that the maximum cloud top of this TRW++ was 14,000 m (46,000 ft) MSL. This altitude is consistent with that estimated from OOOOZ (1600 PST) ORA sounding (Figure 7) and with the coldest (-65°C) cloud top estimated from the sate! I lte Imagery.
* Not corrected for para! lax.
14

/ ....,....-----,----~-------,.---....-~---t 1000 ------"""----~----------- 1050 -10 10 20
TEMPERATURE (0 c)
., ::rJ
-m 3CJ) r;j'C/) -c:
::rJ m
Figure 7. Skew T-log P diagram for Desert Rock, Nevada, CORA> for OOOOZ, 11 August 1981, or 1600 PST, 10 August 1981.
13

t--___,.'------,.0....:::-----'7~--___,~--~ 900
~---~---~---~~~-~~ 1000 ~------~-----~-----~------~~ 1050 20 30
TEMPERATURE ( 0 c)
Figure 6. Skew T-log P diagram for Desert Rock, Nevada, CORA) for 1200Z (0400 PST>, 10 August 1981.
12

the axis of maximum moisture content CT-T d~5°C) extended from westem Arizona northward Into southwestern Utah. This positioning is based on the plotted data, on sate! lite and radar data 1 and on observed low clouds and precipitation occurring within the 5°C departure contour. Based on the plotted temperature data and on the position of the lsodrosotherms over northwestern Arizona, mixing ratios of lv to 15 g/kg may have been available to the generating thunderstorm system at the 850-mb level. Surface mixing ratios at Cedar City and in Las Vegas we. ... 1 0 to 12 g/kg prIor to storm deve I opment.
PI vergence
A computer-generated analysis of the 12002, 850-mb divergence field showed a pronounced area of convergence (nearly -2 X 10- 4s- 1
) centered just north of the NTS and covering alI the southern half of Nevada and southwestern Utah. A similar analysis for the upper troposphere (200-mb level) showed an east-west oriented axis of strong divergence (10- 4 s- 1
) centered over southern Utah and southeastern Nevada. These divergence fields along with the positive vorticity advection at the 500-mb !eve! (Figure 4) lmpl les a wei !-developed area of upward motion throughout most of the troposphere over southern Nevada and southwestern Utah. In fact, computations of vertical motion based on the continuity equation and on the calculated divergence field at the surface, 850-, 700-, 500-, and 200-mb levels for 12002 showed a deep layer (surface to 12,000 m) of upward motion of 10 to 15 cm/s located south of Ely, Nevada. Coupled with this upward motion and the southward movement of the upper-air trough, surface heating during the day, and the advection of low-level moisture into southwestern Utah, the stage ~tas set for the development of Intense thunderstorms.
Atmospherlc~t~.bJJJ.:t.y
The 12002 vertical temperature sounding for ORA on the morning of 10 August (Figure 6) shows that the atmosphere was conditionally unstable from near the 1500-m (5,000-ft) level to near the 11 ,000-m (35,000-ft) level. A small stable layer was detected near 6,100 m (20,000 ft). The tropopause was near the 15,000-m {48,000-ft) level where the temperature was roughly -64°C. A region of relatively stable air existed between the 11,000-m (35,000-ft) level and the tropopause. In the 12-hour period between 12002 and OOOOZ C11 August) the ORA temperature sounding changed I lttle (Figure 7). Below the 6,100-m level there was essentially no change except for strong heating near the surface. Above 6,100 m there was a general warming of 2°C up to near the 12,000-m (40,000-ft) level. The stable layer near 6,100 m vanished and a relatively stable layer existed between the 12,000-m level and the tropopause.
At 12002, 10 August 1981, the stabll lty Indices calculated from the ORA sounding (Figure 6) showed that the atmosphere was unstable. The K-factor (George, 1960) was 26 and the I lfted Index (Stackpole, 1967) was -3. But the low-level air over southern Nevada was relatively dry (figure 5). lnstabll lty m lght have been Increased by the advection of the- I ow-l eve I rno I st (and cooler) air over north\'lestern Arizona into southeastern Nevada during the morning hours. Strong surface heating of this shallow moist layer could have created a large negative lifted index. Available data Indicate that mean, low-level mixing ratios as high as 14g/kg could have existed over northwestern Arizona. In addition, surface heating could have raised the mean low-level potential temperature to 45°C or more. Based upon these two assumptions, the lifting condensation level would have been near the 700-mb level; a value supported by
11

25
20 .....
\
\2 \ 20 >531
\ \
"' " \ '-' .......
21~537 s I
....
Figure 5. The 850-mb chart for 1200Z (0400 PST), 10 August 1981. Height contours In meters are sol Jd lines and the dashed I lnes represAnt dew-pofnt depression (°C). Data are plotted Tn the standard format. The map background Is the same as that for alI the satel I lte Images.
10

91
94
15 88 I
I 45
91
Figure 4. The 500-mb chart for 1200Z (0400 PST>, 10 August 1981. Height contours in 10's of meters are sol Jd I lnes and the relative vorticity field CX 10-6 s-1) is portrayed by the dashed I lnes. Data are plotted In the standard format. The map background Is the same as that In alI the satellite Images.
9

C. Pre-storm Conditions
500-mb Flow
On the morning of 10 August 1981, atmos~heric conditions over Utah, Arizona, and eastern Nevada were favorable for thunderstorm development. The potential for intense thunderstorms was present. Fioures 4 and 5 illustrate the important evolving meteorological situation. Figure.:; the 500-mb chart, is representative of the pre-storm meteorological conditions in the mid and upper troposphere at 1200Z (0400 PST) on 10 August 1981. The most important feature in this figure is the sharp, southward-moving trough oriented east-west along the Nevada-Idaho border. Accompanying the trough is a strong cyclonic vorticity field (dashed I ines). Notice, in particular, that the vorticity contours are tightly packed between ORA and ELY with the axis of maximum relative vorticity advection oriented along a line from SLC to north of the NTS. Areas of positive vorticity advection are normally associated with upward vertical motion (Petterssen, 1956), Flow in the upper troposphere contained a smal I jet stream that was essentially paral lei to the saao-m contour in Figure 4. Maximum wind speeds accompanying this west-northwesterly jet were roughly 30 m/s (50 kts). Intense thunderstorm deve! opment tool<. pI ace to the south of the jet stream axis in early afternoon.
Meteorological conditions in the lower troposphere are II lustrated by Figure 5, the 850-mb chart for 1200Z. The height contour analysis shows a low center between ELY and ORA. The contour field Indicates that flow with a strong southerly component should have existed over southwestern Utah, northwestern Arizona, and southern Nevada. Surface winds at 1200Z (0400 PST) in the Las Vegas area were southerly 7 to 11 m/s (15 to 25 mph). Cedar City and Milford, Utah, and Prescott and Grand Canyon, Arizona, alI had surface winds driven by local thunderstorm and ralnshower activity. In general the 850-mb flow regime appears to have been imperfectly balanced In the geostrophic sense. Both the 1200Z and 1800Z (0400 and 1000 PST) winds aloft observations from ORA (elevation 1,100 m) detected I ight (3 to 5 m/s) southerly flow from the ground to 1,300 m (4,000 ft) above the ground.
By late afternoon the low-level flow regime over Nevada, Utah, and northwestern Arizona could be separated into three distinctly different air masses. Northern Nevada was covered by a polar air mass located north of a frontal zone that extended westward across central Utah Into central Nevada (Figure 5). In Nevada this frontal zone was moving slowly southward. A hot, dry continental tropical air mass was spreading eastward from southern California across southern Nevada as maritime tropical air over extreme southeastern Nevada receded slowly eastward. The boundary between these two tropical air masses could be identified by a marked dew-point temperature gradient at the surface. This "dew-point front" extended north-south over southern Nevada.
J..Qw-Leve! Motst"r.,.
Low-level moisture available to fuel thunderstorms Is portrayed in Figure 5 by the dashed I lnes representing dew-point depression at the 850-mb level. The most significant feature In this diagram is the very tight moisture gradient over southern Nevada. Very dry air was present over most of Ca! ifornla while
8

Meteorological data were collected and analyzed for the 4-state area consisting of California, Nevada, Utah, and Arizona. Within this area, the upper-air stations (F!gu:e ~) are approximately 375 km apart. Surface weather data are denser; however, the core of the thunderstorm system did not pass directly over any first-order weather stations. Moreover, the storm developed and traveled within an area lying between upper-air s-tations. Consequently, surface and upper-air data from the vicinity of the thunderstorm system are scarce; however, some valuable observations were ot.tl=~ined to supplement the satell lte Imagery and radar data.
Satellite imagery used In this study came from the Geostationary Operational Environmental Satel I lte (GOES) that was located over the equator at 135°W and at an altitude of nearly 36,000 km. Both visible and infrared (IR) pictures were available for 10 August 1981. The visible sensors scanned the 0.55 to 0.70]1m I lght region while the IR images sensed In the 10.5 to 12.6 11m band. At the satel I ite subpoint <O.ON, 135W) the best resolution was 1 km for the visible Imagery and only 9 km for the IR. One picture was received every 30 min, alternating between visible and IR Images, so that the time Interval between I Ike pictures was 1 hr until sunset~ after which an IR picture was received every 30 min.
The IR imagery available was the M8 enhancement which portrays specified ranges of IR black body temperature <Tbb). Of particular Importance were the cloud top areas enclosed by Tbb ~-32°C and by the area enclosed by Tbb ~-52°C. To estimate ralnfal I rates by using satel I lte Imagery, Scofield and Oliver (1977) assumed that precipitation starts to accumulate after Tbb reaches -32°C. A c I oud sh I e I d hav l ng T bb ~ -52°C ensures that the system is active and that precipitation Is falling over a significant area <Maddox, 1980). Convective clouds with Tbb ~-58°C point to possible overshooting tops. Fujita (1978) has used cloud-top temperatures to study the downburst phenomena.
Air Route Traffic Control Center CARTCC) radars detect thunderstorm activity. In the western U.S., the National Weather Service compiles a summary of this weather-related radar-echo ac:;tivity once each houron approximately the half hour. The summarized data are transmitted over a RAFAX network 15 min later. It Is Important to emphasize that ARTCC radars were designed and sited to provide the best possible detection of aircraft. Furthermore, these radars are equipped with special circuitry, such as, sensitivity time control and circular polarization, to speclflcal ly remove most weather related targets. Such design qual !ties do not provide for optimum detection of precipitation. Despite these I Imitations, the ARTCC radars are capable of providing much useful weather data (Benner, 1965). However, Ronne (1971) concluded that some ARTCC radars probably display only moderate or greater preclpltatlon Intensities.
High mountainous terrain can restrict the detection of moist convection by radar. However, the thunderstorm system of Interest developed and moved through an area where the probabll lty of rad~.r .detection of surface precipitation during summertime Is 80 to 90 percent (e.g., see Randerson, 1976b). This probabll tty decreases to 70 percent In northwestern Arizona.
7

been accompanied by a marked increase in urbanization with its concurrent heightened risk of weather-related catastrophes. Some evidence is available to show that the impact of Intense thundersiorms on people and property has been increasing (Randerson, 1976b).
Summer tourists add another dimension. Annually, mil lions of people visit recreational attractions of the mountainous desert southwest, with summertime being an especially busy period. Many pe~~le like to visit, hike, and camp in Isolated, sparsely populated areas of Arizona, Nevada, Utah, and southern California. Communication of weather warnings to these individuals Is d iff leu It.
The level of experience and awareness of the potential dangers of desert thunderstorms may be minimal with many people who have recently moved to the desert. Upon seeing the dry desert, some may assume that heavy rain, strong surface winds, flash flooding, and I ightnlng don't occur often, or, at least, are not a serious threat. An educational program may be needed to raise awareness.
To compound the developing problem, there has been I lttle documentation of the characteristics, behavior, and the spatial and temporal distrioutions of desert thunderstorms. Only recent studies, such as those by Sakamoto (1972), Brenner (1974), Hales (1972, 1974, 1975), ldso et al. (1975), and Randerson (1976a, 1977, 1982) have provided information relating to the kinematics and climatology of southwestern desert thunderstorms. Further documentation and research is essential to understand how these storms develop and move so that their occurrence can be forecast more accurately and weather warnings issued in a more timely and effective manner.
I I. METEOROLOGICAL ANALYSES
A. Charts
Most of the meteorological charts used have a map background and scale that corresponds with that of the sate! I ite imagery. Consequently, these charts can be overlayed easily onto the sate! lite imagery so that sate! lite views of the thunderstorms can be visual !zed relative to the meteorological analyses.
B. Data
Available meteorological data consists of the standard upper-air observations taken at OOOOZ and 1200Z daily as wei I as hourly and special surface weather observations. Additional data Includes hourly radar data, visible and Infrared sate! I lte imagery, surface-wind data from a wind tower network on the NTS, detailed cloud-top temperature analyses*, and special analyses of vorticity and divergence**·
* Provided by Mr. J. T. Young, Space Science and Engineering Center, University of Wisconsin, Madison, Wisconsin.
** Provided by Dr. James E. Arnold, Atmospheric Sciences Division, Marshal I Spaceflight Center, NASA, Huntsville, Alabama.
6

I I I I
\ ." TPHe
O"'A: 1.734 PST: 0134Z TRW·. PK WND ESE@ 29 mph TE 1938 MOVO SE: 0.02" rain.
-- "'
LAS: 1834·2220YLST: 0034· 0820Z WOXOBN: TRW·: PK WNO NE@ 68 mph 0.07" rain massive POWH outagfl..
~
' '
ELYe
NTS: Wind Towen 16011-1700 LST, 00·012 wind gusts 35 to SO m h. R11infall 0.02" to 0.19":
UTE: s.o• TO 6.5"
IGM: 1930 LST. 0230Z BD, strong sfc windl, wind damage 2130 LST, 0430Z, TRW. local flooding: AZ HY 61 clooed by floodln W of IGM.
BLH: 2247 LST: 0847Z WOXOBOBN PK WND NE @ 52 m
\
L----T
I \ \ \
CDC: 1450 LST. 2150Z TB42 W·NW MOYG E L TGCG SW"N. 1554 LST, 2254Z
I I \ I
I TRW·. T SW·S MDYG E.
- -t-1
Lake Mead Area: Much damage to boats and harbor faciiiHes.
FLG: 2059 LST.
PR C: 2054 LST: 0354Z E4CIIB 1TRW, PK WND NNW @ 67 mph, 0.32" rain.
PHX: 0235 LST: 0953Z CB OCNL LTGIC W•N MOVG S WND N 10G19, PK WND 25 mph 0452 LST: 1152Z. RW· RB15.
- -- YUM: 0355 LST, 1055Z 5BDBN 070114G20 PK WND 30 mph
.........:: YSBY N 2ml· CB N•NE DSIPTD.
I \ I I I
Figure 3. Overview of'slgnlflcant surface weather that accompanied the mesoscale storm system of 10 August 1981.
5

Figure 2. Infrared sate! I ite imagery with MB enhancement for 2046Z (1246 PST), 10 August 1981.
4

. -- -. il'_. ~ ~· --""'
"' 'I::., -I
-~"
Figure 1. Infrared satellite imagery with MB enhancement for 1946Z (1146 PST), 10 August 1981.
3

been identifIed over the centra I United States by Maddox ( 1980). Indeed, this type of weather system Is so important it has been named Mesoscale Convective Complex or MCC (e.g., see Maddox, 1980). Little effort has been expended to determine If MCC's occur over the western United States. Limited data point to the formation of MCC's over the desert southwest in July through September. The storm of 10 August 1981 appears to satisfy most of the physical characteristics of an MCC.
B. The Thunderstorm
In the early afternoon of 10 August 1981, thunderstorm activity over east central Nevada started to organize Into one large cloud mass. This development can be seen In the infrared satellite Imagery in Figures 1 and 2. For 4 hr (1946 to 2346Z or 1146 to 1546 PST) the cloud mass continued to consolidate and grow in areal extent as cloud-top temperatures cooled. Based on these two characteristics, the southeastwardly moving storm system reached its maximum Intensity between OOOOZ and 0400Z on 11 August (1600 and 2000 PST, 10 August). As the storm moved southeastward Into central Arizona, It slowly dissipated, turned eastward, and became Indistinguishable as an lndlvldual thunderstorm system at the surface and aloft by approximately 0946Z (0146 PST, 11 August). Between 0946Z and 1446Z (0146 and 0646 PST) the remaining debris clouds moved eastward and evaporated quickly over extreme east-central Arizona. Consequently, the thunderstorm system remained an identifiable feature In the satel I lte Imagery for approximately 15 hr.
C. Area Affected
During Its I lfetime, this thunderstorm traveled approximately 500 km and affected an area of nearly 2 X 10 5 km 2 (see Figure 3). This area includes aiJ of southern Nevada, most of western Arizona, extreme southwestern Utah, and that part of Cal ifornla bordering the Colorado River val ley. Contained in this area are numerous Indian reservations, Grand Canyon National Park, the Lake Mead National Recreational Area, some national forests, several wlldl ife refuges, state parks, the Nevada Test Site CNTS), parts of the U.S. Air Force Gunnery Range in Nevada, the city of Las Vegas, and several smaller communities.
D. Demographics and Thunderstorms
The affected area contains a population of roughly one mil lion people (excluding Phoenix, Arizona, and adjacent suburbs; 1.5 mil I ion people). The largest city near the path of the storm was Las Vegas, Nevada, with a standard metropolitan statistical area population of nearly 500,000 people. The storm appears to have reached its maximum intensity over the sparsely populated areas of extreme northwestern Arizona and those parts of Nevada near the Colorado and VIrgin Rivers. Available data shows that the greatest damage to property occurred In the area from Moapa to Overton, Nevada (see Figure 3). Local flooding and wind-related damage occurred along much of the storm track.
People seeking new I lfe styles have been moving to the mild, dry climate of the desert southwest. For this and other reasons, the population of the southwestern U.S. has been increasing rapidly. For example, the total number of persons In Clark County, Nevada, Increased by 70% from 1970 to 1980. During the 50-year period from 1930 to 1980, the population of Clark County increased from 8500 people to nearly 500,000 people. This phenomenal population growth has
2

A MESOSCALE CONVECTIVE COMPLEX TYPE STORM OVER THE DESERT SOUTHWEST
Darry I Randerson Nuclear Support Office
National Weather Service
ABSTRACT. On 10 August 1981 a mesoscale convective complex CMCC) developed over extreme east-central Nevada and moved southsoutheastward Into northwestern Arizona. This storm affected a total area of nearly 200,000 km 2
, traveled approximately 500 km, and lasted nearly 15 hr. Strong surface winds, hall, heavy rain, and dense blowing dust and sand were reported on the right flank of the MCC. Estimated ralnfal I rates of 3 to 4 ln/hr produced total rainfal I amounts of 3 to 6 in over a large area to the northeast of Las Vegas, Nevada. lnte~rat!on of the isohyetal analysis showed that approximately 10 m3 (8 X 10 5 acre ft) of water was ava i I ab I e before in f i I trat 1 on. I n terms of the vo I ume of rain water produced, this storm was 30 times larger than the one that struck Las Vegas, Nevada, on 3 July, 1975. Severe flooding occurred, causing much property damage and loss of I ivestock in the Logandale/Glendale, Nevada, area. The MCC developed ahead of a southward moving short wave trough as the trough moved into an area of unstable moist air. MCC generation may have been enhanced by the presence of a developing east-west moisture gradient and by Intense surface heating. The heavy weather produced by the MCC was closely related to very cold (-65°C) cloud-top temperatures and to strong surface convergence.
I • I NTRODUCT I ON
A. Overview
Large cumulonimbus can develop over the desert southwest during the summertime. These storms can be accompanied by locally heavy rain, strong surface winds, and hall. Over desert areas, strong outflow winds from thunderstorms frequently cause dense blowing dust and/or sand that may limit horizontal vlslbll tty to less than 1 mile. ldso et al. (1972) reported that dust clouds generated by desert thunderstorms have been observed to extend upwar-d to near the 8,000-foot level above sea level. Such conditions are not only hazardous to aircraft operations but also to vehicles travel lng on the ground. These storms can produce and maintain mesoscale surface high (and low) pressure systems. Consequently, except for blowing dust, the surface weather features accompanying these storms are quite similar to those of severe thunderstorms commonly associated with the midwestern states.
Intense thunderstorms are not uncommon In the desert southwest and northwestern Mexico during the summer. Occurrences of Intense desert thunderstorms have been documented by Blake {1923), Reed (1937), Batley {1966), Hales (1975), Randerson (1976a), and others. Some of these thunderstorms appear to organize into mesoscale storm systems with cold ( ~-52°C) cloud tops and long duration times ( .2:.6 hr). Convectlvely driven weather systems of this type have

FIGURES- CONTINUED
Figure 20. Composite of hourly sate! I ite infrared temperature measurements for the period of the most intense surface weather conditions. The total precipitation analysis from Figure 19 is reproduced in the middle
Figure 21.
Figure 22.
Figure 23.
Figure 24.
Figure 25.
Table la.
Table lb.
Table 2.
Table 3.
for easy reference • • • • • • • • • • • • • • • • • . . . . . Geographical locations of key points of interest for the flooding produced by the heavy rainfal I generated by the MCC of 10 August 1981 •••••••••••••
fsohyetal analysis of the total precipitation pattern produced by the intense rainfal I from the MCC of
. . . .
10 August 1981. The background for this figure is that in Figure 21. Contours are In inches. Station letters correspond to the bucket survey site letters tabulated In Table 3 ••••••••••• . . . . . Comparative photographs of a damaged· (top) and undamaged (bottom) Spanish Dagger plant located in the area of large hail near Ute, Nevada (figure 21).
Infrared sate! I ite Imagery with MB enhancement for 0446Z, 11 August 1981, or 2046 PST, 10 August ••• . . . . . . Infrared sate! I ite imagery with MB enhancement for 0646Z, 11 August 1981, or 2246 PST, 10 August.
TABLES
Criteria for a Mesoscale Convective Complex (Maddox, 1980 ) • • • • • • • • • • • • • • • . . . . . . . . . Mesoscale Convective System criteria based upon the analysis of enhanced IR satef lite imagery (after Bartels et al., 1984) •••••••••••
The OOOOZ winds aloft from Desert Rock, NY CORA), elevation 3,298 ft MSL. The MCC cloud base Ts assumed to be at an altitude of 10,000 ft (3050 m) MSL. AI I elevations (H) are above mean sea level. The tropopause was located just below the 50,000-ft (15,240 m) level • • • • • • • • • •••••••
Bucket survey precipitation data for 10 August 1981.
vi
. . .
PAGE
36
37
38
39
42
43
PAGE
18
18
23
33

FIGURES - CONTINUED
PAGE
Figure 12. The 200-mb chart for OOOOZ, 11 August 1981 (1600 PST, 10 August). Height contours In meters are the solid I ines. The posi+lon of the MCC is portrayed by the sea! !oped area. The seal loped contour represents Tbb =-53.2° to -58.2°C, and the shaded area T bb =-59.2° to -62.2°C • • • • • • • • • • • • 22
Figure 13. Estimated hourly positions of the leading edge of the strong outflow winds from the MCC of
Figure 14.
Figure 15.
Figure 16.
Figure 17.
F lgure 18.
Figure 19.
10 August 1981. Times are in GMT; subtract 8 hrs to get PST . . . . . • • . • • • • . . • • . •
Plots of hourly and special reports of station pressure and extreme weather conditions at selected stations along the path of the MCC of 10 August 1981 . . . . . . . . . . . . . . The 1200Z (0400 PST) analysis of surface dew-point temperature (°F) for 10 August 1981. Surface data and the frontal position are both plotted In the standard format. . . . . . . . . . . . . • . . . . . The 1800Z (1000 PST) analysis of surface dew-point temperature (°F) for 10 August 1981. Surface data and the frontal position are both plotted In the standard format. . . . • . . • . . • • • • . . . . . The OOOOZ, 11 August 1981 (or 1600 PST, 10 August) analysis of surface dew-point temperature (°F). Surface data and tne frontal position are both plotted In the standard format. The leading edge of the outflow from the MCC Is also plotted In southern Nevada and northwestern Arizona ••••••••••
Composite of the time changes in the cloud-top temperatures (top) and radar echoes (bottom) along the track of the MCC. Total precipitation amounts In Inches are plotted for stations located along the storm track (top left margin>. The length scale represents distance east or west of the storm track for the locations of the precipitation data •••••
Analysis of the total precipitation In Inches for
.
.
.
10 August 1981 In the vicinity of the MCC. To convert from Inches to mil llmeters, multiply Inches by 25.4 ••
v
24
. . . . 25
. . . . 27
. . . . 28
29
32
. . . . 34

Figure 1.
Figure 2.
Figure 3.
Figure 4.
FIGURES
Infrared sate! I ite imagery with MB enhancement 194vZ (1146 PST>, 10 August 1981 . . . . . . . , . frared sate! I ite imagery with MB enhancement 204t~ (1246 PST), 10 August 1981 . . . . . . . Overview of significant surface weather that accompanied the mesoscale storm system of 10 August 1981 ••••••
for . . for . .
The 500-mb chart for 1200Z (0400 PST>, 10 August 1981. Height contours In 10's of meters are solid I ines and the relative vorticity field CX 1()6 s- 1 ) is portrayed by the dashed I ines. Data are plotted in the standard format. The map background is the same as that In alI the sate I I I te images • • • • • • • • ·
. . . .
. . . .
Figure 5. The 850-mb chart for 1200Z (0400 PST>, 10 August 1981.
Figure 6.
Figure 7.
Figure 8.
Figure 9.
Figure 10.
Figure 11.
Height contours in meters are sol ld I lnes and the dashed I lnes represent dew-point depression (°C). Data are plotted in the standard format. The map background is the same as that for alI the sate! lite images • • • • • • • • • • • • • • • • • • • • • • •
Skew T-log P diagram for Desert Rock, Nevada, CDRA) for 1200Z (0400 PST>, 10 August 1981 •••••••• . . . . . Skew T-log P diagram for Desert Rock, Nevada, CDRA> for OOOOZ, 11 August 1981, or 1600 PST, 10 August 1981
Infrared sate! lite Imagery with MB enhancement for 2346Z (1546 PST>, 10 August 1981 •••••••
Infrared sate! lite Imagery with MB enhancement for 0146Z, 11 August 1981, or 1746 PST, 10 August 1981
Graphical representation of the temporal change In the total area enclosed within three separate equivalent black body temperature (Tbb) regimes visible in the infrared sate! I ite images with MB
. . . . . .
enhancement •••••••••••••••• . . . . . . . The 850-mb chart for OOOOZ, 11 August 1981 (1600 PST, 10 August). Height contours in 10's of meters are solid I ines. Data are plotted In the standard format. The map background Is the same as that for a II the sate I I ite images. • • • • • • • • •
iv
PAGE
3
4
5
9
1 0
12
13
16
17
19
21

TABLE OF CONTENTS
Figures.
Tables •
Abstract •
I. lntroductic.)n.
II.
Ill.
Overview • The Thunderstorm • Area Affected.
A. B. c. D. Demographics and Thunderstorms •
Meteorological Analysis.
A. Charts •• B. 'Data • C. Pre-storm Condftions • D. Storm Development. E. Mature Stage • F. Upper-air Analyses • G. Surface Wind • H. Station Pressure • I. Surface Moisture. J. Surface Temperature. K. Sate! lite and Radar Data. L. Precipitation. M. Streamf I ow • N. Dissipation.
Conclusions. •
Acknowledgements •
References •
Appendix A. Air Route Traffic Control Radar Charts for 10 August 1981
Appendix B. Total Ralnfal I Amounts for 10 August 1981.
I i l
PAGE
iv
vi
1 2 2 2
6
6 6 8
14 15 20 23 26 26 30 31 33 40 41
41
46
47
50
54

This publication has been reviewed
and is approved for publication by
Scientific Services Division,
VJestern Region.
i i
~Ra~,C~ Scientific Services Division VJestern Region Headquarters Salt Lake City, Utah

NOAA Technical Memorandum NWS WR-196
A MESOSCALE CONVECTIVE COMPLEX TYPE STORM OVER THE DESERT SOUTHWEST
D11rryl Randerson
Nuclear Support Office National Weather Service Las Vegas, Nevada April 1986
UNITED STATES I National Oceanic and I National Weather DEPARTMENT DF COMMERCE Atmospheric Administration Serv1ce Malcolm Baldrige, Secretary John V. Byrne. Administrator Richard E. Hallgren. D1rector

NOAA Technical Memoranda NWS WR: (Continued)
121 Clinmtolngical Prediction of Cumulonimbus Clouds in the Vicinity of the Yucca Flat Weather Station. R. F. Quiring, June 19D. (PB-271-704/.~S) 122 A 1\ethoo for Transforming Temperature. Distribution to Normality. Morris S. Webb, Jr., June 1g77, (PB-271-742/AS) 124 Stotisticol Guidanco for Prediction of Eastern Nm·th Pacific Tropical Cyc:lone Motion - Part I. Charles J. Neumann and Preston W. Left1<ici1, August 1977.
(PB-272-661) 125 Stati sti ca 1 Guidance on the Prediction of Eastern North Pacific Tropical Cyclone Motion - Part I l. Preston w. Leftwich and Charles J. Neumann, August
1977. (PB-273-155/AS) 127 Development of a Probability Equation for Winter~ Type Precipitation Patt•lrns in Great Falls, Montana. Kenneth B. Mielke, Februan · !978. (PB-281-387 /AS) 128 Hand Calculator Program to Compute Parcel Thermal Dynamics. Dan Gudgel, April 1978. {PB-283-080/AS) 129 Fire Whirls. David w. Goens, May 1978. {PB-2B3-B66/AS)' 130 Flash-Flood Procedure. Ralph C. Hatch and Gerald Williams, May 1978. (PB-286-014/AS) 131 Automated Fire-weather Forecasts. Mark A. Mollner and David E. Olsen, September 1978. {PB-2B9-g16/AS) 132 Estimates of the Effects of Terrain Blocking on the Los Angeles WSR-74C weather Radar. R. G. Pappas, R. Y. Lee, B. w. Finke, October 1978. {PB289767/AS) 133 Spectral Techniques in Ocean Wave Forecasting. John A. Jannuzzi, October 1978. (PB291317/AS) 134 Solar Radiation. John A. Jannuzzi, November 1978. (PB29ll95/AS) 135 Application of a Spectrum Analyzer in Forecasting Ocean Swell in Southern California Coastal Waters. Lawrence P. Kierulff, January 1979. {PB292716/AS) 136 Basic Hydrologic Principles. Thomas L. Dietrich, January 1979. (PB292247/AS) 137 LFM 24-Hour Prediction of Eastern .Pacific Cyclones Refined by Satellite Images. John R. Zi11111erman and Charles P. Ruscha, Jr., Jan. 1979. (PB294324/AS) 138 A Simple Analysis/Diagnosis System for Real Time Evaluation of Vertical Motion. Scott Heflick and James R. Fors, February 1979. (PB294216/AS) 139 Aids for Forecasting Minimum Temperature in the Wenatchee Frost District. Robert S. Robinson, April 1979. (PB29B339/AS) 140 Influence of Cloudiness on Summertime Temperatures in the Eastern Washington Fire Weather District. James Holcomb, April 1979. (PB29B674/AS) 141 Comparison of LFM and MFM Precipitation Guidance for Nevada During Doreen. Christopher Hill, April 1979- (PB298613/AS) 142 The Useful ness of Data from Mountaintop Fire Lookout Stations in Determining Atmospheric Stability. Jonathan W. Corey, Apri 1 1979. (PB298899/AS) 143 The Depth of the Marine Layer at San Diego as Related to Subsequent Cool Season Precipitation Episodes in Arizona. Ira s. Brenner, May 1979.
(PB298817/AS) . 144 Arizona Cool Season Climatological Surface Wind and Pressure Gradient Study. Ira S- Brenner, May 1979. (PB298900/AS) 145 On the Use of Solar Radiation and Temperature Models to Estimate the Snap Bean Maturity Date in the Willamette Valley. Earl M. Bates, August 1979.
(PB80-160971) 146 The BART Experiment. Morris S. Webb, October 1979. (PB80-155112) !47 Oc.cutrence and Distribution Of Flash Floods in the Western Region. Thomas L. Dietrich, December 1979. (PBB0-160344) 149 ~1isinterpretations ot JJreclpitatiun ?robai.dlity f"atccv.sts. :'\11~~ !!. Mt.!!"'r,'hy, Sr~rnh Lir-htenstein. Uaruch Fischhoff, and Robert L. Winkler, February
1980. (PBB0-174576) 150 Annual Data and Verification Tabulation - Eastern and Central North Pacific Tropical Storms and Hurricanes 1979. Emil B. Gunther and Staff, EPHC,
,\pril 1980. (PB80-220486) 151 ~f<C Model Performance in the Northeast Pacific. James E. Overland, PMEL-ERL, April 19RO. {PBR0-196033) 152 ~limate of Salt Lake City, Utah. Wilbur E. Figgins, October 1984, 2nd Revision. (PB85 123875) 153 An Automatic Lightning Detection System in Northern California. James· E. Rea ahd Chris E. Fontana, June 1980. (PBB0-225592) 154 Regression Equation for the Peak Wind Gust 6 to 12 Hours in Advance at Great Falls During Strong Downslope Wind Storms. Michael J. Oard, July 1980.
(PBB1-108367) 155 A Raininess Index for the Arizona Monsoon- John H. TenHarkel, July 1980. {PB81-106494) 156 The Effects of Terrain Distribution on Summer Thunderstorm Activity at Reno, Nevada. Christopher Dean Ifill, July 1980. (PB81-102501) 157 An Operational Evaluation of the Scofield/Oliver Technique for Estimating Precipitation Rates from Satellite Imagery. Richard Ochoa, August 1980.
(PB81-108227) 15B Hydrology Practicum. Thomas Dietrich, September 1980. (PB81-134033) 159 Tropical Cyclone Effects on California. Arnold Court, October 1980. (PBB1-133779) 160 Eastern North Pacific Tropical Cyclone Occurrences During Intraseasonal Periods. Preston W. Leftwich and Gail M. Brown, February 1981. (PB81-205494) 161 Solar Radiation as a Sole Source of Energy for Photovoltaics in Las Vegas, Nevada, for July and December- Darryl Randerson, April 1981. (PB81-224503)
lf.? 1\ Systems Approach to Rct~l-Time Runoff Analysis with a Detenninistic Rainfall-Runoff Model. Robert J. C. Burnash and R. Larry rr'rr<~l, April J9Rl. i''''''l-n4~95)
163 A Crn11porison of Tt<o Methods for Fo1·ecasting Thunderstorms at Luke Air Force 8a<e, Arizona. Lt. Colonel Keith R. Cooley, April 1981. (P8P.1-2?.5393) 164 A" Objective Aid for Fo1·ecasting Afternoon Relative Humidity Along the Washington Cascade East Slopes. Robert S. Robinson, April 1981. (PRHI-2JI17H) 165 Annu~ I Data and Veri fi cati ~n Tabulation, E~stern North Pacifi ~ Tropical Storms and Hurricanes 1980. Emi 1 B. Gun1cher and Staff, flay J 981. ( P8R2-230336) 166 Prel1nnnary Est1mates of W1nd Power Potent1al at the Nevada Test Site. Howard G. Booth, June 1901. (PB82-!27036) 167 AllAr User's Guide. Mark Mathewson, July 1981. (revised September 1981). (PBR?.-191i7R3) 168 Forecasting the Onset of Coas ta 1 Gales Off Washington-Oregon. John R. Zimmerman and Wi 11 i am D. Burton, August 1981. ( PBB2-127051) 169 A Statistical-Dynamical Model for Prediction of Tropical Cyclone Motion in the Eastern North Pacific Ocean. Preston W. Leftwich, Jr., October 1981. 170 An Enhanced Plotter for Surface Airways Observations. Andrew .1. Spry and .lrffroy 1.. Anderson, October 1981. (Pr.R2-153RR3) 171 Verification of 72-Hour.SOO-mb Map-Type Predictions. R. F. Quirin~. November 1981. (PI~R2-·15ROQA) 172 Forecasting Heavy Snow at Wenatchee, Washington. James W. Holcomb, December 1981. (P~H2-177783)
173 Central San \Jo.:Jquin Valley Type Maps. Thorn(!::; R. Crossan, DecrmhP.r 1981. (PfHQ-lq60fi4} 174 ARAP Test Results. Marf A. Mathewson, Decembe•· \9R\. (PB82-193103) 175 .ll.nnual !">aLa anrl Ver~~ication Tahulation Eastr-rn ~lorth Pacific ·ropicn1 Stor111~. ancl HUJ~ricanP.s 1.9;11. Fmil ~ .. G.unt.her.,..'lnd Stflff, .1une 19R?..(PR82-2r,2420) 176 Approximations to thc> Peak Surface Wind Gusts from Desert Thunr1:~rstorms. Durryl f\andf.•r·son. Junt> 1.982. (PB82-2530R9) 177 Climate of Phoenix, l>rizona. Robert J. Schnidli, .~rril 1~6o ("evised M~rch 198.3). (PB83246801) 178 Annual Data and Verification Tabulation, Eastern North Pacific Tropical Storms and Hurricanes 1982. E B. C::unther, .June 1983. (PB85 10b078)
179 Stratified Maximum Temperature Relationships Between Sixteen Zone Stations in Arizona and Respective Key Stations. I-ra S. Brenner, June 1983
(PB83_24~.SI04) 180 Standard Hydrologic Exchange Format (SHEF) Version I. Phillip A. Pasteries, Vernon c. Bissel, David G. Bennett, August, 1983. (PB85 i06052) ' 181 Quantitative and Spacial Distribution of Winter Precipitatic.n Along Utah's Wasatch Front. Lawrence B. Dunn, Augu$t, 1983. (PB85 106912) 182 500 Millibar Sign Frequency Teleconnection r.harts - Hint:er. Lawrence B. Dunn~ December. 1983. 183 500 Millibar S~gn Frequency Te1ecoflnection Charts - Spring" La"'"t'ence B. Dunn, January, 1984. (PB85 111367)
184 Collection and Use of Lightning Strike Data in the Western U.S. During Summer 19R3. Glenn P.asch and Hark 1'fathewson, Februa-ry, 1984. (!'B85 11"r:;'"!~)
i~~ ~u~i1~;~:r a!~g~e~Ifi~:~~~n T~~~~~~~~~~i~~s~~t;o;t~u~~~fic LT~~~~~:l B St~~~' a~rt~r~~~~iles(PlB988~ .11~:9i • Gunther, Harch 1984. (PB85 109635)
187 500 ;.1; i 1 i bar Sign Frequency Teleconnection Charts - Fall. Lawrence B. Dunn, May 1984. (PB85 110930) 188 The Use and Interpretation of Isentropic Analyses. Jeffrey L. Anderson, October 1984. (PB85 132694) 189 Annual ~ata & Verification Tabulation Eastern North Pacific Tropical Stor~s and Hurricanes 1984. E. B. Gunther and R. L. Cross, April 1985. '(PB85 18788B7~~
190 Great Salt Lake Effect Snowfall: Some llotes and ~n example. ravid 1'. Carpenter, October 19B5.
191 Larqe Scale Patterns Associated with tla.ior Freeze Episodes in tr.e Aaricultural South«e<t.- Ronald S. ~ami.lton and Glenn R. Lussky, Decenber 1985. 192 NWR Voice Synthesis ?reject: Phase I. Glen t<_ Sampson, January 1936.
193 The MCC -An Overview and Case Study on It> Impact in the Western United States. Glenn R. Lussky, March 1986. 194 Annual Data and Verificat1on Tabulation Eastern North Pacific Tropical Storms and Hurricanes 1985. E. B. Gunther and R. L. Cross, March 1986. 195 Rad1d Interpretation Guidelines. Roger G. Pappas, March 1986.

NOAA SCIENTIFIC AND TECHNICAL PUBLICATIONS
The National Oceanic and Atmospheric Administratimi was established as part of the Department of Commerce on October 3, 1970. The mission responsibilities of NOAA arc to asses~ the socioeconomic impact of natural and technological changes in the environment and to monitor and predict the state of the solid Earth, the oceans and their living resources. the atmosphere. and the space environment of the Earth.
The major components of NOAA regularly produce various types of scientific and technical information in the following kinds of publications:
PROFESSIONAL PAPERS- Important definitive research results. major techniques, and special investigations.
CONTRACT AND GRANT REPORTS- Reports prepared by contractors or grantees under NOAA sponsorship.
ATLAS - Presentation of analyzed data generally in the form of maps showing distribution of rainfall. chemical and physical conditions of oceans and atmosphere, distribution of fishes and marine mammals, ionospheric conditions, etc.
TECHNICAL SERVICE PUBLICATIONS -Re-. ports containing data. observations, instructions, etc. A partial listing includes data serials; prediction and outlook periodicals; technical manuals, training papers, planning reports. and information serials; and miscellaneous technical publications.
TECHNICAL REPORTS- Journal quality with extensive details, mathematical developments, or data listings.
TECHNICAL MEMORANDUMS- Reports of preliminary, partial, or negative research or technology results, interim instructions, and the like.
Information on availability of NOAA publications can be obtained from:
ENVIRONMENTAL SCIENCE INFORMATION CENTER (D822) · ENVIRONMENTAL DATA AND INFORMATION SERVICE
NATIONAL OCEANIC AND ATMOSPHERIC ADMINISTRATION U.S. DEPARTMENT OF COMMERCE
6009 Executive Boulevard Rockville, MD 20852
; .~