a mechanistic assessment of nutrient flushing at the
TRANSCRIPT

Journal of Hydrology (2008) 358, 268–287
ava i lab le at www.sc iencedi rec t . com
journal homepage: www.elsevier .com/ locate / jhydro l
A mechanistic assessment of nutrient flushingat the catchment scale
Willem J. van Verseveld a,*, Jeffrey J. McDonnell a,b, Kate Lajtha c
a Oregon State University, Department of Forest Engineering, 204 Peavy Hall, Corvallis, OR 97331-5706, USAb Water Resources Section, Delft Technical University, Delft, The Netherlandsc Oregon State University, Department of Botany and Plant Pathology, 2070 Cordley Hall, Corvallis, OR 97331-2902, USA
Received 31 January 2008; received in revised form 25 May 2008; accepted 6 June 2008
00do
43
Ve
KEYWORDSNutrient flushing;Catchment;Dissolved organiccarbon;Dissolved organicnitrogen;Specific UV absorbance(SUVA);Fluorescence
22-1694/$ - see front mattei:10.1016/j.jhydrol.2008.06
* Corresponding author. Tel16.E-mail address: willem.vrseveld).
r ª 200.009
.: +1 54
anverse
Summary Quantifying nutrient flushing mechanisms at the catchment scale is essentialfor model development and prediction of land use change and climate change effectson surface water quality. To date, the description of nutrient flushing at the catchmentscale has been largely mechanistically weak. This paper mechanistically assesses theflushing mechanism of DOC, DON and DIN at the hillslope and catchment scale duringtwo storm events, in a small catchment (WS10), H.J. Andrews Experimental Forest inthe western Cascade Mountains of Oregon. Using a combination of natural tracer andhydrometric data, and end-member mixing analysis we were able to describe the exactflushing mechanism at the site. This mechanism involved vertical preferential flow tothe soil–bedrock interface and then lateral downslope flow, with a finite source of DOCand DON in the organic horizon. Both specific UV absorbance (SUVA, 254 nm) and contin-uously measured raw fluorescence measured with a fluorometer increased during thestorm events, suggesting DOC was more aromatic during stormflow compared to baseflowconditions. SUVA patterns in lateral subsurface flow from the hillslope and stream water incombination with hydrometric data enabled us to infer that the contribution of deep soilwater and groundwater was higher during the falling limb compared to the rising limb ofthe hydrograph and contributed to the dilution of DOC, DON and SUVA values during stormevents. Overall this study showed the value of using a combination of hydrometric data,natural tracer data, and in particular DOC quality indices such as SUVA and fluorescence tomechanistically assess nutrient flushing at the catchment scale.ª 2008 Elsevier B.V. All rights reserved.
8 Elsevier B.V. All rights reserved
1 737 4149; fax: +1 541 737
[email protected] (W.J. van
Introduction
The hydrological controls on nutrient flushing at the catch-ment scale are poorly understood (Weiler and McDonnell,
.

A mechanistic assessment of nutrient flushing at the catchment scale 269
2006). During storm events and snowmelt periods, manystudies have reported a significant increase in dissolved or-ganic nitrogen (DON), dissolved organic carbon (DOC) andnitrate (NO3-N), and attributed this increase to nutrientflushing (Creed et al., 1996; Boyer et al., 1997; McHale etal., 2002; McGlynn and McDonnell, 2003; Vanderbilt et al.,2003). Flushing of nutrients has been explained by (1) a ris-ing water table that intersects high nutrient concentrationsin the upper soil layer, (2) vertical transport of nutrients, bypreferential or matrix flow through the (deeper less bio-ac-tive) soil to the soil–bedrock interface and then laterallydownslope (Creed et al., 1996; Hill et al., 1999; Buttle etal., 2001), and (3) vertical transport of nutrients and thenlaterally within the soil profile (Gaskin et al., 1989). Whenthese conceptual models are applied to the timescale ofstorm events (days) an infinite supply of nutrients is oftenassumed (Bishop et al., 2004; Weiler and McDonnell,2006); although not many hydro-biogeochemical studies todate have tested this explicitly.
A mechanistic understanding of nutrient flushing is essen-tial for model development for the prediction of land usechange and climate change effects on surface water quality.Understanding the flushing mechanism during storm eventsis important, since stormflow contributes substantially tototal DOC and nitrogen (N) export (Hinton et al., 1997; Ber-nal et al., 2005). Despite the many studies on nutrient flush-ing, the exact flushing mechanism remains mechanisticallyweak. For instance, while McGlynn and McDonnell (2003)found that the relative timing of riparian and hillslopesource contributions to stream water explained streamDOC patterns, they could not determine what flushingmechanism at the hillslope occurred (i.e. if it was flushingmechanism 1, 2, or 3).
While patterns of DOC in shallow pore waters and instream water provide evidence that the shallow soil is a pri-mary source of high DOC concentrations to the stream (e.g.,Boyer et al., 1997), we frequently do not know how thesesources are hydrologically connected to the stream. Bishopet al. (2004) illustrated the importance of hydrological con-nectedness. They were able to identify the small riparianarea as the only contributor to elevated stream DOC con-centrations in a Swedish catchment during storm events,through a combination of hydrometric data and soil waterDOC concentrations.
So how might we mechanistically asses flushing of nutri-ents? We know there are three possible flushing mechanismswith or without an infinite source of nutrients during stormsthat we can test as hypotheses in line with recommenda-tions of Hooper (2001). Assessing sources of stream wateris an initial step to reject one or more of these hypotheses.Bonell (1998) recommended that conclusions regarding thesources of stream water drawn from runoff hydrochemistrydata at the hillslope and catchment scale should be sup-ported by independent hydrometric data. End-member mix-ing analysis (EMMA) can be used as a hydro-chemicaltechnique to resolve possible sources of channel stormflow.Numerous studies (Mulholland and Hill, 1997; Hagedorn etal., 2000; McHale et al., 2002; Inamdar and Mitchell,2006; Bernal et al., 2006) have used this technique to inves-tigate sources of and even biogeochemical controls on DOCand N. In addition to EMMA and hydrometric techniques, thechemical character of dissolved organic matter (DOM)
(DOC:DON, specific UV absorbance (SUVA), fluorescencespectroscopy) can provide information to help elucidatesources of DOM at seasonal scales (McKnight et al., 1997;Hood et al.,2003, 2005) and during storms at the catchmentscale (Hagedorn et al., 2000; Katsuyama and Ohte, 2002;Hood et al., 2006).
Measurements of matric potential at different depths inthe soil may also provide critical information to enablerejection of one or more of the flushing mechanism hypoth-eses. In catchments with steep hillslopes, flushing mecha-nism 3, (vertical transport of nutrients and then lateralmovement within the soil profile) may occur. Vertical andlateral flow vectors have been studied through detailed fieldexperiments (Harr, 1977; Torres et al., 1998; Retter et al.,2006) and modeling studies (McCord et al., 1991; Jackson,1992) with often contradicting results about the relativeimportance of lateral flow within the soil profile ofhillslopes.
While several studies have identified the forest floor andupper soil layer as an important source of elevated DOC andN concentrations in stream water during storm events,whether this source is finite or infinite remains poorlyunderstood. Concentrations of soluble nutrients (DOC,DON and inorganic N) may rise at the beginning of stormevents or after prolonged dry periods for several reasons,and these have not been well differentiated. DOC andDON are produced in soils either from incomplete decompo-sition and mineralization or else via desorption of solublenutrients (Kaiser and Zech, 1998; Kalbitz et al., 2000; Quallsand Richardson, 2003). Decomposition of soil organic matteroccurs between storm events or during dry seasons, but thesoluble products of decomposition are not removed untilstorms move water through the soil, causing stream concen-trations to rise due to desorption and flushing. During condi-tions of high hydrologic flux, or when decomposition oforganic matter is limited by temperature, flushing may ex-ceed the production of soluble nutrients, and thus the sup-ply of soluble nutrients from soils will decrease, resulting ina finite source of nutrients. When the supply of nutrientsdoes not change during conditions of high hydrological fluxthe source of nutrients is infinite. The few studies that havefocused on DOC concentrations in the upper soil profile dur-ing storm events concluded that DOC was an infinite source(Jardine et al., 1990; McGlynn and McDonnell, 2003). A syn-thesis of 42 studies that have focused on DOC and DON con-centrations in the upper soil layer at coarser time scales intemperate forests (Michalzik et al., 2001) concluded thatthere was no dilution effect of precipitation for both DOCand DON concentrations, indicating an infinite source ofDOM from the organic layer. In contrast Boyer et al.(1997) observed that DOC concentrations in shallow lysime-ters decreased rapidly during the snowmelt season in an al-pine catchment. This suggests that at their site DOC was afinite source at the time scale of about 4 months. Thus, de-tailed temporal measurements of nutrient concentrations inthe organic horizon and shallow soil layer during stormevents are essential to quantify whether DOC and N are a fi-nite or infinite source during flushing of these solutes.
This study examines two storm events (December 2004and May 2005 storm event) using a combination of continu-ous fluorescence measurements at the hillslope and catch-ment scale, hydrometric data and chemical measurements
270 W.J. van Verseveld et al.
of soil water, groundwater, lateral subsurface flow andstream water to test the three flushing mechanism hypoth-eses. We address the following questions: (1) What is the lagtime between start of rainfall and lateral subsurface flow,stream flow and internal hillslope hydrometric data, andpeak time between start of rainfall and peak discharge oflateral subsurface flow and stream flow? (2) What is theDOC and N flushing pattern at the hillslope and catchmentscale? (3) What sources of lateral subsurface flow andstream water can we identify with end-member mixing anal-ysis? (4) Can hydrometric data be used to validate the end-member mixing analysis? (5) How do water and nutrient flowdirections in the unsaturated zone shift through an event?(5) What pattern of DOC and N concentrations in the organichorizon, soil and groundwater do we observe?
Site description
This study was conducted in Watershed 10 (WS10), a 10.2 haheadwater catchment located on the western boundary ofthe H.J. Andrews Experimental Forest (HJA), in the wes-tern-central Cascade Mountains of Oregon, USA (44.2�N,122.25�W) (Fig. 1). HJA has a Mediterranean climate, withwet mild winters and dry summers. Average annual rainfallis 2220 mm of which about 80% falls between October andApril during storms characterized by long duration and lowrainfall intensity. Light snow accumulations in WS10 arecommon but seldom exceed 30 cm, and generally melt with-in 2 weeks (Sollins et al., 1981). Elevations range from470 m at the watershed flume to a maximum watershed
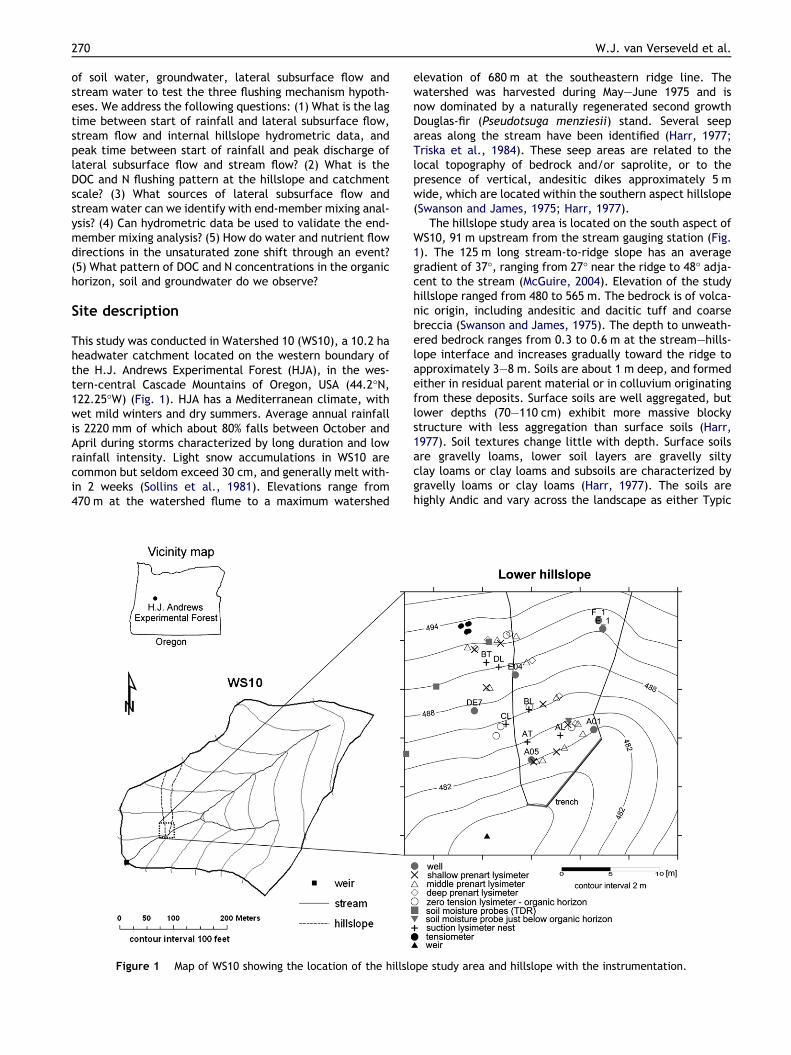
Figure 1 Map of WS10 showing the location of the hillslo
elevation of 680 m at the southeastern ridge line. Thewatershed was harvested during May–June 1975 and isnow dominated by a naturally regenerated second growthDouglas-fir (Pseudotsuga menziesii) stand. Several seepareas along the stream have been identified (Harr, 1977;Triska et al., 1984). These seep areas are related to thelocal topography of bedrock and/or saprolite, or to thepresence of vertical, andesitic dikes approximately 5 mwide, which are located within the southern aspect hillslope(Swanson and James, 1975; Harr, 1977).
The hillslope study area is located on the south aspect ofWS10, 91 m upstream from the stream gauging station (Fig.1). The 125 m long stream-to-ridge slope has an averagegradient of 37�, ranging from 27� near the ridge to 48� adja-cent to the stream (McGuire, 2004). Elevation of the studyhillslope ranged from 480 to 565 m. The bedrock is of volca-nic origin, including andesitic and dacitic tuff and coarsebreccia (Swanson and James, 1975). The depth to unweath-ered bedrock ranges from 0.3 to 0.6 m at the stream–hills-lope interface and increases gradually toward the ridge toapproximately 3–8 m. Soils are about 1 m deep, and formedeither in residual parent material or in colluvium originatingfrom these deposits. Surface soils are well aggregated, butlower depths (70–110 cm) exhibit more massive blockystructure with less aggregation than surface soils (Harr,1977). Soil textures change little with depth. Surface soilsare gravelly loams, lower soil layers are gravelly siltyclay loams or clay loams and subsoils are characterized bygravelly loams or clay loams (Harr, 1977). The soils arehighly Andic and vary across the landscape as either Typic
pe study area and hillslope with the instrumentation.

A mechanistic assessment of nutrient flushing at the catchment scale 271
Hapludands or as Andic Dystrudepts (Yano et al., 2005), andare underlain by 1–8 m relatively low permeability subsoil(saprolite), which formed in the highly weathered coarsebreccia (Ranken, 1974; Sollins et al., 1981).
Benchmark hydrological studies (Harr, 1977; Ranken,1974) were conducted at this site during the 1970s andthe site was re-established by McGuire (2004) in 2002. Aspart of these 1970s studies, a total of 450 soil cores from11 soil pits were collected at depths of 10, 30, 70 and110 cm in the soil and 130, 150 and 250 cm in subsoil. Thesesoil cores were analyzed for hydraulic conductivity, poros-ity, pore-size distribution, bulk density, soil moisture–ten-sion relationships and stone-content (Ranken, 1974; Harr,1977).
Methods
Instrumentation
To measure lateral subsurface flow at a natural seepageface a 10 m long trench was constructed (McGuire et al.,2007). Intercepted subsurface water was routed to a cali-brated 30� V-notch weir that recorded stage at 10-min timeintervals using a 1-mm resolution capacitance water levelrecorder (TruTrack Inc., model WT-HR). Rainfall was mea-sured with a tipping bucket and storage gauge located in asmall canopy opening on the hillslope. The drainage areaof the hillslope was delineated topographically from a totalstation survey of the entire hillslope (0.17 ha) and verifiedby a water balance calculation (McGuire et al., 2007). Weused a rounded value of 0.2 ha in all analyses. As part ofthe long term monitoring at the H.J. Andrews ExperimentalForest, watershed discharge of WS10 has been measuredwith a trapezoidal flume since 1973. Since 1997 a V-notchweir has been used during the summer. Stage was measuredwith a Model 2 Stevens Instruments Position Analog Trans-mitter (PAT) (0.3 mm resolution).
We instrumented the gauged hillslope with four nests ofporous cup suction lysimeters (Soil Moisture EquipmentCorp., Model 1900, 2 bar) at 30, 70 and 110 cm depths, ex-cept for site AL, where the deepest lysimeter was installedat 80 cm depth (depth of bedrock) (Fig. 1). These suctionlysimeters were installed in addition to four nests that werealready installed (McGuire, 2004). Six plastic zero tensionlysimeters were installed below the organic layer, withthree measuring 10 · 10 cm installed at 20 cm depth, andtwo measuring 15 · 15 cm installed at 40 cm depth (Fig.1). Twenty seven Prenart superquartz tension lysimeters(Prenart Equipment ApS, 0.5 bar) were installed at 20,30–40 and 70–110 cm at a 30� angle according to the meth-od described by Lajtha et al. (1999).
Transient saturation was measured with 69 maximumcork rise wells (3.18 cm diameter), and were screened forthe lower 25 cm, the maximum water height observed byHarr (1977). We equipped three wells that showed consis-tent transient saturation and one well in the seepage area(A01) with 1-mm resolution capacitance water level record-ers (TruTrack Inc., model WT-HR). We sampled with onewell deep groundwater (A01 in the seepage area) and withfour wells transient groundwater (Fig. 1) prior to, during,and after the December 2004 and May 2005 storm events
and at three weekly intervals between the two stormevents. All the wells were installed until refusal by a handauger.
Soil water content (h) was measured with water contentreflectometers (WCR) (CS615, Campbell Scientific Inc.). Thesoil moisture probes were installed horizontally (i.e., withthe slope) at three depths (30, 70 and 100 cm) in three soilpits in the lower portion of the hillslope. The nests were lo-cated 15, 20 and 25 m from the slope base (McGuire, 2004).
Soil matric potential was measured by seven fastresponding tensiometers (type: UMS T4, 1 bar porous cups),that were installed vertically in a triangle pattern, threetensiometers at 30 depth, three tensiometers at 70 cmdepth and one tensiometer at 100 cm depth. The tensiome-ter triangle was located 25 m upslope from the base of thehillslope. We installed the tensiometers close to each otherin a triangle to calculate unsaturated flow directions with-out bias of an elevation gradient. This enabled us to inves-tigate the possible occurrence of an unsaturated lateralflow component during storms. Saturation was defined aspore pressure P0.25 kPa.
Flow direction analysis
A plane was fitted through the total head values for eachtimestep at tensiometer locations at 30 cm depth and70 cm depth, respectively. The direction of the lateral gra-dient was defined as the gradient parallel to the soil surface(46�) at the tensiometer triangle. The normal vectors tothese planes defined the size of the lateral gradient at eachdepth. The direction of the vertical gradient was defined asnormal to the soil surface. The vertical gradient betweenplanes at 30 and 70 cm depth was calculated as the averageof the gradients at the three tensiometer locations. The ver-tical gradient at 70 cm depth was calculated at the tensiom-eter location with three tensiometers at depths 30, 70 and100 cm. The resultant flow direction from the lateral andvertical flow gradient was expressed as the deviation fromthe true vertical flow direction (Fig. 2).
Sampling
Throughfall, lateral subsurface flow, deep and transientgroundwater, WS10 stream water and soil water (zero ten-sion and tension) samples were collected prior to, during,and after the December 2004 and May 2005 storm eventsand at three weekly intervals between the two stormevents. Throughfall was captured using the technique ofKeim and Skaugset (2004). Tension lysimeters were evacu-ated to �50 kPa and allowed to collect water for 24 h. Weused samples from porous cup tension lysimeters for theanalysis of sulfate (SO2�
4 ) and chloride (Cl�), and samplesfrom superquartz tension lysimeters for the analysis ofDOC, TDN, NO3-N, ammonium (NH4-N) and UV absorbanceat 254 nm (UV254). All water samples except porous cuplysimeter samples were analyzed for DOC, TDN, NO3-N,NH4-N and UV254. A subset of all water samples was analyzedfor SO2�
4 and Cl�. The gauged hillslope and watershed outletwere both sampled with 3700C Compact Portable Samplerswith 24 polyethylene 500 ml bottles (Teledyne Isco) whichallowed automatic collection of water samples, between 1

Figure 2 Schematic overview of gradients; ls and vn are thelateral (parallel to the slope) and vertical gradient (normal toslope), respectively, r is the resultant gradient of ls and vn, andv is the vertical. The flow direction deviation from the verticalis a.
272 W.J. van Verseveld et al.
and 4 h intervals during the two storm events. Fluorescencein the field at the gauged hillslope and watershed outletwere measured continuously at a 5 s interval during thetwo storm events using a field fluorometer (10-AU, TurnerDesigns Inc., Sunnyvale, CA) with a CDOM optical kit (P/N10-303, Turner Designs Inc., Sunnyvale, CA) that measuredwithin the 310–390 nm excitation and 410–600 nm emissionwavelength spectrum.
Chemical analysis
DOC and TDN were measured with Pt-catalyzed high-tem-perature combustion (Shimadzu TOC-V CSH analyzer withTN unit). Nitrate-N was measured with the hydrazine sulfatereduction method and NHþ4 -N was determined by the Berth-elot reaction method with a an Orion Scientific AC 100 con-tinuous flow auto-analyzer (Westco Scientific InstrumentsInc., Danbury, CT). DON was calculated as the differencebetween TDN and DIN (NO3-N and NH4-N). Because DONwas calculated by difference, values sometimes fell slightlybelow 0 mg l�1. When negative DON values were smallerthan 5% of TDN these values were considered to be 0 mg l�1.When calculated negative DON values were larger than 5% ofTDN we measured TDN and DIN again if sample volume per-mitted. If negative DON values remained larger than 5%after re-measurement DON and DIN were not used for fur-ther analysis. SO2�
4 and Cl� were measured using a DionexModel DX 500 Ion Chromatograph. UV absorbance (UV254)was measured at 254 nm with a Hitachi V-2001 spectropho-tometer. SUVA is UV254 normalized by DOC concentration.
End-member mixing analysis (EMMA)We performed EMMA (Christopherson and Hooper, 1992;Burns et al., 2001; McHale et al., 2002; James and Roulet,2006; Inamdar and Mitchell, 2006) to identify end-membersof stream and lateral subsurface water during two storm
events. The following solutes were used in EMMA: DOC,UV254, Cl� and SO2�
4 . EMMA relies on the assumption thatmixing of end-members is a linear process, and thus solutesused in EMMA should behave conservatively and end-mem-bers should have time invariant compositions. We recognizethat DOC and UV254 may behave non-conservatively. How-ever, several studies have used DOC to identify expressionof the organic horizon or shallow soil water in stream water(Brown et al., 1999; Inamdar and Mitchell, 2006; James andRoulet, 2006). In addition, Cl� and SO2�
4 are considered qua-si-conservative; Cl� can sorb onto soils and be stored inplants by plant-uptake and SO2�
4 can undergo significant bio-logical transformations (Swank et al., 1984). While Cl� maybehave quasi conservatively, the average Cl� concentrationof precipitation was 1.29 mg l�1 during the period 1990–2003 (PRIMET station, HJA), which is in the high range ofCl� wet deposition in USA (NADP), and probably behavedrelatively more conservatively in comparison to sites withlower Cl� wet deposition values (<0.1 mg l�1). Because thesolutes used in EMMA may behave non- to quasi-conserva-tively, we used EMMA as an investigative tool to identifypossible end-members for lateral subsurface flow andstream water.
Lateral subsurface flow and stream water concentrationsof the four solutes were standardized by the mean value forthe event. MATLAB was used to calculate the correlationmatrix and to perform a principal component analysisresulting in the eigenvectors of the correlation matrix. Lat-eral subsurface flow and stream water samples were pro-jected into the U space by multiplying the first twoeigenvectors (U1 and U2) which implies a three componentmixing model, with the standardized values. Median stan-dardized values of potential end-members were projectedin the U space in the same manner as the lateral subsurfaceflow and stream water samples. How well potential end-members bounded the observed lateral subsurface flowand stream water samples was investigated in the U mixingspace. Potential end-members included throughfall water,organic horizon water, shallow and deep soil water, tran-sient groundwater (well E04) and deep groundwater (grabsamples of lateral subsurface flow and stream water priorto the storm event during baseflow conditions). End-mem-bers were selected based on the following criteria: for allstorm events lateral subsurface flow and stream samplescould be explained by more than one combination of threeend-members; we did choose end-members combinationsthat were as similar as possible for stream water and lateralsubsurface flow during individual storm events and boundedthe solute space most complete. After selecting the end-members we used the EMMA model to calculate the contri-bution of each end-member to each sample during the twostorm events for lateral subsurface flow and stream water,by solving the mass balance equations described by Burns etal. (2001, Eqs. (4)–(6)).
We evaluated the EMMA model by comparing EMMApredicted solute concentrations against measured con-centrations and by comparing calculated end-membercontributions to hydrometric data. We calculated Pearsoncorrelation coefficients (r) between hydrometric data andEMMA derived contributions and squared Pearson correla-tion coefficient (R2) between EMMA predicted solute con-centrations and measured concentrations. We calculated

A mechanistic assessment of nutrient flushing at the catchment scale 273
also p values to test if these correlations were significantlydifferent from zero which we defined at p < 0.05.
Results
Hydrological dynamics
Thephysical hydrological dynamics of theDecember 2004 andMay 2005 storm events were evaluated through calculation oftime lags of soil moisture, soil matric potential, deep (wellA01) and transient groundwater, lateral subsurface flow andstream flow to the start of rainfall (Table 1 and Fig. 3) andtime to peak of streamwater and lateral subsurfaceflow fromthe start of rainfall (Fig. 3). During the December 2004 stormevent responses of shallow soil moisture, shallow soil matricpotential and lateral subsurface flow and stream flow to rain-fall were similar and lagged rainfall by 8–12 h, except for the30 cm soil moisture probe at the middle slope location thatlagged rainfall by 17.8 h (Table 1). The soil moisture responseat deep soil profile position and 122 cm (well E04) lagged rain-fall by 15.7–25.7 h. The 15.7 h lag time is from the upper soilmoisture probe location on the hillslope and precedes the soilmoisture probe response at 70 cm by 1.7 h. While this mayindicate preferential flow, the overall soil moisture responseat 70 cm preceded the soil moisture response at 100 cm.Transient groundwater response in wells DE7 at 215.5 cmdepth and A05 at 40.5 cm depth, lagged rainfall by 48.2 and51.8 h, respectively.
During the May 2005 event, responses of deep groundwa-ter, shallow soil moisture, shallow soil matric potential andlateral subsurface and stream flow to rainfall were similar
Table 1 Hydrological response timing to rainfall of December 20
Site Ti
De
Soil moisture lower soil pit (30 cm) 8Soil moisture lower soil pit (70 cm) 14Soil moisture lower soil pit (100 cm) 17Soil moisture middle soil pit (30 cm) 11Soil moisture middle soil pit (70 cm) 17Soil moisture middle soil pit (100 cm) 15Soil moisture upper soil pit (30 cm) 17Soil moisture upper soil pit (70 cm) 24Soil moisture upper soil pit (100 cm) 25Tensiometer (30 cm) 9Tensiometer (70 cm) 16Tensiometer (100 cm) 19Groundwater (well E04) 19Groundwater (well DE07) 51Groundwater (well A05) 48Groundwater (well A01) 11Lateral subsurface flow 9WS10 outlet 9
Antecedent wetness conditionsAMI7 and AMI14 (m3/m3) 0API7 (mm) 24API14 (mm) 66
and lagged rainfall by 45–48 h, except for the shallow soilmoisture probe and tensiometers at the upper slope loca-tion that lagged rainfall by 31–33 h (Table 1). Deeper soilmoisture and matric potential responded to rainfall by 45and 63 h. Transient groundwater height observations werenot available because sampling of wells during the storm af-fected the groundwater hydrographs to a large extent.
The faster response of stream water and lateral subsur-face flow to rainfall for the December 2004 storm eventcompared to the May 2005 storm event was also reflectedin the time to peak of stream water and lateral subsurfaceflow from the start of rainfall and peak flows during thetwo storm events. While the time to peak was 56 and 62 hfor the December 2004 storm event for lateral subsurfaceflow and stream water, respectively, the time to peak forthe May 2005 storm event was 118 and 117 h for lateral sub-surface flow and stream water, respectively. In additionpeak flows were higher during the December 2004 stormevent compared to the May 2005 storm event (Fig. 3). Ante-cedent wetness conditions expressed as average soil mois-ture (from the lower soil pit) prior to the two events over7 days (AMI7) and 14 days (AMI14) was 0.28 for the December2004 and May 2005 storm event. Furthermore, total precip-itation prior to the storm events over 7 days (API7) and 14(API14) days were higher for the May 2005 storm event com-pared to the December 2004 storm event (Table 1). Grossprecipitation was 200 and 100 mm and mean rainfall inten-sity was 1.5 and 0.5 mm h�1 for the December 2004 and May2005 storm event, respectively, indicating that the differ-ence in stream and lateral subsurface flow response be-tween the two events was largely controlled by rainfallamount and intensity.
04 and May 2005 storms events
me lag from start rainfall event (h)
cember storm 2004 May storm 2005
.33 45.1745.83
.83 49.83
.33 33
.33 49
.67 52.67
.83 47.83
.5 58.17
.67 62.17
.33 31.67
.33 52.67
.67 58.33–
.83 –
.17 –
.83 44
.67 45.17
.5 44.67
.28 0.285280

Figure 3 Hydrological dynamics during the December 2004 and May 2005 storm event.
274 W.J. van Verseveld et al.
DOC and N flushing pattern at the hillslope andcatchment scale
DOC concentrations in lateral subsurface flow during theDecember 2004 storm event showed a dilution pattern, witha maximum concentration of 4.18 mg l�1 (Fig. 4a). DONshowed maximum concentrations on the rising limb of thestorm with a 1.8 times increase during the rising limb of
the hydrograph. DIN concentrations during the storm did in-crease with maximum concentrations around the hydro-graph peak. SUVA and raw fluorescence increased 2.4 and1.8 times, respectively, on the rising limb during the stormevent. DOC, SUVA, raw fluorescence and DON all showed aclockwise hysteresis pattern; higher DOC and DON concen-trations and SUVA, and raw fluorescence values on the risinglimb compared to the falling limb of the hydrograph. The

Figure 4 SUVA, raw fluorescence, DOC, DON and DIN concentrations in stream water and lateral subsurface flow, during (a) theDecember 2004 and, (b) May 2005 storm event.
A mechanistic assessment of nutrient flushing at the catchment scale 275
flushing pattern (clockwise hysteresis pattern) of DON wasnot clear because of high variability of DON concentrations.
DOC concentrations in stream water increased 1.2 timesand DON concentrations increased 1.7 on the rising limb ofthe December storm event (Fig. 4a). Highest DIN concentra-
tions were found during the last hydrograph peak of thestorm. SUVA and raw fluorescence increased both 1.5 times,during the rising limb of the storm. DOC, SUVA, raw fluores-cence and DON all showed a clockwise hysteresis pattern.For lateral subsurface flow, the flushing pattern (clockwise

276 W.J. van Verseveld et al.
hysteresis pattern) of DON was not clear because of highvariability of DON concentrations.
During the May storm both lateral subsurface flow andstream water showed a DOC, SUVA, raw fluorescence andDON clockwise hysteresis pattern (Fig. 4b). Stream DOCand subsurface flow DOC increased 1.5 and 1.2 times,respectively. DON in stream and subsurface flow waterdid not show a clear flushing pattern (clockwise hysteresispattern) because of high variability in DON concentrationsduring the storm. DON concentrations on the rising limb ofthe storm hydrograph increased by 11.7 and 25.8 times,respectively. DIN concentrations in stream water werehighly variable and increased from 0.021 to 0.039 mg l�1
on the rising limb of the storm. DIN concentrations in lat-eral subsurface flow, were also highly variable and showed(after the first high DIN (0.0628 mg l�1) sample) an in-crease from 0.0076 to 0.0198 mg l�1 on the rising limb.SUVA and raw fluorescence values in stream water in-creased 2.3 and 2.4 times, respectively, on the rising limbof the storm. SUVA and raw fluorescence in lateral subsur-face flow increased on the rising limb of the storm 4.4 and2.8 times, respectively.
Runoff sources of lateral subsurface flow andstream water
We used end-member mixing analysis (EMMA) to evaluatethe contribution of runoff components to lateral subsurfaceflow and stream water during the December 2004 and May
Figure 5 EMMA for (a) stream water during the December 2004 stostorm event, (c) stream water during the May 2005 storm event anMedians and the 25th and 75th percentiles of each possible end-meend-members outside the graph range. Note differences in scale be
2005 storm. The principal component analysis we used forEMMA indicated that between 78% and 95% of the variabilityin lateral subsurface flow and stream water during theDecember and May storm could be explained by two princi-pal components. This indicates that variation in lateral sub-surface flow and stream water could be accounted for bythree end-members.
Lateral subsurface flow water during the December stormevent was bounded by the three end-members: deep ground-water, throughfall and organic horizon water (Fig. 5b). Theproportion of organic horizon water was higher on the risinglimb of the hydrograph compared to the falling limb of thehydrograph, while on the falling limb of the hydrograph theproportion of throughfall water increased (Fig. 6). Streamwater during the December storm event was bounded bythree end-members: deep groundwater, throughfall andorganic horizon water (Fig. 5a). During the storm the maxi-mum proportion of througfall was 49% during the fallinglimb of the hydrograph, while the maximum proportion oforganic horizon water was 36% during the rising limb of thehydrograph.
Lateral subsurface flow during the May storms wasbounded by deep groundwater, throughfall and transientgroundwater end-members (Fig. 5d). Deep soil water pro-jected close to the end-member throughfall in the lateralsubsurface flow U-mixing space. Maximum contribution(54%) to runoff by transient groundwater was found onthe rising limb of the hydrograph. Throughfall contributionto runoff increased during the storm with highest values
rm event, (b) lateral subsurface flow during the December 2004d (d) lateral subsurface flow during the May 2005 storm event.mber are plotted. U1 and U2 median coordinates are given fortween graphs.

Figure 6 End-member derived contributions during the December 2004 and May 2005 storm events.
A mechanistic assessment of nutrient flushing at the catchment scale 277
(46%) at the hydrograph peak. Stream water during theMay storm was bounded by the end-members throughfall,shallow soil water and transient groundwater (Fig. 5c).As in the lateral subsurface flow mixing U-space, deep soilwater and throughfall projected close to each other in thestream water mixing U-space. The end-member organichorizon was projected in the same positive U-mixing spaceas shallow soil water, however organic horizon did notbound the solutes as completely as shallow soil water.Shallow and throughfall water contributions to runoff var-ied the most during the storm (compared to transientgroundwater contributions), with higher contributions ofshallow soil water than throughfall during the rising limb
Table 2 Squared Pearson correlation coefficients (R2) betweenconcentrations for stream water and lateral subsurface flow duringall R2)
December 2004 event
Stream water Lateral subsurface flow
Cl 0.89 0.92SO2�
4 0.87 0.66DOC 0.92 0.80UV254 0.89 0.72
and a reversed pattern during the falling limb of the hyd-rograph (Fig. 6).
Validating EMMA
We validated the EMMA by calculating squared Pearsoncorrelation coefficient (R2) between predicted solute con-centrations and measured concentrations. For both stormevents R2 ranged between 0.66–0.99 and 0.47–0.92 forlateral subsurface flow and stream water, respectively(Table 2). This indicates that the EMMA model was a mod-erate to strong predictor of lateral subsurface flow andstream water solute concentrations.
EMMA predicted solute concentrations and measured solutethe December 2004 and May 2005 storm events (p < 0.001 for
May 2005 event
Stream water Lateral subsurface flow
0.47 0.970.67 0.920.58 0.910.60 0.99

278 W.J. van Verseveld et al.
To further evaluate the EMMA derived contributions ofend-members for stream and lateral subsurface flow waterwe compared these contributions to hydrometric measure-ments (Fig. 7) at the hillslope study area. The Pearson cor-
Figure 7 Comparison of EMMA derived contributions with hydrom
relation coefficient between water height in well A01 andEMMA derived deep groundwater contribution to subsurfacelateral flow was �0.90 (p < 0.001) during the Decemberevent and �0.92 (p < 0.001) during the May event. Further-
etric data for (a) stream water and (b) lateral subsurface flow.

Figure 8 Flow direction at 30 and 70 cm depth during (a) theDecember storm event and (b) during the May storm event.
A mechanistic assessment of nutrient flushing at the catchment scale 279
more, the timing of EMMA derived deep groundwater contri-butions were in close agreement with the measured waterheight in well A01 (Fig. 7b). The Pearson correlation(r = 0.52, p < 0.01) for the organic horizon EMMA derivedcontribution to lateral subsurface flow and soil moisturemeasured at this soil profile position for the Decemberevent was smaller than the Pearson correlation for deepgroundwater. The organic horizon EMMA derived contribu-tion was likely overestimated at the start of the event, sincethe EMMA derived contribution was much higher than thesoil moisture contribution (Fig. 7b).
Soil matric potential at 100 cm depth located 5 m ups-lope from well E04 was used as a proxy for transient ground-water in well E04 during the May 2005 storm event, becausethe transient groundwater hydrograph was affected by sam-pling during this event. The Pearson correlation coefficientof EMMA derived deep groundwater to stream water duringthe December event was �0.58 (p < 0.01) and the timing ofEMMA derived deep groundwater was in general agreementwith the water height in well A01 (Fig. 7a). For the Mayevent, the Pearson correlation between transient ground-water EMMA derived contribution to lateral subsurface flowand soil matric potential at the deep soil profile position was0.52 (p < 0.01). The Pearson correlation coefficient of or-ganic horizon was low (r = 0.36) for stream water duringthe December 2004 event with a p < 0.1 and not significant;during the start of the event, the EMMA organic horizon de-rived contribution was largely overestimated (Fig. 7a). ThePearson correlations for the EMMA derived contribution oftransient groundwater and shallow soil water to streamwater during the May event were �0.66 (p < 0.001) and�0.65 (p < 0.001), respectively, and timing of these contri-butions and measurements were generally in agreement.
Flow direction analysis
The flow direction analysis was done to test if a lateral flowcomponent within the soil profile is an important part of theflushing mechanism. The flow direction analysis based on thetensiometer triangle installed 25 m upslope showed that thedirection of flow was mainly directed vertically during theDecember and May storm events (Fig. 8). Flow direction (r)with a positive deviation (a) from the vertical flow direction(v) is considered a lateral flow component. Flow directionparallel to the slope of the hillslope is characterized by ana of 46�. During the December event the maximum deviationfrom the vertical flow direction at 30 cm depth was 2.4� andmost of the time (77%) smaller than zero and thus directedinto the hillslope. During the May event maximum a at30 cm depth was 10�, and a was 36% of the time <0�.Although the maximum deviation from the vertical flowdirection at 70 cm depth was 25� during the December eventand coincided with positive pore pressures at 100 cm depth(Fig. 8), 86% of the time a was <10�. During the May eventmaximum a was 19�, however, a was 65% of the time <10�.The negative changes of a (flow direction changes in upslopedirection) during both storm events coincide with large posi-tive changes in rainfall intensity (Figs. 3 and 8), indicatingthat changes in rainfall intensity are the driving force forchanges in flow direction at both depths. In general these re-sults show that a significant lateral flow at considerablelengths of time does not exist at 30 and 70 cm depth.
DOC and N in organic horizon, soil and groundwater
DOC and N in throughfall, from the organic horizon and insoil water were sampled frequently during the December2004 and May 2005 storm events to investigate if DOC andN were a limited or unlimited supply during these stormevents. Pre-storm mean DOC and DON concentrations inthe organic horizon during the December storm, between12/02 and 12/09, decreased from 11.7 to 7.4 mg l�1 andfrom 0.45 to 0.14 mg l�1, respectively (Fig. 9). Between12/09 and 12/12 both DOC and DON concentrations in theorganic horizon increased slightly. DON increased inthroughfall during the storm. In contrast DOC in throughfallshowed a dilution pattern. The increase in DIN concentra-tion in the organic horizon during the storm is probably tosome extent caused by the increase in DIN concentrationin throughfall. DOC concentrations at 20 and 30–40 cmdepth did not show significant variation during the storm,while at 70–110 cm DOC increased slightly. DON soil solu-tion concentrations did show variation during the storm:(1) at 20 cm depth, DON decreased from 0.2 to 0.1 mg l�1

Figure 9 Mean (±SE) DOC, DON and DIN concentrations in throughfall, organic horizon water, and soil water at 20, 30–40 and 70–110 cm depth during (a) the December 2004 storm event, and (b) the May 2005 storm event.
280 W.J. van Verseveld et al.
between 12/09 and 12/12, (2) DON showed an overall in-crease in concentration at 30–40 cm depth compared topre-storm DON, with a peak at 12/09, and (3) DON increasedfrom 0.04 to 0.1 mg l�1 at 70–110 cm depth. DIN at 20 cmdepth did not show any variation, while it showed some var-iation at deeper soil depths.
During the May storm in 2005, DOC and DIN concentra-tions showed little variation in throughfall, while DON con-centrations decreased between 05/19 and 05/22. Thedecrease in DOC and total nitrogen (TN) during the stormin the organic horizon indicates a dilution pattern, and a fi-nite source of DOC and N. DIN data was not available for theorganic horizon. DOC and DON concentrations increased at
20 cm soil depth during the storm, while DOC and DON con-centrations at 30–40 cm depth did not show a large amountof variation. DOC concentrations increased at 70–110 cmsoil depth, from 0.9 to 1.6 mg l�1, and in contrast DON con-centrations decreased at this soil depth range.
EMMA indicated that organic horizon, deep groundwaterand transient groundwater were important end-members.Furthermore, the flow vector analysis suggested a possiblestrong connection between the organic horizon and ground-water. To elucidate the connectedness between the organichorizon and transient and deep groundwater (well A01) wecompared organic horizon DOC and N concentrations andSUVA values with transient and deep groundwater (well

A mechanistic assessment of nutrient flushing at the catchment scale 281
A01) DOC and N concentrations and SUVA values during thetwo storm events. During the December storm event DOCand DON concentrations and SUVA values of the organic hori-zon and transient groundwater were very similar, while deepgroundwater (well A01) was characterized by lower values(Table 3). This suggests in combination with the flow vectoranalysis that vertical preferential flow caused high DOC, DONconcentrations and SUVA values in transient groundwater.
Discussion
While many studies (e.g., Boyer et al., 1997; Vanderbilt etal., 2003; Hood et al., 2006) described higher stream nutri-ent concentrations on the rising limb compared to the fall-ing limb of the hydrograph, description of the exact flushingmechanism has been difficult. In the literature three differ-ent flushing hypotheses have been described: (1) a risingwater table that intersects high nutrient concentrations inthe upper soil layer, (2) vertical transport of nutrients, bypreferential or matrix flow through the (deeper less bio-ac-tive) soil to the soil–bedrock interface and then laterallydownslope, and (3) lateral transient flow within the shallowsoil profile. It is difficult to reject one or more of thesehypotheses because we need a variety of hydrological andchemical approaches to do so. However, it is important gi-ven that a mechanistic understanding of flushing of nutri-ents is essential for model development for prediction ofland use change and climate change effects on surfacewater quality.
The main objective of our paper was to mechanisticallyassess nutrient flushing at the catchment scale, throughmeasurements at the point, hillslope and catchment scale.We used hydrometric data (groundwater level observations,soil matric potential and soil moisture measurements) tovalidate our chemical end-member analysis of differentsources of lateral subsurface flow and stream water. Lateralsubsurface and stream water both showed highest DOC andDON, and SUVA values during the rising limb of the hydro-graph during the December and May storm events. EMMAindicated generally three different sources for lateral sub-surface flow and stream water during the December andMay storm events: (1) organic horizon water or shallow soilwater or transient groundwater, (2) deep groundwater and(3) throughfall. EMMA derived deep groundwater contribu-tions to stream water and lateral subsurface flow were ingood agreement with deep groundwater level variations inseepage well A01. Soil moisture dynamics in the organichorizon were in agreement with the EMMA derived organichorizon water contribution to stream water and lateral sub-
Table 3 Mean (SE) of DOC, DON, DIN and SUVA in transient and2005 storm events
December 2004 event
Organichorizon
Transientgroundwater
Deep grou(A01)
DOC (mg l�1) 9.0 (1.3) 10.8 (2.0) 3.4 (0.07)DON (mg l�1) 0.27 (0.06) 0.23 (0.11) 0.075 (0.0DIN (mg l�1) 0.049 (0.017) 0.86 (0.51) 0.026 (0.0SUVA (l mg�1 m�1) 5.5 (0.5) 4.8 (3.2) 1.3 (0.2)
surface flow, although EMMA likely over-estimated the or-ganic horizon contribution during the rising limb of thehydrograph. Furthermore, deep soil matric potential pat-terns were in agreement with EMMA derived transientgroundwater contributions to stream water and lateral sub-surface flow. The flow direction analysis and high DOC andDON concentrations and SUVA values in transient groundwa-ter suggest vertical preferential flow to depth and a strongconnection between the organic horizon/shallow soil andtransient groundwater. DIN concentrations in transientgroundwater were higher than DIN concentrations in organichorizon water indicating that these high DIN concentrationswere not caused exclusively by a preferential flow mecha-nism. High DIN concentrations in transient groundwaterwere likely the result of a combination of ammonificationand subsequent nitrification of organic N (van Verseveld etal., submitted for publication).
Groundwater heights above the bedrock were very shal-low (about 10–15 cm) and the predominantly vertical flowcomponent in the unsaturated zone during the storm eventsreject flushing mechanisms 1 and 3. Our results supportflushing mechanism 2: vertical transport of nutrients throughpreferential flow and then laterally downslope at the soilbedrock interface occurred at our site. Furthermore, DOCand DON were a finite source in the organic horizon, whileDOC and DON concentrations from shallow and deep lysime-ters did not show large temporal variation. This suggests thatthe DOC and DON flushing pattern observed in lateral subsur-face flow and stream flow was caused by organic horizondynamics. However, the combination of EMMA, SUVA andhydrometric data showed evidence that flushing mechanism2 including a finite source of DOC and DON is not sufficient toexplain our observations. Mixing of different sources ofwater both spatially and temporally needs to be includedto explain nutrient flushing mechanistically. We will describethis in more detail in the following sections.
Mixing at hillslope and catchment scale
The three end-members from EMMA were different betweenthe December 2004 and May 2005 storm event. For lateralsubsurface flow and both storm events EMMA resulted inthree distinct groups of end-members: (1) deep groundwa-ter, (2) throughfall/deep soil water and (3) shallow soilwater, organic horizon water and transient groundwater.Furthermore, the end-members from group 3 could be usedinterchangeably for lateral subsurface flow without affect-ing how complete the solute space was bounded by theend-members. The interchangeability of these end-mem-
deep groundwater (well A01) during December 2004 and May
May 2005 event
ndwater Organichorizon
Transientgroundwater
Deep groundwater(A01)
12.9 (1.2) 4.7 (0.7) 3.7 (0.2)06) n.a. 0.21 (0.04) 0.049 (0.009)06) n.a. 0.81 (0.23) 0.028 (0.005)
4.9 (0.4) 2.5 (0.2) 0.6 (0.1)
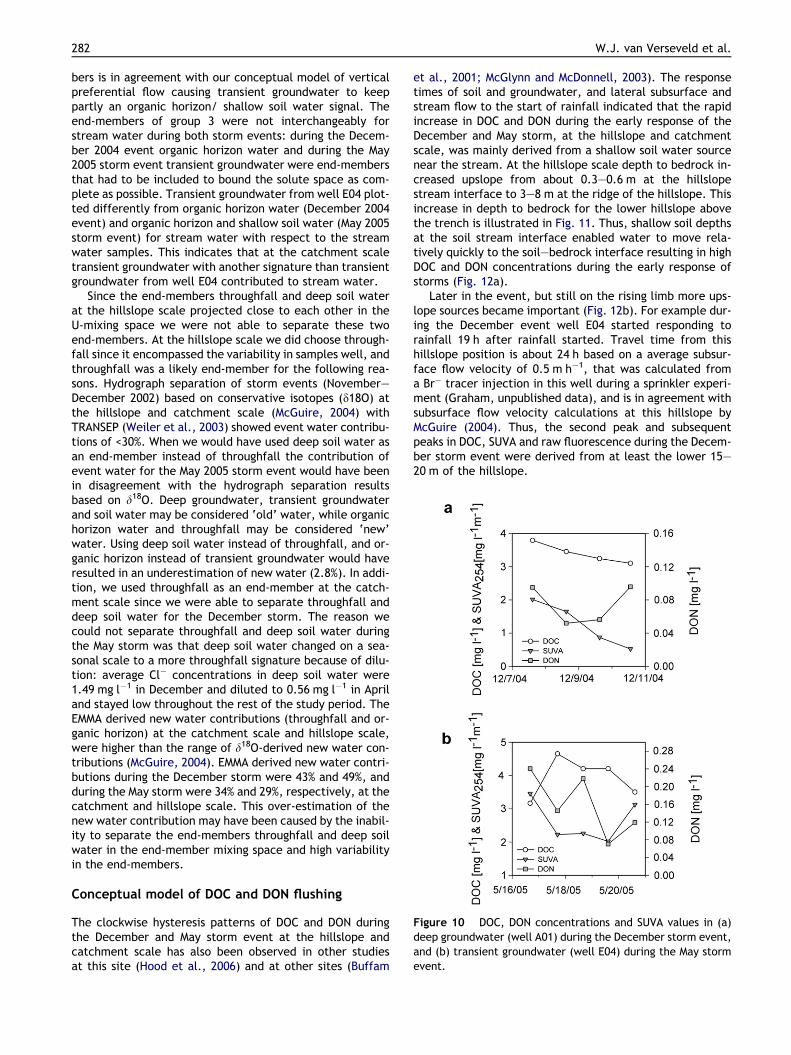
Figure 10 DOC, DON concentrations and SUVA values in (a)deep groundwater (well A01) during the December storm event,and (b) transient groundwater (well E04) during the May stormevent.
282 W.J. van Verseveld et al.
bers is in agreement with our conceptual model of verticalpreferential flow causing transient groundwater to keeppartly an organic horizon/ shallow soil water signal. Theend-members of group 3 were not interchangeably forstream water during both storm events: during the Decem-ber 2004 event organic horizon water and during the May2005 storm event transient groundwater were end-membersthat had to be included to bound the solute space as com-plete as possible. Transient groundwater from well E04 plot-ted differently from organic horizon water (December 2004event) and organic horizon and shallow soil water (May 2005storm event) for stream water with respect to the streamwater samples. This indicates that at the catchment scaletransient groundwater with another signature than transientgroundwater from well E04 contributed to stream water.
Since the end-members throughfall and deep soil waterat the hillslope scale projected close to each other in theU-mixing space we were not able to separate these twoend-members. At the hillslope scale we did choose through-fall since it encompassed the variability in samples well, andthroughfall was a likely end-member for the following rea-sons. Hydrograph separation of storm events (November–December 2002) based on conservative isotopes (d18O) atthe hillslope and catchment scale (McGuire, 2004) withTRANSEP (Weiler et al., 2003) showed event water contribu-tions of <30%. When we would have used deep soil water asan end-member instead of throughfall the contribution ofevent water for the May 2005 storm event would have beenin disagreement with the hydrograph separation resultsbased on d18O. Deep groundwater, transient groundwaterand soil water may be considered ‘old’ water, while organichorizon water and throughfall may be considered ‘new’water. Using deep soil water instead of throughfall, and or-ganic horizon instead of transient groundwater would haveresulted in an underestimation of new water (2.8%). In addi-tion, we used throughfall as an end-member at the catch-ment scale since we were able to separate throughfall anddeep soil water for the December storm. The reason wecould not separate throughfall and deep soil water duringthe May storm was that deep soil water changed on a sea-sonal scale to a more throughfall signature because of dilu-tion: average Cl� concentrations in deep soil water were1.49 mg l�1 in December and diluted to 0.56 mg l�1 in Apriland stayed low throughout the rest of the study period. TheEMMA derived new water contributions (throughfall and or-ganic horizon) at the catchment scale and hillslope scale,were higher than the range of d18O-derived new water con-tributions (McGuire, 2004). EMMA derived new water contri-butions during the December storm were 43% and 49%, andduring the May storm were 34% and 29%, respectively, at thecatchment and hillslope scale. This over-estimation of thenew water contribution may have been caused by the inabil-ity to separate the end-members throughfall and deep soilwater in the end-member mixing space and high variabilityin the end-members.
Conceptual model of DOC and DON flushing
The clockwise hysteresis patterns of DOC and DON duringthe December and May storm event at the hillslope andcatchment scale has also been observed in other studiesat this site (Hood et al., 2006) and at other sites (Buffam
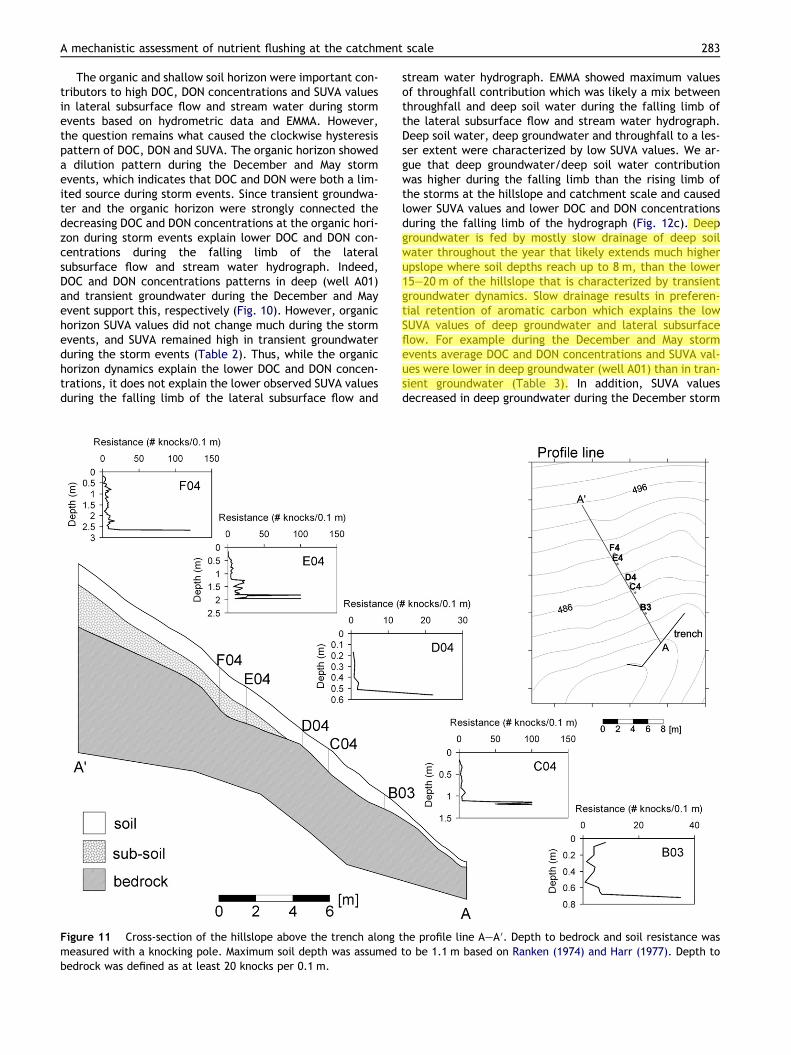
et al., 2001; McGlynn and McDonnell, 2003). The responsetimes of soil and groundwater, and lateral subsurface andstream flow to the start of rainfall indicated that the rapidincrease in DOC and DON during the early response of theDecember and May storm, at the hillslope and catchmentscale, was mainly derived from a shallow soil water sourcenear the stream. At the hillslope scale depth to bedrock in-creased upslope from about 0.3–0.6 m at the hillslopestream interface to 3–8 m at the ridge of the hillslope. Thisincrease in depth to bedrock for the lower hillslope abovethe trench is illustrated in Fig. 11. Thus, shallow soil depthsat the soil stream interface enabled water to move rela-tively quickly to the soil–bedrock interface resulting in highDOC and DON concentrations during the early response ofstorms (Fig. 12a).
Later in the event, but still on the rising limb more ups-lope sources became important (Fig. 12b). For example dur-ing the December event well E04 started responding torainfall 19 h after rainfall started. Travel time from thishillslope position is about 24 h based on a average subsur-face flow velocity of 0.5 m h�1, that was calculated froma Br� tracer injection in this well during a sprinkler experi-ment (Graham, unpublished data), and is in agreement withsubsurface flow velocity calculations at this hillslope byMcGuire (2004). Thus, the second peak and subsequentpeaks in DOC, SUVA and raw fluorescence during the Decem-ber storm event were derived from at least the lower 15–20 m of the hillslope.
A mechanistic assessment of nutrient flushing at the catchment scale 283
The organic and shallow soil horizon were important con-tributors to high DOC, DON concentrations and SUVA valuesin lateral subsurface flow and stream water during stormevents based on hydrometric data and EMMA. However,the question remains what caused the clockwise hysteresispattern of DOC, DON and SUVA. The organic horizon showeda dilution pattern during the December and May stormevents, which indicates that DOC and DON were both a lim-ited source during storm events. Since transient groundwa-ter and the organic horizon were strongly connected thedecreasing DOC and DON concentrations at the organic hori-zon during storm events explain lower DOC and DON con-centrations during the falling limb of the lateralsubsurface flow and stream water hydrograph. Indeed,DOC and DON concentrations patterns in deep (well A01)and transient groundwater during the December and Mayevent support this, respectively (Fig. 10). However, organichorizon SUVA values did not change much during the stormevents, and SUVA remained high in transient groundwaterduring the storm events (Table 2). Thus, while the organichorizon dynamics explain the lower DOC and DON concen-trations, it does not explain the lower observed SUVA valuesduring the falling limb of the lateral subsurface flow and
Figure 11 Cross-section of the hillslope above the trench along tmeasured with a knocking pole. Maximum soil depth was assumedbedrock was defined as at least 20 knocks per 0.1 m.
stream water hydrograph. EMMA showed maximum valuesof throughfall contribution which was likely a mix betweenthroughfall and deep soil water during the falling limb ofthe lateral subsurface flow and stream water hydrograph.Deep soil water, deep groundwater and throughfall to a les-ser extent were characterized by low SUVA values. We ar-gue that deep groundwater/deep soil water contributionwas higher during the falling limb than the rising limb ofthe storms at the hillslope and catchment scale and causedlower SUVA values and lower DOC and DON concentrationsduring the falling limb of the hydrograph (Fig. 12c). Deepgroundwater is fed by mostly slow drainage of deep soilwater throughout the year that likely extends much higherupslope where soil depths reach up to 8 m, than the lower15–20 m of the hillslope that is characterized by transientgroundwater dynamics. Slow drainage results in preferen-tial retention of aromatic carbon which explains the lowSUVA values of deep groundwater and lateral subsurfaceflow. For example during the December and May stormevents average DOC and DON concentrations and SUVA val-ues were lower in deep groundwater (well A01) than in tran-sient groundwater (Table 3). In addition, SUVA valuesdecreased in deep groundwater during the December storm
he profile line A–A 0. Depth to bedrock and soil resistance wasto be 1.1 m based on Ranken (1974) and Harr (1977). Depth to

Figure 12 Conceptual model of nutrient flushing during (a) start of the storm with vertical flow that reaches the soil bedrockinterface of the lower hillslope section resulting in transient groundwater at this location, and contribution of deep groundwater/deep soil water, resulting in the first rapid increase of DOC, DON, SUVA and raw fluorescence, (b) later in the storm event on therising limb of the hydrograph vertical flow reaches greater depths and more upslope sources of transient groundwater becomeimportant, and contribution of deep groundwater/deep soil water increases, causing DOC, DON, SUVA and fluorescence to remainhigh, (c) during the falling limb of the hydrograph, transient groundwater contribution moves downslope and decreases while deepgroundwater/deep soil water contribution remains high compared to the start of the storm, resulting in a dilution pattern of DOC,DON, SUVA and raw fluorescence. Furthermore, the finite source of DOC and DON in the organic horizon during the storm eventcontributes to decreasing concentrations of these solutes during the storm.
284 W.J. van Verseveld et al.
event (Fig. 10). Furthermore, comparing groundwaterheight dynamics of deep groundwater (A01) and transientgroundwater (E04) suggests that deep groundwater contrib-uted more during the falling limb of the December stormevent. Thus, the clockwise hysteresis pattern was causedby a combination of a finite source of DOC and DON in the
organic horizon and higher contribution of deep groundwa-ter/deep soil water on the falling limb of the lateral subsur-face flow and stream flow hydrograph. Flushing mechanism2 alone could not explain our observations. The change inmixing of water sources during storm events had to beincluded.

A mechanistic assessment of nutrient flushing at the catchment scale 285
Concluding remarks
We mechanistically assessed nutrient flushing at the hills-lope and catchment scale during a December and May stormevent. We posed the three following flushing mechanisms ashypotheses: (1) a rising water table that intersects highnutrient concentrations in the upper soil layer, (2) verticaltransport of nutrients, by preferential or matrix flowthrough the (deeper less bio-active) soil to the soil–bedrockinterface and then laterally downslope, and (3) verticaltransport of nutrients and then laterally within the soil pro-file, and tested these hypotheses based on a combination ofhydrometric and natural tracer data.
Sources and flowpaths of stream water and lateral sub-surface flow were examined at the storm event scalethrough the use of hydrometric and natural tracer data.End-members from end-member mixing analysis wereessentially grouped in the following categories: (1) organichorizon water or shallow soil water or transient groundwa-ter, (2) deep groundwater and (3) throughfall. Detailedmeasurements of DOC and DON concentrations in the organ-ic horizon showed a dilution pattern. High DOC and DONconcentrations and SUVA values in the organic horizon andtransient groundwater suggested vertical preferential flowand a strong connection between the organic horizon andtransient groundwater. Groundwater was characterized bymaximum groundwater levels of 10–15 cm. Furthermore,the unsaturated flow vector analysis showed that flow inthe unsaturated zone was predominantly vertical duringboth storm events. Thus, hydrometric data in combinationwith natural tracers enabled us to reject flushing mecha-nism 1 and 3, and to accept flushing mechanism 2 that in-cluded a finite source of DOC and DON in the organichorizon.
However, DOM quality, expressed as SUVA was needed tofurther refine our conceptual model based on flushing mech-anism 2. During the early response of the December and Maystorm events DOC and DON were mainly transported fromnear stream zones, while upslope sources (�20 m upslope)became more important later in the event, but still on therising limb of the hydrograph. The organic horizon DOCand DON dilution pattern and the strong connection be-tween the organic horizon and transient groundwater duringthe storms could explain the lower DOC and DON concentra-tions during the falling limb of the hydrograph, resulting in aclockwise hysteresis pattern. However, SUVA that alsoshowed a clockwise hysteresis pattern did not change signif-icantly in the organic horizon and transient groundwaterduring storms. We argued based on hydrometric data andSUVA that the contribution of deep groundwater/deep soilwater was higher during the falling limb compared to therising limb of the hydrograph and had a dilution effect ofDOC and DON concentrations and SUVA values.
This study showed the importance of combining hydro-metric and tracer data that enabled us to mechanisticallyassess nutrient flushing at our site and to develop a concep-tual model of how DOC and DON were transported from thesoil to the stream at the hillslope and catchment scale dur-ing storm events. In addition it demonstrated the value ofusing SUVA as a measure of DOM quality. Without SUVA wewould not have been able to refine our accepted flushing
mechanism hypothesis of vertical transport of nutrients bypreferential flow to the soil–bedrock interface and then lat-eral movement downslope.
We assessed the flushing mechanism at our site duringtwo storm events with different precipitation amounts andintensities and concluded that the same flushing mechanismoccurred during these two storm events. However, extend-ing this result to storm events of rather different magnitudeor to storm events with different antecedent wetness condi-tions at our study site is difficult. Virtual experiments drivenby field intelligence (Weiler and McDonnell, 2006) may pro-vide a way to define the first order controls on nutrientflushing at the hillslope and catchment scale and a promis-ing future research direction to extrapolate beyond the ob-served storm events at our study site. Extending the resultof this study to other sites with different topography, soiltypes, soil depths and rainfall patterns is even more limited.Functional intercomparison of hillslopes and small catch-ments (Uchida et al., 2006) may yield further insights intothe first order controls on hydro-biogeochemical processesat different sites and the role of site conditions in the hy-dro-biogeochemical response of these sites. Currently, weare investigating the possibility of such a functional inter-comparison of our study site and other well studied sites.
Acknowledgements
This work was supported through funding from the NationalScience Foundation (Grant DEB 021-8088 to the Long-TermEcological Research Program at the H.J. Andrews Experi-mental Forest) and Department of Forest Engineering atOregon State University. We thank Marloes Bakker and JohnMoreau for providing field assistance and C.B. Graham forproviding us with bromide tracer data from a well injection.We also thank R.D. Harr and D. Ranken for initiating thehillslope studies at WS10, and K.J. McGuire for re-initiatingthis site.
References
Bernal, S., Butturini, A., Sabater, F., 2005. Seasonal variations ofdissolved nitrogen and DOC:DON ratios in an intermittentMediterranean stream. Biogeochemistry 75 (2), 351–372.
Bernal, S., Butturini, A., Sabater, F., 2006. Inferring nitrate sourcesthrough end member mixing analysis in an intermittent Medi-terranean stream. Biogeochemistry 81 (3), 269–289.
Bishop, K., Seibert, J., Kolhler, S., Laudon, H., 2004. Resolving thedouble paradox of rapidly old water with variable responses inrunoff chemistry. Hydrological Processes 18 (1), 185–189.
Bonell, M., 1998. Selected challenges in runoff generation researchin forests from the hillslope to headwater drainage basin scale.Journal of the American Water Resources 34 (4), 765–785.
Boyer, E.W., Hornberger, G.M., Bencala, K.E., McKnight, D.M.,1997. Response characteristics of DOC flushing in an Alpinecatchment. Hydrological Processes 11 (12), 1635–1647.
Brown, V.A., McDonnell, J.J., Burns, D.A., Kendall, C., 1999. Therole of event water a rapid shallow flow component andcatchment size in summer stormflow. Journal of Hydrology 217(3), 171–190.
Buffam, I., Galloway, J.N., Blum, L.K., McGlathery, K.J., 2001. Astormflow/baseflow comparison of dissolved organic matter
286 W.J. van Verseveld et al.
concentrations and bioavailability in an Appalachian stream.Biogeochemistry 53 (3), 269–306.
Buttle, J.M., Lister, S.W., Hill, A.R., 2001. Controls on runoffcomponents on a forested slope and implications for N trans-port. Hydrological Processes 15 (6), 1065–1070.
Burns, D.A., McDonnell, J.J., Hooper, R.P., Peters, N.E., Freer,J.E., Kendall, C., Beven, K.J., 2001. Quantifying contributionsto storm runoff through end-member mixing analysis andhydrologic measurements at the Panola Mountain ResearchWatershed (Georgia, USA). Hydrological Processes 15 (10),1903–1924.
Creed, I.F., Band, L.E., Foster, N.W., Morrison, I.K., Nicolson,J.A., Semkin, R.S., Jeffries, D.S., 1996. Regulation ofnitrate-N release from temperate forests: a test of the Nflushing hypothesis. Water Resources Research 32 (11),3337–3354.
Christopherson, N., Hooper, R.P., 1992. Multivariate analysis ofstream water chemical data: the use of principal componentanalysis for the end-member mixing problem. Water ResourcesResearch 28 (1), 99–107.
Gaskin, J.W., Dowd, J.W., Nutter, W.L., Swank, W.T., 1989.Vertical and lateral components of soil nutrient flux in ahillslope. Journal of Environmental Quality 18 (4), 403–410.
Hagedorn, F., Schleppi, P., Waldner, P., Fluhler, H., 2000. Export ofdissolved organic carbon and nitrogen from Gleysol dominatedcatchments – the significance of water flow paths. Biogeochem-istry 50 (2), 137–161.
Harr, R.D., 1977. Water flux in soil and subsoil on a steep forestedslope. Journal of Hydrology 33 (1), 37–58.
Hill, A.R., Kemp, W.A., Buttle, J.M., Goodyear, D., 1999. Nitrogenchemistry of subsurface storm runoff on forested CanadianShield hillslopes. Water Resources Research 35 (3), 811–821.
Hinton, M.J., Schiff, S.L., English, M.C., 1997. The significance ofstorms for the concentration and export of dissolved organiccarbon from two Precambrian Shield catchments. Biogeochem-istry 36 (1), 67–88.
Hood, E., McKnight, D.M., Williams, M.W., 2003. Sources andchemical character of dissolved organic carbon across an alpine/subalpine ecotone, Green Lakes Valley, Colorado Front Range,United States. Water Resources Research 39 (7), 1188.doi:10.1029/2002WR001738.
Hood, E., Williams, M.W., McKnight, D.M., 2005. Sources ofdissolved organic matter (DOM) in a Rocky Mountain streamusing chemical fractionation and stable isotopes. Biogeochem-istry 74 (2), 231–255.
Hood, E., Gooseff, M.N., Johnson, S.L., 2006. Changes in thecharacter of stream water dissolved organic carbon duringflushing in three small watersheds, Oregon. Journal of Geophys-ical Research 111, G01007. doi:10.1029/2005JG000082.
Hooper, R.P., 2001. Applying the scientific method to smallcatchment studies: a review of the Panola Mountain experience.Hydrological Processes 15 (10), 2039–2050.
Inamdar, S.P., Mitchell, M.J., 2006. Hydrological and topographicalcontrols on storm-event exports of dissolved organic carbon(DOC) and nitrate across catchment scales. Water ResourcesResearch 42, W03421. doi:10.1029/2005WR004212.
Jackson, C.R., 1992. Hillslope infiltration and lateral downslopeunsaturated flow. Water Resources Research 28 (9), 2533–2539.
James, A.L., Roulet, N.T., 2006. Investigating the applicability ofend-member mixing analysis (EMMA) across scale: a study ofeight small, nested catchments in a temperate forestedwatershed. Water Resources Research 42, W08434.doi:10.1029/2005WR004419.
Jardine, P.M., Wilson, G.V., Luxmoore, R.J., 1990. Unsaturatedsolute transport through a forest soil during rain events.Geoderma 46, 103–118.
Kaiser, K., Zech, W., 1998. Rates of dissolved organic matterrelease and sorption in forest soils. Soil Science 163, 714–725.
Kalbitz, K., Solinger, S., Park, J.-H., Michalzik, B., Matzner, E.,2000. Controls on the dynamics of dissolved organic matter insoils: a review. Soil Science 165, 277–304.
Katsuyama, M., Ohte, N., 2002. Determining the sources ofstormflow from the fluorescence properties of dissolved organiccarbon in a forested catchment. Journal of Hydrology 268 (1),192–202.
Keim, R.F., Skaugset, A.E., 2004. A linear system model of dynamicthroughfall rates beneath forest canopies. Water ResourcesResearch 40, W05208. doi:10.1029/2003WR002875.
Lajtha, K., Jarrell, W.M., Johnson, D.W., Sollins, P., 1999.Collection of soil solution. In: Robertson, G.P. et al. (Eds.),Standard Soil Methods for Long-Term Ecological Research.Oxford University Press, New York, pp. 166–182.
McCord, J.T., Stephens, D.B., Wilson, J.L., 1991. Hysteresis and state-dependent anisotropy in modeling unsaturated hillslope hydrologicprocesses. Water Resources Research 27 (7), 1501–1518.
McGuire, K.J., 2004. Water residence time and runoff generation inthe western Cascades of Oregon. Ph.D. Thesis, Oregon StateUniversity, Corvallis.
McGuire, K.J., McDonnell, J.J., Weiler, M., 2007. Integrating tracerexperiments with modeling to infer water transit times.Advances in Water Resources 30 (4), 824–837.
McGlynn, B.L., McDonnell, J.J., 2003. Role of discrete landscapeunits in controlling catchment dissolved organic carbon dynam-ics. Water Resources Research 39 (4), 1090. doi:10.1029/2002WR001525.
McHale, M.R., McDonnell, J.J., Mitchell, M.J., Cirmo, C.P., 2002. Afield-based study of soil water and groundwater nitrate releasein an Adirondack forested watershed. Water Resources Research38 (4), 1031. doi:10.1029/2000WR000102.
McKnight, D.M., Harnish, R., Wershaw, R.L., Baron, J.S., Schiff, S.,1997. Chemical characteristics of particulate, colloidal anddissolved organic material in Loch Vale Watershed, RockyMountain National Park. Biogeochemistry 36 (1), 99–124.
Michalzik, B., Kalbitz, K., Park, J.H., Solinger, S., Matzner, E.,2001. Fluxes and concentrations of dissolved organic carbon andnitrogen – a synthesis for temperate forests. Biogeochemistry52 (2), 173–205.
Mulholland, P.J., Hill, W.R., 1997. Seasonal patterns in stream-water nutrient and dissolved organic carbon concentrations:separating catchment flow path and in-stream effects. WaterResources Research 33 (6), 1297–1306.
Qualls, R.G., Richardson, C.J., 2003. Factors controlling concen-tration, export, and decomposition of dissolved organic nutri-ents in the Everglades of Florida. Biogeochemistry 62, 197–229.
Ranken, D.W., 1974. Hydrologic properties of soil and subsoil on a steep,forested slope. M.S. Thesis, Oregon State University, Corvallis.
Retter, M., Kienzler, P., Germann, P.F., 2006. Vectors of subsur-face stormflow in a layered hillslope during runoff initiation.Hydrology and Earth System Sciences 10 (3), 309–320.
Sollins, P., Cromack, K.J., McCorison, F.M., Waring, R.H., Harr,R.D., 1981. Changes in nitrogen cycling at an old-growthDouglas-fir site after disturbance. Journal of EnvironmentalQuality 10 (1), 37–42.
Swank, W.T., Fitzgerald, J.W., Ash, J.T., 1984. Microbial transfor-mation of sulfate in forest soils. Science 223, 182–184.
Swanson, F.J., James, M.E., 1975. Geology and geomorphology ofthe H.J. Andrews Experimental Forest, Western Cascades,Oregon, Pacific Northwest Forest and Range ExperimentalStation, PNW-188.
Triska, F.J., Sedell, J.R., Cromack, K., Gregory, S.V., McCorison,F.M., 1984. Nitrogen budget for a small coniferous foreststream. Ecological Monographs 54 (1), 119–140.
Torres, R., Dietrich, W.E., Montgomery, D.R., Anderson, S.P.,Loague, K., 1998. Unsaturated zone processes and the hydro-logic response of a steep, unchanneled catchment. WaterResources Research 34 (8), 1865–1879.

A mechanistic assessment of nutrient flushing at the catchment scale 287
Uchida, T., McDonnell, J.J., Asano, Y., 2006. Functional intercom-parison of hillslopes and small catchments constrained by watersource, flowpath and mean residence time. Water ResourcesResearch 40, W12401. doi:10.1029/2003WR00.
Vanderbilt, K.L., Lajtha, K., Swanson, F.J., 2003. Biogeochemistryof unpolluted forested watersheds in the Oregon Cascades:temporal patterns of precipitation and stream nitrogen fluxes.Biogeochemistry 62 (1), 87–117.
van Verseveld, W.J., McDonnell, J.J., Lajtha, K., submitted forpublication. The role of hillslope hydrology in controllingnutrient loss. Journal of Hydrology.
Weiler, M., McGlynn, B.L., McGuire, K.J., McDonnell, J.J., 2003.How does rainfall become runoff? A combined tracer and runofftransfer function approach. Water Resources Research 39 (11),1315. doi:10.1029/2003WR002331.
Weiler, M., McDonnell, J.J., 2006. Testing nutrient flushinghypotheses at the hillslope scale: a virtual experiment approach.Journal of Hydrology 319 (1–4), 339–356.
Yano, Y., Lajtha, K., Sollins, P., Caldwell, B.A., 2005. Chemistryand dynamics of dissolved organic matter in a temperateconiferous forest on Andic soils: effects of litter quality.Ecosystems 8 (1), 286–300.