a low-carbon roadmap for belgium
TRANSCRIPT

A Low-carbon roadmap for Belgium Study realised for the FPS Health, Food Chain Safety and Environment
Agriculture sector document
This document is based on content development by the consultant team as well as an expert workshop that was held on the 22-06-2012
Content – Agriculture sector
2
▪ Summary and references
▪ Context and historical trends
▪ Methodology
▪ Details of the ambition levels and costs per lever
▪ Barriers to reduce CH4 and N2O

Summary of level 1 and level 4 assumptions for the main drivers
Drivers Description Level 1 Level 4
number of animals evolution of number of animals
poultry +0,1% p.a.; dairy +2% p.a.; other -0,1% p.a. (2010 - 2030); 0% (2030 -2050)
-1,4% p.a. (2010 - 2050); reduction of meat consumption with 53% between 2010 - 2050 based on healthy and balanced diet of 75 grams of meat per day per capita and population increase with + 21% between 2010 - 2050
enteric fermentation evolution of CO2eq per animal
0% -0,06% p.a. (2010 - 2030); 0% (2030 – 2050) non-specific CH4 inhibitors, combined with nutritional management and optimizing ration
manure management evolution of CO2eq per animal
+0,31% p.a. (2010 - 2030); 0% (2030 - 2050); increase of productivity
-3,1% p.a. (2010 - 2030); 0% (2030 – 2050); increase of productivity is offset by increase of production efficiency; increase of manure treated in anaerobic digester (15% of N excreted in 2050) and good manure management practices
soil emissions evolution of total CO2eq
+0,09% p.a. (2010 - 2030); 0% p.a. (2030 – 2050); increase of productivity (decrease of direct emissions) and increase of N excreted (emissions from grazing)
-0,51% p.a. (2010 - 2030); 0% p.a. (2030 - 2050); N-efficiency improvement (direct emissions) and decrease of N excreted (emissions from (emissions from grazing)
3
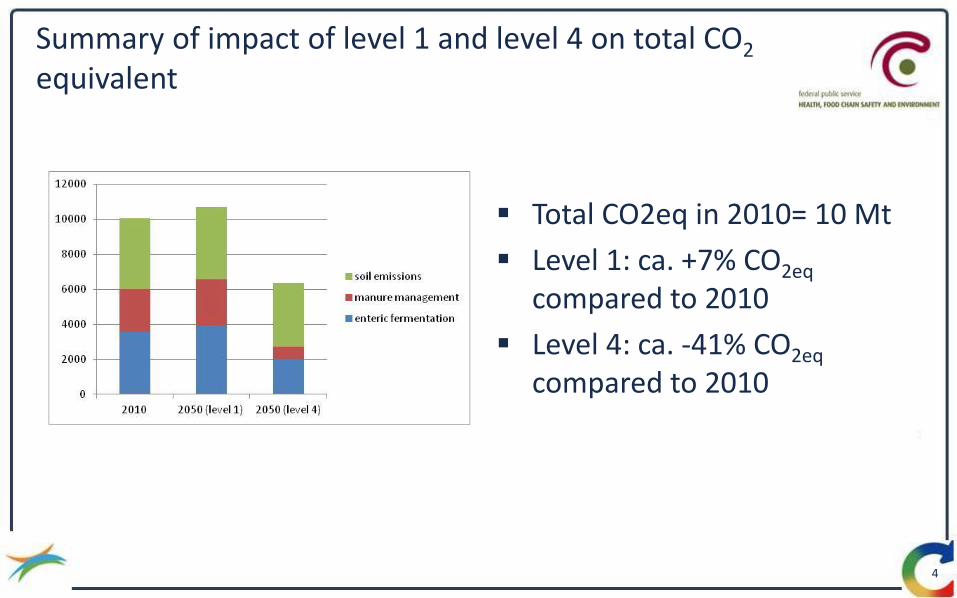
Summary of impact of level 1 and level 4 on total CO2 equivalent
Total CO2eq in 2010= 10 Mt
Level 1: ca. +7% CO2eq compared to 2010
Level 4: ca. -41% CO2eq compared to 2010
4
List of references
Belgian’s Fifth National Communication Climate Change under the UNFCC, 2009. Belgium’s greenhouse gas inventory (1990-2010) - National Inventory Report submitted under the United
Nations Framework Convention on Climate Change and the Kyoto Protocol, April 2012. Bates J., Economic Evaluation of Emission Reductions of Nitrous Oxides and Methane in Agriculture in the EU -
Bottom-up Analysis, AEA Technology Environment, February 2001. Bates J., Brophy N., Harfoot M., Webb J., Reduction Potentials and Economic Costs for Climate Change (SERPEC-
CC) - Agriculture: methane and nitrous oxide, Sectoral Emission, AEA Energy & Environment, October 2009. Campens V., Van Gijseghem D., Bas L., Van Vynckt I., Klimaat en veehouderij, 2010. Centre for Alternative Technology, Zero Carbon Britain 2030 - A new energy strategy, The second report of the
Zero Carbon Britain project,2010.
Combris P., Soler L.G., Consommation alimentaires : tendances de long terme et questions sur leur durabilité, Innovations Agronomiques 13, 149-160, 2011.
5
List of references
Danckaert S., Carels K., Van Gijseghem D., Juridisch-wetenschappelijke toestand van blijvend grasland in Vlaanderen in het kader van de randvoorwaardenregeling, Departement Landbouw en Visserij,afdeling Monitoring en Studie, november 2008.
Debacker N., Cox B., Temme L., Huybrechts T., Van Oyen H., De Belgische voedselconsumptiepeiling 2004 : voedingsgewoonten van de Belgische bevolking ouder dan 15 jaar, Universiteit Gent, 2007.
Department of Energy and Climate Change (DECC), 2050 Pathways Analysis, July 2010.
Derden A., Vanassche S., Huybrechts D., Beste Beschikbare Technieken (BBT) voor (mest)covergistingsinstallaties, VITO, februari 2012.
Dumortier M., De Bruyn L., Hens M., Peymen J., Schneiders A., Van Daele, T. & Van Reeth W. (red.) Natuurverkenning 2030. Natuurrapport Vlaanderen (NARA), Instituut voor Natuur- en Bosonderzoek (INBO), 2009.
EPA, US Methane emissions 1990 – 2020: inventories, projections, and opportunities for reductions, September 1999.
6
List of references
FAO, Global estimates of gaseous emissions of NH3, NO and N2O from agricultural land, 2001.
Federaal Planbureau, Bevolkingsvooruitzichten 2010-2060, december 2011.
Federatie Voedingsindustrie (Fevia), Duurzaamheidsverslag van de Belgische voedingsindustrie, 2011.
FOD Economie, Middenstand, KMO en Energie, Kerncijfers Landbouw, 2011.
France Nature Environnement, Gaspillage alimentaire : opération “coaching”, Mai 2012.
Henning Lyngsø F., Flotats X., Bonmati Blasi A., Palatsi J., Magri A., Schelde K.M., Inventory of manure processing activities in Europe, European Commission, Directorate-General Environment, 2011.
Jakobsson C., Sommer E.B., De Clercq P., Bonazzi G., Schröder J., The policy implementation of nutrient management legislation and effects in some European Countries, A presentation held on 18th April 2002 in Gent, Belgium at the final Workshop of the EU concerted action Nutrient Management Legislation in European Countries NUMALEC, April 2020.
7

List of references
Kuikman P., J., van den Akker J.J.H., de Vries F., Emissie van N2O en CO2 uit organische landbouwbodems, Alterra, 2005.
Lemmens B., Ceulemans J., Elslander H., Vanassche S., Brauns E. en Vrancken K., Beste Beschikbare Technieken (BBT) voor mestverwerking, VITO, november 2006.
McKinsey & company, Pathways to low carbon economy, Version 2 of the Global Greenhouse Gas Abatement Cost Curve, 2009.
OECD-FAO, Agricultural Outlook 2011-2020, 2011.
Overloop S., Gavilan J., Carels K., Van Gijseghem D., Hens M., Helming J., Wetenschappelijk rapport, MIRA 2009 & NARA 2009, Landbouw, VMM & INBO, december 2009.
Reay D.S, Davidson A.D., Smith K.A., Smith P., Melillo J.M., Dentener F., Crutzen P.J., Global agriculture and nitrous oxide emissions, Review Article Nature,published online 13 May 2012.
8
List of references
United Nations General Assembly, Report submitted by the Special Rapporteur on the right to food, Olivier De Schutter, 20 December 2010.
Vanacker K., Pante J., Jacobs S., Demolder L., Maes G., Voortgangsrapport 2011 – Anaerobe vergisting in Vlaanderen, Biogas-E vzw, 2012.
Vlaams Coördinatiecentrum Mestverwerking (VCM), Enquête operationele stand van zaken mestverwerking in Vlaanderen 2010, juli 2011.
Vlaamse Landmaatschappij (VLM), Mestbank 2010 - over het mestbeleid in vlaanderen, 2010.
Wustenbergh H., Milieurapport Vlaanderen (MIRA) – Achtergronddocument Sector Landbouw, VMM, februari 2009.
9

Consulted websites
http://www.belgium.be/nl/gezondheid/gezond_leven/voeding/nationaal_plan (Nationaal Voedingsplan)
http://www.chaireeconomieduclimat.org/?page_id=1705&lang=en (workshop “Developments in Agriculture and Forestry, towards a low carbon society”)
http://www.fao.org/save-food/save-food-home/en/ http://www.wwf.org.uk/how_you_can_help/change_how_you_live/think_about_what_you_eat/
http://www.ipcc-nggip.iges.or.jp/public/gp/english/ (Good Practice Guidance and Uncertainty Management in National
Greenhouse Gas Inventories)
http://statbel.fgov.be/nl/modules/pressrelease/statistieken/economie/recensement_agricole_de_mai_2010.jsp (Landbouwtelling 2010)
http://www.vlam.be/facts/
http://www.vlm.be/landtuinbouwers/mestbank/aangifte/voeders/Pages/default.aspx
http://www.vlm.be/landtuinbouwers/mestbank/aanwendenvanmest/bemestingsnormen/Pages/default.aspx
10

Content – Agriculture sector
11
▪ Summary and references
▪ Context and historical trends
▪ Methodology
▪ Details of the ambition levels and costs per lever
▪ Barriers to reduce CH4 and N2O
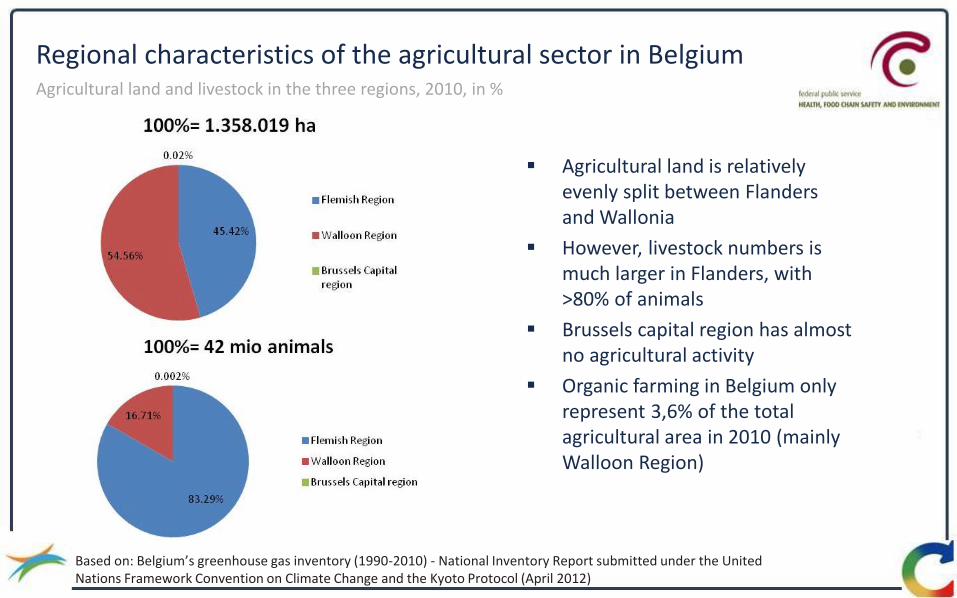
Regional characteristics of the agricultural sector in Belgium
Agricultural land is relatively evenly split between Flanders and Wallonia
However, livestock numbers is much larger in Flanders, with >80% of animals
Brussels capital region has almost no agricultural activity
Organic farming in Belgium only represent 3,6% of the total agricultural area in 2010 (mainly Walloon Region)
Based on: Belgium’s greenhouse gas inventory (1990-2010) - National Inventory Report submitted under the United Nations Framework Convention on Climate Change and the Kyoto Protocol (April 2012)
Agricultural land and livestock in the three regions, 2010, in %

In 2009 agriculture represented ca. 50% of total land used in Belgium
In 2009 agriculture represented ca. 50% of total land used in Belgium
Additionally, land used for agriculture decreased with 6% in the period 2000 and 2009
In densely populated areas the competition for land increases
Source: FOD Economie, Middenstand, KMO en Energie, Kerncijfers Landbouw 2011
Land used in Belgium, 2009, in %
100%= 30.333 km²
Forests 23%
Constructed 20%
Others 7%
Agriculture 34%
Permanent grasslands 16%

In 2010 grassland, grains and maize represent ca. 75% of agricultural land in Belgium
14
Based on: Belgium’s greenhouse gas inventory (1990-2010) - National Inventory Report submitted under the United Nations Framework Convention on Climate Change and the Kyoto Protocol (April 2012)
Types of cultivation in Belgium, 2010, in %
Out of the ~50% land used for agriculture and livestock in 2010, a third is grassland
Together with grains and maize, they represent 75% of land dedicated to agriculture and livestock
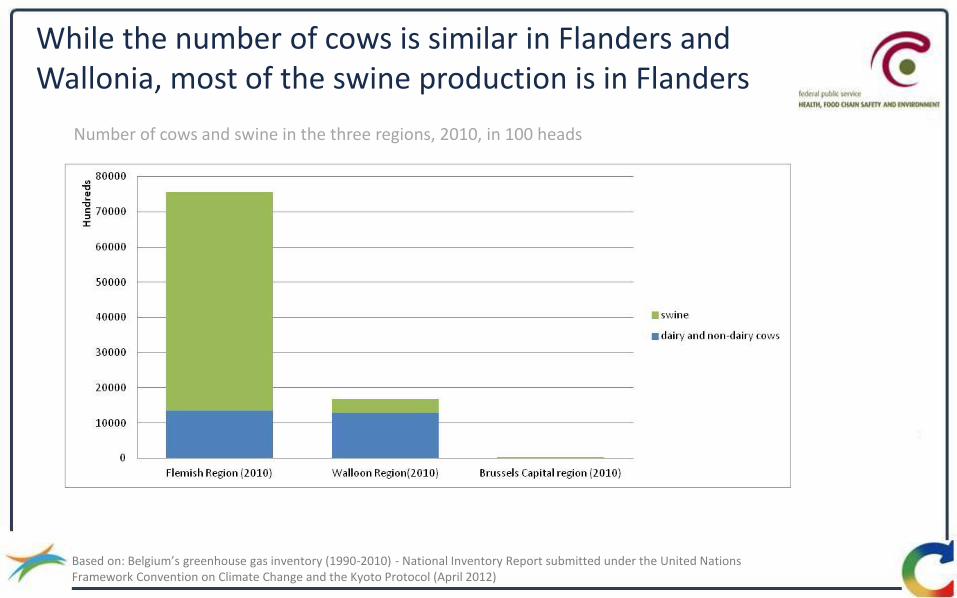
While the number of cows is similar in Flanders and Wallonia, most of the swine production is in Flanders
Based on: Belgium’s greenhouse gas inventory (1990-2010) - National Inventory Report submitted under the United Nations Framework Convention on Climate Change and the Kyoto Protocol (April 2012)
Number of cows and swine in the three regions, 2010, in 100 heads
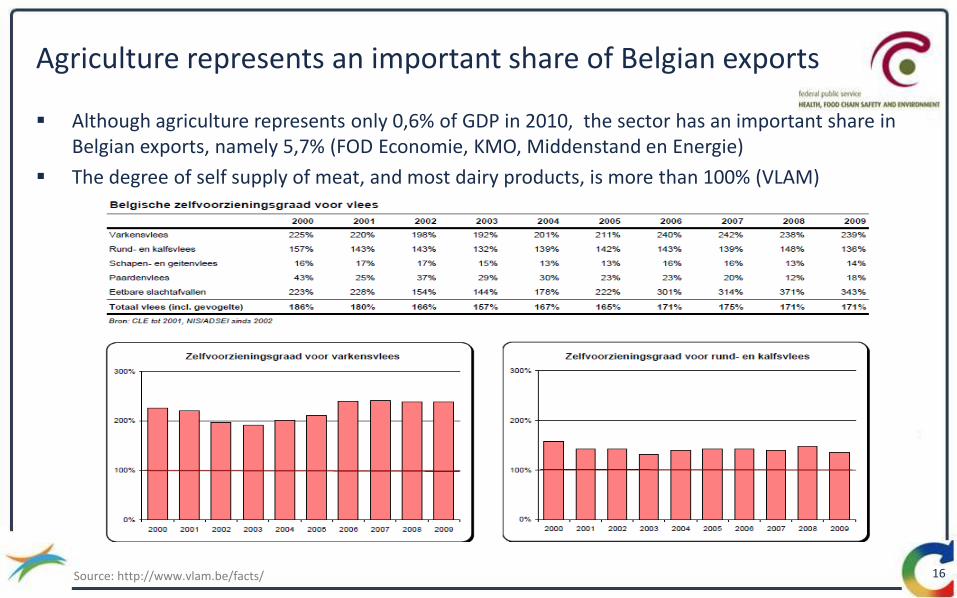
Agriculture represents an important share of Belgian exports
Although agriculture represents only 0,6% of GDP in 2010, the sector has an important share in Belgian exports, namely 5,7% (FOD Economie, KMO, Middenstand en Energie)
The degree of self supply of meat, and most dairy products, is more than 100% (VLAM)
16 Source: http://www.vlam.be/facts/

Agriculture represents ~8% of the emissions in 2010
17 Source: Belgium GHG emissions inventory, Climact
25%
18%
18%
8%
Agriculture and waste (incl. LULUCF)
Industry (combustion)
Power generation
20%
Buildings Industry (processes)
Transport
Others
1%
10%
GHG emissions in Belgium, 2010, %
100% = 131,4 MtCO2e ▪ 4 main sectors emit ~90% of emissions in relatively equal shares
− Power generation
− Industry with combustion and processes
− Buildings
− Transport
▪ Agriculture and waste make up the remaining 8%

In 2010 non combustion emissions of agriculture in Belgium amount to 10 Mt CO2 equivalents
In 2010 ca. 40% of these emissions are originating from N2O emissions from soil
As enteric fermentation and agricultural soils are concerned, Wallonia and Flanders represent an equal share in GHG-emissions (i.e. 50% of total CO2 equivalents)
As manure management is concerned Flanders represents a share of ca. 78% of total CO2 equivalents
Based on: Belgium’s greenhouse gas inventory (1990-2010) - National Inventory Report submitted under the United Nations Framework Convention on Climate Change and the Kyoto Protocol (April 2012)
Non combustion GHG emissions of agriculture in Belgium, 2010, in %
18

N2O and CH4 emissions of agriculture in Belgium decreased with ca. 15% in the period 1990 - 2010
CH4 emissions from enteric fermentation decreased due to: − general livestock reduction − shift from dairy cows to brood cows (lower
emissions), i.e. general EU trend linked to the Common Agriculture Policy
CH4 and N2O emissions manure management decreased due to: − decline of swine livestock
N2O emissions from soil decreased due to: − smaller quantities of nitrogen from mineral
fertiliser applied − livestock reduction (reduction of nitrogen
excreted on pasture)
Source: Belgium’s greenhouse gas inventory (1990-2010) - National Inventory Report submitted under the United Nations Framework Convention on Climate Change and the Kyoto Protocol (April 2012) 19
10
12
1990 2010
-15%

Content – Agriculture sector
20
▪ Summary and references
▪ Context and historical trends
▪ Methodology
▪ Details of the ambition levels and costs per lever
▪ Barriers to reduce CH4 and N2O
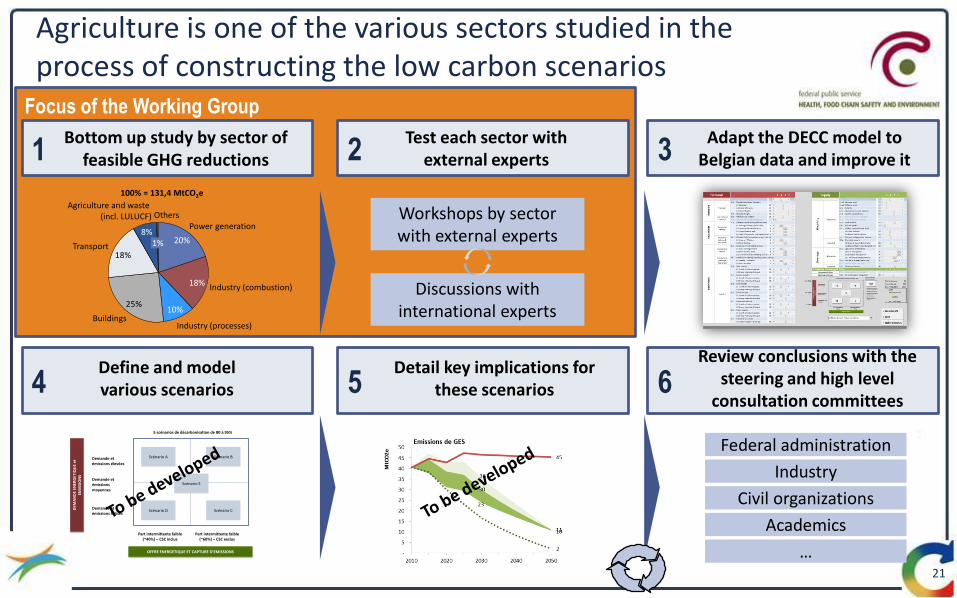
Focus of the Working Group
6 5 4
3 2 1 Adapt the DECC model to
Belgian data and improve it Test each sector with
external experts Bottom up study by sector of
feasible GHG reductions
Workshops by sector with external experts
Discussions with international experts
Review conclusions with the steering and high level
consultation committees
Federal administration
Industry
Civil organizations
Academics
Detail key implications for these scenarios
Define and model various scenarios
Agriculture is one of the various sectors studied in the process of constructing the low carbon scenarios
21
Part intermittente faible(~40%) – CSC inclus
Part intermittente faible(~60%) – CSC exclus
DEM
AN
DE
ENER
GET
IQU
E et
EMIS
SIO
NS
OFFRE ENERGETIQUE ET CAPTURE D’EMISSIONS
Demande et émissions élevées
Demande et émissions moyennes
Demande et émissions faibles
Scénario E
Scénario A Scénario B
Scénario D Scénario C
5 scénarios de décarbonisation de 80 à 95%
…
25%
18%
18%
8%
Agriculture and waste (incl. LULUCF)
Industry (combustion)
Power generation
20%
BuildingsIndustry (processes)
Transport
Others
1%
10%
100% = 131,4 MtCO2e

Cross-government engagement
Industry Workshops and Evidence
Energy and emissions Natural resources
Emissions Technology
The Open-source Prospective Energy and Emissions Roadmap Analysis tool (OPE²RA) developed in partnership with the DECC (UK) will be used to develop the scenarios
22

OPE²RA balances demand and supply based on fixed input parameters as well as modifiable levers
23
-80 to -95% GHG emissions vs. 1990

Level 4 Level 3 Level 2
4 ambition levels are defined for activity levels and emission intensity
24
Level 1
• Minimum effort (following current regulation)
• No additional efforts/policies
• What will become a « Reference scenario »
• Moderate effort easily reached according to most experts
• Equivalent to the development of recent programmes for some sectors
• Significant effort requiring cultural change and/or important financial investments
• Significant technology progress
• Maximum effort to reach results close to technical and physical constraints
• Close to what’s considered reachable by the most optimistic observer
SOURCE: DECC, Climact

• livestock growth
•yield growth
•kg N excretion per animal
•volatile solid (VS) excretion per year, per head (on a dry weight basis)
•kg N input to soils
We cover a few key topics to support the development of low CH4 and N2O scenarios for agriculture
Enteric fermentation
Manure management
Agricultural soils
Activity levels Emission intensity Abatement options
•Potential evolution of emission intensity enteric fermentation
(per animal)
•Potential evolution of emission intensity manure management (per animal, per AWMS)
•Potential evolution of total soil emissions
(direct and indirect)
• Improvement of animal breeding and husbandry
• Improvement of manure management
• Improvement of soil management
Sources of CH4 and N2O
• number of animals
• kg CH4 per animal
• kg N excretion per animal
• kg N2O-N per kg N
• kg N input to soils
• based on NIR(*)
Current data
What are the costs and practical implications?
What will the situation look like in 2020 and 2050 ?
25
What is realistic for 2050 ?
(*) Belgium’s greenhouse gas inventory (1990-2010) - National Inventory Report submitted under the UNFCC and the Kyoto Protocol (April 2012)
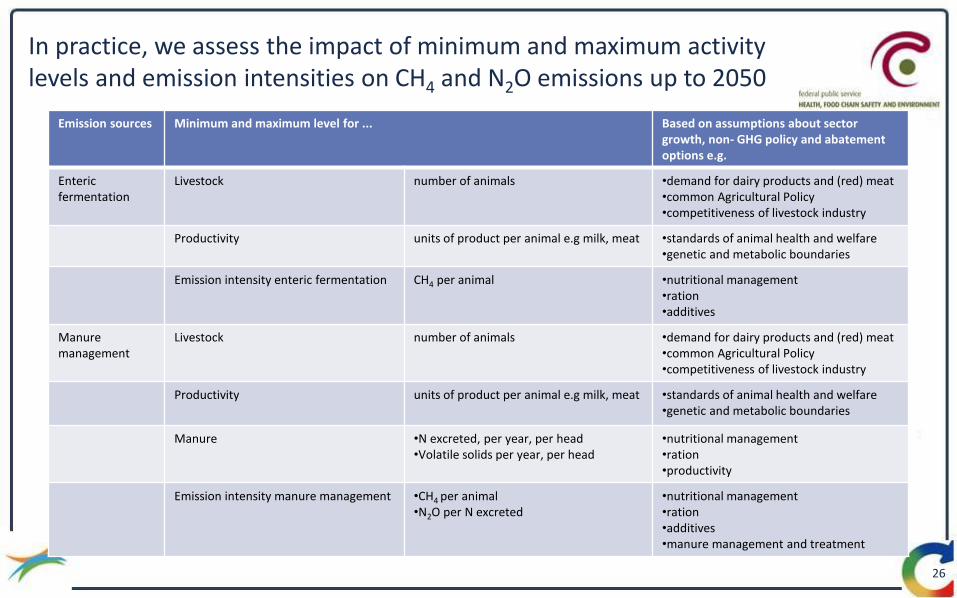
In practice, we assess the impact of minimum and maximum activity levels and emission intensities on CH4 and N2O emissions up to 2050
26
Emission sources Minimum and maximum level for ... Based on assumptions about sector growth, non- GHG policy and abatement options e.g.
Enteric fermentation
Livestock number of animals •demand for dairy products and (red) meat •common Agricultural Policy •competitiveness of livestock industry
Productivity
units of product per animal e.g milk, meat
•standards of animal health and welfare •genetic and metabolic boundaries
Emission intensity enteric fermentation
CH4 per animal •nutritional management •ration •additives
Manure management
Livestock number of animals •demand for dairy products and (red) meat •common Agricultural Policy •competitiveness of livestock industry
Productivity units of product per animal e.g milk, meat •standards of animal health and welfare •genetic and metabolic boundaries
Manure •N excreted, per year, per head •Volatile solids per year, per head
•nutritional management •ration •productivity
Emission intensity manure management •CH4 per animal •N2O per N excreted
•nutritional management •ration •additives •manure management and treatment

In practice, we assess the impact of minimum and maximum activity levels and emission intensities on CH4 and N2O emissions up to 2050
27
Emission sources Minimum and maximum level for ... Based on assumptions about sector growth, non- GHG policy and abatement options e.g.
Agricultural soils Nitrogen input •Nitrogen input from application of synthetic fertilizers •Nitrogen input from manure applied to soils •Nitrogen fixed by N-fixing crops •Nitrogen in crop residues returned to soils
•Monitoring application and comparing with crop nutrient requirement •Crops rotation •Improvement of N-utilisation to reduce N excretion
Crop production Edible crop production of N-fixing and non-N-fixing crops
•Productivity •Land use
Emission intensity kg N2O per kg N input •Improving aeration of soil •N-formation inhibitors •Improvement of soil physical conditions
Histosols Area of cultivated organic soils (ha/yr) (only Flanders) Considered constant, given slow pace of change
kg N2O per ha Considered constant, given 0,4% of direct N2O emissions in 2010

In practice, we assess the impact of minimum and maximum activity levels and emission intensities on CH4 and N2O emissions up to 2050
28
Emission sources Minimum and maximum level for ... Based on assumptions about sector growth, non- GHG policy and abatement options e.g.
Agricultural soils Pasture, Range and Paddock Manure
N excretion on pasture range and paddock •Improvement of N-utilisation to reduce N excretion
kg N2O per kg N excreted
•Reduced grazing on wet ground
Agricultural soils Atmospheric deposition, leaching run-off
Total emissions Considered constant, given direct emissions represent ca. 80% of total N2O emissions agricultural soils in 2010
Agricultural soils Sludge spreading
Total emissions Considered constant, given 0,01% of total N2O emissions agricultural soils in 2010 Already forbidden in Flanders

We focus on investment and/or operational costs of abatement options, e.g. • nutritional management • changes in ration • use of additives • good manure storage practices • precision farming We do not take into account, e.g. • subsidies and taxes, impact on farm(er) income • costs of preparing, implementing and monitoring regulation • costs of research and development, education, information campaigns • external costs
Besides the ambition levels, key parameters determining the cost of these levers are also assessed
29
General working hypothesis used for agriculture
The agriculture sector is an economic activity, which may have impact on other sectors of the economy, e.g. through the food chain or the use of land. These interrelations are not hard-coded in the model, but will be kept in mind to develop coherent scenarios
Emissions related to energy use are not discussed during the workshop
The availability of domestically sourced biomass, e.g. bio energy crops, agricultural and silvicultural by products (incl. manure, straw, woodland residues), and their potential for energy production, will be discussed during a separate workshop in September
The three sources of non combustion GHG within the agricultural sector can also interact. E.g. assumptions about productivity can have an impact on the amount of N excreted, the evolution of livestock, cropland etc.
We try to take into account these interactions when describing current status and defining the levels. However, given the scope and purpose of this study and the time horizon of 2050 we can not define and model all the parameters and variables that describe these interactions. We do not have the ambition to rebuilt existing emission or economic models such as e.g. SENTWA or SELES
30
Current emissions are based on the Belgium’s National Inventory Reporting
We used Belgium’s National Inventory Report or NIR to describe the current (and historic) emission levels of the agricultural sector in Belgium for the three emission sources, namely enteric fermentation, manure management and agricultural soils
This inventory contains greenhouse gas emission estimates for the period 1990 to 2010 for Belgium, and describes the methodology on which the estimates are based
This report and the attached Common Reporting Format (CRF) tables are compiled in accordance with UNFCCC reporting guidelines on annual inventories
The Belgian Interregional Environment Agency (CELINE - IRCEL) is responsible for integrating the emission data from the inventories of the three regions of Belgium and for compiling the national inventory

Level 1 assumptions are mainly based on the reference scenario of the Environment Outlook 2030
The Environment Outlook 2030 (MIRA, VMM) investigates how the environment in Flanders might look in a few decades
Future developments of the agricultural sector are depicted using two policy scenarios with increasing levels of ambition: − the reference scenario investigates how far the current environmental policy reaches
− the Europe scenario investigates what may be required to realise the European ambitions concerning climate change, air quality and water quality in the medium term
− we used the assumptions of the reference scenario (% evolution of e.g. productivity, livestock, N excreted) to define level 1
These policy scenarios are linked to a common set of steering variables, e.g. population growth and growth of GDP
The SELES sector model, i.e. a partial balance model for the agricultural sector, is used for the quantification of the cultivation area, cattle stock, financial total balance, soil balance and ammonia emissions
32

The reference and Europe scenario for agriculture in Environment Outlook 2030
In the reference scenario the current environmental policy (as of 1 April 2008) continues unchanged without any additional measures
− price developments and the assumed manure policy will result in a decrease of cattle stock
− landless stock-breeding of pigs and poultry may be maintained thanks to manure processing
The Europe scenario researches the effects of additional measures aimed at the European ambitions in the field of climate change, air quality and surface water quality
− agriculture succeeds in decreasing its emissions of acidifying substances and particulate matter as a result of the decrease in livestock and extra environmental measures in stock-breeding and greenhouse farming
− soil-bound cattle stock will have decreased
− landless stock-breeding may maintain its position thanks to manure processing
− agriculture contributes to the decrease of impact on the surface water by fertilizing according recommendation, by sowing winter green cover and by decreasing the livestock through government incentives
33
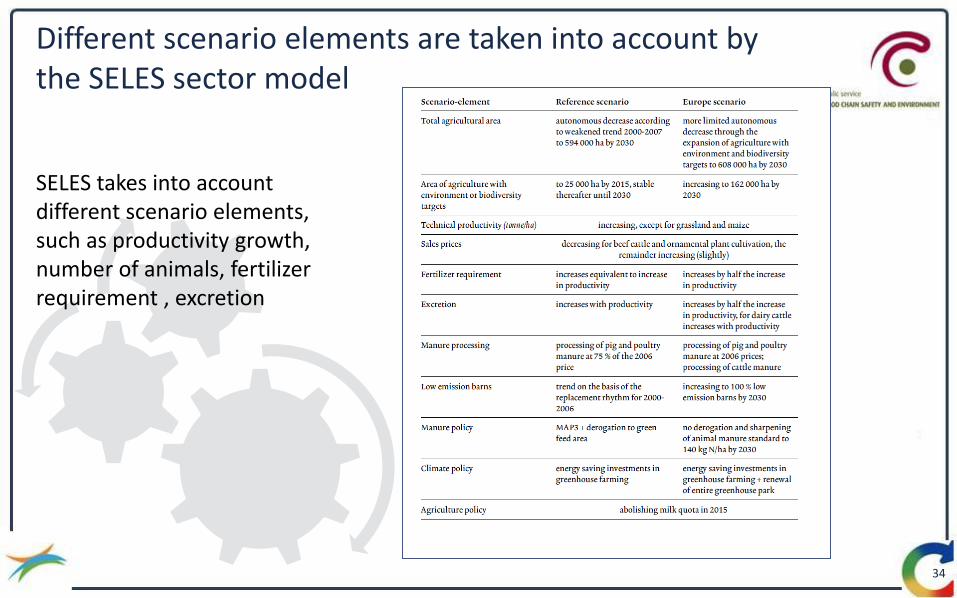
SELES takes into account different scenario elements, such as productivity growth, number of animals, fertilizer requirement , excretion
Different scenario elements are taken into account by the SELES sector model
34

Systemic approach to take into account the dynamics within and between sectors
A systemic approach takes into account dynamics within the sector and between sectors, for example, impact of agricultural scenarios on other economic sectors (food/feed processing) and on the land used (competition between food, feed, energy crops, living) but also the impact of scenarios for Belgium on greenhouse gas emissions abroad
Not all dynamics between the economic sectors are modeled explicitly in OPE²RA but the links which are not modeled will be taken into account implicitly while building consistent scenarios for the different sectors and considering consistent levels of ambition
We do not take into account “foreign” emissions related to e.g. import of food and feed such as soy. Abatement options in OPE²RA focus on the reduction of the Belgian territorial GHG emissions.
35
Systemic approach to take into account the dynamics within and between sectors
Level 1 assumptions take into account the dynamics within the agricultural sector and competition for land up to 2030 − these assumptions are based on “Environmental (Nature) Outlook 2030” (% evolutions and not absolute
numbers) as the scenarios defined in this outlook are build up in a consistent way and are the result of models that take into account the interactions within the agricultural sector up to 2030
− these scenarios also take into account competition for land up to 2030
Level 4 assumptions could not be based on the results of such models; as such interactions within agricultural sector and impact on land used can not be quantified. However, some general assumptions can be made that take into account (some of) these interactions in a qualitative way − as current productivity level are already high, we assume they will reach its peak in 2030
− there is limited potential for emission reduction by implementing technical measures and maximum potential will be reached in 2030
− after 2030 reorientation of the agricultural system (new “business models”) and changes of consumer behavior are needed if we want to reduce the emissions of the agricultural sector further
these shifts of paradigms and changes will take time and choices will have to be made
e.g. the United Nations’ report on the right to food (20/12/2010) promotes reorientation of the agricultural system towards modes, such as agroecology, that are highly productive, highly sustainable and contribute to the progressive realisation of the human right to adequate food; the report focuses primarily on the poor, food-deficit countries or small-scall farmers in developing countries
36
Content – Agriculture sector
37
▪ Summary and references
▪ Context and historical trends
▪ Methodology
▪ Details of the ambition levels and costs per lever
▪ Barriers to reduce CH4 and N2O

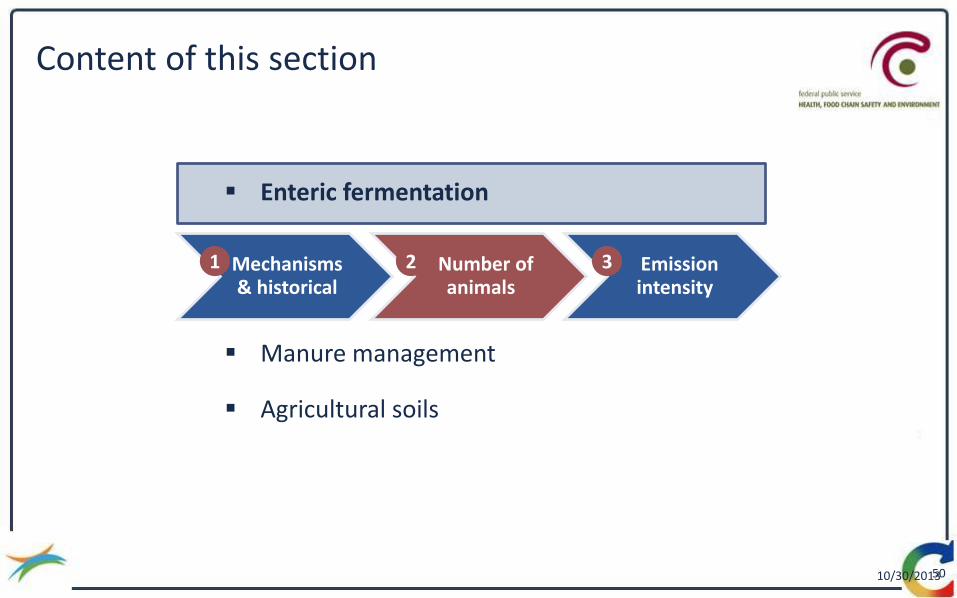
Content of this section
38 10/30/2013
Enteric fermentation
Manure management
Agricultural soils
Mechanisms & historical
Number of animals
Emission intensity
1 2 3
Enteric fermentation – emission mechanisms
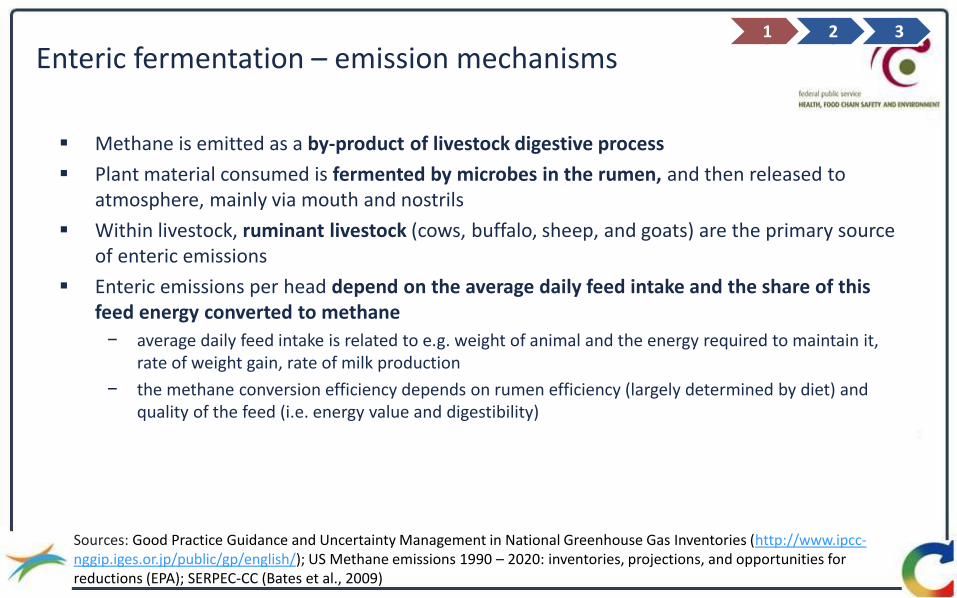
Methane is emitted as a by-product of livestock digestive process
Plant material consumed is fermented by microbes in the rumen, and then released to atmosphere, mainly via mouth and nostrils
Within livestock, ruminant livestock (cows, buffalo, sheep, and goats) are the primary source of enteric emissions
Enteric emissions per head depend on the average daily feed intake and the share of this feed energy converted to methane
− average daily feed intake is related to e.g. weight of animal and the energy required to maintain it, rate of weight gain, rate of milk production
− the methane conversion efficiency depends on rumen efficiency (largely determined by diet) and quality of the feed (i.e. energy value and digestibility)
Sources: Good Practice Guidance and Uncertainty Management in National Greenhouse Gas Inventories (http://www.ipcc-nggip.iges.or.jp/public/gp/english/); US Methane emissions 1990 – 2020: inventories, projections, and opportunities for reductions (EPA); SERPEC-CC (Bates et al., 2009)
1 2 3
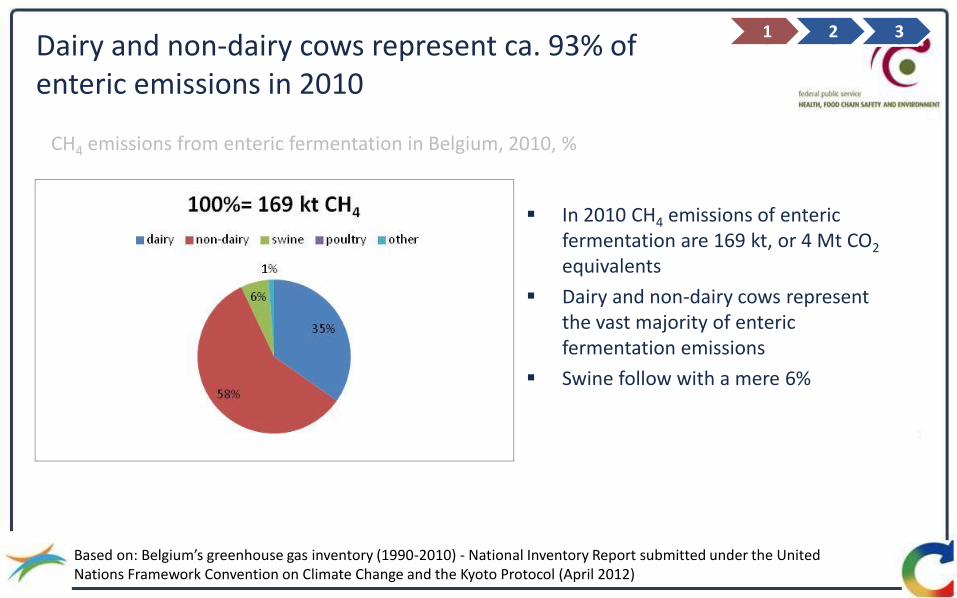
Dairy and non-dairy cows represent ca. 93% of enteric emissions in 2010
In 2010 CH4 emissions of enteric fermentation are 169 kt, or 4 Mt CO2 equivalents
Dairy and non-dairy cows represent the vast majority of enteric fermentation emissions
Swine follow with a mere 6%
Based on: Belgium’s greenhouse gas inventory (1990-2010) - National Inventory Report submitted under the United Nations Framework Convention on Climate Change and the Kyoto Protocol (April 2012)
CH4 emissions from enteric fermentation in Belgium, 2010, %
1 2 3

Enteric emissions have decreased by ca. 14% between 1990 - 2010
In 2010 the CH4 emissions declined with 14% compared to 1990
CH4 emissions per animal are constant over the period 1990 – 2010, with exception of dairy cows Flanders: from 98 kg CH4 per
head in 1990 to 135 kg CH4 per head in 2010
Wallonia: from 99,8 kg CH4 per head in 1990 to 115,3 kg CH4 per head in 2009
Based on: Belgium’s greenhouse gas inventory (1990-2010) - National Inventory Report submitted under the United Nations Framework Convention on Climate Change and the Kyoto Protocol (April 2012)
1 2 3
Evolution of enteric emissions in Belgium, 1990 - 2010, in kt CH4
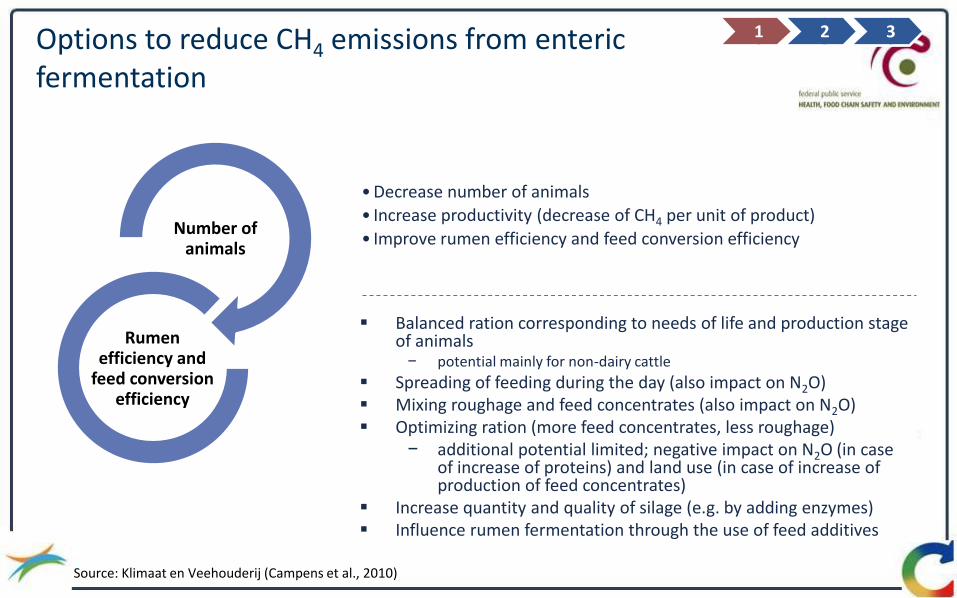
Options to reduce CH4 emissions from enteric fermentation
1 2 3
Number of animals
Rumen efficiency and
feed conversion efficiency
Balanced ration corresponding to needs of life and production stage of animals − potential mainly for non-dairy cattle
Spreading of feeding during the day (also impact on N2O) Mixing roughage and feed concentrates (also impact on N2O) Optimizing ration (more feed concentrates, less roughage)
− additional potential limited; negative impact on N2O (in case of increase of proteins) and land use (in case of increase of production of feed concentrates)
Increase quantity and quality of silage (e.g. by adding enzymes) Influence rumen fermentation through the use of feed additives
• Decrease number of animals
• Increase productivity (decrease of CH4 per unit of product)
• Improve rumen efficiency and feed conversion efficiency
Source: Klimaat en Veehouderij (Campens et al., 2010)

Maximum reduction of meat consumption with ca. 53% based on a healty and balanced diet
Consumption level (2004)
Healthy and balanced diet
Consumption level (2004)
Healthy and balanced diet
Consumption of meat Population growth
Number of animals
Meat, fish, eggs and meat subtitues
(in grams per day per capita)
Meat (in grams per day per capita)
% evolution (2010 – 2050)
% evolution (2010 – 2050)
% evolution (2010 – 2050)
160 75 121 57 -53% +21% -43%
43
consumption population animals
Based on the information found about the current and balanced consumption of meat and the assumptions made in the previous slide we can define a 4 ambition level for livestock evolution
Level 4

Potential for reducing emissions through human dietary changes
In “Global agriculture and nitrous oxide emissions” (Reay et al., review article for Nature published on line 13/05/2012) the authors indicate that:
− any apparent reduction in emissions observed with decrease in per capita poultry, pig or sheep meat consumption in developed world diets must be set against any resultant increases in consumption of other foodstuffs
− potential for emission reduction through complete avoidance of food loss and wastage will inevitably vary depending on food type, stages in the supply chain and location (see also illustration of FAO)
− substantial emission reductions along the supply chain seem possible by addressing distribution and consumer-phase wastage
− future studies should explore the drivers of national-scale dietary change and food wastage in more depth to help identify interventions that would reduce average dietary emissions intensity and highlight points in the supply chain where the most effective waste reductions can be made
44 Source: http://www.fao.org/save-food/save-food-home/en/
Publications of FAO and regional or national organisations in France and UK seem to indicate that there is a (large?) potential for reducing GHG emissions of the agricultural sector, by changing diets and/or reducing spillage of food

Potential for reducing emissions through human dietary changes
Currently, there are no figures available for Belgium about the amount of food lost and wasted, with a clear distinction between the edible and non-edible part for the different food types and different stages of the supply chain
OVAM has almost finished a study that gives an indication of the amount of food lost and wasted in Flanders (publication end of July) − draft results show that no general figure can be put on the amount of food lost and wasted in Flanders as
the degree of accuracy and level detail of the calculations differ between food types and the different stages of the supply chain
In Flanders food loss and waste is valorised as food, feed, fertilizers and source of energy (deposit of food waste on landfills is forbidden)
Attention has to be paid in comparing data on food losses and waste between different countries/cultures due to differences in definition/calculation method of waste and losses during the different stages of supply chain and for different food stuffs, e.g. evitable versus non-evitable part of food losses and waste is highly culture related
We want to acknowledge that consumption is not necessarily an end in itself but can be a way to fulfill needs which fosters physical, psychical and relational well being; this can be a potential barrier for realising the reduction potential related to dietary changes
45

Potential for reducing emissions through human dietary changes
A shift towards a healthier and balanced diet implies eating more vegetables and fruit, eating less meat and exercise more
We focus on the consumption of meat as changes have a direct impact on the greenhouse gas emissions we deal with in this study
The national food plan indicates that a healthy diet consists of 75 à 100 grams of meat, fish, eggs (and meat substitutes) per day per capita
46 Source: http://www.belgium.be/nl/gezondheid/gezond_leven/voeding/nationaal_plan

Potential for reducing emissions through human dietary changes
According to FAO ca. 82 kilograms of meat is consumed per capita per year in Belgium; as consumption is expressed as gross weight this figure is an overestimation of real consumption (Source: http//www.vilt.be)
Most recent information about (real) consumption of meat in Belgium is based on the survey of the Belgian scientific institute of health (Source: Belgische voedselconsumptiepeiling 2004)
− In 2004, we consumed on average, ca. 160 grams per day per capita of meat, fish and eggs was consumed
− If we only look at meat, ca. 121 grams per day per capita was consumed in 2004 or 75% of total consumption of meat, fish, eggs and meat substitutes
If we assume that we will eat only 75 grams, this implies eating ca. 53% less meat or ca. 57 grams per day per capita, if we assume the same distribution between meat, fish and eggs as in 2004
47

We do not model changes in consumer behaviour explicitly for the agricultural sector We do not model changes in consumer behaviour explicitly as this is not a straightforward exercise
− the agricultural sector in Belgium is the first step in the supply chain of food and to a customer worldwide
− in 2010 the Belgian food industry generated ca. 50% of its turnover through export (ca. 70% of this export went to our neighbouring countries)
− although this share has declined the past two years, the Belgian food industry is more explicitly export oriented, in comparison to some other industrial sectors in Belgium
Turnover realised by the food industry in Belgium through export, % of total turnover
− e.g. 90% of the potatoes processed in Belgium is exported; also the meat industry exports a large share of its production
− 4 out of ten food stuffs in a Belgian store are imported
48
(Source: Duurzaamheidsverslag van de Belgische voedingsindustrie 2011)

We model changes in consumer behaviour implicitly by “translating” it to changes of numbers of animals and N input into soils
We focus on the consumption of meat as changes as changes have a direct impact on the emission levels of the agricultural sector that we deal with in this exercise
We assume that in the countries that import Belgian meat, also less meat will be consumed; reduction of consumption follows the same pace as in Belgium, namely -50% between 2010 in 2050
We take into account an increase of the Belgian population with ca. 21% between 2010 and 2050 (Source: Bevolkingsvooruitzichten 2010-2060, federaal planbureau, december 2011), and therefore assume a similar population increase abroad
A reduction of livestock will most likely have an impact on the agricultural land used for feed and amount of grassland needed for grazing animals
We model changes in consumer behaviour by “translating” it to changes of activity levels
49
Content of this section
50 10/30/2013
Enteric fermentation
Manure management
Agricultural soils
Mechanisms & historical
Number of animals
Emission intensity
1 2 3
Defining levels for enteric fermentation
In OPE²ERA future emissions of enteric fermentation are determined by multiplying number of animals and an emission factor per head or per animal − so assumptions about level 1 and level 4 have to focus on the evolution of the number of animals on the one hand
and the amount of CH4 emissions per animal (emission intensity) on the other hand
− we make a distinction between following animal categories: dairy and non-dairy cows, poultry, swine and other
Minimum and maximum levels of future livestock take into account assumptions about productivity growth, land available for agriculture, demand for food − e.g. productivity increases and demand for meat and dairy products stays the same, number of animals can
decrease. If land available for agriculture declines than the number of soil bounded animals will probably decrease (first)
51
1 2 3
Level 1 assumptions about evolution of livestock are based on
evolution of livestock in the (recent) past
projections made as part of the communication of Belgium under the United Nations Framework Convention on Climate Change and the Kyoto Protocol
Environment Outlook 2030 (VMM, 2009)
but also FAO/OECD Agricultural Outlook projections about population growth by the federal planning bureau to get an indication of the future demand for food
1 2 3
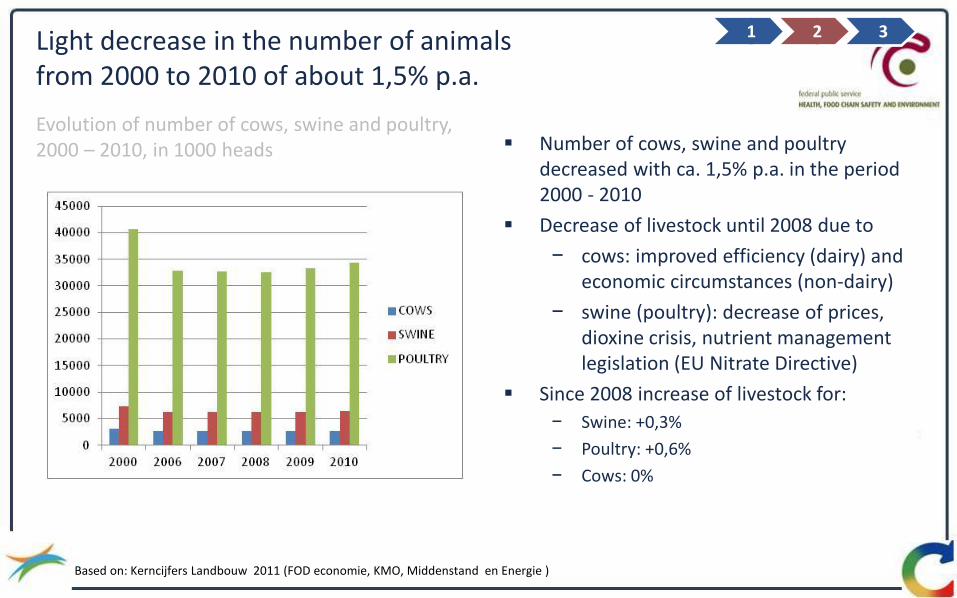
Number of cows, swine and poultry decreased with ca. 1,5% p.a. in the period 2000 - 2010
Decrease of livestock until 2008 due to
− cows: improved efficiency (dairy) and economic circumstances (non-dairy)
− swine (poultry): decrease of prices, dioxine crisis, nutrient management legislation (EU Nitrate Directive)
Since 2008 increase of livestock for:
− Swine: +0,3%
− Poultry: +0,6%
− Cows: 0%
Evolution of number of cows, swine and poultry, 2000 – 2010, in 1000 heads
Light decrease in the number of animals from 2000 to 2010 of about 1,5% p.a.
1 2 3
Based on: Kerncijfers Landbouw 2011 (FOD economie, KMO, Middenstand en Energie )

2 sources highlight potential evolutions of the number of animals up to 2020 or 2030
Animal categories Belgium Flemish Region
Sources of information
Belgian’s Fifth
National Communication Climate Change
under the UNFCC (2009)
Milieuverkenning 2030 (VMM, 2009)
REF EU
(%p.a. up to 2020) (%p.a. up to 2030)
poultry 1% 0.1% -0.1%
swine 0.3% 0.1% -0.04%
non dairy -1% -0.6% -1%
dairy 2% 2% -1%
other 0%
1 2 3
All sources assume that the number of non-dairy cows is expected to decline
Belgian GHG projections 2020 (UNFCC) and the Reference scenario (REF) of Milieuverkenning 2030 assume an increase of the number of animals, with exception of non-dairy
The European scenario (EU) of Milieuverkenning 2030 assumes an overall decrease of the number of animals due to more stringent nutrient management policy

OECD/FAO Agricultural outlook to 2020 shows growth in meat production, but mainly from productivity gains
World meat production growth is anticipated to slow to 1.8% p.a.
Growth is primarily driven by productivity gains from both larger economies of scale and technical efficiency gains, notably for poultry and pig meat in developing countries
After the 2015 quota abolition, milk production is expected to continue growing by 0,3% annually in the EU but EU milk deliveries are projected to remain below the expired quota level even in 2020 (due to increased production costs)
1 2 3

Belgian population is expected to grow with ca. 21% between 2010 and 2050
Source: Bevolkingsvooruitzichten 2010-2060, federaal planbureau, december 2011
If we assume that in 2050 the same amount of meat is consumed per capita, per year as in 2009, we need (at least)
− ca. 527 kt meat from swine or ca. 51% of the domestic production in 2009 to feed ca. 13 mio people
− ca. 237 kt meat from cows or ca. 91% of the domestic production in 2009 to feed ca. 13 mio people
Also (European) global population will increase and Belgium is currently net exporter of meat and most dairy products (Source: VLAM)
Source: VLAM
1 2 3
Level 1 assumptions about evolution of livestock
Evolution of livestock is based on the reference scenario of Milieuverkenning 2030 and takes into account interactions between different steering variables :
− impact of (current) agricultural and nutrient management policy and legislation
− decrease of land used for agriculture due to increased competition between sectors (cf. agricultural soils)
− autonomous increase of productivity, i.e. ↗ kg milk per cow or meat per animal
But also in line with GHG projections for Belgium under UNFCC (2009) and evolution of livestock since 2008
Livestock increase is evenly spread over the period 2010 - 2030
Evolution of livestock up to 2030 is assumed to flatten out in the period 2030 – 2050, due to e.g.
− limitations in manure application on land and manure treatment
− increased competition for land
For the “other” animal categories a zero growth scenario is assumed for each level
1 2 3

Level 4 assumptions about evolution of livestock
Total number of livestock decreases with 1,4% per year or total livestock decreases with ca. 43% in 2050 compared to 2010
Based on assumptions about consumption of meat cf. slide 43 - 44
Given the fact that the Belgian population will grow with ca. 21% between 2010 and 2050 and a global population growth (with increasing demand for food), the reduction of livestock assumed will probably have an impact on what kind of meat and how much meat we eat
The ambition level is higher than Europe scenario of Milieuverkenning 2030 (VMM) that is aimed at reaching mid term European targets of e.g. the European Water framework Directive
The assumed evolution of livestock “eliminates’” growth of productivity
Decrease of livestock is evenly spread over the period 2010 – 2050
1 2 3
Evolution of livestock up to 2050
59 59
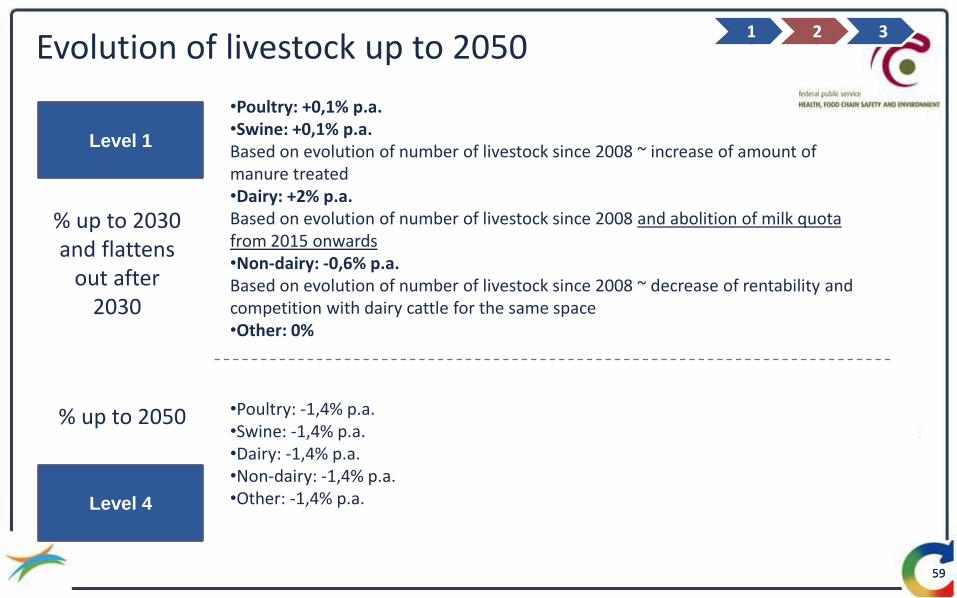
Level 1
•Poultry: +0,1% p.a. •Swine: +0,1% p.a. Based on evolution of number of livestock since 2008 ~ increase of amount of manure treated •Dairy: +2% p.a. Based on evolution of number of livestock since 2008 and abolition of milk quota from 2015 onwards •Non-dairy: -0,6% p.a. Based on evolution of number of livestock since 2008 ~ decrease of rentability and competition with dairy cattle for the same space •Other: 0%
Level 4
•Poultry: -1,4% p.a. •Swine: -1,4% p.a. •Dairy: -1,4% p.a. •Non-dairy: -1,4% p.a. •Other: -1,4% p.a.
% up to 2030 and flattens
out after 2030
1 2 3
% up to 2050

Content of this section
60 10/30/2013
Enteric fermentation
Manure management
Agricultural soils
Mechanisms & historical
Number of animals
Emission intensity
1 2 3
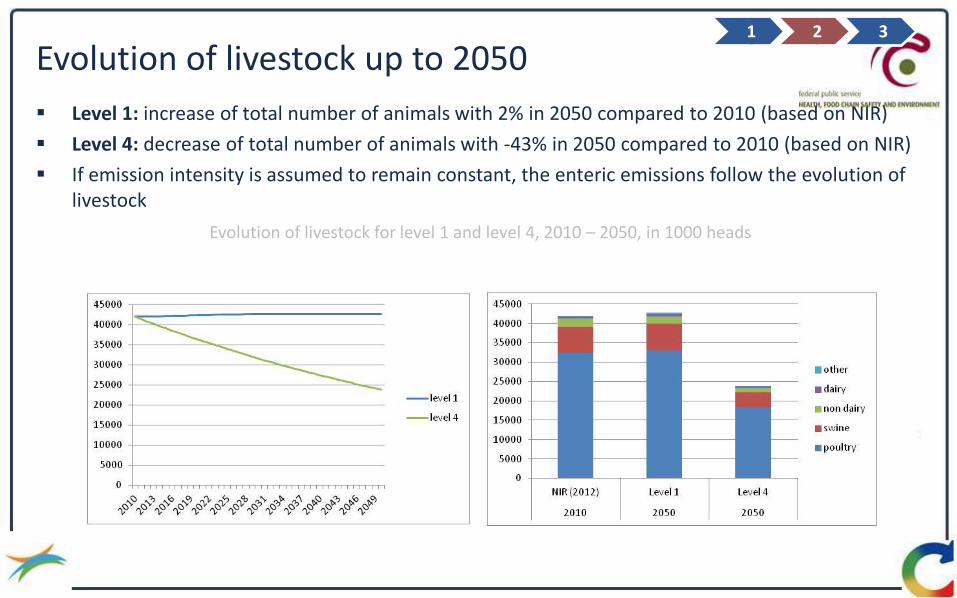
Evolution of livestock up to 2050
Level 1: increase of total number of animals with 2% in 2050 compared to 2010 (based on NIR)
Level 4: decrease of total number of animals with -43% in 2050 compared to 2010 (based on NIR)
If emission intensity is assumed to remain constant, the enteric emissions follow the evolution of livestock
1 2 3
Evolution of livestock for level 1 and level 4, 2010 – 2050, in 1000 heads
Evolution of enteric emissions per animal up to 2050
10/30/2013 62 62
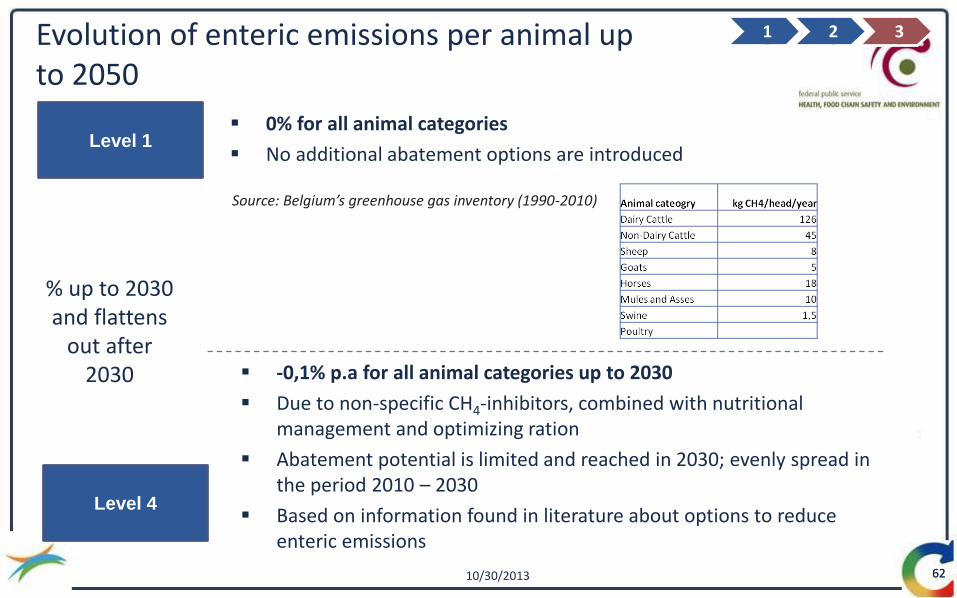
Level 1 0% for all animal categories
No additional abatement options are introduced
Level 4
-0,1% p.a for all animal categories up to 2030
Due to non-specific CH4-inhibitors, combined with nutritional management and optimizing ration
Abatement potential is limited and reached in 2030; evenly spread in the period 2010 – 2030
Based on information found in literature about options to reduce enteric emissions
Source: Belgium’s greenhouse gas inventory (1990-2010)
1 2 3
% up to 2030 and flattens
out after 2030

Information found in literature about options to reduce enteric emissions
1 2 3
Source Information about reduction potential
SERPEC-CC (Batens et al., 2009)
adding oils or oilseeds to the diet: 7% reduction of CH4 replacement of roughage by concentrates: 10% reduction of CH4
long term management changes and use of genetic resources: 5% reduction of CH4
Klimaat en veehouderij (Campens et al., 2010)
decrease of CH4 between 10% and 20% possible in case of non-specific CH4-inhibitors, combined with nutritional management and optimizing ration, focus on cattle feeded with roughage ànd feed concentrates -150 kton CO2eq p.a, up to 2020 (-10% in 2020)
Calculator 2050 (DECC, UK)
decrease of emission intensity between 0.1% and 0.4% p.a. (2008 – 2050) due to improved animal breeding and husbandry
Pathways to low carbon economy (McKinsey & company, 2009)
increased use of livestock feed supplements: 8% - 15% reduction in 2030 use of vaccines propionate precursors: 10% - 15% reduction in 2030
Economic Evaluation of Emission Reductions of Nitrous Oxides and Methane in Agriculture in the EU (AEAT, 2001)
Belgium can reduce CH4 emissions enteric fermentation by optimizing ration with 3% in 2010

Level 1: enteric emissions increase with 11% compared to 2010 , due to increase in livestock
Level 4: enteric emissions decrease with 44% compared to 2010, due to decrease in livestock and the implementation of abatement options
Enteric emissions in 2050 for level 1 and level 4 assumptions, compared to 2010
Emissions from enteric fermentation in Belgium, 2010 and 2050, kt CH4
1 2 3

Costs of (technical) abatement options
Abatement option Euro per ton CO2eq Source
adding oil and oil seeds - dairy 137 SERPEC-CC (Baetens et al., 2009)
adding oil and oil seeds - non dairy 262 SERPEC-CC (Baetens et al., 2009)
replacement of roughage by concentrates - dairy 1222 SERPEC-CC (Baetens et al., 2009)
replacement of roughage by concentrates – non dairy 2338 SERPEC-CC (Baetens et al., 2009)
feeding strategy, ration and additives limited Klimaat en veehouderij (Campens et al., 2010)
increased use of feed supplements 14 to 79 Pathways to a low carbon economy (McKinsey,2009)
use of vaccines (propionate precursors) -128 to 65 Pathways to a low carbon economy (McKinsey,2009)
1 2 3
Based on the study of the Flemish Administration of Agriculture and Fishery, we consider costs of abatement options (feeding strategy, ration, additives) to be negligible and are set equal to 0

Content of this section
66
Enteric fermentation
Manure management
Agricultural soils
Mechanisms & historical
Amount of manure excreted
Emission intensity
1 2 3
Manure management – CH4 emission mechanisms
Methane is the result of anaerobic decomposition of livestock manure
Amount of manure produced varies by animal type and is proportional to animal’s weight
CH4-production potential and amount of manure produced depends on
− amount of feed, composition and digestibility of the animal diet
− type of animal waste management system (AWMS)
− climate
Majority of methane emissions come from large, swine (hog) and dairy farms that manage manure as a liquid
Manure is collected and stored until it can be applied to cropland or transported for manure treatment; during storage, the submerged manure generates methane
1 2 3
67
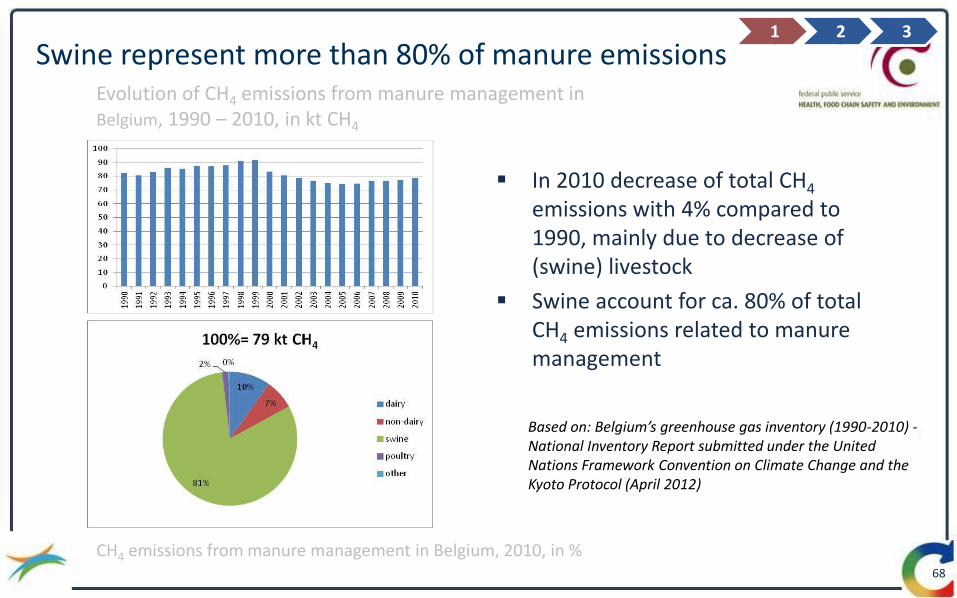
Swine represent more than 80% of manure emissions
In 2010 decrease of total CH4 emissions with 4% compared to 1990, mainly due to decrease of (swine) livestock
Swine account for ca. 80% of total CH4 emissions related to manure management
Based on: Belgium’s greenhouse gas inventory (1990-2010) - National Inventory Report submitted under the United Nations Framework Convention on Climate Change and the Kyoto Protocol (April 2012)
Evolution of CH4 emissions from manure management in Belgium, 1990 – 2010, in kt CH4
CH4 emissions from manure management in Belgium, 2010, in %
1 2 3
68

Manure management – N2O emission mechanisms
N2O emissions are produced as part of the nitrogen cycle through nitrification and denitrification of organic nitrogen compounds in manure and urine
Direct N2O emissions from livestock manure depend on composition of manure and urine, the type of bacteria involved in the process, and the amount of oxygen and liquid in the manure system
Liquid (slurry) management systems use water to facilitate manure handling e.g. concrete tanks to store flushed and scraped manure
− these systems have low N2O emissions but high CH4 emissions
Dry systems include solid storage, dry feedlots, deep pit stacks, and daily spreading of the manure
− N2O emissions from unmanaged manure from animal grazing cf. agricultural soils
1 2 3
69
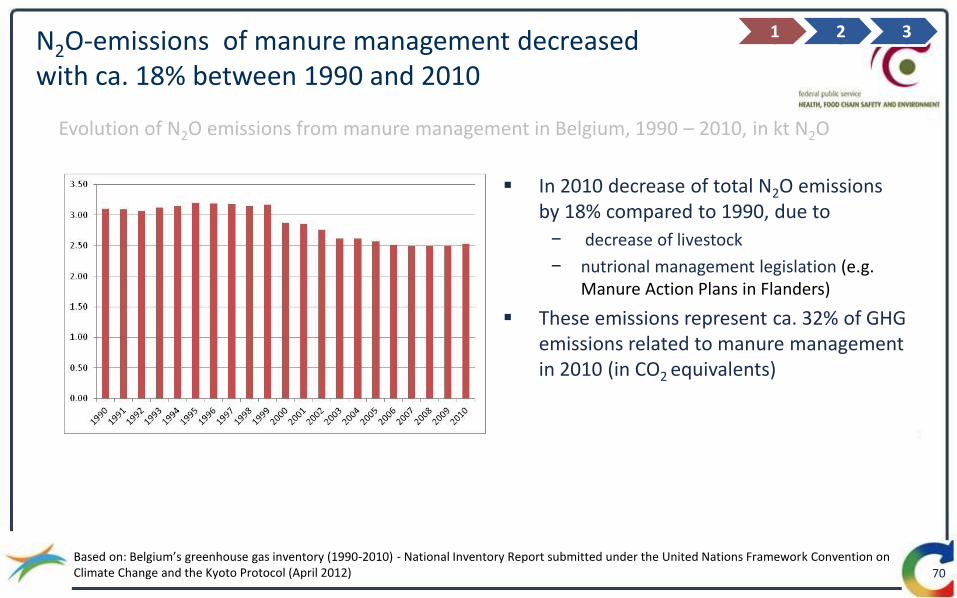
N2O-emissions of manure management decreased with ca. 18% between 1990 and 2010
In 2010 decrease of total N2O emissions by 18% compared to 1990, due to
− decrease of livestock
− nutrional management legislation (e.g. Manure Action Plans in Flanders)
These emissions represent ca. 32% of GHG emissions related to manure management in 2010 (in CO2 equivalents)
Based on: Belgium’s greenhouse gas inventory (1990-2010) - National Inventory Report submitted under the United Nations Framework Convention on Climate Change and the Kyoto Protocol (April 2012)
1 2 3
Evolution of N2O emissions from manure management in Belgium, 1990 – 2010, in kt N2O
70

Options to reduce CH4 and N2O emissions from manure management (1/2)
Improving N-efficiency by means of nutritional management, optimizing ration and digestibility of feed, cf. enteric fermentation
− e.g. high quality feeds that are low of protein such as corn silage for cattle
Some of the measures related to ration imply trade-off between CH4 and N2O
− e.g. amount of roughage (+ for N2O) and feed concentrates (+ for CH4)
Switching from liquid to dry management systems reduces CH4
emissions
− can lead to significant surface and ground water pollution
− fundamental shift in the entire production needed as liquid manure management systems at large farms are integrated with the overall production process
Daily spreading has the lowest CH4 and N2O emissions
− but has to be consistent with nutrient management policy/legislation as this can lead to significant surface and ground water pollution
1 2 3
Sources: Klimaat en Veehouderij (Campens et al., 2010), US Methane emissions 1990 – 2020: inventories, projections, and opportunities for reductions (EPA)
Number of animals
Amount and characteristics of
manure
Animal waste management
71

Options to reduce CH4 and N2O emissions from manure
management (2/2)
Treatment of gases in mechanically ventilated stables for cattle, e.g. biofilter for CH4 or microbiological gas treatment systems for N2O
Good manure management practices, e.g. cover outdoor storage, reduce storage time, reduce temperature
Maximize methane generation from the manure, collect the methane (from ventilated stables), and use it to produce electricity and hot water at farm scale (microdigester)
(de)centralized anaerobic digestion
Sources: Klimaat en Veehouderij (Campens et al., 2010), US Methane emissions 1990 – 2020: inventories, projections, and opportunities for reductions (EPA)
1 2 3
Number of animals
Amount and characteristics of
manure
Animal waste management
72

Content of this section
73
Enteric fermentation
Manure management
Agricultural soils
Mechanisms & historical
Amount of manure excreted
Emission intensity
1 2 3
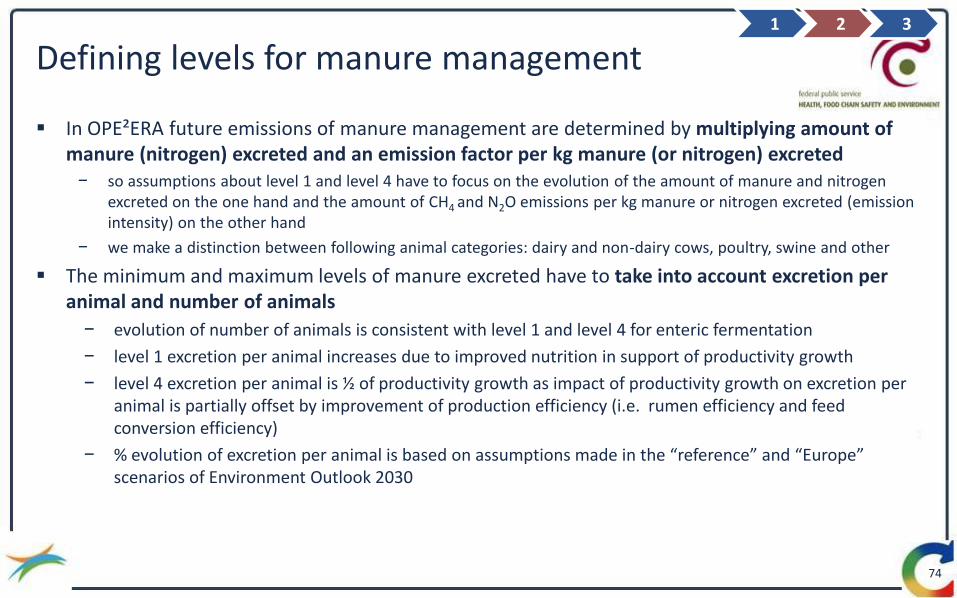
Defining levels for manure management
In OPE²ERA future emissions of manure management are determined by multiplying amount of manure (nitrogen) excreted and an emission factor per kg manure (or nitrogen) excreted − so assumptions about level 1 and level 4 have to focus on the evolution of the amount of manure and nitrogen
excreted on the one hand and the amount of CH4 and N2O emissions per kg manure or nitrogen excreted (emission intensity) on the other hand
− we make a distinction between following animal categories: dairy and non-dairy cows, poultry, swine and other
The minimum and maximum levels of manure excreted have to take into account excretion per animal and number of animals
− evolution of number of animals is consistent with level 1 and level 4 for enteric fermentation
− level 1 excretion per animal increases due to improved nutrition in support of productivity growth
− level 4 excretion per animal is ½ of productivity growth as impact of productivity growth on excretion per animal is partially offset by improvement of production efficiency (i.e. rumen efficiency and feed conversion efficiency)
− % evolution of excretion per animal is based on assumptions made in the “reference” and “Europe” scenarios of Environment Outlook 2030
74
1 2 3

Evolution of amount of manure excreted up to 2050
75 75
Level 1
Level 4
Poultry: +0,3% p.a.
Swine: +0,3% p.a
Dairy: + 2,3% p.a.
Non-dairy: -0,5% p.a.
Other: 0%
Poultry: -2,7% p.a.
Swine: -2,7% p.a
Dairy: -2,5% p.a.
Non-dairy: -2,7% p.a.
Other: 0%
1 2 3
% up to 2030 and flattens
out after 2030

Evolution of amount of manure excreted up to 2050
Level 1: in 2050 the amount of manure excreted will increase with 10% compared to 2010
Level 4: in 2050 the amount of manure excreted will decrease with 41% compared to 2010
76
NIR (2012)= Belgium’s greenhouse gas inventory (1990-2010) - National Inventory Report submitted under the United Nations Framework Convention on Climate Change and the Kyoto Protocol (April 2012)
1 2 3
Amount of manure produced, 2010 and 2050, in kg N excreted

Content of this section
77
Enteric fermentation
Manure management
Agricultural soils
Mechanisms & historical
Amount of manure excreted
Emission intensity
1 2 3
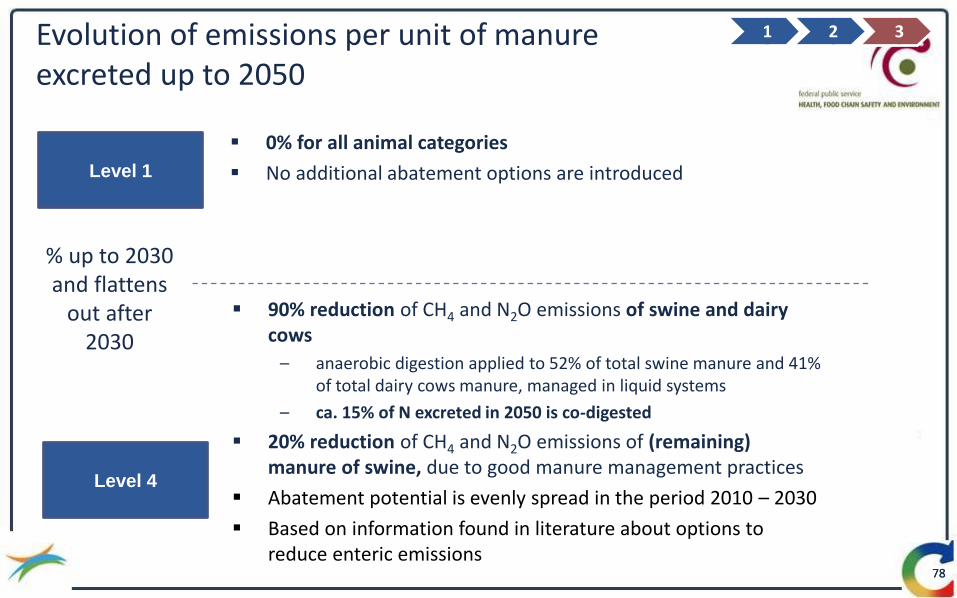
Evolution of emissions per unit of manure excreted up to 2050
78 78
Level 1
0% for all animal categories
No additional abatement options are introduced
Level 4
90% reduction of CH4 and N2O emissions of swine and dairy cows
– anaerobic digestion applied to 52% of total swine manure and 41% of total dairy cows manure, managed in liquid systems
– ca. 15% of N excreted in 2050 is co-digested
20% reduction of CH4 and N2O emissions of (remaining) manure of swine, due to good manure management practices
Abatement potential is evenly spread in the period 2010 – 2030
Based on information found in literature about options to reduce enteric emissions
% up to 2030 and flattens
out after 2030
1 2 3

Information found in literature about options to reduce emissions of manure management
Good manure management practices, e.g.: − lowering temperature pig slurry reduces CH4 and N2O emissions with 20% Source: SERPEC-CC (Baetens et al. 2009)
Anaerobic digestion − in 2010 ca. 1% of the manure produced (in t) by pigs and cattle in Belgium; in the EU ca. 7% of livestock manure
produced Source: Inventory of manure processing activities in Europe (DG Environment, 2011) − In 2010 ca. 23 mio kg N was treated in Flanders or 9% of total N excreted
48% = treatment and export of poultry manure 46%= treatment of swine manure 6%= treatment of manure of non dairy cows, horses and other
Source: Enquete operationele stand van zaken mestverwerking in Vlaanderen 2010 (VCM) − Biogas-E vzw estimates that with the planned projects ca. 3,4% of the available manure will be co-digested in the
near future Source: Voortgangsrapport 2011 – Anaerobe vergisting in Vlaanderen (Vanacker et al., 2012) − technical potential for Belgium projected for 2030 in SERPEC-CC (Baetens et al., 2009):
52% of total pig manure and 41% of dairy cow manure, stored in liquid systems 90% reduction of CH4 emissions manure management
− production of biogas (and related GHG emissions) and cost of anaerobic digester will be discussed during the workshop on energy production
79
1 2 3

Emissions of manure management, 2010 and 2050, in kg CH4
Level 1: CH4 emissions increase with 9% in 2050 in comparison to 2010, due to − increase of livestock and productivity increase
Level 4 (no abatement): CH4 emissions are reduced with 9% in 2050 in comparison to 2010 − decrease of manure excreted
− impact of increase of productivity is set off by increase of production efficiency
Level 4 (abatement): CH4 emissions are reduced with 86% in 2050 in comparison to 2010, due to − decrease of manure excreted
− increase of manure treated in anaerobic digester (swine and dairy) and good manure management practices (swine)
CH4 emissions of manure management in 2050 for level 1 and level 4 assumptions, compared to 2010
80
1 2 3
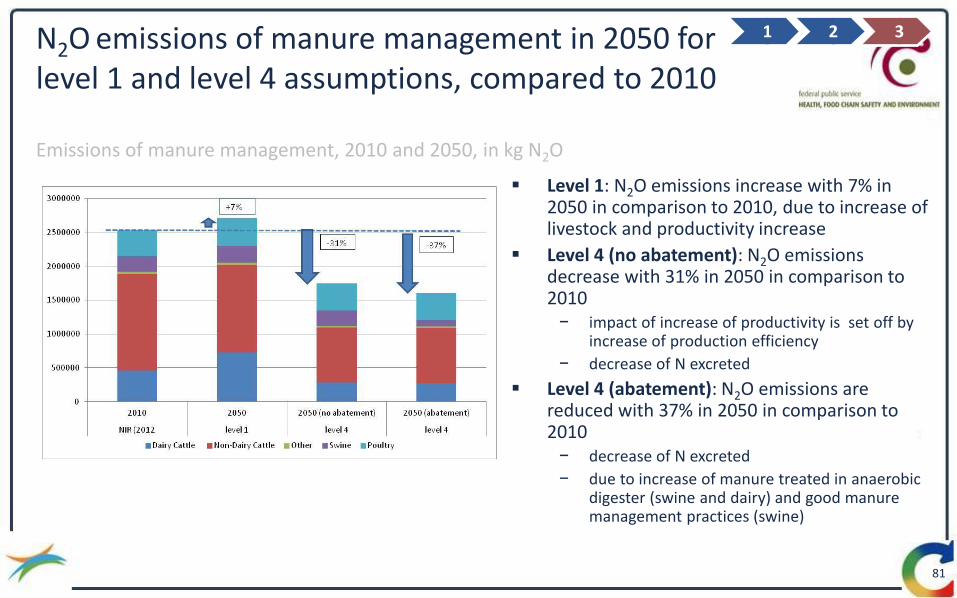
Level 1: N2O emissions increase with 7% in 2050 in comparison to 2010, due to increase of livestock and productivity increase
Level 4 (no abatement): N2O emissions decrease with 31% in 2050 in comparison to 2010 − impact of increase of productivity is set off by
increase of production efficiency
− decrease of N excreted
Level 4 (abatement): N2O emissions are reduced with 37% in 2050 in comparison to 2010 − decrease of N excreted
− due to increase of manure treated in anaerobic digester (swine and dairy) and good manure management practices (swine)
N2O emissions of manure management in 2050 for level 1 and level 4 assumptions, compared to 2010
81
1 2 3
Emissions of manure management, 2010 and 2050, in kg N2O

Costs of reducing emissions of manure management
Abatement option Euro per ton CO2eq Source
Good practices neglible SERPEC-CC (Baetens et al., 2009)
Feeding strategy, ration and additives limited Klimaat en veehouderij (Campens et al., 2010)
1 2 3
82
Cost of co-digestion are taken into account in the modelling work for bio energy production (cf. supply side workshop)
Based on the study of the Flemish Administration of Agriculture and Fishery, we consider costs of abatement options (feeding strategy, ration, additives) to be negligible and are set equal to 0 (cf. enteric fermentation)
Content of this section
83
Enteric fermentation
Manure management
Agricultural soils
Mechanisms & historical
Amount of N input
Emission intensity 1 2 3
Agricultural soils – emission mechanisms
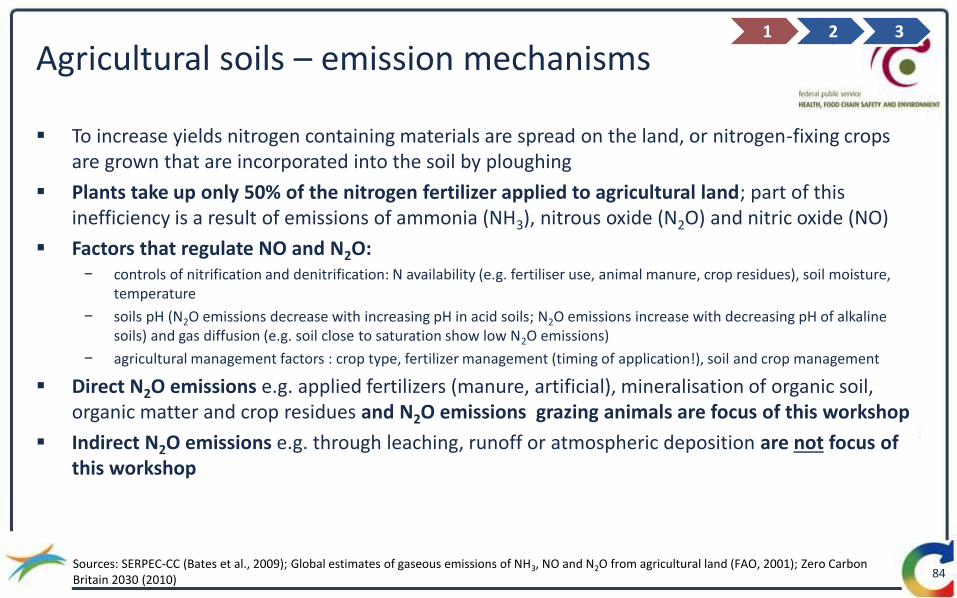
To increase yields nitrogen containing materials are spread on the land, or nitrogen-fixing crops are grown that are incorporated into the soil by ploughing
Plants take up only 50% of the nitrogen fertilizer applied to agricultural land; part of this inefficiency is a result of emissions of ammonia (NH3), nitrous oxide (N2O) and nitric oxide (NO)
Factors that regulate NO and N2O: − controls of nitrification and denitrification: N availability (e.g. fertiliser use, animal manure, crop residues), soil moisture,
temperature
− soils pH (N2O emissions decrease with increasing pH in acid soils; N2O emissions increase with decreasing pH of alkaline soils) and gas diffusion (e.g. soil close to saturation show low N2O emissions)
− agricultural management factors : crop type, fertilizer management (timing of application!), soil and crop management
Direct N2O emissions e.g. applied fertilizers (manure, artificial), mineralisation of organic soil, organic matter and crop residues and N2O emissions grazing animals are focus of this workshop
Indirect N2O emissions e.g. through leaching, runoff or atmospheric deposition are not focus of this workshop
Sources: SERPEC-CC (Bates et al., 2009); Global estimates of gaseous emissions of NH3, NO and N2O from agricultural land (FAO, 2001); Zero Carbon Britain 2030 (2010)
1 2 3
84

N2O emissions of agricultural soils decreased by ca. 20% in 2010 compared to 1990
N2O emissions decreased by ca. 20% in 2010 compared to 1990, due to:
− smaller quantities of nitrogen from mineral fertiliser applied
− livestock reduction, and as such, reduction of nitrogen excreted on pasture
Both reductions have also an impact on indirect emissions
Based on: Belgium’s greenhouse gas inventory (1990-2010) - National Inventory Report submitted under the United Nations Framework Convention on Climate Change and the Kyoto Protocol (April 2012)
1 2 3
Evolution of emissions of agricultural soils in Belgium, 1990 – 2010, in kt N20
85
Direct emissions represent ca. 59% of total N2O emissions of agricultural soils in 2010
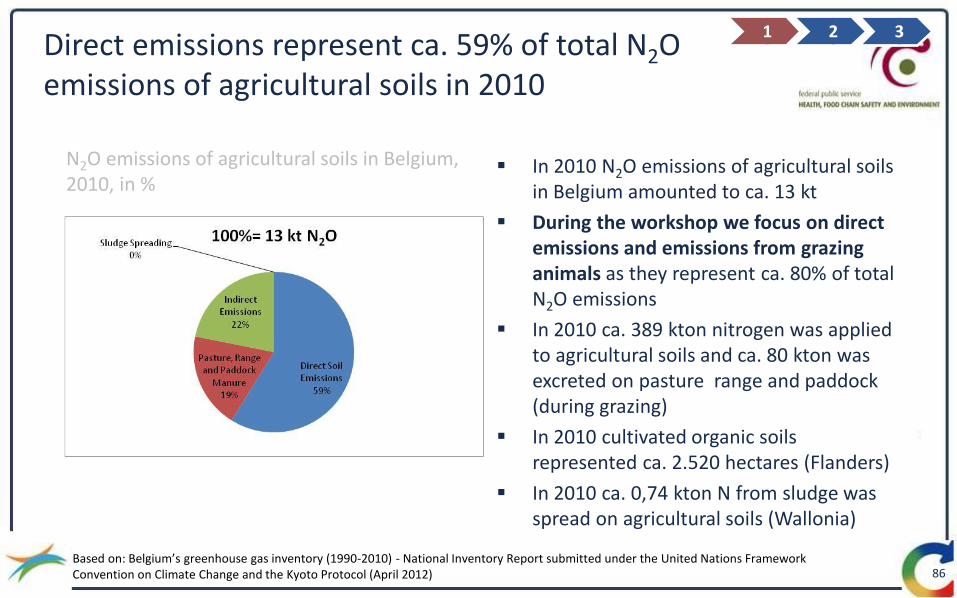
In 2010 N2O emissions of agricultural soils in Belgium amounted to ca. 13 kt
During the workshop we focus on direct emissions and emissions from grazing animals as they represent ca. 80% of total N2O emissions
In 2010 ca. 389 kton nitrogen was applied to agricultural soils and ca. 80 kton was excreted on pasture range and paddock (during grazing)
In 2010 cultivated organic soils represented ca. 2.520 hectares (Flanders)
In 2010 ca. 0,74 kton N from sludge was spread on agricultural soils (Wallonia)
Based on: Belgium’s greenhouse gas inventory (1990-2010) - National Inventory Report submitted under the United Nations Framework Convention on Climate Change and the Kyoto Protocol (April 2012)
N2O emissions of agricultural soils in Belgium, 2010, in %
1 2 3
86
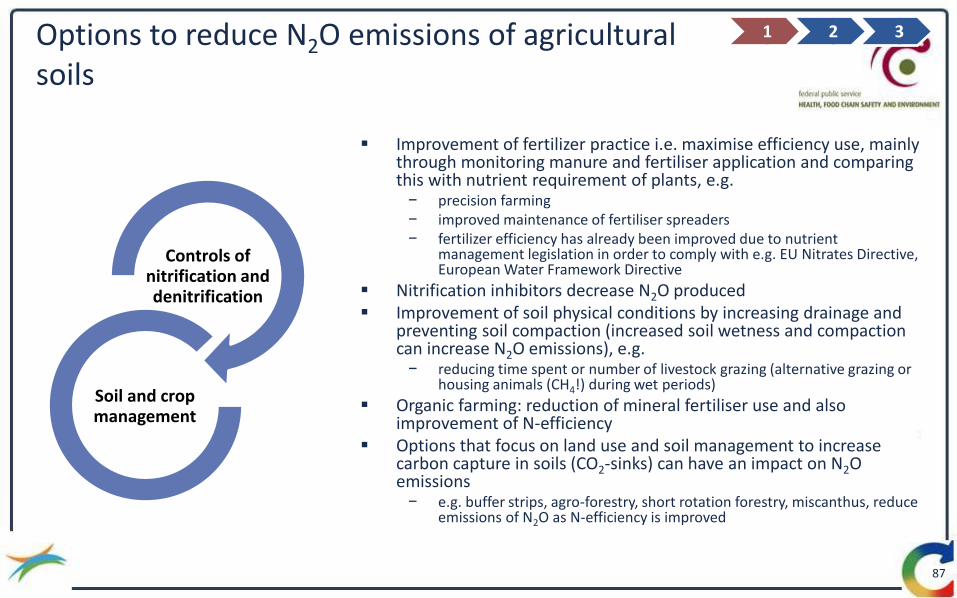
Options to reduce N2O emissions of agricultural soils
Improvement of fertilizer practice i.e. maximise efficiency use, mainly through monitoring manure and fertiliser application and comparing this with nutrient requirement of plants, e.g. − precision farming − improved maintenance of fertiliser spreaders − fertilizer efficiency has already been improved due to nutrient
management legislation in order to comply with e.g. EU Nitrates Directive, European Water Framework Directive
Nitrification inhibitors decrease N2O produced Improvement of soil physical conditions by increasing drainage and
preventing soil compaction (increased soil wetness and compaction can increase N2O emissions), e.g. − reducing time spent or number of livestock grazing (alternative grazing or
housing animals (CH4!) during wet periods)
Organic farming: reduction of mineral fertiliser use and also improvement of N-efficiency
Options that focus on land use and soil management to increase carbon capture in soils (CO2-sinks) can have an impact on N2O emissions − e.g. buffer strips, agro-forestry, short rotation forestry, miscanthus, reduce
emissions of N2O as N-efficiency is improved
1 2 3
Controls of nitrification and denitrification
Soil and crop management
87

Content of this section
88
Enteric fermentation
Manure management
Agricultural soils
Mechanisms & historical
Amount of N input
Emission intensity
1 2 3
Defining levels for agricultural soils
In OPE²ERA future emissions of agricultural soils are determined by multiplying amount of nitrogen applied to soils and an emission factor per kg N input − so assumptions about level 1 and level 4 have to focus on the evolution of the amount of nitrogen input to
agricultural soils on the one hand and the amount of N2O emissions per kg N input (emission intensity) on the other hand
− we make a distinction between N input to soils by application of fertilisers, N-fixing crops and crop residues on the one hand an N input to soils by grazing animals on the other hand
The minimum and maximum levels of N input to agricultural soils have to take into account nitrogen input per ha and ha agricultural land; in 2010 (based on: NIR, 2012): − agricultural land in ha : 1.358.019
− N input in kg: 389.188.459, i.e. ∑ of synthetic fertilizers, animal manure applied to soils, N-fixing crops, crop residues
− kg N input per ha: 287
The minimum and maximum levels of manure excreted while grazing have to take into account excretion per animal and number of animals in pasture range and paddock − evolution of number of animals is consistent with level 1 and level 4 for manure management
− excretion per animal is consistent with level 1 and level 4 for manure management
89
1 2 3
Impact of evolution in livestock on N input into soils
More than 50% of the agricultural land in Belgium is used for feeding and grazing animals (Source: NIS, Landbouwtelling 2010)
− ca. 267.409 ha was used for feed production (or 20%) (e.g. beets, maize)
− ca. 499.687 ha was permanent grassland (or 37%)
Decrease of livestock can have an impact on the area of land used for feed production. However, given the limited impact (-8% of total agricultural land, in case of 43% reduction) we do not make any explicit assumptions about the usage of the available land and we assume no additional impact on the amount of N input to the soils
We assume that the area of permanent grassland is not reduced to be in line with the cross compliance principle of the CAP (e.g. preserving the ratio permanent grassland versus total agricultural land and prevention of erosion)
Consequently, decrease of livestock has only an impact on the amount of N input to soils due to excretion of grazing animals
90
Level 1 assumptions about evolution of N input to agricultural soils
Evolution of kg N input is based on the productivity growth in the reference scenario of Milieuverkenning 2030, i.e. 0,43% p.a. up to 2020
− to be consistent with level 1 of evolution of livestock and N excreted
− to be consistent with reference scenario of Natuurverkenning 2030 (VMM) (cf. Infra)
− no productivity growth is assumed for grassland and maize (i.e. ca. 50% of agricultural land used in 2010 and in 2030)
Evolution of agricultural land is based on the reference scenario of Natuurverkenning 2030 (VMM), i.e. -0,2% p.a. up to 2030
− population growth and ↑ of services sector increases competition for land in favour of the built area
1 2 3
91
Level 4 assumptions about evolution of N input to agricultural soils
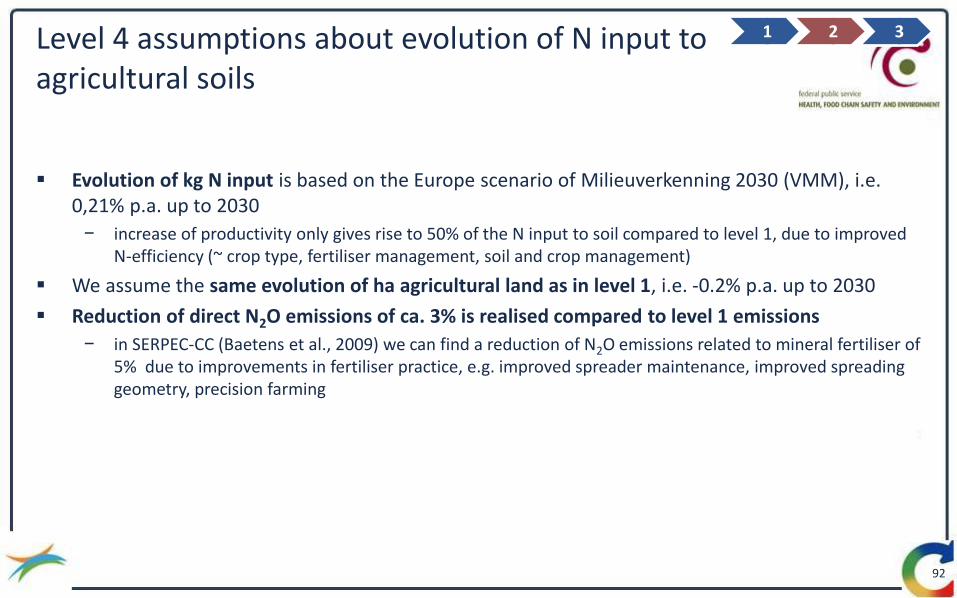
Evolution of kg N input is based on the Europe scenario of Milieuverkenning 2030 (VMM), i.e. 0,21% p.a. up to 2030
− increase of productivity only gives rise to 50% of the N input to soil compared to level 1, due to improved N-efficiency (~ crop type, fertiliser management, soil and crop management)
We assume the same evolution of ha agricultural land as in level 1, i.e. -0.2% p.a. up to 2030
Reduction of direct N2O emissions of ca. 3% is realised compared to level 1 emissions
− in SERPEC-CC (Baetens et al., 2009) we can find a reduction of N2O emissions related to mineral fertiliser of 5% due to improvements in fertiliser practice, e.g. improved spreader maintenance, improved spreading geometry, precision farming
1 2 3
92

Evolution of nitrogen input to agricultural soils up to 2050
93 93
Level 1
Level 4
% up to 2030 and flattens
out after 2030
Source: Milieuverkenning 2030 (VMM, 2009)
1 2 3
- 0,01% p.a. given an increase of productivity with 0,43% p.a (up to 2020) that is “eliminated” by a decrease of agricultural land with 0,2% p.a. (up to 2030)
- 0,2% p.a. given an increase of productivity with 0,43% p.a (up to 2020) that is “eliminated” by a decrease of agricultural land with 0,2% p.a. (up to 2030) and improvement of N-efficiency (crop type, crop and soil management, fertiliser management)

Evolution of nitrogen input to agricultural soils up to 2050
Level 1: amount of N input to soil decreases with 0,2% in 2050, compared to 2010
Level 4: amount of N input to soil decreases with 3% in 2050, compared to 2010
N input to soils, 2010 and 2050, in kg
1 2 3
94
Evolution of nitrogen excreted on pasture range and paddock
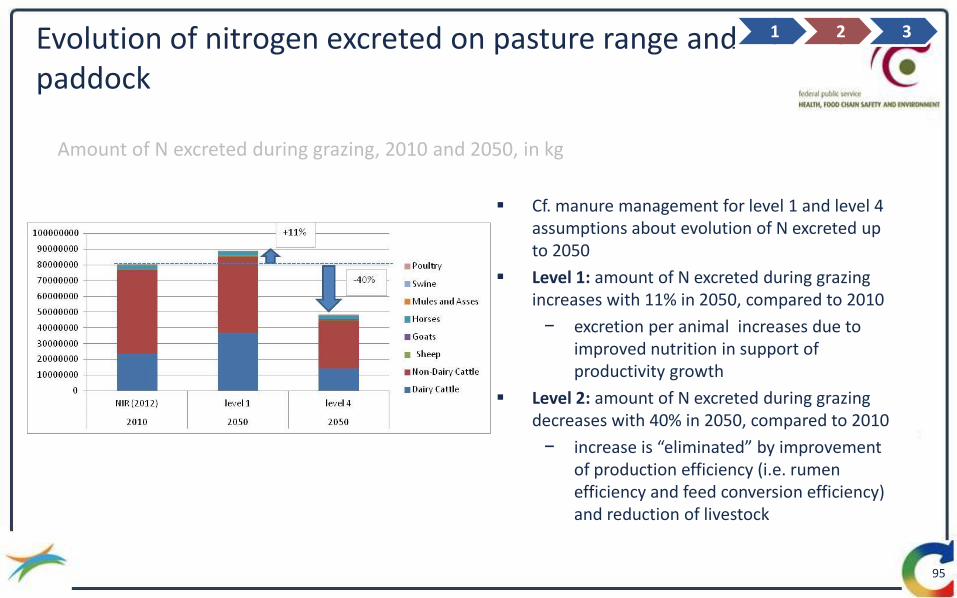
Amount of N excreted during grazing, 2010 and 2050, in kg
Cf. manure management for level 1 and level 4 assumptions about evolution of N excreted up to 2050
Level 1: amount of N excreted during grazing increases with 11% in 2050, compared to 2010
− excretion per animal increases due to improved nutrition in support of productivity growth
Level 2: amount of N excreted during grazing decreases with 40% in 2050, compared to 2010
− increase is “eliminated” by improvement of production efficiency (i.e. rumen efficiency and feed conversion efficiency) and reduction of livestock
1 2 3
95

Content of this section
96
Enteric fermentation
Manure management
Agricultural soils
Mechanisms & historical
Amount of manure excreted
Emission intensity 1 2 3
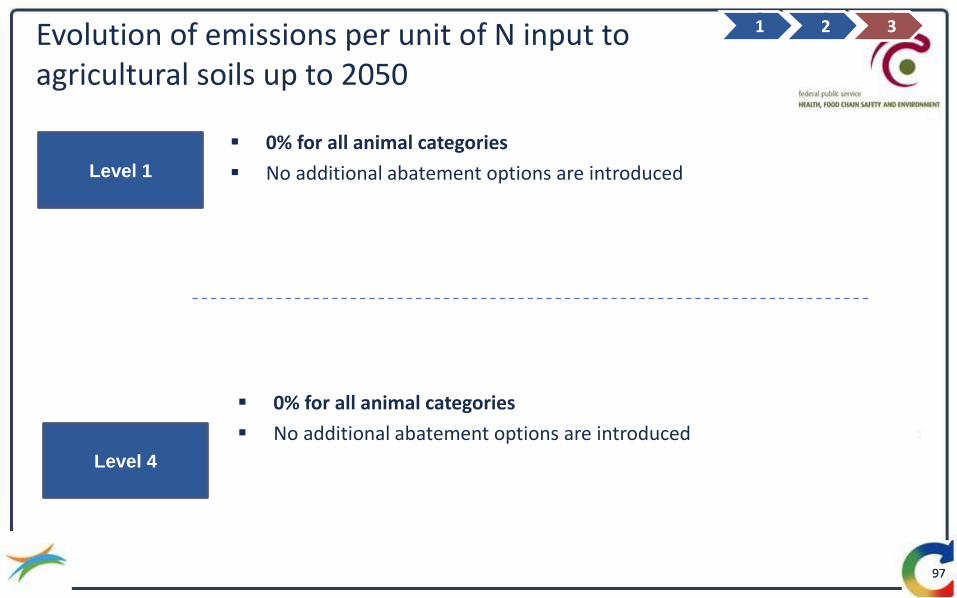
Evolution of emissions per unit of N input to agricultural soils up to 2050
97 97
Level 1
0% for all animal categories
No additional abatement options are introduced
Level 4
1 2 3
0% for all animal categories
No additional abatement options are introduced

Direct N2O emissions of agricultural soils in 2050, for level 1 and level 4 assumptions, compared to 2010
98
1 2 3
Direct N2O emissions agricultural soils in Belgium, 2010 and 2050, in kt
Level 1: decrease of direct N2O emissions (excl. histosols) with 1%, due to increase of productivity but “eliminated” by decrease of ha agricultural land Level 4: decrease of direct N2O emissions (excl. histosols) with 3%, due to N-efficiency improvement that reduces the amount of N put to soil

Evolution of emissions per unit of N input by grazing animals up to 2050
99 99
Level 1
0% for all animal categories
No additional abatement options are introduced
Level 4
0% for all animal categories
No additional abatement options are introduced
1 2 3

N2O emissions pasture range and paddock, 2010 and 2050, in kt
Level 1: N2O emissions that originate during grazing of animals increase with 11% in 2050, compared to 2010
− due to increase of N excreted
Level 4 : N2O emissions that originate during grazing of animals decreases with 40% in 2050, compared to 2010
− due to decrease of N excreted
N2O emissions from grazing in 2050, for level 1 and level 4 assumptions, compared to 2010
100
1 2 3

Costs of reducing emissions of agricultural soil
Abatement option Euro per ton CO2eq Source
Reduced grazing on wet land 18 euro per ton CO2eq (cost of winter grazing)
SERPEC-CC (Baetens et al., 2009)
Feeding strategy, ration and additives limited Klimaat en veehouderij (Campens et al., 2010)
precision farming (reduction of N application) -175 euro per ton CO2eq (investment and maintenance cost of resp. 39 euro per ha and 20 euro per ha, per year) (yield increase; savings of reduced fertiliser use)
SERPEC-CC (Baetens et al., 2009)
Improved spreader maintenance -173 euro per ton CO2eq (cost of adjustment and maintenance of spreader; yield increase; savings of reduced fertiliser use)
SERPEC-CC (Baetens et al., 2009)
Fertiliser free zone -1 euro per ton CO2eq (savings of reduced fertiliser use; yield reduction)
SERPEC-CC (Baetens et al., 2009)
Addition of Nitrification inhibitors 10 euro per ton CO2eq (28 euro per ha)
SERPEC-CC (Baetens et al., 2009)
1 2 3
101

Costs of reducing emissions of agricultural soil
Abatement option Euro per ton CO2eq Source
Feeding strategy, ration and additives limited Klimaat en veehouderij (Campens et al., 2010)
Precision farming (reduction of N application) -175 euro per ton CO2eq (investment and maintenance cost of resp. 39 euro per ha and 20 euro per ha, per year) (yield increase; savings of reduced fertiliser use)
SERPEC-CC (Baetens et al., 2009)
Improved spreader maintenance -173 euro per ton CO2eq (cost of adjustment and maintenance of spreader; yield increase; savings of reduced fertiliser use)
SERPEC-CC (Baetens et al., 2009)
Fertiliser free zone -1 euro per ton CO2eq (savings of reduced fertiliser use; yield reduction)
SERPEC-CC (Baetens et al., 2009)
1 2 3
102
we consider costs of abatement options to be limited (or negative) and are set equal to 0
Content – Agriculture sector
103
▪ Summary and references
▪ Context and historical trends
▪ Methodology
▪ Details of the ambition levels and costs per lever
▪ Barriers to reduce CH4 and N2O
Barriers to reduce CH4 and N2O
The current production system that focuses on productivity gains and food production is not sustainable nor resilient; food prices are too low compared to other goods and services
Systemic approach implies that trade-offs or choices have to be made − not only focus on food and feed production but also other functions e.g. biodiversity, climate change, bio energy production − choices made have an impact on other economic sectors and throughout the food chain − we are not used to this kind of systemic thinking and acting; as a consequence it will take time before the general public
thinks in terms of opportunities instead of treats (typical of the current system)
Not possible to attain zero emissions as a certain level of emissions is intrinsic to nature and to producing food Limited potential for emission reduction by implementing technical measures and optimum will be reached in
2030 − e.g. measures related to optimizing ration and increasing productivity have already reached their maximum potential
Lot can be done quickly, i.e., the potiential can be tapped quickly; after 2030 shifts of paradigms, change of consumer behavior is needed
Legislation. E.g. EU Nitrate Directive can be a barrier to reduction of N2O emissions and creation of carbon sinks Multigovernance needed to streamline efforts made at EU, federal, regional, local level Affordability. Need to look at the economics of the agricultural sector, i.e., the sector will only implement
measures if they are affordable. Otherwise, compensation is needed e.g. subsidies Stimulate research and dissimination of knowledge to develop and implement new technologies. CAP reform
will (re)focus on education of farmer Communication of results is fundamental to come to a 2050 strategy and concrete actions
104
Thank you.
Erika Meynaerts – 014 33 59 55 – [email protected]
Julien Pestiaux – 0471 96 13 90 – [email protected]
Erika Laes – 014 33 59 09 – [email protected]