a look under the hood of the canadian preferred indices files/a-look-under-the... · common stock...
TRANSCRIPT

RESEARCH
APRIL 2014
CONTRIBUTORS
Aye Soe, CFA Director, Index Research & Design [email protected]
Phillip Brzenk, CFA Associate Director, Index Research & Design [email protected]
A Look Under the Hood of the Canadian Preferred Indices Introduction to Preferred Shares
Preferred shares are hybrid equity securities, featuring characteristics of both debt and equity. While preferreds represent ownership in a company, there are several characteristics that differentiate preferreds from common equity. Dividend income is a main source of return investors receive from preferreds. Conversely, common equities may provide increases in share prices and dividends as profits rise. Due to their seniority in the capital structure of a company, preferred shareholders also have a higher-priority claim to company assets than common shareholders in the instance of company liquidation (see Exhibit 1). Unlike common shareholders, preferred shareholders do not have the ability to vote on corporate matters, such as board elections and company takeovers.
Similar to bonds, preferred shares are issued at a fixed par value, with most making scheduled, fixed-dividend payments. The majority of exchange-traded preferreds are rated by credit rating agencies1 and are typically rated lower than bonds since preferreds offer fewer guarantees to investors. 2 While a company risks defaulting if it misses a bond interest payment, it does not face default risk if it cancels a preferred dividend payment.
Exhibit 1: General Creditor Standings Asset Type Class Seniority
Debt Secured Debt
Unsecured Senior Debt Unsecured Subordinate Debt
Hybrid Preferred Shares Equity Common Shares
Source: S&P Dow Jones Indices.
Given that interest rates have remained low for the past several years, investors have been seeking investments that offer higher yields than bonds. Since preferreds tend to meet this requirement and offer relatively low volatility, the asset class has been a benefactor of investor demand. As of Dec. 31, 2013, the market size of publicly exchange-traded preferred shares in Canada was estimated to be CAD 61.5 billion,
1Source: S&P Dow Jones Indices. Data as of July 2013. For preferreds listed on the Toronto Stock Exchange, over 95% of the listings had ratings available from either Standard & Poor's Ratings Services, Dominion Bank Ratings Service or Moody’s Investor Service. 2 Source: Standard & Poor’s Ratings Services. “Standard & Poor's Ratings Definitions”. The highest rating given to preferreds in Canada is equivalent to an “AA” rating on S&P global rating scale, while Canadian corporate bonds are eligible to receive an “AAA” rating.

S&P Dow Jones Indices | A Look Under the Hood of the Canadian Preferred Indices April 2014
2
doubling in size since year-end 2008.3 The size of the preferred market in Canada remains small compared to the common equity market, which is estimated to be approximately CAD 2 trillion.4 Exhibit 2 shows the annual growth of the Canadian preferred market over the past five years.
Exhibit 2: Preferred Market Size Growth
Source: S&P Dow Jones Indices. Market size as of Dec. 31 each year. Charts are provided for illustrative purposes. Past performance is not a guarantee of future results.
Types of Preferred Shares
Perpetual: Perpetual preferred shares have no set maturity date. The dividend payment is set at the issuance date and the amount is fixed for the life of the preferred share. Issuers may have the option to call the shares for redemption, though it is not mandatory for them to do so. Given the long duration and fixed dividend amount, perpetual shares have the highest interest rate risk among all preferred types.
Retractable: These allow shareholders to redeem the shares at par value on a specified date. Most of the redemptions will be by cash payment to the shareholder, while some issuances give the issuer the option to pay in cash or common shares.
Rate Resets: For these shares, the dividend payment is reset every five years. A spread above a reference rate, typically the Bank of Canada’s five-year bond yield, is determined on the issuance date and is based on the credit quality of the issuer and prevailing market conditions. Every five years, the new dividend rate is determined using this spread. The issuer also holds the option to redeem the shares at each reset date. Because the dividend rate is reset based on current market interest rates, the duration (and thus interest rate risk) of this type of preferred is lower than that of perpetual and retractable preferreds.
Floating Rate: The dividend payment is adjusted at each payment date based on a spread above a reference rate, such as LIBOR or a similar prime rate. Floating-rate preferreds usually have a floor, or minimum, dividend rate.
Why Companies Issue Preferreds
Companies will issue preferred shares for a variety of reasons, including the following. 3 Source: S&P Dow Jones Indices. Data as of Dec. 31, 2013. 4 Source: S&P Dow Jones Indices. Data as of Dec. 31, 2013. S&P Canada BMI (Canadian Dollar) was used as the measurement for market size.
30.5
47.2 51.5
53.8 59.8 61.5
0
10
20
30
40
50
60
70

S&P Dow Jones Indices | A Look Under the Hood of the Canadian Preferred Indices April 2014
3
Preferred issuances give companies another way to acquire capital. The preferred market is dominated by banks and related financial institutions, which need significant capital for their daily operations. Since preferreds do not have the voting rights that common shares do, it avoids ownership dilution for current common shareholders.
Preferred shares can be used in balance sheet management. Investors often prefer low debt-to-equity ratios, and issuing preferreds can lower the ratio as opposed to issuing debt. A company in need of additional financing may also be required to issue preferred shares instead of debt in order to avoid a technical default. A technical default may occur when the debt-to-equity ratio breaches a limit set in a bond covenant. This could trigger an immediate call on current outstanding bonds or an increase in interest rates on those bonds.
Preferreds give companies flexibility in making dividend payments. If a company is running into liquidity issues, it can suspend preferred dividend payments without the risk of default. Depending on whether the preferred share class is cumulative or non-cumulative, a company may have to pay previously skipped dividend payments before restarting dividend payments in the future.
Companies that offer preferred shares in the market can attract investors that otherwise would not invest in the issuing company’s common equity. Compared to common shares, preferreds can be appealing to conservative investors because of the higher current income, higher claim on company assets and lower volatility.
Potential Investment Benefits
Seniority: Preferreds offer investors more assurance than common shares. In a company’s capital structure preferred securities are higher in seniority than common equities; thus preferred dividends must be paid before common dividends. When a company is facing liquidity issues, it will cancel common dividend payments before cancelling preferred dividend payments. If a company goes bankrupt and liquidates assets, preferred shareholders hold a higher claim than common shareholders to any remaining company assets for repayment of principal.
Current Income: Preferred shares offer higher dividend yields than other asset classes including common stocks and bonds (see Exhibit 3). From an investor’s perspective, preferreds also have a tax advantage over bonds because the top marginal tax rate for individuals in Canada is lower for dividend income than interest income.5
Exhibit 3: Asset Class Yields
Source: S&P Dow Jones Indices, Bloomberg. Data as of Dec. 31, 2013. Common Stock yield is the 12 month trailing dividend yield of the S&P/TSX Composite Index, Bond yield is the yield of the Bloomberg CAD Investment Grade Corporate Bond Index, Preferred Stock yield is 12 month trailing dividend yield of the S&P/TSX Preferred Share Index. Charts are provided for illustrative purposes. Past performance is not a guarantee of future results.
5 Source: KPMG, 2013. http://www.kpmg.com/Ca/en/IssuesAndInsights/ArticlesPublications/PersonalTaxRates/Combined-Top-Marginal-Tax-Rates-For-Individuals1-2013.pdf
2.89% 3.15%
4.97%
0%
1%
2%
3%
4%
5%
6%
Common Shares Corporate Bonds Preferred Shares

S&P Dow Jones Indices | A Look Under the Hood of the Canadian Preferred Indices April 2014
4
Low Correlation: Preferred securities have low correlations with other asset classes such as common equities and bonds, and they can provide diversification benefits in a portfolio context. Exhibit 4 charts the five-year correlation of preferred securities, as represented by the S&P/TSX Preferred Share Index, to other asset classes.
Exhibit 4: Five-Year Correlation with S&P/TSX Preferred Share Index
Source: S&P Dow Jones Indices, FactSet. Data from Dec. 31, 2008 to Dec. 31, 2013. Charts are provided for illustrative purposes. Past performance is not a guarantee of future results.
Exchange Traded: Most preferreds in Canada are exchange traded, whereas bonds are traded over-the-counter. Stock exchanges provide several advantages to market participants including price transparency, enhanced liquidity and higher accountability of listed companies due to increased regulations.
Potential Investment Risks
Interest Rate Risk: Due to their bond-like fixed dividend payments, preferreds can be vulnerable to changes in interest rates. There is an inverse relationship between preferred prices and changes in interest rates. In a rising interest rate environment, preferred stock prices tend to fall as the present value of future dividend payments decreases.
Reinvestment Risk: A preferred investor who does not seek high current income in dividend payments could be faced with the risks and associated costs of reinvesting the regular dividend payments. Callable shares can carry an even greater reinvestment risk, as there is the potential for the company to redeem the shares. This could force the investor to sell the shares at par, or at a specified call price.
Liquidity Risk: Preferred shares tend to be less liquid than common shares. Therefore, trading these securities may involve higher market impact costs and bid-ask spread costs.
Credit Risk: If a company is facing liquidity problems or is performing poorly, it may not be able to pay out a scheduled dividend to investors. Unlike bondholders, preferred shareholders usually have little recourse if a company does not pay the dividend.
Sector Concentration Risk: Financial companies are the primary issuers of preferreds. A portfolio of preferred securities might be subject to the specific risk factors of the financial sector.
The S&P/TSX Preferred Share Index
The S&P/TSX Preferred Share Index is designed to serve the investment community’s need for an investable benchmark representing the Canadian preferred stock market. The index comprises preferred shares trading on the Toronto Stock Exchange that meet criteria relating to minimum size, liquidity, issuer rating and exchange listing.
0.41
0.22
0.38 0.41
0.00
0.10
0.20
0.30
0.40
0.50
0.60
0.70
0.80
0.90
1.00
S&P/TSX Composite Index S&P Developed BMI(Canadian Dollar)
S&P Emerging MarketsLargeMid
DEX All Corporate BondIndex

S&P Dow Jones Indices | A Look Under the Hood of the Canadian Preferred Indices April 2014
5
With a market capitalization of CAD 50 billion, the index represents approximately 82% of the publicly traded Canadian preferred market.6
Index Highlights
The index is rebalanced on a quarterly basis; changes are effective after the close of trading on the third Friday of January, April, July and October.
The index is calculated using a modified capitalization-weighted scheme, with a set maximum weight of 10% per issuer.
The index does not have a fixed number of securities and includes all eligible securities at each rebalancing date. As of Dec. 31, 2013, the index had 206 constituents.
Constituent Selection
Exchange Listing: The security must trade on the Toronto Stock Exchange.
Type of Issuance: Preferred shares issued by a company to meet its capital or financing requirements are eligible. These include floating- and fixed-rate preferreds, cumulative and non-cumulative preferreds, preferred shares with a callable or conversion feature and trust preferreds. Split preferreds are not included because they are packaged securities linked to baskets of shares.
Maturity or Conversion Schedule: The security must not have a scheduled maturity or mandatory conversion within the next 12 months.
Market Capitalization: The security must have a market cap of at least CAD 100 million based on the volume-weighted average price over the last three trading days of the month-end prior to the quarterly review.
Volume: The preferred shares must have a minimum trailing three-month average daily value traded of CAD 200,000 as of the rebalancing reference date.
Rating: Preferred shares must have a minimum rating of P-3 or its equivalent by Standard & Poor's Ratings Services, Dominion Bank Ratings Service or Moody’s Investor Service. If more than one of the ratings agencies has issued a rating on the stock, the lowest rating is used to determine eligibility.
Different Lines of the Same Issuer: There is no limit to the number of lines of a single company’s preferred stock that are allowed in the index.
Risk/Return Characteristics
In terms of historical performance, preferred shares generally lie between common equity and bonds. As seen in Exhibit 5, preferreds have higher returns than bonds over the long term (five years), and volatility is considerably lower than it is for common equity.
6 Source: S&P Dow Jones Indices. Data as of Dec. 31, 2013.

S&P Dow Jones Indices | A Look Under the Hood of the Canadian Preferred Indices April 2014
6
Exhibit 5: Risk/Return Characteristics
S&P/TSX Preferred Share
Index S&P/TSX Composite Index DEX All Corporate Bond Index
Annualized Return (%)
1-Year -2.64 12.99 0.84
3-Year 2.80 3.40 5.05
5-Year 8.25 11.92 7.67
Annualized Volatility (%)
3-Year 3.02 10.24 2.71
5-Year 5.33 12.76 3.16
Sharpe Ratio
3-Year 0.63 0.25 1.54
5-Year 1.38 0.86 2.15
Correlation
3-Year 0.33 0.39
5-Year 0.41 0.41 Source: S&P Dow Jones Indices, FactSet. Data as of Dec. 31, 2013. The launch date of the S&P/TSX Preferred Share Index is April 3, 2007. Charts are provided for illustrative purposes. Past performance is not a guarantee of future results.
Index Characteristics
Over the last several years, the Canadian market has seen a shift from the majority of preferreds being fixed-dividend preferreds (perpetual and retractable preferreds) to the majority being rate-reset preferreds. When looking at the S&P/TSX Preferred Share Index, rate-reset preferreds made up only 17% of the index on Dec. 31, 2008. At the end of 2013, rate resets had grown to make up 57% of the index.
Exhibit 6: Historical Security Type Makeup of S&P/TSX Preferred Share Index
Source: S&P Dow Jones Indices. Data as of Dec 31 each year. The launch date of the S&P/TSX Preferred Share Index is April 3, 2007. Charts are provided for illustrative purposes. Past performance is not a guarantee of future results.
The sector composition breakdown of the S&P/TSX Preferred Share Index shows the financial sector’s prevalence in the market (see Exhibits 7 and 8). Within the financial sector, banks are the largest issuers of preferred shares in the index, comprising 50% of the sector weight.
0%
10%
20%
30%
40%
50%
60%
70%
80%
90%
100%
2008 2009 2010 2011 2012 2013
Floating
Reset
Fixed

S&P Dow Jones Indices | A Look Under the Hood of the Canadian Preferred Indices April 2014
7
Exhibit 7: Historical Sector Composition
Source: S&P Dow Jones Indices. Sector weight data as of Dec. 31 each year. The launch date of the S&P/TSX Preferred Share Index is April 3, 2007. Charts and graphs are provided for illustrative purposes. Past performance is no guarantee of future results. These charts and graphs may reflect hypothetical historical performance. Please see the Performance Disclosure at the end of this document for information regarding the inherent limitations associated with back-tested performance.
Exhibit 8: Current Sector Composition
Source: S&P Dow Jones Indices. Sector weight data as of Dec. 31, 2013. The launch date of the S&P/TSX Preferred Share Index is April 3, 2007. Charts are provided for illustrative purposes. Past performance is not a guarantee of future results.
The dividend offered by preferred securities is a function of current market interest rates at issuance and credit quality. The lower the credit quality of a preferred share, the higher the dividend will be to compensate investors for the increased risk. It is important to note that preferred securities may receive lower credit ratings simply due to their lower placement in the capital structure compared to bonds, despite the potentially higher quality of the issuing companies.
0%
10%
20%
30%
40%
50%
60%
70%
80%
90%
100%
2004 2005 2006 2007 2008 2009 2010 2011 2012 2013
Utilities
Telecommunication Services
Information Technology
Financials
Healthcare
Consumer Staples
Consumer Discretionary
Industrials
Materials
Energy
13.15%
0.20%
1.09%
2.04%
67.93%
6.28%
9.30%
Energy
Industrials
Consumer Discretionary
Consumer Staples
Financials
Telecommunication Services
Utilities
0% 10% 20% 30% 40% 50% 60% 70% 80%
S&P Dow Jones Indices | A Look Under the Hood of the Canadian Preferred Indices April 2014
8
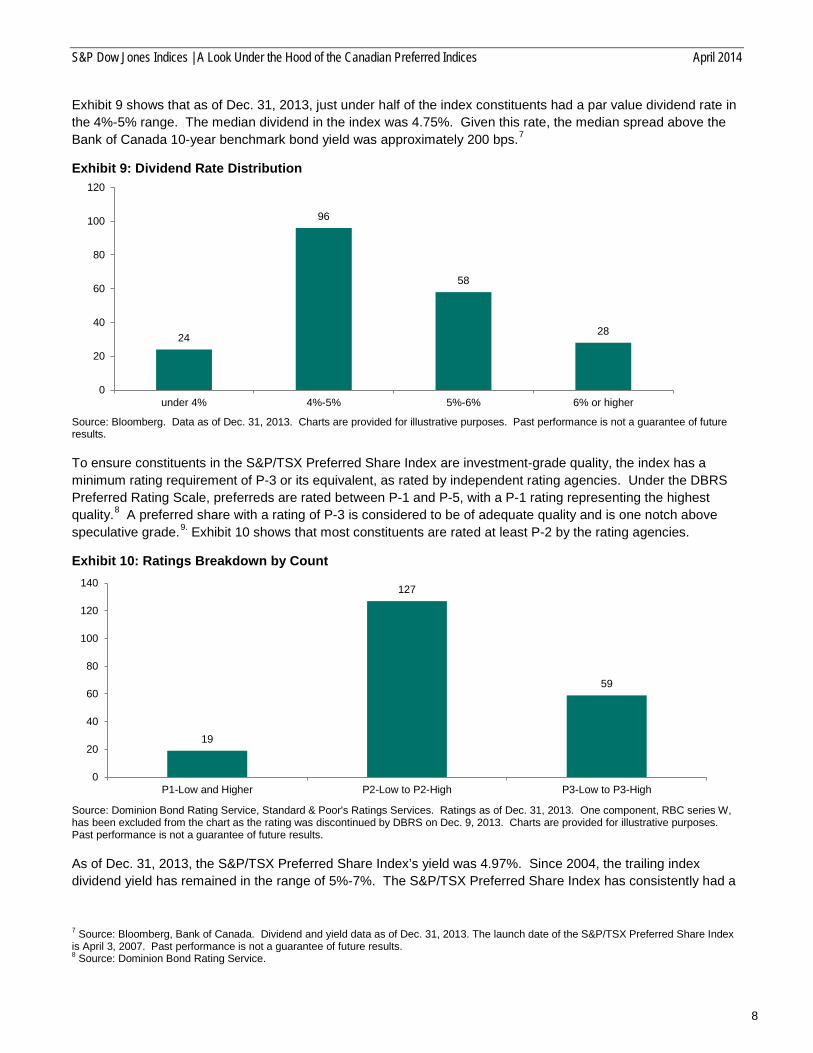
Exhibit 9 shows that as of Dec. 31, 2013, just under half of the index constituents had a par value dividend rate in the 4%-5% range. The median dividend in the index was 4.75%. Given this rate, the median spread above the Bank of Canada 10-year benchmark bond yield was approximately 200 bps.7
Exhibit 9: Dividend Rate Distribution
Source: Bloomberg. Data as of Dec. 31, 2013. Charts are provided for illustrative purposes. Past performance is not a guarantee of future results.
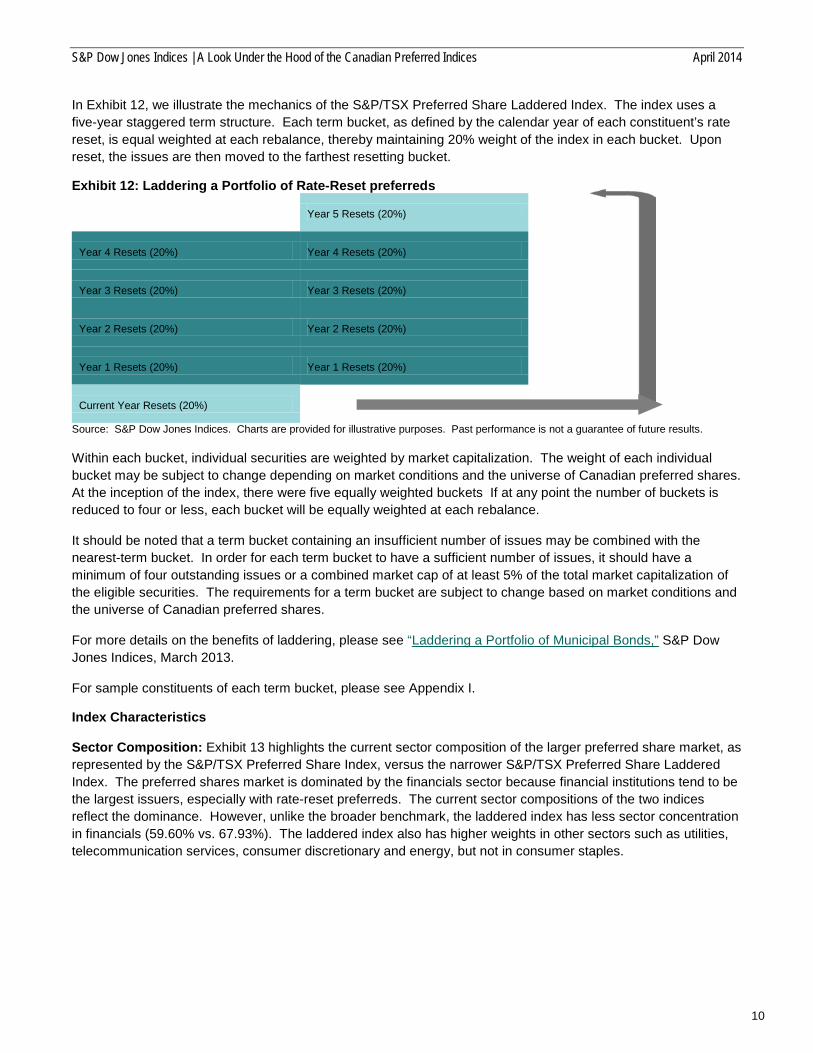
To ensure constituents in the S&P/TSX Preferred Share Index are investment-grade quality, the index has a minimum rating requirement of P-3 or its equivalent, as rated by independent rating agencies. Under the DBRS Preferred Rating Scale, preferreds are rated between P-1 and P-5, with a P-1 rating representing the highest quality.8 A preferred share with a rating of P-3 is considered to be of adequate quality and is one notch above speculative grade.9. Exhibit 10 shows that most constituents are rated at least P-2 by the rating agencies.
Exhibit 10: Ratings Breakdown by Count
Source: Dominion Bond Rating Service, Standard & Poor's Ratings Services. Ratings as of Dec. 31, 2013. One component, RBC series W, has been excluded from the chart as the rating was discontinued by DBRS on Dec. 9, 2013. Charts are provided for illustrative purposes. Past performance is not a guarantee of future results.
As of Dec. 31, 2013, the S&P/TSX Preferred Share Index’s yield was 4.97%. Since 2004, the trailing index dividend yield has remained in the range of 5%-7%. The S&P/TSX Preferred Share Index has consistently had a
7 Source: Bloomberg, Bank of Canada. Dividend and yield data as of Dec. 31, 2013. The launch date of the S&P/TSX Preferred Share Index is April 3, 2007. Past performance is not a guarantee of future results. 8 Source: Dominion Bond Rating Service.
24
96
58
28
0
20
40
60
80
100
120
under 4% 4%-5% 5%-6% 6% or higher
19
127
59
0
20
40
60
80
100
120
140
P1-Low and Higher P2-Low to P2-High P3-Low to P3-High

S&P Dow Jones Indices | A Look Under the Hood of the Canadian Preferred Indices April 2014
9
higher yield than other Canadian asset classes. As of Dec. 31, 2013, equity yielded 2.89% (S&P/TSX Composite) and bonds yielded 2.72% (Bank of Canada 10-year benchmark bond).
Exhibit 11: Historical Dividend Yield
Source: S&P Dow Jones Indices, Bank of Canada. Data from Dec. 31, 2004 to Dec. 31, 2013. Yield for S&P/TSX Composite and S&P/TSX Preferred Share Index is the 12-month trailing dividend yield as of each data point. Yield for the Bank of Canada 10-year bond is the yield to maturity. Charts and graphs are provided for illustrative purposes. Past performance is no guarantee of future results. These charts and graphs may reflect hypothetical historical performance. Please see the Performance Disclosure at the end of this document for information regarding the inherent limitations associated with back-tested performance.
As we noted in an earlier section, the Canadian preferred share market has undergone a significant expansion over the past five years, approximately doubling in market share. The growth of the market and the types of preferred shares it contains are reflected in the types of preferred indices that are now available to investors. In particular, the proliferation of fixed-rate-reset preferred shares and their unique distribution features make it possible for investors to get a degree of protection in a rising-rate environment. In the following section, we introduce the S&P/TSX Preferred Share Laddered Index, which integrates the well known mechanics of bond laddering strategy with the features of rate-reset preferred shares. We also highlight that the potential benefits of a laddered preferred strategy should be evaluated in tandem with potential risk considerations, particularly those arising from a changing regulatory landscape and the possibility of continuing low interest rates.
The S&P/TSX Preferred Share Laddered Index
The S&P/TSX Preferred Share Laddered Index is designed to provide exposure to Canadian preferred shares with staggered reset dates to restrict and equalize term exposure that meets size, liquidity, listing and quality criteria.
The S&P/TSX Preferred Share Laddered Index maintains a 100% long position in the rate-reset preferred shares. Rate-reset preferred shares, as we noted in an earlier section, pay the holder a fixed dividend until the reset date, which takes place every five years. On the reset date, the security is either called by the issuer or the dividend is reset based on a predetermined spread (or premium) over a five-year Government of Canada bond yield. In addition, on the reset date, rate-reset preferred shares give holders an option to exchange for floating-rate preferred shares where the rate is a quarterly dividend based on a 90-day Canada Treasury Bill plus the same predetermined spread.
It is worth noting the concept of bond laddering that underpins the index methodology. Bond laddering is a strategy that involves building a portfolio of bonds with staggered maturities so that a fixed portion of the portfolio matures each year or at specific regular intervals. Once a particular term structure matures, the principal proceeds are then reinvested at the longer end of the ladder.
0%
1%
2%
3%
4%
5%
6%
7%
8%
S&P/TSX Preferred Share Index S&P/TSX Composite Index Bank of Canada 10 year bond
S&P Dow Jones Indices | A Look Under the Hood of the Canadian Preferred Indices April 2014
10
In Exhibit 12, we illustrate the mechanics of the S&P/TSX Preferred Share Laddered Index. The index uses a five-year staggered term structure. Each term bucket, as defined by the calendar year of each constituent’s rate reset, is equal weighted at each rebalance, thereby maintaining 20% weight of the index in each bucket. Upon reset, the issues are then moved to the farthest resetting bucket.
Exhibit 12: Laddering a Portfolio of Rate-Reset preferreds
Year 5 Resets (20%)
Year 4 Resets (20%) Year 4 Resets (20%)
Year 3 Resets (20%) Year 3 Resets (20%)
Year 2 Resets (20%) Year 2 Resets (20%)
Year 1 Resets (20%) Year 1 Resets (20%)
Current Year Resets (20%)
Source: S&P Dow Jones Indices. Charts are provided for illustrative purposes. Past performance is not a guarantee of future results.
Within each bucket, individual securities are weighted by market capitalization. The weight of each individual bucket may be subject to change depending on market conditions and the universe of Canadian preferred shares. At the inception of the index, there were five equally weighted buckets If at any point the number of buckets is reduced to four or less, each bucket will be equally weighted at each rebalance.
It should be noted that a term bucket containing an insufficient number of issues may be combined with the nearest-term bucket. In order for each term bucket to have a sufficient number of issues, it should have a minimum of four outstanding issues or a combined market cap of at least 5% of the total market capitalization of the eligible securities. The requirements for a term bucket are subject to change based on market conditions and the universe of Canadian preferred shares.
For more details on the benefits of laddering, please see “Laddering a Portfolio of Municipal Bonds,” S&P Dow Jones Indices, March 2013.
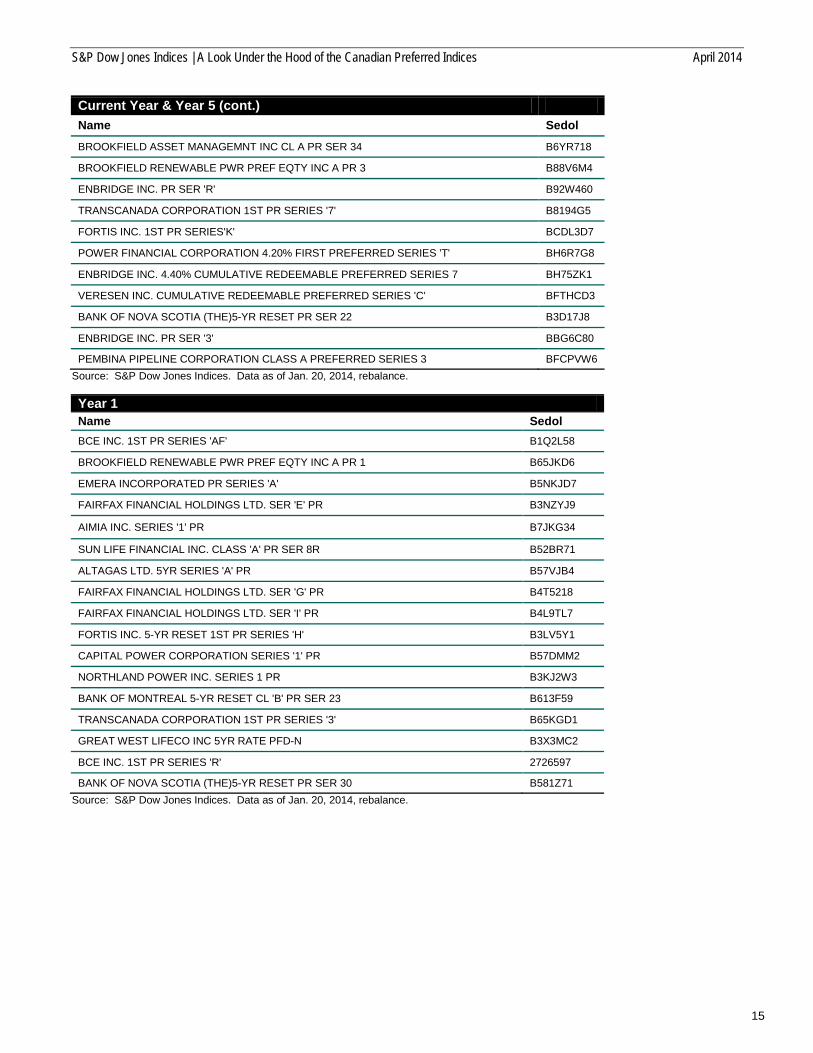
For sample constituents of each term bucket, please see Appendix I.
Index Characteristics
Sector Composition: Exhibit 13 highlights the current sector composition of the larger preferred share market, as represented by the S&P/TSX Preferred Share Index, versus the narrower S&P/TSX Preferred Share Laddered Index. The preferred shares market is dominated by the financials sector because financial institutions tend to be the largest issuers, especially with rate-reset preferreds. The current sector compositions of the two indices reflect the dominance. However, unlike the broader benchmark, the laddered index has less sector concentration in financials (59.60% vs. 67.93%). The laddered index also has higher weights in other sectors such as utilities, telecommunication services, consumer discretionary and energy, but not in consumer staples.

S&P Dow Jones Indices | A Look Under the Hood of the Canadian Preferred Indices April 2014
11
Exhibit 13: Sector Composition
Source: S&P Dow Jones Indices. Data as of Dec. 31, 2013. Charts are provided for illustrative purposes. Past performance is not a guarantee of future results.
Yield: The current yield of the S&P/TSX Preferred Share Ladder Index is slightly higher than that of the broader preferred market, as represented by the S&P/TSX Preferred Share Index. As issues reach their reset dates and their dividend rate is adjusted to prevailing market yields plus a fixed spread, the yield on the laddered index is expected to increase in a rising interest rate environment, provided that constituents are not called by the issuers.
Exhibit 14: Current Yield
Source: S&P Dow Jones Indices. Data as of Dec. 31, 2013. Charts are provided for illustrative purposes. Past performance is not a guarantee of future results.
Risk/Return Profile: The S&P/TSX Preferred Share Laddered Index has exhibited higher volatility than the broader preferred market but significantly lower volatility than the equity market. Exhibit 17 highlights the correlation of the laddered preferred portfolio with the preferred market and the Canadian equities market. It is important to note that the laddered preferred portfolio has a lower correlation to equities than the broader preferred market, which provides potential portfolio diversification benefits.
16.15%
0.20%
1.84%
59.60%
9.64%
12.56%
13.15%
0.20%
1.09%
2.04%
67.93%
6.28%
9.30%
0% 10% 20% 30% 40% 50% 60% 70% 80%
Energy
Materials
Industrials
Consumer Discretionary
Consumer Staples
Healthcare
Financials
Information Technology
Telecommunications Services
Utilities
S&P/TSX Preferred Share Index S&P/TSX Preferred Share Laddered Index
2.89%
4.97% 5.04%
0.00%
1.00%
2.00%
3.00%
4.00%
5.00%
6.00%
S&P/TSX Composite Index S&P/TSX Preferred Share Index S&P/TSX Preferred Share LadderedIndex

S&P Dow Jones Indices | A Look Under the Hood of the Canadian Preferred Indices April 2014
12
Exhibit 15: Annualized Return
Source: S&P Dow Jones Indices. Data based on weekly returns from Feb. 4, 2011, to Dec. 31, 2013. Charts and graphs are provided for illustrative purposes. Past performance is no guarantee of future results. These charts and graphs may reflect hypothetical historical performance. Please see the Performance Disclosure at the end of this document for information regarding the inherent limitations associated with back-tested performance.
Exhibit 16: Annualized Volatility
Source: S&P Dow Jones Indices. Data based on weekly returns from Feb. 4, 2011, to Dec. 31, 2013. Charts are provided for illustrative purposes. Past performance is not a guarantee of future results.
Exhibit 17: Correlation S&P/TSX Preferred Share
Laddered Index S&P/TSX Preferred Share
Index S&P/TSX Composite
S&P/TSX Preferred Share Laddered Index
1.000 0.948 0.212
S&P/TSX Preferred Share Index
0.948 1.000 0.243
S&P/TSX Composite 0.212 0.243 1.000
Source: S&P Dow Jones Indices. Data based on weekly returns from Feb. 4, 2011, to Dec. 31, 2013. Charts are provided for illustrative purposes. Past performance is not a guarantee of future results.
Benefits and Risk Considerations for a Laddered Preferred Portfolio
1.12%
2.36%
3.85%
0%
1%
2%
3%
4%
5%
S&P/TSX Preferred Share Laddered Index S&P/TSX Preferred Share Index S&P/TSX Composite
3.28% 3.24%
13.63%
0%
2%
4%
6%
8%
10%
12%
14%
16%
S&P/TSX Preferred Share LadderedIndex
S&P/TSX Preferred Share Index S&P/TSX Composite

S&P Dow Jones Indices | A Look Under the Hood of the Canadian Preferred Indices April 2014
13
The potential benefits of a laddered bond portfolio relate to interest rate risk and reinvestment risk. Similarly, a laddered portfolio that includes rate-reset preferred securities can buffer price decline in a rising interest rate environment and the need to reinvest principal proceeds.
In a rising interest rate environment, the value of a bond typically falls because of the inverse relationship between bond price and interest rate. Securities with fixed payment distribution and no maturity date, such as the straight perpetual preferred shares, have longer duration and higher interest rate sensitivity. In contrast, rate-reset preferred shares have less duration and interest rate sensitivity due to their rates resetting every five years in line with prevailing market yields, despite having no maturity dates. In other words, a rate-reset preferred share behaves much like a short-term floating-rate bond in a rising-rate environment. It is estimated that the duration of typical rate-reset preferred securities is two to three years, while straight perpetual preferreds typically have durations between 11 and 15 years.10 All else equal, the decline in price of a straight perpetual given a 1% increase in interest rates can be far greater than that of a rate-reset preferred.
Another benefit of laddering a rate-reset preferred portfolio pertains to reinvestment risk. A laddered portfolio has bonds resetting or maturing each year. This gives the portfolio a stream of new cash flow to reinvest in new, high-yielding securities, thereby reducing the reinvestment risk.
As with any strategy, there are potential risks to be considered. One of the two most important considerations with respect to a laddered preferred share portfolio relates to the changing regulatory environment. Under the new Basel III requirements, most of the currently outstanding preferred shares will no longer be considered part of the Tier 1 Capital from 2013 onward. As such, many financial institutions that issue rate-reset preferred shares could start redeeming at this time. This, in turn, poses a reinvestment risk as interest rates remain fairly low despite the possibility that they could rise in the future.
The possibility of continuing low yields poses another risk to the rate-reset preferred securities, as there is a strong likelihood that an increasing number of issued rate-reset shares would be called. The call risk is compounded by the fact that proceeds from preferred shares being called would have to be reinvested at a prevailing low rate. Further, the first rate resets that were issued in 2008 were done so at a credit spread much higher than the current level, reflecting the turmoil in the market. As the spreads have narrowed in recent times, issues that will come up for reset in upcoming months could see their distribution rates set at a prevailing market yield plus a lower spread.
Conclusion
Although the Canadian preferred shares market is small compared to the equity market, it has doubled in size over the past five years. Much of the growth can be attributed to investors seeking alternative sources of yield in a record-low interest rate environment and to financial institutions needing to meet the Tier I Capital requirement. In addition, preferred securities offer potential portfolio diversification and risk reduction benefits, owing to their low correlation with traditional asset classes such as equities and bonds. Using the S&P/TSX Preferred Share Index as the leading market benchmark for the Canadian preferred market, we have reviewed the risk/return characteristics, section composition, yield and credit ratings of the index constituents. Our analysis of the S&P/TSX Preferred Share Laddered Index shows that the combination of a popular bond laddering strategy and the unique distribution features of rate-reset preferred shares can potentially help lower interest rate risk versus traditional fixed income instruments in a rising interest rate environment.
10 National Bank Financial Product Review: BMO Laddered Preferred Share, Jan. 16, 2013.

S&P Dow Jones Indices | A Look Under the Hood of the Canadian Preferred Indices April 2014
14
Appendix I
Sample Constituents of Each Reset Portfolio
Current Year & Year 5 Name Sedol
ROYAL BANK OF CANADA 1ST PR NON-CUM SER 'AJ' B3D4GJ0
BROOKFIELD ASSET MANAGEMNT INC CL A PR SER 22 B51BH94
CO-OPERATORS GENERAL INSURANCE CO CL E PR 'D' B4ZRZP3
CU INC. CUMULATIVE PR SERIES '2' B3P2XB3
HSBC BANK CANADA CL 1 NON-CUMULATIVE SER E PR B3NLJK3
ROYAL BANK OF CANADA 1ST PR NON-CUM SER 'AV' B3Q8F03
TORONTO-DOMINION BANK (THE)5-YR RESET PR 'AG' B4JMNM7
FAIRFAX FINANCIAL HOLDINGS LTD. SERIES 'C' PR B4VTND7
TRANSCONTINENTAL INC. 1ST PR SERIES 'D' B4RVF20
BANK OF MONTREAL 5-YR RESET CL 'B' PR SER 18 B3KG611
BANK OF MONTREAL 5-YR RESET CL 'B' PR SER 21 B65R795
BANK OF NOVA SCOTIA (THE)5-YR RESET PR SER 26 B3L8520
BANK OF NOVA SCOTIA (THE)5-YR RESET PR SER 28 B4JMNJ4
CANADIAN IMPERIAL BANK SERIES '33' PR B3D1SB7
ROYAL BANK OF CANADA 1ST PR NON-CUM SER 'AL' B3FBP36
ROYAL BANK OF CANADA 1ST PR NON-CUM SER 'AX' B3ZKLC4
SUN LIFE FINANCIAL INC. CLASS 'A' PR SER 6R B4RGVK5
TORONTO-DOMINION BANK (THE)5-YR RESET PR 'AA' B3D30V7
TORONTO-DOMINION BANK (THE)5-YR RESET PR 'AI' B626T00
TORONTO-DOMINION BANK(THE) 5-YR RESET PR 'AC' B3FCYM1
CANADIAN WESTERN BANK 5-YR RESET PR SER '3' B5YSM97
MANULIFE FINANCIAL CORP. CL 1 PR SER '1' B51G2W7
MANULIFE FINANCIAL CORP. CL A PR SER '4' B60T8P9
TRANSCANADA CORPORATION 1ST PR SERIES '1' B4TY4B9
BROOKFIELD OFFICE PROPERTIES INC. CL AAA PR SER 'L' B4KDCG6
CANADIAN IMPERIAL BANK SERIES '35' PR B4W8L62
CANADIAN IMPERIAL BANK SERIES '37' PR B626SV4
POWER FINANCIAL CORP. 6% SERIES 'M' 1ST PR B3K6F70
ROYAL BANK OF CANADA 1ST PR NON-CUM SER 'AT' B626V82
TORONTO-DOMINION BANK (THE)5-YR RESET PR 'AE' B3L0DP5
TORONTO-DOMINION BANK (THE)5-YR RESET PR 'AK' B3SRLL1
ROYAL BANK OF CANADA 1ST PR NON-CUM SER 'AR' B3Z4BV5
ROYAL BANK OF CANADA 1ST PR NON-CUM SER 'AN' B3KCV69
ROYAL BANK OF CANADA 1ST PR NON-CUM SER 'AP' B3L0DM2
ENBRIDGE INC. PR SER 'P' B7M93Q0 Source: S&P Dow Jones Indices. Data as of Jan. 20, 2014, rebalance.
S&P Dow Jones Indices | A Look Under the Hood of the Canadian Preferred Indices April 2014
15
Current Year & Year 5 (cont.) Name Sedol
BROOKFIELD ASSET MANAGEMNT INC CL A PR SER 34 B6YR718
BROOKFIELD RENEWABLE PWR PREF EQTY INC A PR 3 B88V6M4
ENBRIDGE INC. PR SER 'R' B92W460
TRANSCANADA CORPORATION 1ST PR SERIES '7' B8194G5
FORTIS INC. 1ST PR SERIES'K' BCDL3D7
POWER FINANCIAL CORPORATION 4.20% FIRST PREFERRED SERIES 'T' BH6R7G8
ENBRIDGE INC. 4.40% CUMULATIVE REDEEMABLE PREFERRED SERIES 7 BH75ZK1
VERESEN INC. CUMULATIVE REDEEMABLE PREFERRED SERIES 'C' BFTHCD3
BANK OF NOVA SCOTIA (THE)5-YR RESET PR SER 22 B3D17J8
ENBRIDGE INC. PR SER '3' BBG6C80
PEMBINA PIPELINE CORPORATION CLASS A PREFERRED SERIES 3 BFCPVW6 Source: S&P Dow Jones Indices. Data as of Jan. 20, 2014, rebalance. Year 1 Name Sedol BCE INC. 1ST PR SERIES 'AF' B1Q2L58
BROOKFIELD RENEWABLE PWR PREF EQTY INC A PR 1 B65JKD6
EMERA INCORPORATED PR SERIES 'A' B5NKJD7
FAIRFAX FINANCIAL HOLDINGS LTD. SER 'E' PR B3NZYJ9
AIMIA INC. SERIES '1' PR B7JKG34
SUN LIFE FINANCIAL INC. CLASS 'A' PR SER 8R B52BR71
ALTAGAS LTD. 5YR SERIES 'A' PR B57VJB4
FAIRFAX FINANCIAL HOLDINGS LTD. SER 'G' PR B4T5218
FAIRFAX FINANCIAL HOLDINGS LTD. SER 'I' PR B4L9TL7
FORTIS INC. 5-YR RESET 1ST PR SERIES 'H' B3LV5Y1
CAPITAL POWER CORPORATION SERIES '1' PR B57DMM2
NORTHLAND POWER INC. SERIES 1 PR B3KJ2W3
BANK OF MONTREAL 5-YR RESET CL 'B' PR SER 23 B613F59
TRANSCANADA CORPORATION 1ST PR SERIES '3' B65KGD1
GREAT WEST LIFECO INC 5YR RATE PFD-N B3X3MC2
BCE INC. 1ST PR SERIES 'R' 2726597
BANK OF NOVA SCOTIA (THE)5-YR RESET PR SER 30 B581Z71 Source: S&P Dow Jones Indices. Data as of Jan. 20, 2014, rebalance.

S&P Dow Jones Indices | A Look Under the Hood of the Canadian Preferred Indices April 2014
16
Year 2 Name Sedol BCE INC. 1ST PR SERIES 'AI' B1Q2L81
BROOKFIELD ASSET MANAGEMNT INC CL A PR SER 24 B5KN683
BROOKFIELD OFFICE PROPERTIES INC. CL AAA PR SER 'N' B3LLHB2
POWER FINANCIAL CORP. 4.40% SERIES 'P' 1ST PR B3X3DP2
TRANSALTA CORP CUML RED PFD-A B4YBKV7
BCE INC. 1ST PR SERIES 'AG' B1Q2L69
BCE INC. 1ST PR SERIES 'T' B1G5X73
BANK OF MONTREAL 5-YR RESET CL 'B' PR SER 25 B3M6M22
GMP CAPITAL INC. 5-YR RST SER 'B' PR B3W5MB8
RIOCAN REAL ESTATE INVEST TR PR UNIT SER 'A' B51GYZ4
SHAW COMMUNICATIONS INC. CL 2 PR SER 'A' B4TJCP4
BANK OF NOVA SCOTIA 5-YR RESET PREFERRED SERIES 32 B3PWHT9
BCE INC. 1ST PREFERRED SERIES 'AK' B3NY8F0
SUN LIFE FINANCIAL INC. CLASS 'A' PREFERRED SERIES 10 B3QNCK7
MANULIFE FINANCIAL CORP. CL 1 PR SER '5' B53QQ78
TALISMAN ENERGY INC. 1ST PR A SERIES 1 B641624
BROOKFIELD ASSET MANAGEMENT INC CL A PR SER 9 2811686
TRANSCANADA CORPORATION 1ST PR SERIES '5' B3VYJK4
MANULIFE FINANCIAL CORP. CL 1 PR SER '3' B637236
BELL ALIANT PREFERRED EQUITY INC. SER 'A' PR B3LFQB7
HUSKY ENERGY INC. SERIES '1' PR B3S36M5
BROOKFIELD OFFICE PROPERTIES INC. CL AAA PR SER 'R' B6YBGX5
INTACT FINANCIAL CORPORATION PREFERRED CLASS 'A' SERIES 3 B6QVBB6
SUN LIFE FINANCIAL INC. CLASS 'A' PR SER 12R B588709 Source: S&P Dow Jones Indices. Data as of Jan. 20, 2014, rebalance.

S&P Dow Jones Indices | A Look Under the Hood of the Canadian Preferred Indices April 2014
17
Year 3 Name Sedol BCE INC. 1ST PR SERIES 'AA' 2852771
BROOKFIELD OFFICE PROPERTIES INC PREF CL AAA SERIES P B5M4Y02
BROOKFIELD ASSET MANAGEMNT INC CL A PR SER 28 B67BZ91
CANADIAN UTILITIES LIMITED 2ND PREFERRED SERIES 'Y' B5V2333
INTACT FINANCIAL CORPORATION PREFERRED CLASS 'A' SERIES 1 B3LDJC3
BROOKFIELD ASSET MANAGEMNT INC CL A PR SER 30 B6Z9MX0
TRANSALTA CORPORATION 1ST PR SER 'C' B6Y1L74
BELL ALIANT PFD EQUITY INC 4.55% PFD-C B79DMP7
MANULIFE FINANCIAL CORP. CL 1 PR SER '7' B6RQHL2
RIOCAN REAL ESTATE INVEST TR PR UNITS SER 'C' B765DK8
VERESEN INC. CUMULATIVE SERIES 'A' PR B7PF1V6
MANULIFE FINANCIAL NON-CUMULATIVE CLASS 1 PREFERRED SERIES '9' B6WDSD7
NORTHLAND POWER INC. CUMULATIVE RATE-RESET PREFERRED SERIES '3' B7B1107
NATIONAL BANK OF CANADA 5-YR 1ST PR SER '28' B8WSHS4
FAIRFAX FINANCIAL HOLDINGS LTD 5YR SER 'K' PR B7KG5L2
LAURENTIAN BANK OF CANADA PR 'A' SERIES 11 B7XFS73
VALENER INC. PREFERRED SERIES 'A' B8C28G1
TRANSALTA CORPORATION 1ST PR SER 'E' B7JQDG4
BROOKFIELD ASSET MANAGEMNT INC CL A PR SER 26 B3MXZ57
ENBRIDGE INC. PREFERRED SERIES 'B' B3Z1R85
INDUSTRIAL ALLIANCE 4.30% PREFERRED SERIES 'G' B83Z0G3 Source: S&P Dow Jones Indices. Data as of Jan. 20, 2014, rebalance.

S&P Dow Jones Indices | A Look Under the Hood of the Canadian Preferred Indices April 2014
18
Year 4 Name Sedol BANK OF MONTREAL 5-YR RESET CL 'B' SERIES 16 B3B3HC9
BANK OF NOVA SCOTIA (THE)5-YR RESET PR SER 20 B39V844
TORONTO-DOMINION BANK (THE) 5-YR RESET PR S B39VNS3
TORONTO-DOMINION BANK (THE) 5-YR RESET PR Y B3BQMQ7
ENBRIDGE INC. PR SER 'D' B6QDHS1
ENBRIDGE INC. PR SER 'F' B7LRW13
EMERA INCORPORATED PREFERRED SERIES 'C' B8C11K3
BROOKFIELD OFFICE PROP INC. CL AAA PR SER 'T' B7R7358
ENBRIDGE INC. PR SER 'N' B85MGP3
ALGONQUIN POWER & UTILITIES CORP. SER 'A' PR B89MLL0
MANULIFE FINANCIAL CORP NN-CM CL 1 PR SER 11 B9B9FP8
ARTIS REAL ESTATE INVEST TR PR UN SER 'E' B9FHKZ3
CAPITAL POWER CORPORATION SERIES '5' PR B9G4P81
PEMBINA PIPELINE CORPORATION CLASS A PREFERRED SERIES 1 BCJDWL8
ALTAGAS LTD. 5 YR RESET PREFERRED SERIES 'E' BH7QXC2
FORTIS INC. 5-YR RESET 1ST PR SERIES 'G' B39HV43
ENBRIDGE INC. PR SER 'H' B7JD6M2
BROOKFIELD ASSET MANAGEMNT INC CL A PR SER 32 B75L8Q8
CAPITAL POWER CORPORATION SERIES '3' PR B8FDQX4
BELL ALIANT PREFERRED EQTY INC 5YR PR SER 'E' B8T1B17
MANULIFE FINANCIAL CORP. CL 1 PR SER '13' BBPCG10
BANK OF NOVA SCOTIA (THE)5-YR RESET PR SER 18 B2QHLK5
BCE INC. 1ST PR SERIES 'AC' 2429904 Source: S&P Dow Jones Indices. Data as of Jan. 20, 2014, rebalance.

S&P Dow Jones Indices | A Look Under the Hood of the Canadian Preferred Indices April 2014
19
ABOUT S&P DOW JONES INDICES S&P Dow Jones Indices LLC, a part of McGraw Hill Financial, Inc., is the world’s largest, global resource for index-based concepts, data and research. Home to iconic financial market indicators, such as the S&P 500® and the Dow Jones Industrial Average™, S&P Dow Jones Indices LLC has over 115 years of experience constructing innovative and transparent solutions that fulfill the needs of institutional and retail investors. More assets are invested in products based upon our indices than any other provider in the world. With over 830,000 indices covering a wide range of assets classes across the globe, S&P Dow Jones Indices LLC defines the way investors measure and trade the markets. To learn more about our company, please visit www.spdji.com
Like What You Read? Sign up to receive complimentary updates on a broad range of index-related topics and events brought to you by S&P Dow Jones Indices.

S&P Dow Jones Indices | A Look Under the Hood of the Canadian Preferred Indices April 2014
20
PERFORMANCE DISCLOSURES The S&P/TSX Preferred Share Index was launched on April 3, 2007. All information presented prior to the launch date is back-tested. Back-tested performance is not actual performance, but is hypothetical. The back-test calculations are based on the same methodology that was in effect when the index was officially launched. Complete index methodology details are available at www.spdji.com. It is not possible to invest directly in an index. The S&P/TSX Preferred Share Laddered Index was launched on Nov. 19, 2012. All information presented prior to the launch date is back-tested. Back-tested performance is not actual performance, but is hypothetical. The back-test calculations are based on the same methodology that was in effect when the index was officially launched. Complete index methodology details are available at www.spdji.com. It is not possible to invest directly in an index. S&P Dow Jones Indices defines various dates to assist our clients in providing transparency on their products. The First Value Date is the first day for which there is a calculated value (either live or back-tested) for a given index. The Base Date is the date at which the Index is set at a fixed value for calculation purposes. The Launch Date designates the date upon which the values of an index are first considered live: index values provided for any date or time period prior to the index’s Launch Date are considered back-tested. S&P Dow Jones Indices defines the Launch Date as the date by which the values of an index are known to have been released to the public, for example via the company’s public website or its datafeed to external parties. For Dow Jones-branded indicates introduced prior to May 31, 2013, the Launch Date (which prior to May 31, 2013, was termed “Date of introduction”) is set at a date upon which no further changes were permitted to be made to the index methodology, but that may have been prior to the Index’s public release date. Past performance of the Index is not an indication of future results. Prospective application of the methodology used to construct the Index may not result in performance commensurate with the back-test returns shown. The back-test period does not necessarily correspond to the entire available history of the Index. Please refer to the methodology paper for the Index, available at www.spdji.com for more details about the index, including the manner in which it is rebalanced, the timing of such rebalancing, criteria for additions and deletions, as well as all index calculations. Another limitation of using back-tested information is that the back-tested calculation is generally prepared with the benefit of hindsight. Back-tested information reflects the application of the index methodology and selection of index constituents in hindsight. No hypothetical record can completely account for the impact of financial risk in actual trading. For example, there are numerous factors related to the equities, fixed income, or commodities markets in general which cannot be, and have not been accounted for in the preparation of the index information set forth, all of which can affect actual performance. The Index returns shown do not represent the results of actual trading of investable assets/securities. S&P Dow Jones Indices LLC maintains the Index and calculates the Index levels and performance shown or discussed, but does not manage actual assets. Index returns do not reflect payment of any sales charges or fees an investor may pay to purchase the securities underlying the Index or investment funds that are intended to track the performance of the Index. The imposition of these fees and charges would cause actual and back-tested performance of the securities/fund to be lower than the Index performance shown. As a simple example, if an index returned 10% on a US $100,000 investment for a 12-month period (or US $10,000) and an actual asset-based fee of 1.5% was imposed at the end of the period on the investment plus accrued interest (or US $1,650), the net return would be 8.35% (or US $8,350) for the year. Over a three year period, an annual 1.5% fee taken at year end with an assumed 10% return per year would result in a cumulative gross return of 33.10%, a total fee of US $5,375, and a cumulative net return of 27.2% (or US $27,200).

S&P Dow Jones Indices | A Look Under the Hood of the Canadian Preferred Indices April 2014
21
DISCLAIMER
© S&P Dow Jones Indices LLC, a part of McGraw Hill Financial 2014. All rights reserved. Standard & Poor’s and S&P are registered trademarks of Standard & Poor’s Financial Services LLC (“S&P”) a part of McGraw Hill Financial. Dow Jones is a registered trademark of Dow Jones Trademark Holdings LLC (“Dow Jones”). Trademarks have been licensed to S&P Dow Jones Indices LLC. Redistribution, reproduction and/or photocopying in whole or in part are prohibited without written permission. This document does not constitute an offer of services in jurisdictions where S&P Dow Jones Indices LLC, Dow Jones, S&P or their respective affiliates (collectively “S&P Dow Jones Indices”) do not have the necessary licenses. All information provided by S&P Dow Jones Indices is impersonal and not tailored to the needs of any person, entity or group of persons. S&P Dow Jones Indices receives compensation in connection with licensing its indices to third parties. Past performance of an index is not a guarantee of future results
It is not possible to invest directly in an index. Exposure to an asset class represented by an index is available through investable instruments based on that index. S&P Dow Jones Indices does not sponsor, endorse, sell, promote or manage any investment fund or other investment vehicle that is offered by third parties and that seeks to provide an investment return based on the performance of any index. S&P Dow Jones Indices makes no assurance that investment products based on the index will accurately track index performance or provide positive investment returns. S&P Dow Jones Indices LLC is not an investment advisor, and S&P Dow Jones Indices makes no representation regarding the advisability of investing in any such investment fund or other investment vehicle. A decision to invest in any such investment fund or other investment vehicle should not be made in reliance on any of the statements set forth in this document. Prospective investors are advised to make an investment in any such fund or other vehicle only after carefully considering the risks associated with investing in such funds, as detailed in an offering memorandum or similar document that is prepared by or on behalf of the issuer of the investment fund or other investment vehicle. S&P Dow Jones Indices LLC is not a tax advisor. A tax advisor should be consulted to evaluate the impact of any tax-exempt securities on portfolios and the tax consequences of making any particular investment decision. Inclusion of a security within an index is not a recommendation by S&P Dow Jones Indices to buy, sell, or hold such security, nor is it considered to be investment advice.
These materials have been prepared solely for informational purposes based upon information generally available to the public from sources believed to be reliable. No content contained in these materials (including index data, ratings, credit-related analyses and data, model, software or other application or output therefrom) or any part thereof (Content) may be modified, reverse-engineered, reproduced or distributed in any form by any means, or stored in a database or retrieval system, without the prior written permission of S&P Dow Jones Indices. The Content shall not be used for any unlawful or unauthorized purposes. S&P Dow Jones Indices and its third-party data providers and licensors (collectively “S&P Dow Jones Indices Parties”) do not guarantee the accuracy, completeness, timeliness or availability of the Content. S&P Dow Jones Indices Parties are not responsible for any errors or omissions, regardless of the cause, for the results obtained from the use of the Content. THE CONTENT IS PROVIDED ON AN “AS IS” BASIS. S&P DOW JONES INDICES PARTIES DISCLAIM ANY AND ALL EXPRESS OR IMPLIED WARRANTIES, INCLUDING, BUT NOT LIMITED TO, ANY WARRANTIES OF MERCHANTABILITY OR FITNESS FOR A PARTICULAR PURPOSE OR USE, FREEDOM FROM BUGS, SOFTWARE ERRORS OR DEFECTS, THAT THE CONTENT’S FUNCTIONING WILL BE UNINTERRUPTED OR THAT THE CONTENT WILL OPERATE WITH ANY SOFTWARE OR HARDWARE CONFIGURATION. In no event shall S&P Dow Jones Indices Parties be liable to any party for any direct, indirect, incidental, exemplary, compensatory, punitive, special or consequential damages, costs, expenses, legal fees, or losses (including, without limitation, lost income or lost profits and opportunity costs) in connection with any use of the Content even if advised of the possibility of such damages.
Credit-related and other analyses, including ratings, research and valuations are generally provided by affiliates of S&P Dow Jones Indices, including but not limited to Standard & Poor’s Financial Services LLC and Capital IQ, Inc. Such analyses and statements in the Content are statements of opinion as of the date they are expressed and not statements of fact. Any opinion, analyses and rating acknowledgement decisions are not recommendations to purchase, hold, or sell any securities or to make any investment decisions, and do not address the suitability of any security. S&P Dow Jones Indices does not assume any obligation to update the Content following publication in any form or format. The Content should not be relied on and is not a substitute for the skill, judgment and experience of the user, its management, employees, advisors and/or clients when making investment and other business decisions. S&P Dow Jones Indices LLC does not act as a fiduciary or an investment advisor. While S&P Dow Jones Indices has obtained information from sources they believe to be reliable, S&P Dow Jones Indices does not perform an audit or undertake any duty of due diligence or independent verification of any information it receives.]
To the extent that regulatory authorities allow a rating agency to acknowledge in one jurisdiction a rating issued in another jurisdiction for certain regulatory purposes, S&P Ratings Services reserves the right to assign, withdraw or suspend such acknowledgement at any time and in its sole discretion. S&P Dow Jones Indices, including S&P Ratings Services disclaim any duty whatsoever arising out of the assignment, withdrawal or suspension of an acknowledgement as well as any liability for any damage alleged to have been suffered on account thereof.
Affiliates of S&P Dow Jones Indices LLC may receive compensation for its ratings and certain credit-related analyses, normally from issuers or underwriters of securities or from obligors. Such affiliates of S&P Dow Jones Indices LLC reserve the right to disseminate its opinions and analyses. Public ratings and analyses from S&P Ratings Services are made available on its Web sites, www.standardandpoors.com (free of charge), and www.ratingsdirect.com and www.globalcreditportal.com (subscription), and may be distributed through other means, including via S&P Rating Services publications and third-party redistributors. Additional information about our ratings fees is available at www.standardandpoors.com/usratingsfees.
S&P Dow Jones Indices keeps certain activities of its business units separate from each other in order to preserve the independence and objectivity of their respective activities. As a result, certain business units of S&P Dow Jones Indices may have information that is not available to other business units. S&P Dow Jones Indices has established policies and procedures to maintain the confidentiality of certain non-public information received in connection with each analytical process.
In addition, S&P Dow Jones Indices provides a wide range of services to, or relating to, many organizations, including issuers of securities, investment advisers, broker-dealers, investment banks, other financial institutions and financial intermediaries, and accordingly may receive fees or other economic benefits from those organizations, including organizations whose securities or services they may recommend, rate, include in model portfolios, evaluate or otherwise address.