a log based analysis to estimate mechanical properties · pdf filea log based analysis to...
TRANSCRIPT

A log based analysis to estimate mechanical properties and in-situ stresses in a shale gas well in North Perth Basin
S. Archer & V. Rasouli Department of Petroleum Engineering, Curtin University, Australia
Abstract
In drilling operation the design of a proper mud weight to avoid any instability’s is important. A low mud weight may cause breakouts around the borehole whereas a high mud weight can fracture the formation. Mud weight design is based on two main factors: the mechanical properties of formations being drilled and the state of in-situ stresses in the field. While drilling in soft formations are thought to be more prone to drilling related issues than hard formations, there are several cases where opposite observations have been reported. This is indeed due to a high stress anisotropy which can apply a large shear stress to the rock to fail it. As it is seen, in order to define the stable mud weight windows for drilling it is important to not only have a good understanding about the mechanical properties of formations but also a good estimation of the state of stresses in the field. In this study we used a log based methodology to extract rock elastic and strength properties as well as the magnitude of stresses including vertical and maximum and minimum horizontal stresses. This is based on the fundamental relationship between physical properties of rocks as captured in petrophysical logs (such as sound velocity or density) and mechanical properties, such as uniaxial compressive strength. Due to rapid increase in developing unconventional reservoirs, in particular in Australia, in this study we applied the log based analysis as a case study to a shale gas well drilled in the North Perth Basin. Continuous logs of elastic and strength properties were extracted using available correlations and were calibrated at some depths where the triaxial lab tests results were reported on some core samples. The pore pressure and stress profiles were estimated using poro-elastic relationships. Pore pressure profile was calibrated using MDT data, the minimum stress profile was calibrated against the leak-off test data and maximum stress curve was fixed in a way to
Petroleum and Mineral Resources 163
www.witpress.com, ISSN 1743-3533 (on-line) WIT Transactions on Engineering Sciences, Vol 81, © 201 WIT Press2
doi:10.2495/PMR120151

recover the failures observed by callipers. The estimated logs, also called rock mechanical model (RMM) or mechanical earth model (MEM) was used to determine the stable mud weight windows for drilling. The RMM is the input for many other studies including, hydraulic fracturing initiation pressure and sanding analysis. Keywords: mechanical earth model, in situ stresses, mud weight window.
1 Introduction
Arrowsmith 1(AS1), situated in the north central part of the Pert Basin (EP 413) is an exploration well drilled in April 1965 and operated by Norwest Energy. The primary drilling target was the Basal Triassic Sandstone, which is an oil and gas producing formation in the nearby Yardarino well. What resulted was the discovery of the first gas bearing sandstone reservoir in the North Perth Basin, encountered near the top of the Carynginia formation. The Irwin River Coal Measures (IRCM), lying below the Carynginia formation were evaluated due to their high fluorescence however low porosity and permeability made producing from the formation uneconomical [1]. The IRCM are now the subject of the first shale frac in the Perth Basin at the nearby well Arrowsmith 2 (AS2), drilled in May 2011 and situated 300m to the SE of AS1. The Rock Mechanical Model (RMM) or Mechanical Earth Model (MEM) is a numerical representation of the state of stress and rock mechanical properties for a specific stratigraphic section in a field or basin [2]. Developed after the drilling operations, the MEM can be linked with Core data to provide localized stress conditions and predictive breakdown and breakout pressures. Most importantly, the MEM can predict the Mud Weight Window (MWW) applicable to the well, minimizing the risk of kick and breakouts. Many drilling problems relating to wellbore stability or pore pressure can often be avoided if proper investigations and understanding of local geomechanics is undertaken. The practice of wellbore stability was developed throughout the 1980s, where geophysical logs were becoming the basis of well bore stability models. At the heart of these models was the sonic log, which is used in calculations for pore pressure, horizontal stress magnitudes, elastic parameters and rock strength [3]. The sonic log is used to develop dynamic rock properties which are then converted to static properties when calibrated against results from triaxial and uniaxial tests on core sample. These static elastic properties can then be further developed to develop rock strength properties and a safe mud weight window based on shear and tensile rock failure [4]. In the following, the workflow to construct the RMM will be presented briefly. This will be followed by presenting the results of the RMM constructed for Arrowsmith 1.
164 Petroleum and Mineral Resources
www.witpress.com, ISSN 1743-3533 (on-line) WIT Transactions on Engineering Sciences, Vol 81, © 201 WIT Press2

2 Rock mechanical modelling
An RMM or MEM is an explicit description of the mechanical properties of the reservoir and overburden formations, including rock strength and elastic properties, the state of in situ stresses and pore pressure [2]. Three major steps are to be taken to construct an RMM. These include: 1. Discriminate formations based on the matrix structure, either grain supported
(i.e. sandstone) or clay supported (i.e. shale). Gamma ray log may be used with a certain threshold for this purpose.
2. Estimate rock properties including elastic properties such as Young’s modulus (EM), strength properties mainly the uniaxial compressive strength (UCS), and tensile strength and calibrate them using lab experimental data, mainly from triaxial tests.
3. Estimate the vertical stress using the density log and pore pressure from existing methods such as Eaton equation based sonic or resistivity logs. Also two horizontal stresses can be estimated from the poro-elastic equations. Pore pressure log is calibrated using formation pressure data such as MDT or DST. The minimum stress can be calibrated by closure pressure obtained from a minifrac test or the leak-off pressure from a leak-off test (LOT). The maximum stress profile may be calibrated using sonic scanner data if available otherwise based on the instabilities observed from image log or calipers.
The RMM is the input to many studies including determination of the MWW, hydraulic fracturing design and sanding analysis. In below sub-sections the process of estimating rock mechanical properties and on-situ stress profiles are briefly reviewed.
2.1 Elastic properties
Dynamic elastic rock properties including the Young’s modulus (EMDyn) and Poisson’s ratio () are calculated in relation with the rock density, , and compression and shear wave velocity, Vp and Vs, (i.e. inverse of compression and shear transit time DT and DTS from sonic log) as below:
)(
)43(22
222
sc
scsdyn VV
VVVE
(1)
)(2
222
22
sc
scdyn VV
VV
(2)
The dynamic properties representing log acquired data are converted to the static rock properties in static conditions. Several correlations are available for
Petroleum and Mineral Resources 165
www.witpress.com, ISSN 1743-3533 (on-line) WIT Transactions on Engineering Sciences, Vol 81, © 201 WIT Press2

this purpose. The equations below proposed by Wang (Eqn (3)) and Morals (Eqn (4)) [5], respectively, are most commonly used:
0593.14145.0 dynsta EE (3)
963.021.2 dynsta EE (4)
In the above equation is the formation porosity. The static Poisson’s ratio is considered equal to its dynamic value. Having obtained the Young’s modulus and Poisson’s ratio the shear (G) and bulk moduli (K) of the formations can be estimated from below elastic relationships.
)1(2 sta
stasta
EG
(5)
)21(3 sta
stasta
EK
(6)
In the absence of shear sonic data, which was not commonly run as part of the wireline logging program one may build a synthetic shear log using Greenberg and Castagna correlations [6]:
9.8558042.0 ps VV . (7)
2.2 Unconfined Compressive Strength (UCS)
Deriving Unconfined Compressive Strength (UCS) from sonic data has previously been modeled by several empirical methods [7]. Horsrud [8], Chang et al. [9], Bradford et al. [10] and Lal [11] all derived UCS models for shale formations of different geological locations and depositional age. Horsrud [8] developed an empirical correlation based on a large database of North Sea core logs, focusing on the effect of sonic slowness, porosity and Young’s Modulus. Lal [12] concluded that the primary factors affecting shale strength were primarily governed by the degree of compaction, whereas the clay mineralogy is of secondary importance [13]. Bradford proposed the following correlation with Young’s modulus to estimate the UCS:
staEUCS 1089.428.2 . (8)
The tensile strength of the rocks is considered 1/10 of the UCS. Friction angle (FANG) can be estimated using Plumb’s correlation (1994) in relation to the formation porosity and volume of the clay (Vclay):
2)1(1.62)1(4.375.26 clayeclay VVFANG (9)
166 Petroleum and Mineral Resources
www.witpress.com, ISSN 1743-3533 (on-line) WIT Transactions on Engineering Sciences, Vol 81, © 201 WIT Press2

Vclay can be estimated from the Gamma ray data. Also, as porosity log was not available we used Wyllie et al. [14] correlation to estimate it from compression sonic. This equation is in the form of:
8549.475414.371
8549.47
DT (10)
2.3 Overburden stress
The overburden stress (SigV) is the integration of rock density to the depth of interest. The density log is used across the available interval and it is extrapolated to the surface to have an estimation of density for intervals where no density log is available.
2.4 Pore pressure
In modern drilling operations, the Pore Pressure is measured during drilling phases as well as during the wireline operations using MDT and DST measurements. To obtain a continuous profile for pore pressure different correlations are used. Perhaps Eaton’s equation [15] which was developed based on compression sonic (DT) or resistivity logs is the most commonly used method to predict pore pressure:
n
nDT
DTPPGOBGOBGPPG
(11)
In above equation OBG is the overburden pressure gradient and DT and DTn are the compression sonic transit time and the normal compaction trend for DT. Coefficient n depends on the geological setting of the area.
2.5 Horizontal stresses
Wellbore imaging and multi-arm caliper logs can determine the direction of the plane of maximum and minimum horizontal stress however the magnitude of these values can be calculated from poro-elastic equations below:
)(
)1()(
)1( 2 yxsta
ppvh
EPP
(12)
)(
)1()(
)1( 2 xysta
ppvH
EPP
(13)
In above equations Pp is the pore pressure and x and y are parameters corresponding to tectonic strains in the field. By changing these parameters the magnitudes of the two horizontal stresses are fixed in relation to the calibration points, hence an estimation of stress anisotropy can be obtained. The Biot’s coefficient takes into account the poro-elastic behavior of rock but in our study we consider this as 1.
Petroleum and Mineral Resources 167
www.witpress.com, ISSN 1743-3533 (on-line) WIT Transactions on Engineering Sciences, Vol 81, © 201 WIT Press2

3 RMM for Arrowsmith 1
The workflow explained in the previous section was used to construct the RMM for well Arrowsmith 1. The shear sonic log was constructed using equation (7) for this well. Wang correlation given in equation (3) was used to convert dynamic Young’s modulus to static Young’s modulus. Also, Bradford equation (8) was used to estimate the UCS. As no core data was acquired in this well the results of lab test data in nearby wells were used for calibration of rock mechanical properties. Although this may encounter some uncertainty in the model, is the only available option. Similarly, the LOT data from other wells used to calibrate the min horizontal stress profile. No abnormal pore pressure has been reported in this field and hence a normal pore pressure profile was considered based on available data within the field. Figure 1 shows the input logs used for this study. In this figure, the first track shows the depth in meter. As the wellbore is vertical the MD and TVD are similar. The second track shows the formation tops. Track 3 includes the GR, porosity (SPHI_WYLLIE) and estimated Vclay profiles. Track 4 shows the compression sonic (DT) and constructed shear sonic (DTSEST) profiles. In track 5 the bit size (Hole_Size) and the caliper log are shown.
Figure 1: The petrophysical logs used for construction of RMM in well Arrowsmith 1.
168 Petroleum and Mineral Resources
www.witpress.com, ISSN 1743-3533 (on-line) WIT Transactions on Engineering Sciences, Vol 81, © 201 WIT Press2

Figure 2 presents the elastic and strength property profiles. Track 1 in this figure is the depth in meter. The second track shows the dynamic and static Young’s moduli (E_dyn, E_sta). Track 3 represents static shear (G_sta) and static bulk moduli (K_sta) of the formations. These moduli are shown in GPa. Track 4 is the Poisson’s ratio (POISRATIO) and Biot’s coefficient (BIOT_FACTOR). The last track represents the UCS and Tensile strengths of the formations in MPa. In this track also the friction angle (FANG) of the formations are shown. The results of Figure 2 shows that the elastic and strength properties vary in a similar trend to the sonic logs as they are derived based on these values. These properties show increasing values at deeper depth, which is due to larger overburden, hence lower porosity of the formations. However, the elastic properties and formation strength may vary in different formations.
Figure 2: Elastic and strength profiles estimated in well Arrowsmith 1.
Figure 3 shows how the density log was extrapolated to the surface to have an estimation of the density of the formations within the intervals where no density log is available. Density of the rocks near the surface was assumed 1.8 gr/cm3. The density log was used to estimate the magnitude of overburden (SigV) and horizontal (Sighmin, SigHmax) stresses.
Petroleum and Mineral Resources 169
www.witpress.com, ISSN 1743-3533 (on-line) WIT Transactions on Engineering Sciences, Vol 81, © 201 WIT Press2

Figure 3: Extrapolation of the density log to the surface.
Figure 4 shows the stress profiles together with the pore pressure profile (PP) which was constructed based on normal pressure assumption from MDT pressure data. The horizontal stresses in this figure were fixed to ensure that Sighmin is close to the LOT data points and that the stress anisotropy applied can predict the observed breakout failures by calipers. The results show moderate stress anisotropy with the stress regime being nearly strike-slip in the lower depths as the order of the stress magnitude is SigHmax>SigV>Sighmin but changing to normal stress regime where the largest stress is SigV. Figure 5 presents the results of determination of safe MWW. The first track in this figure is the depth (m). The second track contains the formation tops and the third track shows local stress profiles. The fourth track shows the mud weight associated with four commonly observed failures during drilling. If the MW used for drilling is well below the pore pressure then a kick is expected (Kick_MW). A low MW but not below the pore pressure may result in shear failures of the rock in the form of breakouts (BO_MW). On the other hand increasing the MW above the Sighmin will result in mud loss (LOSS_MW) but increasing it further may result in fracturing the formation in the form of tensile or breakdown failure (BD_MW). The mud weight used to drill this well (MW) is also shown in this track. It is seen at some sections it is below the BO_MW; hence it is expected to have some breakout failure in these intervals. This is confirmed by observations from Caliper which is shown in the right track in Figure 5. The results indicate a relatively good match between model prediction and observations from Calipers. The results shown in Figure 5 indicate the mud weight used in the 8½” section from 2285m onwards was too low that contributed to the wellbore breakouts recorded by the caliper logs.
y = 0.1387ln(x) + 1.515
0
0.5
1
1.5
2
2.5
3
0 1000 2000 3000 4000
Density (g/cm
3)
Depth (m)
170 Petroleum and Mineral Resources
www.witpress.com, ISSN 1743-3533 (on-line) WIT Transactions on Engineering Sciences, Vol 81, © 201 WIT Press2

Figure 4: Pore pressure and stress profiles in well Arrowsmith 1.
Theoretically, a 1.5 SG mud weight would have been sufficient as to reduce the shear failure present in the Kockatea, Carynginia and IRCM formations. From practical point of view a good hole cleaning is proposed to be practiced within the breakout intervals if increasing the MW is not possible. The results indicate the need for high quality data and lab and filed test data for calibration purposes in order to have a reliable model with minimum uncertainty. This demonstrates the need to acquire as much data as possible for such analysis.
Petroleum and Mineral Resources 171
www.witpress.com, ISSN 1743-3533 (on-line) WIT Transactions on Engineering Sciences, Vol 81, © 201 WIT Press2
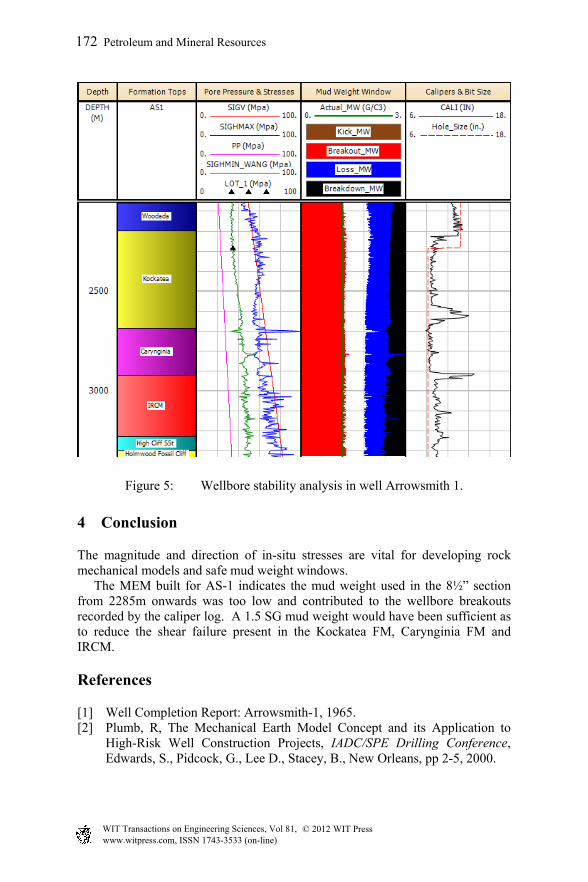
Figure 5: Wellbore stability analysis in well Arrowsmith 1.
4 Conclusion
The magnitude and direction of in-situ stresses are vital for developing rock mechanical models and safe mud weight windows. The MEM built for AS-1 indicates the mud weight used in the 8½” section from 2285m onwards was too low and contributed to the wellbore breakouts recorded by the caliper log. A 1.5 SG mud weight would have been sufficient as to reduce the shear failure present in the Kockatea FM, Carynginia FM and IRCM.
References
[1] Well Completion Report: Arrowsmith-1, 1965. [2] Plumb, R, The Mechanical Earth Model Concept and its Application to
High-Risk Well Construction Projects, IADC/SPE Drilling Conference, Edwards, S., Pidcock, G., Lee D., Stacey, B., New Orleans, pp 2-5, 2000.
172 Petroleum and Mineral Resources
www.witpress.com, ISSN 1743-3533 (on-line) WIT Transactions on Engineering Sciences, Vol 81, © 201 WIT Press2

[3] Rasouli, V., Palllikathekathil Z.J. and Mawuli E., The influence of Perturbed Stresses Near Faults on Drilling Strategy: A Case Study in Blacktip Field, North Australia, Journal of Petroleum Science and Engineering, 76(2), pp 37-50, 2011.
[4] Perchikolaee,S., Building a Precise Mechanical Earth Model and its Application in Drilling Operation Optimization: A Case Study of Asmari Formation in Mansuri Oil Field, CPS/SPE Internation Oil & Gas Conference and Exhibition, Shadizadeh S.R., Shahryar K., Kazemzadeh, E., Beijing, PP 3-8, June 2010.
[5] Wang H.F., Theory of Linear Poroelasticity, Princeton University Press, Princeton, 2000.
[6] Greenberg, M.L. and Castagna, J.P., Shear-Wave Velocity Estimation in Porous Rocks: Theoretical Formulation, Preliminary Verification and Application”, Geophysical Prospecting, 40(2), pp 195-209, 1992.
[7] Khaksar, A., “Rock Strength from Core Logs: Where We Stand and Ways to Go, EUROPEC/EAGE Annual Conference and Exhibition, Taylor, P.G., Fang, Z., Kayes, T., Salazar, A., Rahman, K., Amsterdam, pp 2-8, June 2009.
[8] Horsrud, P., “Estimating mechanical properties of shale from empirical correlations”. SPE Drilling & Completion 16, 68–73, (2001).
[9] Chang, C., Zoback, M.D and Khaksar, A., Empirical relations between rock strength and physical properties in sedimentary rocks. Journal of Petroleum Science & Engineering, 51, 223-237, 2006.
[10] Bradford, I.D.R., Fuller, J., Thompson, P.J and Walsgrove, T.R., Benefits of assessing the solid production risk in a North Sea reservoir using elastoplastic modeling. SPE/ISRM 47360, 1998.
[11] Lal, M., “Shale stability: Drilling fluid interaction and shale strength”. SPE 54356. In: SPE Asia Pacific Oil and Gas Conference and Exhibition, Jakarta, Indonesia, 20–22 April. 1999.
[12] Lal, M., Shale stability: drilling fluid interaction and shale strength, SPE Latin American and Caribbean Conference, 1999.
[13] Kumar, R.R. and Rao, D.G., Review of Methods for Uniaxial Compressive Rock Strength in Deepwater Formations with Uncertainty Quantification in Wellbore Stability Analysis in Absence of Core Measurements, SPE Deepwater Drilling and Completions Conference, pp 8-11, June 2012.
[14] Wyllie, M.R.J., Gregory, A.R. and Gardner, G.H.F., Elastic Wave Velocities in Heterogeneous and Porous Media, Geophysics, 21 (1), pp 41-70, 1956.
[15] Eaton, B.A., The Equation for Geopressure Precision from Well Logs, 50th Annual Fall Meeting of the Society of Petroleum Engineers of AIME, Dallas, October 1975.
[16] Carnegie, A., An Advanced Method of Determining Insitu Reservoir Stresses: Wireline Conveyed Microfracturing, 10th Annual Abu Dhabi International Petroleum Exhibition and Conference, Thomas, M., Efrinik, M.S., Hamawi, M., Akbar, M., Burton, M., 2002.
Petroleum and Mineral Resources 173
www.witpress.com, ISSN 1743-3533 (on-line) WIT Transactions on Engineering Sciences, Vol 81, © 201 WIT Press2

[17] Afsari, M., Mechanical Earth Model (MEM): An Effective Tool for Borehole Stability Analysis and Managed Pressure Drilling, SPE Middle East Oil & Gas Show and Conference, Ghafoori, M.R., Roostaeian, M., Haghshenas, A., Ataei, A., Masoudi, R., March 2009.
[18] Cai, J., Wellbore stability Analysis in the South China Sea: A Case Study, SPE Asia Pacific Oil and Gas Conference and Exhibition, Shao, S., Zhang, C., September 2011.
174 Petroleum and Mineral Resources
www.witpress.com, ISSN 1743-3533 (on-line) WIT Transactions on Engineering Sciences, Vol 81, © 201 WIT Press2