needle-type gmr sensor to estimate the magnetic properties
TRANSCRIPT

HAL Id: hal-01284010https://hal.archives-ouvertes.fr/hal-01284010
Submitted on 18 Jul 2016
HAL is a multi-disciplinary open accessarchive for the deposit and dissemination of sci-entific research documents, whether they are pub-lished or not. The documents may come fromteaching and research institutions in France orabroad, or from public or private research centers.
L’archive ouverte pluridisciplinaire HAL, estdestinée au dépôt et à la diffusion de documentsscientifiques de niveau recherche, publiés ou non,émanant des établissements d’enseignement et derecherche français ou étrangers, des laboratoirespublics ou privés.
Needle-type GMR sensor to estimate the magneticproperties of diluted ferrofluid for biomedicine
applicationHamidreza Shirzadfar, Mustapha Nadi, Djilali Kourtiche, S. Yamada, Thomas
Hauet
To cite this version:Hamidreza Shirzadfar, Mustapha Nadi, Djilali Kourtiche, S. Yamada, Thomas Hauet. Needle-typeGMR sensor to estimate the magnetic properties of diluted ferrofluid for biomedicine application.Innovation and Research in BioMedical engineering, Elsevier Masson, 2015, 36 (3), pp.178-184.�10.1016/j.irbm.2015.01.014�. �hal-01284010�

Page | 1
Needle-type GMR Sensor to Estimate the Magnetic Properties of Diluted Ferrofluid for
Biomedicine Application
H Shirzadfar1, M Nadi
1, D Kourtiche
1, S Yamada
2 and T Hauet
1
1. Institut Jean Lamour, UMR CNRS 7198, Université de Lorraine, 54506 Vandœuvre-lès-Nancy, France
2. Institute of Nature and Environmental Technology, Kanazawa University, Kanazawa 920-1192, Japan
Corresponding author:
E-mail address: [email protected]
Université de Lorraine-CNRS, UMR 7198, Institut Jean Lamour, Vandœuvre-lès-Nancy, France
Tel: +33 3 83 68 41 56; Fax: +33 3 83 68 41 53
Abstract:
This paper proposes a needle-type giant magnetoresistance (GMR) sensor for very low magnetic fluid weight
density of ferrofluid estimation. The magnetic fluids or ferrofluids due to their biocompatibility are used for
various applications in medicine such as cancer treatment, magnetic resonance imagining (MRI), cell separation
and also to detect the bacteria. The high sensitivity of GMR sensor gives us to accurately measure the magnetic
properties of ferrofluid in a weak magnetic field. The results were obtained by GMR sensor are compared by
theoretical results and showing that the GMR sensor has a good ability for biofluid magnetic characterization.
Keywords:
Magnetic fluid, GMR sensor, demagnetizing factor, weight density, relative permeability, susceptibility.
1. Introduction
In several applications such as in medical care, environmental issues and chemicals analysis methods need to
sense small amount of specific molecules. Using magnetic micro or nanoparticles to mark, detect, move or
destroy living cells or molecules has recently gained a lot of interest [1]. Therefore, a large effort is lead toward
developing compatible magnetic micro-nanoparticles as well as designing new high sensitivity magnetic sensors
[2]. Giant magnetoresistance (GMR) sensors are particularly well suited for biomedical projects because they
provide high sensitivity and detection capability at the micro [3] or nanoscale [4].
Ferrofluids or magnetic liquids involve extremely nanoparticle size of magnetic materials (iron, nickel or
cobalt), they currently have a great importance in the mechanical or electronic military technology as well as in
the various domains of medical applications such as magnetic resonance imaging (MRI) diagnostic, tissue
repair, cellular therapy, magnetofection, cell separation, magnetic drug-targeting and hyperthermia treatment [5,
6]. The typical and most common bio-applications of magnetic fluid are described below:
− Magnetic cell separation is widely useful and very inexpensive method for separating different types of
cells. The magnetic beads using in this method represent a mix of a polymer magnetic iron oxide in the
range from 10 nm to 10 µm [7].
− Magnetic drug targeting is a transportation of drugs to target tissue place with aid and use of an
external magnetic field toward a tumor [8].
− Magnetic resonance imaging (MRI) is a diagnostic and very informative method which is widely used
in medicine to create a detailed picture of internal organs. It allows diagnosing soft tissue, brain, joints,
bones and detecting focal lesions of central nervous system (CNS), liver lesions or tumors. Moreover,

Page | 2
MRI is a rather safe technique if compared with computerized tomography (CT) or X-ray. In MRI
diagnostic the ferrofluid is sometimes injected into a vein (intravenous injection) in order to enhance
the contrast of MRI imaging [9].
− In hyperthermia treatment the tumor tissue targeting with magnetic nanoparticles, and placing under an
AC magnetic field to heating the tumor tissue, where in the temperature of the body or body part
reaches 42°C and more [10, 11].
Magnetic fluids are a unique system that combines the properties of paramagnetic materials and the ability to
control thermal and optical characteristics of the magnetic field. Each particle of magnetic fluid is coated with a
thin layer of protective membrane that prevents the adhesion of the particles.
Ferrofluids do not exhibit ferromagnetic properties because it does not retain the remanent magnetization after
that the external magnetic field has been shut off. In fact, liquids show features of “superparamagnetism”
because of the lack of coupling between nanoparticles. Therefore, an external magnetic field orientates the
magnetic moments of particles almost independently. The alignment of the magnetized particles along the
magnetic field leads to a change in physical properties (magnetic, optical and rheological) of the system. In
addition, under the influence of an external magnetic field, hydrostatic pressure in the liquid changes so that any
non-magnetic body is pushed out of it whereas the magnetic particles moves towards the highest field strength
liquid region. All this together allows controlling the behavior and physical properties of magnetic fluids and
devices containing magnetic fluid.
The needle-type magnetoresistance (GMR) sensors exist in different models depending on the number of
sensing element and also their dimensions. Until now, they have been used for different investigations such as in
printed circuit board (PCB) inspection checking [12], measurement of nerve pulse current [13] etc. The aim of
the present research is to demonstrate the efficiency of a type of GMR sensor which has a good potential to
estimate the magnetic fluid weight density (DW) with low concentration as low as 2.5%.
2. Materials and method
2.1 Needle-Type GMR Sensor
The GMR sensor consists of two principal parts. The first one is a needle’s sensor and the second one is a
Wheatstone bridge circuit.
The needle length is 17 mm with a cross section 300 μm×300 µm. It can be inserted into the cavity midpoint of
ferrofluid. The needle of GMR sensor is made of hard materials such as Aluminum Titanium Carbide (AlTiC)
and sintered materials of Aluminum Oxide (Al2O3) and Titanium Carbide (TiC).
The needle of this sensor has four GMR sensing elements with 75 μm×40 μm dimensions for each sensing
element. The first sensing element is located at the tip and the rest of sensing elements are placed at the end of
the needle. All sensing elements are connected in a Wheatstone bridge configuration. Figure 1 shows the GMR
sensor architecture.

Page | 3
Figure 1. Schematic of the GMR needle type sensor and sensor’s Wheatstone bridge configuration.
The Wheatstone bridge configuration of the GMR sensor permits to measure voltage variations induced by
magnetic field with removing DC component of GMR polarization, and allows to measure magnetic flux
density inside and outside of fluid filed container of magnetic liquid.
The GMR sensor is connected to a DC power supply (±6 V) via an interface card. Interface card of the GMR
sensor permits to limit the current. Furthermore, we should point out that for this type of the GMR sensor the
maximum current being 5 mA.
As we mentioned previously, the GMR sensor has four sensing elements, the first sensing element at the top of
sensor is in contact with the magnetic liquid in the container (inside magnetic flux density B1) and the other
sensing elements are embedded to sense magnetic flux density (B0) at the outside of the ferrofluid’s cavity.
The magnetic fluid weight density at fluid cavity can be calculated taking into account the difference between
the outside and the inside magnetic flux density respectively B0, and B1.
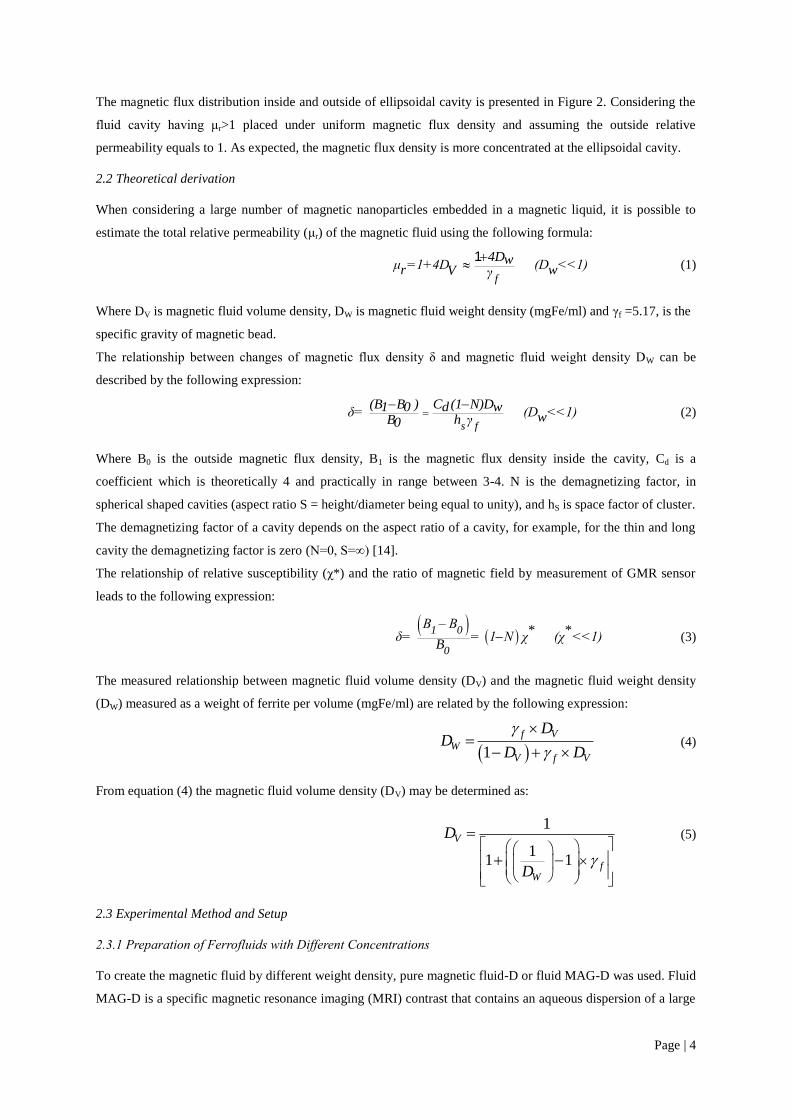
Figure 2. Magnetic flux density distribution inside and outside of ellipsoidal cavity.
Page | 4
The magnetic flux distribution inside and outside of ellipsoidal cavity is presented in Figure 2. Considering the
fluid cavity having μr>1 placed under uniform magnetic flux density and assuming the outside relative
permeability equals to 1. As expected, the magnetic flux density is more concentrated at the ellipsoidal cavity.
2.2 Theoretical derivation
When considering a large number of magnetic nanoparticles embedded in a magnetic liquid, it is possible to
estimate the total relative permeability (μr) of the magnetic fluid using the following formula:
f
4Dwμ =1+4D (D <<1)r wV γ
1 (1)
Where DV is magnetic fluid volume density, DW is magnetic fluid weight density (mgFe/ml) and γf =5.17, is the
specific gravity of magnetic bead.
The relationship between changes of magnetic flux density δ and magnetic fluid weight density DW can be
described by the following expression:
s f
(B B ) C (1 N)D1 0 d wδ= (D <<1) wB h γ0
(2)
Where B0 is the outside magnetic flux density, B1 is the magnetic flux density inside the cavity, Cd is a
coefficient which is theoretically 4 and practically in range between 3-4. N is the demagnetizing factor, in
spherical shaped cavities (aspect ratio S = height/diameter being equal to unity), and hS is space factor of cluster.
The demagnetizing factor of a cavity depends on the aspect ratio of a cavity, for example, for the thin and long
cavity the demagnetizing factor is zero (N=0, S=∞) [14].
The relationship of relative susceptibility (χ*) and the ratio of magnetic field by measurement of GMR sensor
leads to the following expression:
1 0
0
B – B* *
δ= = 1 N χ (χ <<1) B
(3)
The measured relationship between magnetic fluid volume density (DV) and the magnetic fluid weight density
(DW) measured as a weight of ferrite per volume (mgFe/ml) are related by the following expression:
1
VfW
V Vf
DD
D D
(4)
From equation (4) the magnetic fluid volume density (DV) may be determined as:
1
11 1
V
fW
D
D
(5)
2.3 Experimental Method and Setup
2.3.1 Preparation of Ferrofluids with Different Concentrations
To create the magnetic fluid by different weight density, pure magnetic fluid-D or fluid MAG-D was used. Fluid
MAG-D is a specific magnetic resonance imaging (MRI) contrast that contains an aqueous dispersion of a large

Page | 5
number of superparamagnetic iron oxide nanoparticles (Fe3O4 = FeII(Fe
III)2O4) with hydrodynamic diameters of
100−200nm [15]. The magnetic fluid-D is produced by Chemicell Company and it can be injected as an
intravenous injection (IV), to reduce the time dissemination and immediate imaging of the body’s organs.
Moreover, it can be used in hyperthermia cancer therapy. The product information of the fluid MAG-D is shown
in Table 1.
Table 1. The specification of the fluid MAG-D [15].
Volume 1.5ml
Size of particles 100nm 200nm
Number of Particles 1.8x10¹⁵
/g 2.2x10¹⁴
/g
Weight of Volume 25mg/ml
Density of each particle (Magnetite) 5.17g/cm3
Magnetic core Magnetite (Fe3O4)
Color Brown
Application MRI-diagnostics
Cell separation
Magnetic Drug-Targeting
Experiments were performed to prepare different magnetic fluids with several weight densities (DW). In this
experiment the fluid MAG-D by particles size 200 nm is diluted by distilled water to achieve several magnetic
fluids with weight density at respectively 0.23%, 0.35%, 0.62%, 1.24% and 2.45% as shown in Figure 3. The
weight density and volume density of pure fluid MAG-D and different concentration can be determined from
the equations 4 and 5. Furthermore, to dilute the concentration is used the micro pipette to reduce the amount of
mixing errors.
In our experiments, the magnetic fluid is inserted in a “cylindrical cavity” with ellipsoidal shape for the surface
base. We assume that the magnetic nanoparticles are uniformly distributed in the fluid. Soft matter or solids can
show ferromagnetic, paramagnetic, diamagnetic behaviors and in ferrofluids exhibit superparamagnetic
behavior according to their magnetic susceptibility [5].
Figure 3. Top-view cavities of five different weight densities of magnetic fluid.
Next, the 450 μl of magnetic fluid were poured by micro pipette to cylindrical shape cavity (fabricated with
Polydimethylsiloxane or PDMS) of dimensions 8×8 mm, after the five ferrofluids were placed respectively at
the midpoint of the Helmholtz coil, where the magnetic field is more uniform.
Pure
DV=0.48%
DW=2.45%
1:1
DV=0.24%
DW=1.24%
1:3
DV=0.12%
DW=0.62%
1:6
DV=0.07%
DW=0.35%
1:10
DV=0.04%
DW=0.23%
Page | 6
2.3.2 Measurement Setup of GMR Sensor
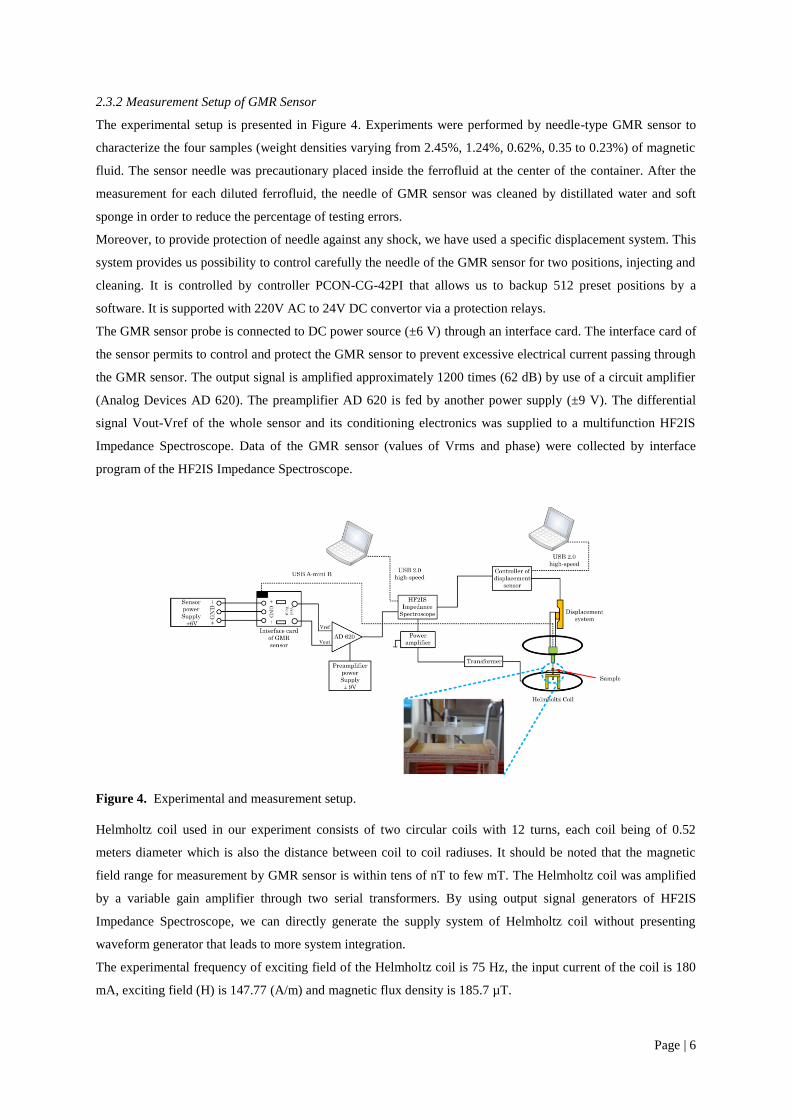
The experimental setup is presented in Figure 4. Experiments were performed by needle-type GMR sensor to
characterize the four samples (weight densities varying from 2.45%, 1.24%, 0.62%, 0.35 to 0.23%) of magnetic
fluid. The sensor needle was precautionary placed inside the ferrofluid at the center of the container. After the
measurement for each diluted ferrofluid, the needle of GMR sensor was cleaned by distillated water and soft
sponge in order to reduce the percentage of testing errors.
Moreover, to provide protection of needle against any shock, we have used a specific displacement system. This
system provides us possibility to control carefully the needle of the GMR sensor for two positions, injecting and
cleaning. It is controlled by controller PCON-CG-42PI that allows us to backup 512 preset positions by a
software. It is supported with 220V AC to 24V DC convertor via a protection relays.
The GMR sensor probe is connected to DC power source (±6 V) through an interface card. The interface card of
the sensor permits to control and protect the GMR sensor to prevent excessive electrical current passing through
the GMR sensor. The output signal is amplified approximately 1200 times (62 dB) by use of a circuit amplifier
(Analog Devices AD 620). The preamplifier AD 620 is fed by another power supply (±9 V). The differential
signal Vout-Vref of the whole sensor and its conditioning electronics was supplied to a multifunction HF2IS
Impedance Spectroscope. Data of the GMR sensor (values of Vrms and phase) were collected by interface
program of the HF2IS Impedance Spectroscope.
Figure 4. Experimental and measurement setup.
Helmholtz coil used in our experiment consists of two circular coils with 12 turns, each coil being of 0.52
meters diameter which is also the distance between coil to coil radiuses. It should be noted that the magnetic
field range for measurement by GMR sensor is within tens of nT to few mT. The Helmholtz coil was amplified
by a variable gain amplifier through two serial transformers. By using output signal generators of HF2IS
Impedance Spectroscope, we can directly generate the supply system of Helmholtz coil without presenting
waveform generator that leads to more system integration.
The experimental frequency of exciting field of the Helmholtz coil is 75 Hz, the input current of the coil is 180
mA, exciting field (H) is 147.77 (A/m) and magnetic flux density is 185.7 µT.

Page | 7
2.3.3 Measurement by Vibrating Sample Magnetometers (VSM)
Commercial vibrating sample magnetometer (VSM model 3374-140 GMW Associates) was used in order to
measure macroscopically the in-field magnetization behavior of the ferrofluids. Several magnetic fluids were
prepared from pure fluid MAG-D and placed into the VSM measurement setup (see Figure 5).
Figure 5. VSM measurement setup where the container of ferrofluid is placed at the center of VSM
Figure 6 shows typical “magnetization versus magnetic field amplitude” loop obtained for a magnetic field
applied perpendicularly to the length of the cylindrical cavity (Fig. 2 is as a top view of the cavity). No
hysteresis neither remanent magnetization is observed in the measured loop, this loop is typical of paramagnetic
or “superparamagnetic” materials. If each magnetic nanoparticle is considered as one magnetic moment, the
completely random organization at zero field leads to zero magnetization. Thus under an external magnetic
field, the magnetic moments tend to align and a non-null magnetization appears that reaches. As the magnetic
fluid is diluted with distillated water, the overall magnetization at saturation decreases but the magnetization at
saturation per magnetic fluid dose stays constant. This observation confirms that the magnetization originates
from non-interacting particles.
Figure 6. Magnetic hysteresis loop of pure fluid MAG-D and its different concentrations obtained by VSM
device.
3. Results
The experimental analysis obtained by GMR sensor was calculated for each ferrofluid’s concentration and also
was compared with theoretical results according to equations (1, 3) for confirmation. The results of relationships

Page | 8
between relative permeability (μr) and susceptibility (χ) depending on weight density obtained by needle type
GMR sensor and theoretical are presented in Figure 7 and Figure 8. We can also observe from the results that μr
and χ are linear and proportional to DW.
Figure 7. Experimental results of the relative permeability (μr) as a function of different weight densities Dw
(%) and comparison with the theoretical results.
Figure 8. Comparison of the experimental and theoretical results of the susceptibility variations (χ) as a function
of the weigh density Dw (%).
The GMR needle probe was used to estimate the magnetic properties (μr, χ) of the magnetic fluid, by measuring
the applied magnetic flux density outside (B0=185.7 µT) and inside (B1) of cavities.
Figure 9. Magnetic fluid density variations calculated for magnetic flux density (δ) versus weight density (DW)
of ferrofluids.
Page | 9
According to the Equation (2), the experimental results were performed to estimate the magnetic flux density (δ)
by increasing weight density (DW) with shape ratio of cavity (S = 1 and N= 0,333 for ellipsoidal shape), and the
result obtained by the GMR sensor is presented in Figure 9.
4. Discussion of GMR Sensor’s Concept and its Performance
The characterization of the GMR sensor was determined by creating the uniform magnetic flux density for only
one sensing GMR element. The sensor’s sensitivity is approximately equal to 8.5 µV/µT. It permits to
accurately estimate the magnetic properties of magnetic fluid at low concentration and to improve the
measurement in very low magnetic field due to its high sensitivity and more easy portability compared to similar
methods such as VSM or SQUID. Another interest is its ability to perform the time real and imaginary analysis
in a sweep frequency range.
Magneticspectroscopy of ferrofluids plays an important role in a medicine as noted before. For example, in
hyperthermia treatment the amount of required heat of ferrofluid inside a tumor depends on the ferrofluid’s
weight density (DW). After injection DW decreases because of the intra-tumor dilution of the ferrofluid. Thus it is
important to check DW in order to reach a successful treatment. The GMR sensor opens interesting ways to
develop biosensors for medical applications of magnetic fluids.
5. Conclusions
In this study a magnetic sensor technology based on giant magnetoresistance has been presented. It was
demonstrated that the GMR sensor is useful and convenient for biomedical applications in order to characterize
magnetic properties of low concentrated magnetic fluids in a weak magnetic field.
The experimental results achieved in this paper showed a proportional relationship between relative
permeability, susceptibility and magnetic flux density (in the approximately range 0.02-0.0016 for the
susceptibility) as a function of weight density for small volume (S=1, N=0.333).
Moreover, for triangulation of validity and reliability of GMR sensor’s results we did the same analysis using as
well the theoretical one. The results obtained by GMR sensor compared to those obtained by theoretical are
close and both results confirm each other.

Page | 10
References
[1] Kyrtatos P 2010 Cell targeting and imaging using magnetic nanoparticles. University College London)
[2] Shirzadfar H, Claudel J, Nadi M, Kourtiche D and Yamada S 2014 XIII Mediterranean Conference on
Medical and Biological Engineering and Computing 2013, ed L M Roa Romero: Springer International
Publishing) pp 833-6
[3] Feng J, Wang Y, Li F, Shi H and Chen X 2011 Detection of magnetic microbeads and ferrofluid with
giant magnetoresistance sensors. In: Journal of Physics: Conference Series: IOP Publishing) p 012002
[4] Li G, Sun S, Wilson R J, White R L, Pourmand N and Wang S X 2006 Spin valve sensors for
ultrasensitive detection of superparamagnetic nanoparticles for biological applications Sensors and
Actuators A: Physical 126 98-106
[5] Pankhurst Q A, Connolly J, Jones S K and Dobson J 2003 Applications of magnetic nanoparticles in
biomedicine Journal of Physics D-Applied Physics 36 R167-R81
[6] Mahdavi M, Ahmad M, Haron M, Namvar F, Nadi B, Rahman M and Amin J 2013 Synthesis, Surface
Modification and Characterisation of Biocompatible Magnetic Iron Oxide Nanoparticles for
Biomedical Applications Molecules 18 7533-48
[7] http://www.scribd.com/doc/7214596/Cell-Separation
[8] Alexiou C, Arnold W, Klein R J, Parak F G, Hulin P, Bergemann C, Erhardt W, Wagenpfeil S and
Lubbe A S 2000 Locoregional cancer treatment with magnetic drug targeting Cancer Research 60
6641-8
[9] Ahmadi R, Hosseini H R M, Masoudi A, Omid H, Namivandi-Zangeneh R, Ahmadi M, Ahmadi Z and
Gu N Effect of concentration on hydrodynamic size of magnetite-based ferrofluid as a potential MRI
contrast agent Colloids and Surfaces A Physicochemical and Engineering Aspects 424 113
[10] Kobayashi T 2011 Cancer hyperthermia using magnetic nanoparticles Biotechnology Journal 6 1342-7
[11] Silva A C, Oliveira T R, Mamani J B, Malheiros S M F, Malavolta L, Pavon L F, Sibov T T, Amaro E,
Tannus A, Vidoto E L G, Martins M J, Santos R S and Gamarra L F 2011 Application of hyperthermia
induced by superparamagnetic iron oxide nanoparticles in glioma treatment International Journal of
Nanomedicine 6 591-603
[12] Chomsuwan K, Yamada S, Iwahara M, Wakiwaka H and Shoji S Application of eddy-current testing
technique for high-density double-Layer printed circuit board inspection IEEE Transactions on
Magnetics 41 3619
[13] Lekawa A, Gooneratne C P, Chomsuwan K, Iwahara M, Stryczewska H and Yamada S 2008 Detection
of Magnetic Field Distribution from Nerve Action Model With Needle Type SV-GMR Sensor The
Japan Society Applied Electromagnetics and Mechanics 16 221-6
[14] Osborn J A 1945 Demagnetizing Factors of the General Ellipsoid Physical Review 67 351-7
[15] http://www.chemicell.com/products/Magnetic_Nanoparticle/Magnetic_Nanoparticles.html
Words: 3345
Paragraphs: 116
Lines: 280