a lean data how-to guide understanding gender impact · acumen a lean data how-to guide:...
TRANSCRIPT

A Lean Data How-To Guide: Understanding Gender ImpactAcumen 1
A LEAN DATA HOW-TO GUIDE
UNDERSTANDING GENDER IMPACT
PHASE 2

A Lean Data How-To Guide: Understanding Gender ImpactAcumen 2A Lean Data How-To Guide: Understanding Gender ImpactAcumen 2

A Lean Data How-To Guide: Understanding Gender ImpactAcumen 3
FOREWORD
Dear Reader,
Katja Freiwald Yasmina Zaidman
Existing data makes it hard to have a clear understanding
of the gender dimensions of poverty. We recognize poverty
can impact women and men differently, but often do not
know how or why. If we could measure and understand
the differences between the ways women and men
experience poverty, could that enable us to make better
decisions as business leaders, program managers, and
investors striving for gender equity? We believe it can. This
is why Acumen and Unilever have partnered, leveraging
the Lean Data methodology, to amplify the voices of low-
income men and women in understanding the gender
dimension of poverty.
Yet, insights from this Lean Data How-To Guide are not
only useful for understanding the gender impact of
companies and programs working with individuals living
in poverty, they can be applied across all income levels.
What if we really listened to the men and women who
are the customers and beneficiaries of our companies
and programs? What if we learned the different ways in
which they experience our products or services because of
their gender? How could these data propel our companies
and projects to have a greater social impact? A more
successful business model? Gathering data can be costly
and time-consuming, but the Lean Data methodology
enables data collection and analysis in a quick, robust, and
actionable way.
To close the gender gap, we need tools to help us
understand how to meaningfully capture gender impacts
across programs, services, and initiatives. The Lean
Data Gender Toolkit provides a simple, easy-to-use,
and actionable approach to help businesses, program
designers, and investors put the voices of those they aim
to serve at front and center.
The utility of this toolkit is not about getting more women as customers, but rather unlocking the potential of women as decision-makers, employees, entrepreneurs, and leaders. The lessons in this report
can enable us to become more gender-smart investors,
business CEOs, and program managers.
Acumen and Unilever have worked together as partners
for the past five years to drive forward entrepreneurial
solutions to social challenges. We believe in the power
of partnership across sectors to move forward on joint
global goals. At Unilever, we strive to embody a people-
first and purpose-driven lens to everything we do. We
believe unlocking the potential of women is both a moral
obligation and a strong business opportunity. At Acumen,
our mission is to change the way the world tackles poverty
by investing in companies and leaders creating new
solutions to society’s biggest problems. Lessons from this
toolkit enable both of us to deliver on our goals, and we
hope it can do the same for you.
We hope to be the generation that solves entrenched
problems of gender equity. To do this we need robust
data, the right instruments, and unflagging commitment
to challenging the status quo. We hope the approach,
surveys, and methodology outlined in this report will
allow you to better understand the gendered impacts of
your companies or programs and, if needed, revise your
strategies to better meet the needs of both women and
men, ultimately putting us on the path towards realizing
gender equity. This is a toolkit to promote human progress
– we hope you will use it!
Sincerely,

A Lean Data How-To Guide: Understanding Gender ImpactAcumen 4
ABOUT ACUMEN
ABOUT LEAN DATASM AND 60 DECIBELS
Acumen is changing the way the world tackles poverty by investing in
companies, leaders and ideas. We invest patient capital in businesses whose
products and services are enabling the poor to transform their lives. Founded
by Jacqueline Novogratz in 2001, Acumen has invested more than $120 million
in 119 companies across Africa, Latin America, South Asia and America. We are
also developing a global community of emerging leaders with the knowledge,
skills and determination to create a more inclusive world. To learn more,
visit acumen.org.
Lean DataSM is a customer-centric, technology-based approach to impact
measurement created by Acumen. Lean DataSM makes it easy to listen
to the people who matter most, bringing customer-centricity, speed and
responsiveness to impact measurement. Lean DataSM has worked with
hundreds of leading impact investors, corporations and NGOs—including
the DFID, CDC, Omidyar Network, Global Partnerships and Ceniarth—to help
them understand their social impact. The Lean DataSM team has completed
more than 350 projects across 34 countries, hearing from more than 100,000
customers. In early 2019, seeing the growing demand for Lean DataSM, Acumen
spun out Lean DataSM into a new social enterprise called 60 Decibels. 60
Decibels brings investors and social business leaders closer to their customers,
to make impact management both real and useful. To learn more,
visit 60decibels.com.

A Lean Data How-To Guide: Understanding Gender ImpactAcumen 5
ABOUT UNILEVER Unilever is one of the world’s leading suppliers of Beauty & Personal Care,
Home Care and Foods & Refreshment products with sales in over 190 countries
and reaching 2.5 billion consumers a day. It has 161,000 employees and
generated sales of €53.7 billion in 2017. Over half (57%) of the company’s
footprint is in developing and emerging markets. Unilever has more than
400 brands found in homes all over the world including Persil, Dove, Knorr,
Domestos, Hellmann’s, Lipton, Wall’s, PG Tips, Ben & Jerry’s, Magnum and Lynx.
Unilever’s Sustainable Living Plan (USLP) underpins the company’s strategy and
commits to:
• Helping more than a billion people take action to improve their health and well-being by 2020.
• Halving the environmental impact of its products by 2030.
• Enhancing the livelihoods of millions of people by 2020.
The USLP creates value by driving growth and trust, eliminating costs and
reducing risks. The company’s sustainable living brands are growing 46% faster
than the rest of the business and delivered 70% of the company’s growth in
2017.
Unilever was ranked as an industry leader in the 2018 Dow Jones Sustainability
Index. In the FTSE4Good Index, it achieved the highest environmental score
of 5. It led the list of Global Corporate Sustainability Leaders in the 2017
GlobeScan/SustainAbility annual survey for the seventh year running and
achieved four A ratings across Climate Change, Water, Forests and Supplier
Engagement in CDP’s 2018 Global Supply Chain report.
Unilever has pledged to become carbon positive in its operations by 2030 and to
ensure 100% of its plastic packaging is fully reusable, recyclable or compostable
by 2025.
For more information about Unilever and its brands, please visit unilever.com.
For more information on the USLP, please visit unilever.com/sustainable-living.

A Lean Data How-To Guide: Understanding Gender ImpactAcumen 6
O9
27
51
17
31
55
21
45
57
INTRODUCTION
IMPLEMENTATION
CONCLUDING REMARKS
CAN ‘LEANER’ DATA MAKE THE WORLD A BETTER PLACE FOR WOMEN?
KEY FINDINGS
APPENDIX A
DEVELOPING AND TESTING THE SURVEY TOOL
BEYOND THE QUESTIONS
CASE STUDIES

A Lean Data How-To Guide: Understanding Gender ImpactAcumen 7
CONTENTS

A Lean Data How-To Guide: Understanding Gender ImpactAcumen 8

A Lean Data How-To Guide: Understanding Gender ImpactAcumen 9
O1INTRODUCTION
9

A Lean Data How-To Guide: Understanding Gender ImpactAcumen 10
YOU ARE EXACTLY THE PERSON WE HOPED WOULD BE READING THIS.YOU ARE HERE BECAUSE YOU BELIEVE IN GENDER EQUITY AND YOU UNDERSTAND THE IMPACT THAT COMES WHEN WE CONSCIOUSLY SUPPORT EFFORTS THAT EMPOWER WOMEN AND GIRLS.
You also know that, despite recent progress, we are not doing enough.
The facts are familiar and sobering: despite increasing focus, progress on many critical gender equity issues has been painfully slow.

A Lean Data How-To Guide: Understanding Gender ImpactAcumen 11
According to the World Economic Forum’s Global Gender Gap Report 2017,1 “At the current rate of change, [the “economic” gender gap] will now not be closed for another 217 years.” This is unacceptable. Collectively, we are failing to turn our good intentions around gender equity into action.
We believe that limitations in our capacity to measure progress against these goals are a key part of the problem. Current gender-specific measurement practices focus primarily on the number of women and girls impacted by various programs. This is a good start, but it is not enough. To help close the gender gap more quickly, we need tools to help us understand how different approaches, with different intentions and designs, specifically impact different genders.
We know that data can be daunting. It can feel complex, academic and difficult to manage. But we must start, even if we do not yet have all the answers.
This report shares our initial approach to developing a Lean DataSM Gender Toolkit. It reflects the first step of our own learning journey, kicking off what we hope will be a deeper conversation about how to meaningfully capture gender impacts across programs, services and initiatives. We also hope it will be useful to other similarly motivated organizations and maybe even those that do not yet have a specific gender focus.
A LITTLE BACKGROUND: WHO, WHAT AND WHY
This report grew out of a multiyear partnership between Unilever and
Acumen focused on developing entrepreneurial solutions to social challenges that each organization is tackling. The development of a Lean DataSM Gender Toolkit takes Unilever and Acumen’s work on gender impacts a step further.
But why develop a new tool rather than apply one that already exists?
We have found that, while there has been extensive, high-quality research on gender equality and impacts, there are few easy-to-use tools for direct beneficiary tracking and quantifying progress on achieving gender-specific goals. Perhaps this is one of the drivers of what Bill and Melinda Gates describe as “sexist data,” referencing the lack of women’s voices in international development datasets.2 Moreover, we have found few examples of gender analysis applying the kinds of techniques used by Lean DataSM, that uses technology (principally mobile phones) to gather quick, robust, actionable data.
We knew that if we were experiencing this gap, others were likely feeling it too and we believed that we could make a positive contribution to the field by developing such a tool. Thus, our goal has been to create a measurement toolkit that is simple, easy-to-use and helps program designers and investors hear the voices of those they aim to serve.
1. http://www3.weforum.org/docs/WEF_GGGR_2017.pdf2. https://www.gatesnotes.com/2019-Annual-Letter

A Lean Data How-To Guide: Understanding Gender ImpactAcumen 12
WHAT YOU’LL FIND IN THIS DOCUMENT
This document captures eight months of work measuring gender impacts across five projects in four countries. The subsequent sections of this report detail the approach, surveys and methodology for the Lean DataSM Gender Toolkit and provide both project-level analysis and consolidated insights across all five projects.
This work represents the start of what we hope becomes a broader conversation around actionable gender impact measurement and lays bare some of the challenges and lessons learned from our experience testing different question modules and data collection methods.
This toolkit is by no means exhaustive in its examination of impact measurement methods to better understand gender dynamics. Indeed, we developed and applied it to only five projects. However, we hope it provides guidance on how to structure survey tools to unlock gender insights and how to design a data collection methodology that accounts for the unique constraints and opportunities facing each gender.

A Lean Data How-To Guide: Understanding Gender ImpactAcumen 13

A Lean Data How-To Guide: Understanding Gender ImpactAcumen 14
ACUMEN'S PREVIOUS WORK IN INVESTING WITH A GENDER LENS
A Lean Data How-To Guide: Understanding Gender ImpactAcumen 14
Acumen is committed to supporting women by investing in companies and entrepreneurs that challenge the status quo in terms of gender. It invests in women as part of the solution to more effectively solve the problems of poverty and, in doing so, is pioneering innovative models for building a more inclusive world.
Acumen first examined its portfolio with a gender lens in 2014-15, publishing its findings in a 2015 report titled Women and Social Enterprises: How Gender Integration Can Boost Entrepreneurial Solutions to Poverty.
Several key patterns emerged in this research:
1. There are significant opportunities for market expansion through focus on female consumers.
2. Companies have the potential to increase productivity through improved engagement of female employees and investments in capacity building for women.
3. Women are significantly underrepresented at the senior management and board level within the companies Acumen invests, which could slow progress in broader efforts to integrate gender. These gaps often reflect a limited pipeline of women in entry- and mid-level roles.
Since the launch of the report, Acumen has adopted a Gender Sensitivity Policy, which outlines an intentional approach to gender sensitivity in its programs and operations. It is currently building a gender lens into its investment strategies to support companies that see the potential of women as customers, employees and leaders. With this Lean DataSM Gender Toolkit, Acumen will work with companies to measure and improve their impact on women and men.

A Lean Data How-To Guide: Understanding Gender ImpactAcumen 15
At Unilever we believe that empowering women and girls offers the single biggest opportunity for human development and economic growth.
That's why, in 2014, Unilever set a Unilever Sustainable Living commitment called Opportunities for Women, as shorthand to encompass the different dimensions of gender equality and empowerment, including access to rights, skills, resources, jobs and livelihoods. We are committed to empowering 5 million women by 2020 across our entire value chain—in our workplace, supply chains, the communities we serve and through using the power of our brands. Given who we are, we believe our impact can be greater and transformational. We have made it a business priority to leverage our influence to drive transformational change and to shape the future of business.
In our 2017 report, Opportunities for Women: Challenging Harmful Social Norms and Gender Stereotypes to Unlock Women's Potential, we are sharing how Unilever is helping to challenge harmful social norms and gender stereotypes in society.
The report also emphasizes the importance of collective action and identifies three priorities for accelerating gender equality and women's empowerment in the private sector:
• Be Gender Aware: Listen to and learn from women and men about the barriers women experience along the value chain, identifying the social and business cost of inaction and the social and business benefit of action for everyone.
• Be Gender Active: Establish the right policies and practices that respect women’s rights and empower professional and personal development.
• Be the New Norm: Ensure that you are not acting in ways which perpetuate harmful norms through business practices while actively promoting more positive portrayals and opportunities of women along the value chain to challenge stereotypes.
The co-development of the Lean DataSM Gender Toolkit has been a natural next step for Unilever as better data collection and more thoughtful, deliberate management are required to increase understanding of women’s current and potential contribution to business along the value chain. This is essential to appreciate challenges and to inform effective policy and practice interventions for Unilever and other organizations.
UNILEVER'S SUSTAINABLE LIVING APPROACH — OPPORTUNITIES FOR WOMEN
A Lean Data How-To Guide: Understanding Gender ImpactAcumen 15

A Lean Data How-To Guide: Understanding Gender ImpactAcumen 16
A Lean Data How-To Guide: Understanding Gender ImpactAcumen 17
O2CAN ‘LEANER’
DATA MAKE THE WORLD A BETTER PLACE FOR WOMEN?
17

A Lean Data How-To Guide: Understanding Gender ImpactAcumen 18
NUMBERS ALONE WILL CERTAINLY NOT SOLVE GENDER INEQUALITY. BY ITSELF DATA DOES NOT INCREASE ANYONE’S INCOME OR REDUCE THE CHANCES OF WORKPLACE DISCRIMINATION.
But data can provide new insight on what is working for and between men and women. It can shine a light on problems as well as identify solutions.

A Lean Data How-To Guide: Understanding Gender ImpactAcumen 19
When aiming to improve outcomes for both genders, relying solely on instinct is not enough — particularly in an area where long-standing practices need to be upturned, blind spots need to be revealed and deep-seated bias needs to be uncovered.
In such a world, clear information is our ally.
With this information we are empowered to start new conversations, revisit and revise old strategies and make better decisions that lead to better outcomes. For any organization to be successful in achieving its goals, whether increasing business profitability, increasing women’s empowerment, or both, data is the prerequisite to understanding and improving performance.
DATA DIFFICULTIES
Unfortunately, social performance data is not always easy to come by, and this is particularly true for complex matters such as gender inequality. What data do we need to collect? How do we collect it? Will it be too expensive to gather this data? Will the questions be too sensitive to answer? These are the challenges that must be addressed to bridge the gap between good intentions and impact.
While we are far from the first organization to research matters of gender inequality, our goals with this project vary slightly from the typical research agenda. Our core focus is to discover information about gender outcomes, but another key
outcome is to generate repeatable survey tools that others could also use. In order to make gender-focused impact assessment the norm, repeatable, accessible survey tools are an important prerequisite. We thought hard about questions of speed and cost of data collection. We thought about how to develop and then widely deploy increasingly standardized tools so that the collected data can easily be compared to create benchmarks for gender-based performance, empowering investors and organizations to direct capital to ideas that have the greatest measurable gender-specific impacts.

A Lean Data How-To Guide: Understanding Gender ImpactAcumen 20

A Lean Data How-To Guide: Understanding Gender ImpactAcumen 21
DEVELOPING AND TESTING THE
SURVEY TOOL
O321

A Lean Data How-To Guide: Understanding Gender ImpactAcumen 22
GENDER-LENS INITIATIVES ARE NOT SOLELY ABOUT PRODUCING PRODUCTS OR SERVICES THAT TARGET WOMEN. THAT IS PART, BUT NOT ALL OF THE STORY.
A gendered assessment begins with seeking to understand differences that may exist between ways that men and women experience and articulate impact. For example, this might be a difference in how they interact within a value chain, or in terms of respective experience with a product or service.

A Lean Data How-To Guide: Understanding Gender ImpactAcumen 23
Of course, these sorts of differences may arise regardless of whether a program or investment was made with an explicit gender lens: a program need not target women to have a gender-differentiated impact and that is a nuance the measurement tool needs to capture by getting beyond simply who is affected to understand the “how” and “why” of gender-differentiated impact.
We used a combination of tools and analytical methods to get a more comprehensive picture of the gender impact of the projects we worked with. Some of what we tried was successful; in other instances, we ran into challenges. However, these difficulties, discussed below, allowed us to learn and surfaced questions for us to answer through further work in this area.
This is hardly surprising. We did not expect to solve all the challenges of understanding gendered impact through Lean Data in just five projects. In sharing what worked and what did not, we hope that we can move forward the broader agenda of understanding how to more effectively measure and manage gender-specific impacts.
OUR APPROACH
Our approach aimed to be as simple as possible. We deployed two types of question sets and ran some methodological tests.
Our first set of questions was not explicitly tied to themes or areas of focus that might classically be viewed as gender issues. Instead, we deployed one of our core question sets — a set of introductory
survey questions we use in most new Lean DataSM surveys—and disaggregated responses to these questions by gender. This served as a jumping-off point to understand different ways that men and women experience a product, program or service. Specifically, with this first core question set we:
• Examined Demographic Trends By Gender: At the most fundamental level, who a program or service is reaching and what characteristics the beneficiaries or customers demonstrate says a lot about the reach and inclusivity of the program overall. For example, are the poverty profiles3 of the men and women reached by the program consistent? Does the program or service have a similar age distribution between men and women? Are women more likely to be excluded from income-generating activities during childbearing years?
• Disaggregated Quantitative Responses By Gender: This allowed us to answer baseline questions like: do men and women value a product or service in the same way? Are they experiencing the product and its benefits differently? Are women more or less likely to
3. Both Acumen and Unilever are committed to understanding the extent to which the most marginalised either purchase goods and services or interact with supply chains. One way we aim to do this is to measure the poverty levels of customers and suppliers using internationally recognized poverty lines

A Lean Data How-To Guide: Understanding Gender ImpactAcumen 24
reach out to the company in the event of challenges? In terms of acquisition and access to services, do men and women find a service or product via the same channels?
• Disaggregated Qualitative Responses By Gender: Qualitative response gets at the heart of the Lean DataSM approach. Providing respondents with the opportunity to frame their thinking and give context for their responses generates some of the richest insights. This is equally true for gender-based analysis. While men and women may have indicated a similar change in quality of life as a result of a product, the core question we seek to answer in this
step is: are there fundamental differences in the way women and men define and describe these changes?
To complement these wider observations, we also sought to build a set of more specific gender survey modules. These focus on specific areas where we might expect there to be a difference in the way men and women experience impact.
We worked closely with the International Center for Research on Women (ICRW) and built off its existing measurement frameworks and indicators sets. The resulting question modules covered four dimensions of gender impact most relevant for the project or companies:

A Lean Data How-To Guide: Understanding Gender ImpactAcumen 25
• Women’s Economic Empowerment: How has the intervention or program affected a woman’s financial independence and her engagement in income-generating activities? Has the intervention or program affected her ability to make decisions about her own and her family’s financial well-being?
• Power & Agency: Beyond changes in income, how has the intervention or program altered her self-confidence, willingness to voice her opinion and her sense of belonging and community? Has there been any perceived change in how she is received and respected within her household or community?
• Balance Of Paid & Unpaid Work: For interventions that focus on entrepreneurship, are women sharing equally in the benefits of the intervention or program? Who is bearing the brunt of the work required for participation in the program? How is the share of unpaid work redistributed, if at all, as a result of participation in the program?
• Workplace Safety & Violence Against Women: Does the intervention or program explicitly address issues of safety in the workplace for both men and women? Are adequate facilities and trainings available to ensure that men and women can both feel safe?
.

A Lean Data How-To Guide: Understanding Gender ImpactAcumen 26

A Lean Data How-To Guide: Understanding Gender ImpactAcumen 27
IMPLEMENTATION
O427

A Lean Data How-To Guide: Understanding Gender ImpactAcumen 28
PILOTING WITH THE RIGHT PROJECTS
To test the efficacy of our gender measurement tool, we needed to pilot it with a diverse range of projects that spanned geographies and sectors. We also piloted the tool with programs with and without an explicit gender-focused approach. For example, the Shakti Colombia program, one of the five programs we studied, is explicit in its intention to impact women. Rise Sales Academy, conversely, does not have a strong and explicit gender focus. Importantly, a program need not target women explicitly to have gender-differentiated impacts and a successful measurement tool needs to capture that nuance.
We deployed the tool with five projects: four Unilever programs that are part of its Sustainable Living Initiative and one Acumen investee. These projects varied from businesses that provide training and services for men and women as the end customer, to those that support men and women throughout their value chain in the production and distribution of products and services. However, all projects aimed to provide or enhance income-generation opportunities for both men and women.
SHAKTI COLOMBIA Colombia | Entrepreneurship & Financial Inclusion Project Shakti is a Unilever program that was originally piloted in India and has since expanded to multiple countries across Asia, Africa and Latin America. The program is designed to empower rural women through a last-mile distribution and credit program, giving women access to Unilever products to sell within communities that are often beyond the reach of traditional distribution channels. This is a gender-explicit program targeting women.
LABOURNET India | Technical & Vocational Training LabourNet is an Acumen investee that provides technical and vocational training across 28 sectors to disadvantaged men, women and children in India. LabourNet operates across both urban and rural areas in 23 states. The program targets both men and women, though specific programs are tailored to either men or women.
KERICHO TEA PLANTATION Kenya | Workplace Safety & Violence Against Women Unilever improved the general infrastructure and lighting within the plantation and also partnered with UN Women to strengthen an existing safety program through a series of safety interventions, training and improved grievance mechanisms to curb instances of safety violations. This is a gender-explicit program, though the interventions engage both men and women.

A Lean Data How-To Guide: Understanding Gender ImpactAcumen 29
HOW DID WE GATHER DATA?
Replicability and resource efficiency are at the heart of the Lean DataSM approach, so we prioritize data collection methods that are rapid and low-cost without compromising the quality of the data collected. As a result, all of the surveys were conducted by mobile phone, using a cohort of locally-based researchers trained in the Lean DataSM methodology. Where necessary, surveys were conducted in the local language.
IMPLEMENTATION TIMELINE
Survey design, data collection and analysis took place over the course of eight months.
We conducted our first surveys with LabourNet in India and Shakti Colombia between August and October 2018, and surveyed customers from the remaining three projects from November 2018 through early March 2019, averaging approximately 6.5 weeks per project. The staggered approach enabled us to build on the insights and lessons learned in the first two projects and refine the survey tool accordingly.
RISE SALES ACADEMY
Nigeria 7 weeks
KERICHO TEA Kenya
6 weeks
JAZA DUKA Kenya
9 weeks
PHASE 1 REPORT LAUNCH
London
LABOURNET India
7 weeks
AUGUST2018
SHAKTI Colombia5 weeks
APRIL2019
JAZA DUKA Kenya | Entrepreneurship & Financial Inclusion Jaza Duka is a program started by Unilever in partnership with Mastercard aimed at providing micro-entrepreneurs and small shop owners in Kenya with access to safe sources of credit where traditional measures of credit-worthiness may not hold. Micro-Retailers were enabled to buy as much stock as they can sell rather than only what they can afford in cash. The program targets both men and women.
RISE SALES ACADEMY Nigeria | Vocational Training & Entrepreneurship
RISE is a new Unilever initiative that provides access to training materials on topics related to running a successful business. The program is administered through Unilever sales representatives and is captured in short weekly video content pieces. The program pilot is beginning in Nigeria and will be rolled out to the Philippines and Sri Lanka later in 2018. The program targets both men and women.
DATA COLLECTION TIMELINE

A Lean Data How-To Guide: Understanding Gender ImpactAcumen 30

A Lean Data How-To Guide: Understanding Gender ImpactAcumen 31
KEY FINDINGS
O531

A Lean Data How-To Guide: Understanding Gender ImpactAcumen 32
A Lean Data How-To Guide: Understanding Gender ImpactAcumen 32
SO, WHAT DID WE LEARN? TO BEGIN WITH, THE MOST IMPORTANT LESSON, ONE WE LEARN AGAIN AND AGAIN WITH LEAN DATASM PROJECTS, IS THAT CONTEXT MATTERS.
While a few trends emerged across all five projects (and we found several patterns that offer opportunity for additional research) many of the most interesting insights were at the project level, informed by the specific context in which the project was conducted.
This section provides an aggregated analysis across all five projects, as well as highlights key project-specific insights. Given the significance of our findings at the project level, we have also included a series of Case Studies in Appendix A. Both levels of analysis point to additional fruitful lines of inquiry that were beyond the scope of this project. We look forward to continuing research on gender impact measurement that will pick up on these themes.

A Lean Data How-To Guide: Understanding Gender ImpactAcumen 33
KEY FINDINGS:
4. The Net Promoter Score (NPS) is a measurement tool to assess customer loyalty and satisfaction
• Poverty levels: Women in the programs were more likely to live in poverty than men.
• Age: For the three projects for which we collected respondent ages, women’s average age was higher than men—the average was nearly 40. This suggests that, for women in particular, there might exist barriers to participation in income-generating activities during childbearing years and early parenthood.
• Access: Over 53% of women were accessing the program or service for the first time, compared to just 27.5% of men. Similarly, 67.9% of women indicated that they did not have access to any alternative programs or services.
• Experience and Impact: We found similar quantitative responses from men and women to the questions we asked about overarching impact. However, beneath the headline metrics there were significant differences in qualitative responses, with women more likely to emphasize impacts relating to the family and self-confidence.
• Gender Impact:
Economic impacts: Both men and women reported increased earning, with a higher percentage increase for men than for women. However, women found these increases in income to be more significant to them than their male counterparts.
Power and agency: While the differences were not large, overall men reported greater increases in power and agency than women. This effect was strengthened when controlling for increases in earnings: if a man and a woman report the same level of income increases, the man is statistically likely to report a greater increase in power and agency than a woman.
Balance of Paid and Unpaid Work Burden: Both men and women reported similar increase in work burden thanks to participating in the programs. Interestingly, this increase in work burden correlated positively with increases in Net Promoter Score®4 and reports of improvement in quality of life.
Workplace Safety & Gender-Based Violence: While these results are based on just one of the five projects, Kericho Tea Plantation, we were surprised to see no gender-based differences in perception of threat of violence and feeling of security.
The details of these findings, and the underlying methodology, are explained in the next section of this report.

A Lean Data How-To Guide: Understanding Gender ImpactAcumen 34
WHO DID WE TALK TO?
Over the course of the five projects, we spoke to more than 1,000 individuals across Nigeria, Kenya, Colombia and India. There were 589 female respondents representing 56.6% of the total sample and 451 men. It is important to
note that the distribution of men and women varied widely by project, as shown in Figure 1 below. One of the projects — Shakti Colombia — serves only women.
FIGURE 1: Gender Distribution of Respondents, Aggregate & by Project
LabourNet Shakti ColombiaJaza Duka RISE AcademyKericho Tea
Male
Female
Overall Gender Distribution
56.6%
43.4%
47.0% 53.0%
97.5%
2.5%
73.2%
26.8%48.0%52.0%
77.1%
22.9%

A Lean Data How-To Guide: Understanding Gender ImpactAcumen 35
5. The poverty threshold of $3.20 expenditure per person, per day, represents the global Lower Middle Income Class Poverty Line as set by the World Bank
DEMOGRAPHIC PROFILES
Since all five projects had a poverty alleviation focus, we explored respondent poverty levels in all five surveys. To do this, consistent with all our Lean DataSM projects, we used the Poverty Probability Index® (PPI), a holistic poverty measurement tool that asks questions about household characteristics—such as size, education levels and asset ownership —to establish the likelihood that household members live under a given poverty threshold. Controlling for the different national poverty thresholds across the countries surveyed, women in the sample were more likely to live in poverty than men in the sample.
In addition, RISE Sales Academy and Shakti Colombia both reached a higher percentage of poor individuals relative to the poverty distribution in their respective countries. RISE Sales Academy in particular was the most successful at reaching low-income individuals, with over 80% of respondents likely to live below the $3.20 per person poverty threshold.5
We collected respondents’ ages in three of the five projects where this question comprised a part of the Poverty Probability Index®. The average age for men in the sample was 37 years and for women was just shy of 40 and those patterns held across projects. While the difference in age between the genders is subtle, it still emerged as statistically significant.
ACCESS
Some of the most striking gender insights were tied to questions of access. Women were much more likely to indicate that they were accessing the program or service in question for the first time. Over 53% of all women were accessing the program or service for the first time, compared to just 27.5% of men. Interestingly, while the gender gap widened among those individuals with a higher likelihood of poverty, the overall numbers were slightly lower—49.7% of women and 16.7% of men likely to be living in poverty were accessing the program or service for the first time.
Similarly, 67.9% of women indicated that they did not have access to any alternative programs or services. While the gap between men and women is a bit smaller, with 62% of men without access to alternatives, access to alternatives proved to have a strong correlation with the gender impact indicators in the survey. For women with a higher likelihood of living in poverty, the number reporting no access to alternative programs or services jumps to almost 82%. Interestingly, the corresponding number for men was nearly as high, with 79.5% of men who are highly likely to live in poverty reporting no access to alternatives. This corroborates existing research indicating that both gender and poverty levels serve as access barriers to important goods and services.

A Lean Data How-To Guide: Understanding Gender ImpactAcumen 36
This lack of alternatives also affects a respondent’s experience of the program or service: respondents with no access to alternative programs or services and women in that situation were more likely to recommend the program or service to others than those with access to alternatives.
Jaza Duka, the micro-credit program conducted in Kenya, provided an interesting case study for this indicator. Among the first questions asked in the survey was whether the respondent had prior access to a formal financial instrument such as a mobile money account or a checking account. Over 80% indicated that they had access to this type of account and there was no significant variation in the response of men and women. However, when asked whether the respondents had
access to an alternative credit facility, 91% of women said that they did not.
The variation in access and awareness of alternatives across genders can likely be explained, in part, by the very different channels through which they hear about a product or service. Put simply, networks matter. Qualitatively, women were much more likely to hear about a program or service from a relative or acquaintance and were far more likely to take part if a friend was already engaged in the program. This is a stark contrast to men, who were more likely to hear about a program or service through more traditional marketing mechanisms, such as advertisements or sales staff.

A Lean Data How-To Guide: Understanding Gender ImpactAcumen 37
EXPERIENCE & IMPACT
Do men and women experience programs and services differently? Looking at the quantitative responses across all five projects, one might be inclined to say no. The difference in Net Promoter Scores® and relative changes in quality of life between the genders was not statistically significant across the five projects. However, context matters and why matters.
The Net Promoter Score® (NPS) gauges a respondent’s likelihood to recommend the program or service and, across the five projects, the difference between the Shakti Colombia NPS Scores for both men and women were not statistically significant. We saw sometimes very large variations between genders in their respective Shakti Colombia NPS Score across the projects. LabourNet had the most pronounced difference between men and women— with women giving an Shakti Colombia NPS Score 30 points higher than their male counterparts. By contrast, reported changes in quality of life did not vary as much between men and women: nearly three out
of every four respondents reported slightly or very much improved quality of life across the projects, with consistency across men and women.
It was not so much the numbers themselves that were interesting, but rather the qualitative reasons behind them, which highlighted the unique experience of men and women. Both men and women underscored the importance of providing additional income for the family as the most important qualitative justification for their improved quality of life. However, women were much more likely to also reference their ability to provide for their family and children, citing investment in education and health as key drivers of change. Women were also much more likely to highlight socio-emotional factors in how they qualify a quality of life shift, including higher levels of self-confidence, more robust social networks and an increased feeling of self-worth and contribution to household and community.
GENDER IMPACT
More explicitly, how did these projects move the needle on gender inequality? We narrowed the gender focus to four specific norms to better understand the broader impact of these projects on women:
01. Women’s engagement in income-generating activities, including decisions to engage and control financial assets.
02. Women’s sense of power and agency.
03. The balance of work burden between men and women.
04. Workplace safety and violence against women.

A Lean Data How-To Guide: Understanding Gender ImpactAcumen 38
O1. ENGAGEMENT IN ECONOMIC ACTIVITY
Across the board, both men and women demonstrated significant agency in the decision to engage in the program or service (83.2% for women and 81.6% for men). In those instances where women were not the decision makers, it was much more likely that their spouse made that decision, as opposed to another individual. This is even more true among women with a high likelihood of living in poverty.
Interestingly, in terms of who decides how to use the income generated from economic activity, women were significantly more likely to make the decision on the use of this income as compared to men. Nearly 90% of female respondents reported that they make the decision on what to do with the money that is generated, compared to just 76.7% of male respondents. While we cannot prove causality, a woman’s decision to participate in a program is strongly and positively correlated with subsequent measures of both economic and socio-emotional empowerment.
However, despite programs having stronger positive impacts on empowerment for women than for men, participation in these programs increased women's self-reported earnings less than men’s. While men and women both reported increases in income across income-generating projects, the magnitude
of the increase was consistently reported to be higher for men, with an average quantified increase in income of 46.1% for men, compared to just 31.4% for women.
That said, women described these increases with more superlatives than men. Despite reporting a smaller percentage increase in income, women were more likely to describe the increase as “a lot more,” indicating that the marginal value of an additional unit of money is higher for these women. Given this, it is less surprising that increased income is much more strongly correlated with improved measures of self-confidence among female respondents.
The income earned by men also represented a much higher proportion of the total household income, on average. Male respondents consistently reported that the income earned from the program or service in question represented 75% or more of the total household income. As shown in Figure 2 below, for female respondents it frequently represented less than half of the household income and it was often supplemented by other income-generating activities taken on by the respondent. This trend was more pronounced among respondents more likely to live in poverty.

A Lean Data How-To Guide: Understanding Gender ImpactAcumen 39
CONTRIBUTION TO HOUSEHOLD INCOME
What percentage of total household income is represented by your engagement in this income-generating activity?
Men
Women
75 – 80%50 – 75%25 – 50%
Proportion of Household Income
0 – 25%
0.0%
10.0%
30.0%
50.0%
20.0%
40.0%
60.0%
Pro
po
rtio
n o
f re
spo
nd
en
ts
16.2%
11.9%
52.4%
32.4%34.9%
20.6%
Figure 2: Contribution of income-generating activities to Household Income, by Gender
O2. POWER & AGENCY
We looked at measures of socio-emotional empowerment and agency not just at the level of the individual, but also within the household and broader community. Overall, we saw increases in measures of power and agency at all levels, with the most pronounced impacts at the level of the individual. As the spheres widened to the household and community level, the magnitude of change - while still positive - diminished, underscoring the fact that broader systemic change takes time.
Interestingly, while each of these measures of power and agency were positive for both men and women, men reported a more significant change: 85% of men reported an
increase in self-confidence compared to 79% of women (though again, the individual projects showed some strong variation). For example, participants in the RISE Sales Academy reported 100% increase in self-confidence across both men and women. In contrast, participants in Shakti Colombia—the sole female-targeted program in the analysis—experienced the lowest increase in self-confidence, with only 52% indicating higher self-confidence.
As the sphere expands, the socio-emotional impacts diminish and the gender gap widens. At the level of the household, 56% of individuals indicated an increase in their contribution to family decisions, with men
18.4%
13.0%

A Lean Data How-To Guide: Understanding Gender ImpactAcumen 40
more likely to report an increase (61%). This number increases for individuals that experienced an increase in income, but that correlation is much stronger for men than women. In other words, if a male and female respondent both earn more money after participating in the program, the male is
more likely to experience an increase in his contribution to family decision-making. This likely reflects the fact that while earning income can influence a woman’s ability to participate in household decision-making, without broader social norm change, this participation will still be limited.
O3. BALANCE OF WORK BURDEN BETWEEN MEN AND WOMEN
We approached the question of work burden from two angles:
1. The distribution of responsibilities within an income-generating activity.
2. The overall balance of paid and unpaid work within the household.
In assessing the distribution of responsibilities within an income-generating activity, we looked at two types of responsibilities: decision-making responsibilities and physical work responsibilities. Looking across projects, women are more likely than men to do both by a statistically significant margin. As shown in Figure 3 specifically for RISE Sales Academy, and in the situations where women share those responsibilities, they are more likely to share those responsibilities with someone other than their spouses. In contrast, where men share those responsibilities, they are more likely to indicate that their spouses are filling those roles. This was particularly pronounced in the shops served by the RISE Sales Academy. A significant number of respondents manage the shops with family
members, but women disproportionately share that responsibility with their children as opposed to their spouses. The opposite is true for men.
One of the most striking insights in assessing overall work burden was not the difference between men and women. On the contrary, both men and women reported increases in overall work burden because of participation in the program or service. What was surprising was the strongly positive correlation with quality of life and Net Promoter Score®, a correlation that is stronger for women.
Among the women that reported an increase in work burden, none reported that their quality of life worsened and nearly 88% reported quality of life either slightly improved (44%) or very much improved (44%). Women were far more likely to report a decrease in their quality of life when there was no change in work burden, which seems similarly counterintuitive. The same trend holds, though not as strongly, for men.

A Lean Data How-To Guide: Understanding Gender ImpactAcumen 41
DISTRIBUTION OF RESPONSIBILITIES
Men
Women
Work of selling products
Work of stocking shop
Decision on what to order
Decision on use of money
50%
60%
80%
100%
70%
90%
Pro
po
rtio
n o
f Re
spo
nd
en
ts
65%
90%93%
86%
82% 83%
Figure 3: RISE Sales Academy: Distribution of responsibilities, by Gender
O4. WORKPLACE SAFETY & GENDER-BASED VIOLENCE
We had a single project that looked explicitly at issues of workplace safety and violence against women, so the key insights come from that project alone. The most surprising insight was that we did not see strong variation by gender across the project.
We hypothesized that females would express greater concerns related to their safety in and around the Kericho Tea plantation, but we found that men and women not only reported the same levels of feelings of insecurity, but that that pattern held for multiple time periods—both in the past when security issues
on the plantation were common and in the present. Additionally, the segments reported roughly equal satisfaction with Unilever's interventions to improve security on the plantation. Even when asked specifically about differences in how male and female employees experience life on the plantation both during the night and the day, men’s and women’s answers showed no differences. However, for the open-ended answer related to this question, men were more likely than women to say that women were more vulnerable than men.
93%
81%

A Lean Data How-To Guide: Understanding Gender ImpactAcumen 42
LESSONS LEARNED
We wanted to use these projects to understand how lived experiences could differ for men and women across multiple countries and business models. We defined and collected a set of standard measures that would help us see overarching trends and asked open-ended follow-up questions at opportune points to ensure that we were able to understand the details behind those trends. While we uncovered a number of insights across projects, we also noted a few areas where the gender impact survey tools can be strengthened and improved.
In particular, we emphasized the use of relative indicators—comparing the experience of the respondent to a period of time before the intervention. While this provided an important lens, we were handicapped in our attempts to compare across subgroups, as no quantified baseline had been established. This was particularly challenging in the case of work burden. Both men and women indicated a strong increase in their overall work burden, including both paid and unpaid work. However, without the ability to quantify unpaid and paid work burden for each subgroup prior to the intervention, we were limited in our ability to assess the shift of paid and unpaid work responsibilities between genders.
Even though we limited our gender impact measurement tool to focus on four dimensions of gender impact, we still felt acutely the trade-off between breadth and depth of analysis. With all four gender modules in the survey, the surveys ended up being longer than usual, contributing to survey fatigue among both researchers and respondents. We also recognize that there are several gender impacts that we were unable to capture in our surveys, given the constraint on survey length. We would like to explore options for expanding the depth of some of the gender-specific survey modules while narrowing the total number of norms evaluated within a single survey. This requires a robust assessment of the specific gender impacts of most importance in a project, perhaps narrowing the scope to accommodate greater insight and a potential re-design of the research methodology, as we discuss in the next section.

A Lean Data How-To Guide: Understanding Gender ImpactAcumen 43

A Lean Data How-To Guide: Understanding Gender ImpactAcumen 44

A Lean Data How-To Guide: Understanding Gender ImpactAcumen 45
BEYOND THE QUESTIONS
O645

A Lean Data How-To Guide: Understanding Gender ImpactAcumen 46
GOOD QUESTIONS ARE ONE THING, BUT HOW AND TO WHOM THEY ARE DELIVERED IS JUST AS IMPORTANT.
Understanding gender impact requires important methodological considerations, from how to make sure we are reaching the right person (i.e. appropriate gender-based stratification), to the appropriate survey channel and environment for the topic in question, to survey frequency.

A Lean Data How-To Guide: Understanding Gender ImpactAcumen 47
Unfortunately, the context in which research is being conducted is rarely without constraints. Financial constraints, time constraints and methodological constraints can all present challenges to creating a research design that is fully optimized to assess gender dynamics. A number of these challenges were present in our own exploration of gender impact across these projects. Figuring out how best to navigate those challenges — including a few instances where we came up short — has helped lay the groundwork for a robust discussion of the nuances of research design with a gender lens.
This section aims to distill some of the considerations that informed our research design. It details some of the constraints, trade-offs and shortcomings that we experienced within and across each of the projects. We hope to begin to point to a “living” framework for approaching some of these methodological considerations, one that can be applied more broadly to organizations and companies looking to undertake similar work.
As you will see, we describe the most important methodological considerations, outlining the challenges we faced, what we did to address those challenges, what we learned and what we plan to either continue to do or experiment with in the future.
THE SAMPLING FRAME
Challenge: The question of who we are talking to and how best to reach them is one of the most important considerations in our research design. In the context of understanding gender dynamics, this question can become more complex: Does the structure of the intervention mandate that we speak
to both men and women? Does the impact that we are trying to understand assume a certain relationship between the men and women, such as spousal? Where the survey addresses sensitive information, how feasible is it to reach men and women within the same household? How can we do so in a way that does not increase the risk of harm for survey participants?
What we did: Each of these questions presented a unique challenge in our research design and some were beyond the scope of our analysis. For our team, the primary objective was twofold: to develop actionable insights for participating programs and companies and to understand the experience of their end customers and beneficiaries, with a particular emphasis on women. As a result, we focused on the level of program participant and were largely limited to those individuals for whom the company or program had existing contact details. On the issue of intra-household responses (i.e. from both men and women within the same household), we tested the degree to which men would be comfortable allowing us to speak separately to their partners as part of the Kericho Tea project.

A Lean Data How-To Guide: Understanding Gender ImpactAcumen 48
What we learned and recommendations moving forward: Focusing on the level of the program participant came with benefits and challenges. Apart from Shakti Colombia, which works with women only, we were able to secure a representative sample of men and women for most programs. But whilst we were able to speak to samples of men and women, our attempts to investigate intra-household impacts (by talking to men and women within the same house) was less successful. When we asked male respondents on the Kericho Tea project, only one agreed to let us speak with his spouse.
In retrospect, we should have approached this differently. When seeking permission, we did so at the outset of the survey, before the respondents were able to experience the content of the survey. Additionally, the survey was framed as one on the topic of safety which
potentially might have made the respondent more careful. Moving forward, we will move this question to the end of the survey and will explore the effectiveness of this approach with a less sensitive survey topic. Additionally, where we only attempted this with male respondents, we will also ask the same question of women.
We also realized that there were stakeholder voices that would be interesting to hear that were not represented. For example, were there women with a similar profile that have not participated in the program that we can reach to understand barriers to entry? Are there other individuals in the household and community whose voices can help articulate potential spillovers to the wider community? Where contact details might be limited, exploring options for conducting key informant interviews with these subgroups would be important.
SAMPLE STRATIFICATION
Challenge: For most projects, capturing gender insights requires robust subgroup analysis. How can we ensure that we have a representative sample of both men and women in a survey population, particularly where one gender represents a particularly small proportion of the total population? What other opportunities does the intervention provide for subgroup analysis? How do you stratify in circumstances where subgroup details are not available for the total population?
What we did: Given the focus on gender, where possible we employed careful survey stratification to capture insights that may be drowned out in a larger population sample. As with all Lean DataSM surveys, we aim to capture enough
responses to achieve an absolute minimum of an 80% confidence level with a 5% margin of error. We find that this is the right confidence level for company-level decision-making and action. For most projects, a sample size of 200 to 250 respondents is enough to achieve this. Where an intervention targets both men and women, we aimed capture a representative sample of each subpopulation.
Several of our projects also presented unique opportunities to stratify the survey samples to highlight gender impacts. For example, LabourNet, an Acumen investee that offers technical and vocational training, offers some courses that are targeted specifically at women, some that are targeted specifically at men and some that are targeted equally across both genders. We took advantage of this

A Lean Data How-To Guide: Understanding Gender ImpactAcumen 49
6. https://www.gsma.com/mobilefordevelopment/wp-content/uploads/2018/04/GSMA_The_Mobile_Gender_Gap_Report_2018_32pp_WEBv7.pdf
dynamic. We stratified the sample to highlight those differences and were able to analyze patterns in responses tied to the gender distribution of the programs in which the respondents participated, strengthening our overall analysis.
What we learned and recommendations moving forward: While we aimed to capture a representative sample of each gender, this proved to be a challenge in certain circumstances. Given that we typically rely on contact details supplied by
the organization, we are limited by the details available in those databases and, on occasion, gender is not specified. As a result, we cannot always stratify the sample before data collection begins and rely on oversampling the total population. This is also a challenge when gender distribution is not known at the level of the total population. A combination of over-sampling across the total population and longitudinal studies to slowly build that repository of demographic information can help.
CONTACT VIA REMOTE SURVEYING
Challenge: Even as the penetration of mobile phones grows worldwide, women continue to experience lower levels of access to phones. According to the 2018 Mobile Gender Gap Report published by GSMA, although the gap in mobile access and ownership is closing, there is still a substantial and persistent gap in mobile ownership between men and women in low- and middle-income countries. For example, in India, women are 26% less likely to own a phone as compared to men.6 So when Lean DataSM often relies heavily on mobile connection, how do we reach enough women?
What we did: In practice this issue turned out to be less challenging than we had hypothesized. To start, except for India, most of the countries in which we operated have smaller structural gender gaps in mobile phone penetration. And in our work in India, it turned out that we did not observe a significant gender-mobile gap amongst the customers we surveyed. We don’t know for certain why, but this is potentially because the mobile gap may be most concentrated in households in extreme poverty in India, and we were
mostly surveying customers just above this level. Nonetheless, we will continue to keep a close eye on this potential issue and consider sample boosters, oversampling or complementary in-person sampling if needed.
What we learned and recommendations moving forward: Although this did not ultimately present a challenge in reaching program participants across most of our programs, we still spent significant time discussing options for mitigating this issue if it did arise as a concern. For the safety program specifically, we explored the option of doing remote node surveying for the women’s security study by establishing a single location within the community, often at a scheduled meeting location or community gathering space, where women could anonymously participate in the survey, mitigating the concerns about both being able to find a safe space and not having access to a phone. While we ultimately decided against this approach in the context of safety, this alternative may prove effective in less sensitive interventions where mobile phone penetration is lower for women.

A Lean Data How-To Guide: Understanding Gender ImpactAcumen 50

A Lean Data How-To Guide: Understanding Gender ImpactAcumen 51
CONCLUDING REMARKS
O751

A Lean Data How-To Guide: Understanding Gender ImpactAcumen 52
WE HOPE THIS REPORT REPRESENTS A PRACTICAL CONTRIBUTION FOR ANYONE WITH AN INTEREST IN HOW TO RIGOROUSLY AND COST-EFFECTIVELY CAPTURE GENDER INSIGHTS.
We are encouraged by the data we have gathered in addition to the practical lessons we have learned from this initial set of experiments. Our experience suggests not only the value and increasing accessibility of gathering gendered insights, but also hints at the potential of benchmarking across gender dimensions.

A Lean Data How-To Guide: Understanding Gender ImpactAcumen 53
Three key insights seem to be emerging.
First, broadly speaking, this approach works. It is indeed possible to collect high-quality data that offers gender insights in a rapid, cost-efficient way. The data gathered from these tools is actionable and can enable individual organizations and programs to move beyond general statements of empowerment and insufficient proxies of impact toward a deeper understanding of the nuance and detail.
Second, this is still a work in progress. Developing an all-purpose tool for every scenario and gender issue was not a goal of this project, nor should it be due to the nuanced nature of the types of gender impacts that are relevant to different projects. That said, our aim was to show that developing appropriate surveys to begin to investigate such nuances is eminently possible. The more we collectively build and share such surveys the more equipped we will all be to understand our gender impacts.
Finally, understanding gender impacts is not the sole responsibility of programs and organizations with an articulated gender focus. All programs that service both men and women need to understand how men and women experience their program differently. Getting that insight need not be unwieldy and resource-intensive.
Some of our most profound insights came from simple disaggregation of standard questions by gender. This should be a standard of practice for all, and something we will continue to pursue in future Lean DataSM projects.
We are already seeing that there is opportunity to develop further complementary tools and surveys for different gender areas. Our ultimate objective is to see this tool and the insights from its implementation used to support others as they seek to understand the impact of efforts to advance gender equity. To achieve this, we will continue to explore the use of this tool and learn from other's experiences, as we work towards achieving a better understanding of how to create more gender equitable companies, relationships, and societies.

A Lean Data How-To Guide: Understanding Gender ImpactAcumen 54

A Lean Data How-To Guide: Understanding Gender ImpactAcumen 55
APPENDIX A
O855

A Lean Data How-To Guide: Understanding Gender ImpactAcumen 56

A Lean Data How-To Guide: Understanding Gender ImpactAcumen 57
LABOURNET, INDIA CASE STUDY
57
A Lean Data How-To Guide: Understanding Gender ImpactAcumen 58
LABOURNET (LN) IS A SOCIAL ENTERPRISE THAT WORKS WITH MEN AND WOMEN IN INDIA’S INFORMAL SECTOR.
Its three-pronged engine integrates social and business impact by bridging the gaps in education, employment and entrepreneurship. Primarily targeted at corporations, schools, individuals and government, its training services cover expertise in 28 sectors and have reached 23 states in India.

A Lean Data How-To Guide: Understanding Gender ImpactAcumen 59
Over the course of four weeks, phone surveys were completed with 324 participants who have participated in LN training programs. The project targeted three specific programs with an aim to understand the gender impacts: Automotive, in which trainees are predominantly men; Beauty, in which trainees are predominantly women; and, Retail, which trains both men and women.
Using Innovations for Poverty Action’s Probability of Poverty Index® (PPI), we observed that roughly 80% of the LabourNet trainees that took part in the three programs above were low-income, earning less than $6 per day. However, LabourNet reached fewer extremely low-income individuals—those living on less than $3.10 per day—as compared to the national and urban national averages. These inclusivity patterns held across both male and female participants and across each of the three programs.
INCLUSIVITY RATIO Share of respondents living below World Bank poverty lines
15minSURVEY
DURATION
324SURVEYS
52%WOMEN
INDIA
ABOUT THE SURVEY & PARTICIPANTS
A Lean Data How-To Guide: Understanding Gender ImpactAcumen 59
India Urban Average
LabourNet India Average
Per person World Bank Poverty line (2011 PPP)
% o
f Po
pul
atio
n/H
ous
eh
old
$0
$1.9
0
$3.1
0
$6.0
0
$8.0
0
$11.
00
$15.
00
Ma
x
0
20
40
6063%
80
100
Middle class to wealthy
Emerging middle class
Low income
Relative poverty
Extreme poverty

A Lean Data How-To Guide: Understanding Gender ImpactAcumen 60
Source: LabourNet

A Lean Data How-To Guide: Understanding Gender ImpactAcumen 61
Everything about LabourNet is very good. It is not at all like a Govt institute which often has no care or concern for the students. At LabourNet they were in no rush to complete the syllabus but were careful that each of us understands the subject completely. However, after the course, they need to help us getting jobs in our own cities and not send us so far. As girls, our mothers do not allow that.
“
Female LabourNet Trainee, Beauty and Wellness

A Lean Data How-To Guide: Understanding Gender ImpactAcumen 62
As a way of understanding the value drivers for both men and women, we calculate the Net Promoter Score®, a broadly used metric that asks respondents how likely they are to recommend the program to friends, neighbors and colleagues, with a range of -100 to +100. The difference between men’s calculated NPS and women’s calculated NPS was a staggering 30 points, with women promoting the program more highly.
NPS also varied significantly by graduation period. Trainees who graduated within the last 6 to 12 months had a calculated NPS that was 35 points higher than those who graduated more than 12 months ago. Further work is needed to understand why this is the case. One hypothesis is that students are pleased with the program right after completion, but then have less favorable opinions about it after time passes as they begin to associate other factors with their current employment situation.
Promoters found the training to be effective, providing a good learning experience supported by provision of quality learning materials. Detractors were unhappy with the placement service as there was neither surety of job nor desirable jobs available. The specific drivers of satisfaction and dissatisfaction were consistent across both gender and course.
Historically, LabourNet has had a 60% placement rate, though just 33% of participants in the three programs surveyed had been successfully placed through LabourNet’s placement process. Not surprisingly, the two thirds of graduates who were not placed, were less likely to be working in sectors associated with the course that they attended. Moreover among those who were not successfully placed, women were more likely to migrate to a different sector for a job, while men were more likely to invest in studying further.
The survey included a module of questions on socio-emotional and intra-household changes resulting from enrolling in LabourNet’s courses administered to men and women.
The responses ran contrary to what we observed elsewhere. Within self-reported changes in certain personal socio-economic attributes, quality of life and self-confidence, we observed that women reported positive shifts more often than men. However, self-reported changes in intra-household dynamics are slower to shift, with both men and women reporting equally the changes in contribution to household decision-making.
RESULTS

A Lean Data How-To Guide: Understanding Gender ImpactAcumen 63
% OF RESPONDENTS THAT REPORTED
Average
Male
Female
Improved monetary contribution to
family
Increasedself-confidence
Increasedcontribution HH decision making
Improved quality of life
0
10
30
50
70
90
20
40
60
80
100
%
I am able to go to a shop and make a purchase decision alone which I have never done before. This has improved my communication skills and now I can talk with confidence with the parents of my school children and discuss with them on problems related to their children.
“Female LabourNet Trainee, Retail
35%
35%
47%
62%67%
35%
83%
91%
30%
22%
36%
74%

A Lean Data How-To Guide: Understanding Gender ImpactAcumen 64
LESSONS LEARNED
LabourNet provided a rich environment for robust analysis. The ability to segment by program and gender created a unique opportunity to generate representative insights on the impact of vocational training programs on men and women. This experience pointed to the importance of prioritizing thoughtful segmentation of the target population when defining the data collection methodology to be employed. Many programs offer similar structures, enabling a robust analysis across genders.
We have just scratched the surface of the analysis of LabourNet when understanding gender dynamics. Where interesting insights have emerged segmenting analysis by gender, further analysis is needed to understand how gender-explicit and gender-agnostic programming either perpetuates or alters some of the trends that we are seeing.
Source: LabourNet
The training is good. But as per my point of view I need more materials for the training to advance my skill. The training delivery is not so good because there are a number of times trainers changed which impacted the training learning and made it difficult to understand different training teaching.
“Male LabourNet Trainee, Automotive

A Lean Data How-To Guide: Understanding Gender ImpactAcumen 65
The course content, teacher, peers and duration were all very good but what is its use if I cannot get a job in my own city after the course. Today my father has lost his job and I desperately want to help my family with income but am unable to do so. In such cases, I can only recommend the course if they want to take some new type of experience because we have not learnt all this up to our 12th class education.
“Male LabourNet Trainee, Retail
A Lean Data How-To Guide: Understanding Gender ImpactAcumen 65

A Lean Data How-To Guide: Understanding Gender ImpactAcumen 66

A Lean Data How-To Guide: Understanding Gender ImpactAcumen 67
SHAKTI, COLOMBIA CASE STUDY
67

A Lean Data How-To Guide: Understanding Gender ImpactAcumen 68A Lean Data How-To Guide: Understanding Gender ImpactAcumen 68
PROJECT SHAKTI IS A LAST-MILE, INCLUSIVE DISTRIBUTION PROGRAM DESIGNED TO EMPOWER RURAL WOMEN WHILE EXPANDING UNILEVER’S REACH INTO RURAL AREAS.
It is part of Unilever’s global “Selling with Purpose” strategy aiming to make sustainable living commonplace and leveraging its access to millions of stores and billions of consumers. Unilever initially piloted the Shakti program in India and has since expanded the program to multiple countries. Shakti Colombia began in 2016 and currently engages approximately 10,000 female micro-entrepreneurs in rural parts of Colombia using a hub and spoke model. Through the program, women can access Unilever products through an optional credit program to sell within their community, often in regions beyond the reach of traditional distribution channels. The program in Colombia is still quite nascent and seeks to grow and improve both the social and business impact that it is having on women and their communities.

A Lean Data How-To Guide: Understanding Gender ImpactAcumen 69
Over the course of two weeks, phone surveys were completed with 204 participants in the Shakti Colombia program. Participants were both active participants and participants at risk of dropping out of the program. Given the gender-explicit focus of the program, nearly all respondents were female.
Using PPI, Shakti Colombia proved to be more inclusive than Colombia’s national average, with more respondent households below each of the poverty thresholds than the national average. When compared to just the rural averages for Colombia, the Shakti Colombia program closely mirrors the national patterns for rural household poverty rates, falling just barely under those poverty thresholds. Overall, the Shakti program is a broadly inclusive initiative, reaching a representative proportion of the country’s poorest households.
INCLUSIVITY RATIO Share of respondents living below World Bank poverty lines
98%WOMEN
COLOMBIA
ABOUT THE SURVEY & PARTICIPANTS
Shakti Colombia Colombia National Average
% o
f Po
pul
atio
n/R
esp
on
de
nts
$-
$1.9
0
$3.2
0
$5.5
0
$8.0
0
$11.
00
$15.
00
$21.
70
Ma
x
Middle class to wealthy
Extreme poverty
Per person income line (2011 PPP)
0
20
40
60
80
100
204PARTICIPANTS
A Lean Data How-To Guide: Understanding Gender ImpactAcumen 69
28%
51%

A Lean Data How-To Guide: Understanding Gender ImpactAcumen 70
I feel that now I am a more independent woman, I can make my own decisions and have my own money.
“Shakti Program Participant
Source: Shakti, Colombia
The additional income helps me with the economic burden that is heavy when it's only in the hands of one member in the house. With that income that my wife produces selling the products she has helped me.
“Spouse of Shakti Program Participant

A Lean Data How-To Guide: Understanding Gender ImpactAcumen 71
Thanks to Shakti I can work from home and take care of my children. Before I had to wait a week to see my children because I was an intern housemaid in a family home. Now I see them every day. Before I was very insecure and now I feel more able to do things, I feel proud of myself.
“Shakti Program Participant

A Lean Data How-To Guide: Understanding Gender ImpactAcumen 72
% OF RESPONDENTS THAT REPORTED
SHAKTI COLOMBIA NET PROMOTER SCORE (NPS)
Increased contribution to HH decision-making
Improved quality of life
Improved income
Increased self-confidence
66%
38%
53%
65%
310
-100
-50 50
100

A Lean Data How-To Guide: Understanding Gender ImpactAcumen 73
The Shakti Colombia program received an NPS® of 31, which is generally considered a good score with some space for continued improvement. Women in the program highlighted the following positive value drivers:
• Improved income (48%)
• Access to high-quality products for the household (39%)
• Access to a more robust social and professional network (11%)
From the 204 Shakti Colombia entrepreneurs surveyed, 58 of them have collectively recruited an additional 231 entrepreneurs. This organic growth of entrepreneurs included 217 women. There was a positive relationship observed between a Shakti Colombia entrepreneur who is willing to promote the company and the likelihood of her recruiting additional entrepreneurs. These enthusiastic entrepreneurs (promoters), on average recruited an additional five entrepreneurs each, while dissatisfied entrepreneurs (detractors), only recruited two new entrepreneurs each.
In exploring Shakti Colombia’s contribution to women’s economic advancement, we found that 65% of respondents reported earning more income after working with Shakti. Furthermore, 17% of respondents, all of whom are female, reported not having income prior to joining the project. While improved income was cited most frequently as a factor for the improvement in quality of life for participants, 94% of respondents only considered the increase in income “a little more.”
The second most commonly cited factor in respondents’ improved quality of life were cost
savings, in the form of purchasing products for their own home. These 34% of respondents who listed this as a factor that contributed to their improved quality of life represent a significant portion of entrepreneurs who may not be using Shakti Colombia to resell products and generate income, but only to obtain household products at discounted, wholesale prices.
Commonly cited challenges by participants included issues with the delivery timeliness and the credit program timelines which often compounded with late deliveries in creating cash flow challenges for customers. Addressing these challenges, raised by 68% of respondents, present opportunities to improve the experience of participants in the program and to continue building a robust network of advocates for the Shakti Colombia program fueling organic growth.
In terms of power and agency, over 50% of participants stated that they had greater confidence in their own abilities since beginning the program. However, despite reported increases in both income and confidence, measures of intra-household empowerment increased by a slightly lower margin. Just 38% of women reported an increase in their ability to contribute to household decision-making, and 24% felt that they were more respected by their spouse and other family members. We hypothesize that this is likely due to intra-household dynamics and relationships shifting at a slower rate as compared to individual measures of wellbeing, though this represents an opportunity for continued expert analysis and understanding.
RESULTS

A Lean Data How-To Guide: Understanding Gender ImpactAcumen 74
LESSONS LEARNED
Because they are products of a family's basic needs, so you sell and at the same time you buy your things for the house, I don't spend more money because I can buy the products with my profits.
“Shakti Program Participant
While the Shakti Colombia survey presented valuable insights on the value drivers and opportunities for improvement among women in the program, it also provided feedback on the survey tool and methodology employed by Lean DataSM.
With a gender-explicit intervention where nearly all of the program participants are female, identifying opportunities to bring in broader stakeholder voices to contextualize those responses is important. In the case of Shakti Colombia, there are two other key stakeholder groups that we would include in the survey if we were to administer the survey again (assuming access to contact details). The first group would be spouses of the program participants, who can provide broader context on their wives’ contributions to the household and socio-emotional shifts as a result of the program.
The second group, which presents more of a challenge to reach, would be women not participating in the Shakti Colombia program within the communities in which Shakti operates. Over 98% of the Shakti Colombia respondents indicated that they made the choice to join the Shakti program, which raises the question of selection bias in the program. Do women who opt into the Shakti program have distinct attributes or traits that make them more likely to participate in the Shakti program?
Bringing in additional voices would provide a deeper understanding of the attributes that distinguish program participants and the depth of impact of the program, though reaching these stakeholder groups is not always logistically feasible.

A Lean Data How-To Guide: Understanding Gender ImpactAcumen 75
You know that when you contribute money in the house your life changes, I contributed before for example a thousand pesos and now I contribute two thousand, you feel more useful, I no longer have to wait to see if one or the other is going to give money to buy things, I no longer have to be asking. I feel more active, with a desire to work, it makes me wanna go out to the street, to meet more people. And one feels more useful when contributing and working.
“Shakti Program Participant
A Lean Data How-To Guide: Understanding Gender ImpactAcumen 75

A Lean Data How-To Guide: Understanding Gender ImpactAcumen 76

A Lean Data How-To Guide: Understanding Gender ImpactAcumen 77
JAZA DUKA, KENYA CASE STUDY
77

A Lean Data How-To Guide: Understanding Gender ImpactAcumen 78
SWAHILI FOR “FILL UP YOUR STORE,” JAZA DUKA IS A JOINT INITIATIVE BETWEEN UNILEVER, MASTERCARD AND KENYA COMMERCIAL BANK (KCB) TO HELP MICRO-ENTREPRENEURS IN AFRICA AND OTHER REGIONS OVERCOME CASH CONSTRAINTS THAT LIMIT THEIR ABILITY TO BUY AND SELL PRODUCTS AND GROW THEIR BUSINESSES.
Unilever provides distribution data and access to its merchant network, Mastercard performs analytics on purchase history and facilitates digital payments as well as the microcredit platform and KCB performs and approves credit assessments and extensions. The digital working capital loans allow users to move away from purchases constrained by how much cash they have on hand to what they can sell by purchasing goods on credit, at interest-free terms for up to 17 days.

A Lean Data How-To Guide: Understanding Gender ImpactAcumen 79
Over a period of three weeks, researchers based in Nairobi conducted phone interviews with Jaza Duka customers. With a response rate of 51%, we heard from 201 customers. 77% of respondents were male and 23% of respondents were female. Nearly half of the respondents (44%) were aged between 30 and 39.
JAZA DUKA NET PROMOTER SCORE (NPS)
201PARTICIPANTS
23%
54
WOMEN
KENYA
ABOUT THE SURVEY & PARTICIPANTS
0
-100
-50
100
A Lean Data How-To Guide: Understanding Gender ImpactAcumen 79

A Lean Data How-To Guide: Understanding Gender ImpactAcumen 80
Source: Jaza Duka
It has given my family an opportunity to save money and to plan financially for the home and the business as well…
“Jaza Duka Customer

A Lean Data How-To Guide: Understanding Gender ImpactAcumen 81
There was a time I hardly had any customers but now there are customers at my shop just right after I open, which is great. The stock that I receive is better than what I had before.
“Jaza Duka Customer

A Lean Data How-To Guide: Understanding Gender ImpactAcumen 82
The Jaza Duka program received an NPS® of 54, which is generally considered an excellent score demonstrating a high level of customer satisfaction. Respondents highlighted the following positive value drivers:
• Access to a credit facility (48%)
• A good payment system as well as fair repayment terms (25%)
We surveyed participants to explore their access to other sources of credit for their businesses prior to Jaza Duka and found that 74% of respondents overall did not previously have access to credit. When disaggregating by gender, we found a similar proportion of females (72%) and males (75%) did not have prior access to credit. 91% of respondents reported an improvement in quality of their lives after joining Jaza Duka citing the benefits of having greater access to goods and inventory, better business performance, and a greater ability to meet family needs thanks to the access to credit.
25% of those surveyed, took the opportunity to list challenges they faced working with Jaza Duka. The most commonly reported challenges included: the payment system not reflecting accurate purchasing behavior, payment terms being changed from credit to cash without prior warning and the payment confirmation from KCB taking too long to process, resulting in certain customers having to pay for their products with cash.
In exploring Jaza Duka’s contribution to women’s economic advancement, we found that an overwhelming majority of 96% of female respondents reported earnings increases, with an average of a 28% increase. This growing income enabled their stores to contribute on average 61% to their overall
household incomes. Interestingly, when questioned on how their overall work burden--including time spent working in the shop and at home--had changed since starting their shops or “dukas,” all 100% of women that reported an increase in work burden also reported an improvement in their quality of life. This finding suggests that while they may be working harder overall, the pros outweigh the cons.
We also looked at socio-emotional as well as household changes resulting from participation in the Jaza Duka program. The responses were overwhelmingly positive, with 100% of female respondents indicating a greater confidence in self and their abilities, 96% reporting greater respect from their families and spouses and 87% reporting an increased active contribution to important family decisions. Re-examining the subset of female respondents who reported an increase in work burden as well as an increase in quality of life, we find all 100% of these respondents reported increases on these socio-emotional indicators as well as the agency and power indicator related to household decision-making. This finding further supports the interdependent relationship between women succeeding and advancing economically with women’s agency and power and their potential to form a self-reinforcing cycle.
RESULTS

A Lean Data How-To Guide: Understanding Gender ImpactAcumen 83
Jaza Duka has improved my business in the shop, therefore, increasing the money I make,allowing me to buy more things for my household and provide more for my extended family as well.
“Jaza Duka Customer
Source: Jaza Duka

A Lean Data How-To Guide: Understanding Gender ImpactAcumen 84
It is vital to note that all respondents in the survey were categorized by the company as “loyalists” of Jaza Duka (meaning they would recommend participation with Jaza Duka to a friend or family member). This introduces a significant risk of sampling bias in the responses and must be kept in mind when analyzing the results of the survey. We would suggest identifying opportunities to bring in broader stakeholder voices to help contextualize these responses. Understanding how passive as well as unhappy customers experience Jaza Duka would provide greater insight into variation in perceptions of value drivers and challenges and, when compared to the results of promoters, will help management understand not only the bottom line revenue growth, but also the social impact potential of converting unhappy customers into loyalists.
Additionally, upon review of the survey results, we noted that in response to questions surrounding whether customers earned more or less from their businesses after joining Jaza Duka, a proportion of respondents answered, “I do not wish to disclose” or “I don’t know [this information].” We respect the privacy of respondents who do not wish to disclose such information, yet both of these responses could have important implications on training needs of customers. This highlights a limitation of our survey methodology and a learning opportunity for the future. Survey fatigue is always a concern with phone surveys and there is a need to balance the desire to obtain as many insights from customers as possible, while still keeping surveys brief enough to ensure high completion rates. We propose working closer with management in the future to understand their business priorities and, from these, to co-design survey questions to
glean deeper insight on identified topics of importance to the company.
Finally, one-off surveys can help companies understand a snapshot of their customers’ poverty profiles, but to truly understand the long-term sustainability of these initiatives, we recommend follow-ups with respondents over time in the style of longitudinal studies. Such studies would also present an opportunity to track changes in indicators that reflect long-term impact over time. For example, currently, we see both men and women spending around 18% on personal investments and savings as well as around 21% on school fees. Follow-up studies would allow us to understand if, over time, this proportion would increase, decrease or stay the same.
LESSONS LEARNED
I get stock on credit and I have stock readily available. When the customer comes they don't lack what they need, even when I don't have ready cash.
“Jaza Duka Customer

A Lean Data How-To Guide: Understanding Gender ImpactAcumen 85
Jaza Duka is great because it allows you to get the goods that you are actually able to pay for. The goods are good quality, none of them are spoilt. It comes at a good time. It's a nice service that has helped me and my business.
“Jaza Duka Customer
A Lean Data How-To Guide: Understanding Gender ImpactAcumen 85

A Lean Data How-To Guide: Understanding Gender ImpactAcumen 86

A Lean Data How-To Guide: Understanding Gender ImpactAcumen 87
RISE SALES ACADEMY, NIGERIA
CASE STUDY
87

A Lean Data How-To Guide: Understanding Gender ImpactAcumen 88
RISE IS A NEW INITIATIVE THAT WAS PILOTED IN NIGERIA IN LATE 2018 TO PROVIDE TRAINING TO SMALL-SCALE RETAIL SHOP OWNERS ON TOPICS RELATED TO BEST BUSINESS PRACTICES AND DEVELOPING ENTREPRENEURIAL SKILLS.
The training is administered by Unilever Sales Representatives during their regular visits with retail owners who watch short videos on a tablet and work through modules focusing on lessons such as business operations, financial management, marketing and sales, as well as self-confidence and motivation. The program targets both males and females and is set to roll-out in Sri Lanka, the Philippines and Indonesia.

A Lean Data How-To Guide: Understanding Gender ImpactAcumen 89
A month after the RISE training program was completed in late 2018, phone surveys were conducted amongst 112 retail owners who participated in the program. 73% of respondents were female.
Using PPI, we determined the inclusivity of the RISE program and compared this to the national poverty rates. RISE Academy proved to be more inclusive when compared to the general Nigerian population – i.e. the company had a larger portion of respondents below each of the poverty thresholds than national averages.
Overall, male and female respondents shared similar backgrounds. 83% had never received this type of training or information before and only 6% could find an alternative.
Differences between the genders occurred in decision-making and support from family. 90% of males say they made the decision to start the shop themselves while 84% of females
said the same. A larger portion of females than males (11% and 3% respectively) said their spouse made the decision. Additionally, while no males reported opposition from other family members, 4% of females said someone in their family disagreed with the decision to open a retail shop.
Furthermore, males are slightly more likely to receive family support in operating the shop. They more often get support from their spouse while females rely on their children to help.
Lastly, when reporting the portion of household income that comes from the retail store, males report a larger portion than females. 70% of males say the shops accounts for 75-100% of the family’s income while only 5% of females say the same. These findings indicate female owners have less support from family and their business may be of lesser priority within the family, thus competing for time, attention and resources.
112PARTICIPANTS
73%WOMEN
NIGERIA
ABOUT THE SURVEY & PARTICIPANTS
A Lean Data How-To Guide: Understanding Gender ImpactAcumen 89
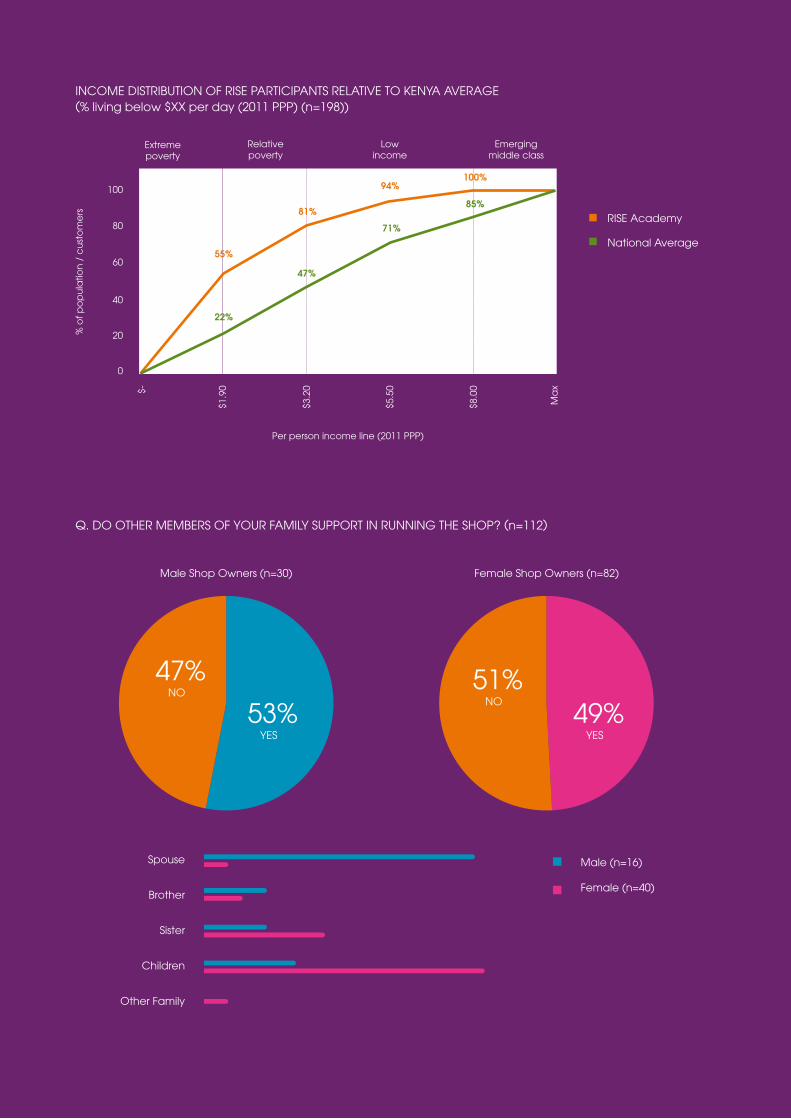
A Lean Data How-To Guide: Understanding Gender ImpactAcumen 90
INCOME DISTRIBUTION OF RISE PARTICIPANTS RELATIVE TO KENYA AVERAGE (% living below $XX per day (2011 PPP) (n=198))
National Average
RISE Academy
Per person income line (2011 PPP)
Q. DO OTHER MEMBERS OF YOUR FAMILY SUPPORT IN RUNNING THE SHOP? (n=112)
Male (n=16)
Female (n=40)
Spouse
Brother
Sister
Children
Other Family
Male Shop Owners (n=30) Female Shop Owners (n=82)
53%
47% 51%49%
YES
NONO
YES
$-
0
55%
22%
47%
71%
85%81%
20
40
60
80
100
% o
f po
pul
atio
n /
cus
tom
ers
$1.9
0
$3.2
0
$5.5
0
$8.0
0
Ma
x
94%100%
Emerging middle class
Low income
Relative poverty
Extreme poverty

A Lean Data How-To Guide: Understanding Gender ImpactAcumen 91
All the topics are important. The Financial Management [lesson] gives me ideas on how to manage my money. I know how to operate in the business environment and how to have confidence in myself and my business, and how to encourage myself even when business is not moving well.
“Female RISE Academy Participant
Source: RISE Sales Academy

A Lean Data How-To Guide: Understanding Gender ImpactAcumen 92
The RISE Academy program received an NPS® of 26, with little difference between the genders. Respondents highlighted the following as positive value drivers:
• Increased profit and sales (48%)
• Growth of business (25%)
• Increased knowledge and skill (12%)
When asked specifically about the changes in the money earned, 95% of respondents said the money earned has improved. Males were more tempered in their response with the majority reporting that they earn “a little more,” while majority of females said they earned “a lot more.” Both genders say they use the extra money to reinvest in their shop, but as a second expenditure males commonly said “paying school fees or household needs” while females reported “saving or investing the money.”
Similarly, 81% of respondents said their quality of life improved, but again males were less likely than females to report the highest positive extreme. For both genders the top way that life improved was an increase in sales and profit. However, the second most common reason differed among the genders:
males more likely said an improved ability to meet family needs while females reported an increase in self-confidence and growth.
Changes in socio-emotional wellbeing were greatest at the individual level and less common at the wider spheres of influence. All respondents, of both genders, said their confidence in their own skill and knowledge has increased because of the training. Within the family, females more commonly reported an increase in contribution to decision-making than males (83% and 70% respectively). In regard to respect received from others, 75% of respondents reported an increase within the family while increases in respect from the wider community was not as common (65%).
Feedback on the training course, specifically, was encouraging. 75% reported the content to be highly relevant to their business and 95% said they have or intend to implement the learnings into their business operations. Both genders listed the Sales & Marketing lesson to be the most useful, and females were also likely to mention the lessons on Self-Confidence & Motivation as well as Financial Management as useful topics. Very few participants (2%) reported having challenges with the training.
RESULTS
I now have invoice in my shop and I'm always taking stock so that I always have products to sell to my customer.
“Female RISE Academy Participant

A Lean Data How-To Guide: Understanding Gender ImpactAcumen 93
Got much worse
No change
Slightly worse
Slightly improved
Very much improved
Money earned
Males Females
Quality of life Money earned Quality of life
I can now pay my children’s school fees without borrowing from a friend. I can pay my light and water bills comfortably.
“ Male RISE Academy Participant
27%
3%
70%
33%
10%
57%
46%
2%
50%
46%
15%
39%
Source: RISE Sales Academy

A Lean Data How-To Guide: Understanding Gender ImpactAcumen 94
LESSONS LEARNED
In addition to the valuable insights collected on the experience and impact of the RISE Sales Academy, the project also provided feedback on the survey questionnaire and methodology used by 60 Decibels.
In future studies, it would be interesting to vary the timing of the survey. This study was conducted soon after the training program ended and perhaps before most shop owners could implement the learnings. This could explain the lower NPS® if participants did not have enough time to enact the changes and experience the benefits. The question “Have you or do you plan to implement any of the lessons you learned from the RISE Sales Academy training in your business?” failed to separate those who have already applied the lessons from those who intend to.
The questionnaire also included a question on whether work burden loads have changed because of completing the training program.
However, without capturing the baseline work burden levels it is difficult to compare the responses which indicate a general “increase/decrease” trend. In future studies, we would like to further specify “work burden” by time and effort spent as well as quantifying these before and after participating in the program. This will allow a more robust comparison of the changes among genders and other segmentation groups.
Lastly, to dive deeper into the potential differences in impact between the genders, we recommend speaking to both the program participants and their spouses/partners to capture the two perspectives of changes in household dynamics. If time and resources allow, expanding the surveying pool to include employees working in retail shops as well as customers would provide insights to community-level changes that may occur.

A Lean Data How-To Guide: Understanding Gender ImpactAcumen 95
It has improved the way I am running my business because now I have more knowledge on financial management which has to do with record keeping. I keep records of money spent in buying products, the profits I make from selling these products and the money I spent in solving my personal problems.
“Male RISE Academy Participant
A Lean Data How-To Guide: Understanding Gender ImpactAcumen 95

A Lean Data How-To Guide: Understanding Gender ImpactAcumen 96

A Lean Data How-To Guide: Understanding Gender ImpactAcumen 97
KERICHO TEA PLANTATION, KENYA
CASE STUDY
97

A Lean Data How-To Guide: Understanding Gender ImpactAcumen 98A Lean Data How-To Guide: Understanding Gender ImpactAcumen 98
THE KERICHO TEA ESTATE IS AN 8,700-ACRE PLANTATION IN KERICHO, KENYA, WHERE SOME OF THE WORLD’S FINEST TEA HAS BEEN PRODUCED SINCE 1924.
Nearly 6,000 employees work on the plantation. In 2013, allegations of sexual harassment of female workers on the plantation were levelled and Unilever has been working to investigate and rectify the situation.
This study was designed to learn about the impact and effect of the interventions made by Unilever to enhance safety on the plantation. The survey also studied general satisfaction among employees and collected suggestions for improvement for Unilever.

A Lean Data How-To Guide: Understanding Gender ImpactAcumen 99
60 Decibels enumerators in Kenya called 200 Kericho Tea Plantation employees to learn about their experience working with Unilever and Kericho. From the list of 358 employees who opted to participate in the study, we yielded a response rate of 58%, with 48% of respondents being female.
On average, the respondents we spoke to lived in households of five, were aged between 25-45 and tended to be moderately educated. In nearly 60% of respondent households, the female head had completed at least a high school diploma.
Using PPI®, we are able to determine the inclusivity of the Kericho program—that is, how well Kericho is including poor Kenyans, as compared to the national household poverty rate. This enables us to see if respondents are representative of the socio-economic patterns seen throughout Kenya. As demonstrated in the Inclusivity Ratio graph above, Kericho Tea does not appear to reach a socio-economic cohort consistent with the national average, with more respondent households above each of the income lines than the national average.
INCOME DISTRIBUTION OF KERICHO TEA EMPLOYEES RELATIVE TO KENYA AVERAGE (% living below $XX per day (2011 PPP) (n=198))
ABOUT THE SURVEY & PARTICIPANTS
Kenya Average Female Average
Kericho Tea Average Male Average
200PARTICIPANTS
48%WOMEN
KENYA
Kericho
A Lean Data How-To Guide: Understanding Gender ImpactAcumen 99
Per person income line (2011 PPP)
$-
00%
30%
4% 16%
49%
63%
76%
87%
53%
79%
87%92%
96%100%
20
40
60
80
100
% o
f po
pul
atio
n /
em
plo
yee
s
$1.9
0
$3.1
0
$6.0
0
$8.0
0
$11.
00
$15.
00
Ma
x
Middle class to wealthy
Emerging middle class
Low income
Relative poverty
Extreme poverty

A Lean Data How-To Guide: Understanding Gender ImpactAcumen 100
You cannot compare Unilever with other tea companies. We are well taken care of as employees.
“Kericho Tea Plantation Employee

A Lean Data How-To Guide: Understanding Gender ImpactAcumen 101
Source: Kericho Tea Plantation

A Lean Data How-To Guide: Understanding Gender ImpactAcumen 102
SATISFACTION
Kericho Tea received an NPS® of 37, which is a fairly good score indicating general employee satisfaction with room for improvement. Promoting respondents highlighted the following positive value drivers:
• Good working environment (60%)
• Value of schools on plantation (16%)
• Free medical care on plantation (12%)
However, less satisfied respondents were more likely to mention security concerns (29%) or low salary (14%) as reasons for their discontent.
SAFETY
Much of this study was centered around understanding employee experiences related to safety on the plantation and the value of various safety-enhancing interventions sponsored by Unilever.
Overall, 15% of respondents reported having ever felt unsafe on the plantation. 72% said they feel even safer now than when they started working on the plantation. Longer-term employees were less likely to report this increasing feeling of safety than employees who joined after 2010. To understand the nuances in safety between genders, we
asked respondents whether men and women experienced near-equal perceptions of security during both the day and night and found that nearly all believed men and women felt equally safe during the day, but only some said the same about the nighttime, where it was felt that women were more vulnerable.
Among customers who reported feeling safer on the plantation than ever before, they said that Unilever interventions to improve the perception had had an effect. Overall, 93% of respondents say they are satisfied with how the company has addressed safety in the community—namely the increase in safety patrols, lighting and safety and gender-based violence training. Employees also seemed to have twice as much confidence in Unilever as compared to public authorities in being able to remediate an issue related to violence.
Interestingly, we observed nearly no difference between male and female responses on metrics related to the feeling of insecurity or the impact of safety improvements and changes. Despite these positive results, employees still presented avenues for continual improvement for Unilever—the main suggestion was improved communication between management, security forces and employees both to build trust and to address ongoing security concerns.
RESULTS

A Lean Data How-To Guide: Understanding Gender ImpactAcumen 103
KERICHO TEA PLANTATION NET PROMOTER SCORE (NPS)
[Unilever] has helped me educate my daughter. When I was employed my daughter was in class 8. I was very poor but I educated her and now she is in University. Thank you!
“Kericho Tea Plantation Employee
IMPACT
370
-100
-50 50
100
These safety interventions alongside other programs Unilever has implemented on the plantation have had a positive effect on the lives of respondents and appear to have gone a long way in enhancing trust and loyalty among employees.
88% of respondents said the quality of their lives had improved to some degree since the safety initiatives were introduced on
the plantation, and 65% said their lives had “improved very much.” Employees were able to note feeling more safe, positive effects on their children and general household life, as well as improved education and knowledge.
Overall, employees appear to have been positively impacted by Unilever’s security and social programs, which have generally improved the work environment.

A Lean Data How-To Guide: Understanding Gender ImpactAcumen 104
LESSONS LEARNED
Security guards are really serious; cleanliness [is] observed; safety and risk assessment, and learning experiences.
“ Kericho Tea Plantation Employee
Potential biases may have affected the results of this study. Primarily, all respondents self-selected into the survey, having opted in at an earlier date. Secondly, the scores for men and women were surprisingly similar. The hypotheses that female employees would have fewer positive responses as compared to their male counterparts was not corroborated by the data and analysis.
However, the major learning around the study was clear: in the face of safety issues,
Unilever’s security interventions made a difference. While adding security lights and more guards and patrols made a difference in feelings of safety, social programming appears to be what improved living conditions on the plantation most. Better schools, healthcare and financial literacy trainings appeared to be the main value driver behind satisfaction.

A Lean Data How-To Guide: Understanding Gender ImpactAcumen 105
…the working environment is good and I feel empowered as an employee because I have freedom to walk without fearing for my safety....
“ Kericho Tea Plantation Employee
A Lean Data How-To Guide: Understanding Gender ImpactAcumen 105

A Lean Data How-To Guide: Understanding Gender ImpactAcumen 106

A Lean Data How-To Guide: Understanding Gender ImpactAcumen 107
SURVEY MODULES
107

A Lean Data How-To Guide: Understanding Gender ImpactAcumen 108
WOMEN'S ECONOMIC EMPOWERMENT
How has the intervention or program affected a woman’s financial independence and her engagement in income-generating activities? Has the intervention or program affected her ability to make decisions about her own and her family’s financial well-being?
Before [Company], did
you have access to other
sources of credit for your
business?
Do you currently have
access to any of the
following accounts/
institutions? [Select all
that apply]
Has [Company] changed
the way that you are able
to run your business?
Who in your household
decided to start engaging
in this business?
Who in your household
decides what to order for
your shop?
Who decides what to do
with the money that is
earned from selling those
products?
On average, how much
do you earn from your
business on a weekly
basis?
Compared to a time
before you joined
[Company], are you
earning more, less or
the same from your
business?
[If they answered “A lot
more” or “A little more”]
How much more do you
earn on a weekly basis
as compared to a time
before you participated
in the program?
Yes, regulary
Where did you receive these loans?
“ ”
Yes, occasionally
No, never
Bankaccount
You
You
You
A lot more
Very much improved (go to (a))
(a) How has it improved?(b) Why has it not changed?(c) How has it become worse?“ ”
Mobile money account
Your spouse/ partner
Your spouse/ partner
Your spouse/ partner
A little more
Slightly improved(go to (a))
SACCO or community
savings group
Another male family member
Another male family member
Another male family member
The same
No change(go to (b))
Microfinance Institution
Another female family member
Another female family member
Another female family member
A little less
Got slightly worse
(go to (c))
No, I do not have access to any of these
Other(write in):
Other(write in):
Other(write in):
A lot less
Got much worse
(go to (c))
Not sure

A Lean Data How-To Guide: Understanding Gender ImpactAcumen 109
POWER & AGENCY
0-25%(a little bit)
Increased,
Increased,
Increased,
Increased,
25-50%(up to half)
Decreased,
Decreased,
Decreased,
Decreased,
50-75%(more than half)
Not changed?
Not changed?
Not changed?
Not changed?
75-100%(almost all)
Don’t know / can’t say
Don’t know / can’t say
Don’t know / can’t say
Don’t know / can’t say
Unsure
Beyond changes in income, how has the intervention or program altered her self-confidence, willingness to voice her opinion, and her sense of belonging and community? Has there been any perceived change in how she is received and respected within her household or community?
What do you spend your
extra earnings on? Please
name two.
How much of your entire
household’s income in
the last 1 month came
from your earnings from
your business?
Currently, do you
personally do other
things to earn money as
well?
What are the top three
ways in which you earn
income?
...your active
contribution in
important family
decisions…
…the respect you receive
from your spouse and
other family members…
…the respect you receive
from the community…
...your confidence
in yourself and your
abilities…
#1
Now I will read you a list of things that happen within households. Can you please tell me which of these areas
have improved, gotten worse or not changed since you started working with [Company]? Since you started working with [Company], has…
#1
#2
#2
#3
Yes No

A Lean Data How-To Guide: Understanding Gender ImpactAcumen 110
BALANCE OF PAID & UNPAID WORK
WORKPLACE SAFETY & VIOLENCE AGAINST WOMEN
For interventions that focus on entrepreneurship, are women sharing equally in the benefits of the intervention or program? Who is bearing the brunt of the work required for participation in the program? How is the share of unpaid work redistributed, if at all, as a result of participation in the program?
Does the intervention or program explicitly address issues of safety in the workplace for both men and women? Are adequate facilities and trainings available to ensure that men and women can both feel safe?
You
You
Increased
Can you please explain your answer?
Your spouse/ partner
Your spouse/ partner
Decreased
Another male family member
Another male family member
Not changed
Another female family member
Another female family member
Don’t know/can’t say
Other(write in):
Other(write in):
Who in your household
does the work of stocking
the products to sell?
Who in your household
does the work of selling
those products in the
shop?
Since you began working
at XXXXX, how has your
overall work-burden,
including time spent
working in your shop
and doing work at home,
changed?
Yes
[If no] Why not?“ ”
No Prefer not to answerDo you believe that men
and women are equally
able to walk around the
workplace/community
safely during the day?
Now I have a few questions about your feelings of safety within the community. You can stop the survey at any
time and do not have to answer any questions that you feel uncomfortable responding to. Your answers will be
completely anonymous and there is no penalty for answering in a particular way. Are you comfortable continuing?

A Lean Data How-To Guide: Understanding Gender ImpactAcumen 111
Do you believe that men
and women are equally
able to walk around the
workplace/community
safely at night?
Have you ever felt
unsafe in the workplace/
community?
Are there specific places
in the workplace/
community where you
feel unsafe?
What year did you begin
working at XXXXX?
Compared to when you
first began working at
XXXXX, how would you
describe your feelings
about your safety within
the community?
What two things have
been most significant in
making you feel safer?
What two things do you
think would help make
you feel safer?
Do you agree or disagree
with this statement:
Since I began working at
XXXXX, I have observed
that the lighting in the
workplace/community
has improved.
Has the improved
lighting changed your
feelings of safety in the
workplace/community?
Do you agree or disagree
with this statement: I
know what to do if I ever
feel that my safety has
been violated.
The police would take
the report seriously?
I feel more safe
Very likely
Yes, I feel more safe
I feel less safe
Likely
Yes, I feel less safe
I feel the same about my
safety
Unlikely
No, I feel the same about my safety
Other
Very Unlikely
Other
Prefer not to answer
Not surePrefer not to answer
Prefer not to answer
Yes
Yes
Yes
Agree
Agree
No
No
No
Disagree
Disagree
Prefer not to answer
Prefer not to answer
Prefer not to answer
Prefer not to answer
Prefer not to answer
[If no] Why not?“ ”
[If yes] If you are comfortable, can you give me more information? Why and when do these places feel unsafe?“ ”
[If agree] What would you do if you experienced a safety violation?“ ”
Can you please explain your answer? “ ”
(Record year)
1.2.
1.2.
[If yes] If you are comfortable, can you give me more information about that experience? “ ”

A Lean Data How-To Guide: Understanding Gender ImpactAcumen 112
The police would take
steps to protect the
safety of the person
making the report?
The police would take
corrective action against
the alleged offender?
Unilever would take the
report seriously?
Unilever would take
corrective action against
the alleged offender?
The alleged offender
would retaliate against
the person making the
report?
The reputation of the
person making the report
would suffer?
Which of the following
welfare-related safety
activities have you
participated in? (Check
all that apply)
For all the activities that
you have participated
in, on a scale of 1 to
5, where 1 is not at
all effective and 5 is
very effective, how
effective were these
activities in improving
safety? (Answer where
applicable)
On a scale of 1 to
5, where 1 is very
dissatisfied and 5 is very
satisfied, how satisfied
are you with how XXXXX
has addressed safety in
the community?
Is there anything else
you would like to tell me
about your experience of
safety in the workplace/
community?
Can you please explain your answer?
“ ”
“ ”
1Very
dissatisfied
2Somewhat dissatisfied
3Neither
dissatisfied nor satisfied
4Somewhat
satisfied
5Very satisfied
Very likely
Very likely
Very likely
Very likely
Very likely
Very likely
Safety training
Monthly SGBV Safety Learning
1
1Not at all effective
1
1
1
1
2
2Somewhat ineffective
2
2
2
2
3
3 Neither
ineffective nor effective
3
3
3
3
4
4Somewhat effective
4
4
4
4
5
5Very
effective
5
5
5
5
Weekly Peer Education
Monthly DEC meetings
Village Barazas
Other
Safety Training
Monthly Sexual & Gender Based Violence Safety Learning (every last
Friday of the month)
Weekly Peer Education
Monthly DEC meetings
Village Barazas
None
Other (please specify):
Likely
Likely
Likely
Likely
Likely
Likely
Unlikely
Unlikely
Unlikely
Unlikely
Unlikely
Unlikely
Very Unlikely
Very Unlikely
Very Unlikely
Very Unlikely
Very Unlikely
Very Unlikely
Not sure
Not sure
Not sure
Not sure
Not sure
Not sure
Prefer not to answer
Prefer not to answer
Prefer not to answer
Prefer not to answer
Prefer not to answer
Prefer not to answer


A Lean Data How-To Guide: Understanding Gender ImpactAcumen 114
acumen.org
acumenfund
@acumen
@acumenorg
unilever.com
unilever
@unilever
@unilever
CONTACT
EXPLORE
Somerset House, New Wing, Strand, London, WC2R 1LA
+44 (0)2037 017 382