a laboratory technique for estimating the resilient...
TRANSCRIPT
A Laboratory Technique for Estimating the Resilient Modulus Variation of
Unsaturated Soil Specimens from CBR and Unconfined Compression Tests
By
Mike Vogrig Adam MacDonald
Submitted to
Dr. S. K. Vanapalli
In Partial Fulfillment of the requirements for the Degree
Bachelor of Engineering in
Civil Engineering
Faculty of Engineering Lakehead University
May, 2003
2
ABSTRACT
The shear strength of a sub-grade soil under a pavement is indirectly estimated by the California
Bearing Ratio (CBR) test and used in the design of pavements. The degrees of saturation (and
therefore the soil suction) vary considerably under a pavement due to the ingress of water and have
a significant effect on the strength of the soil sub-grade. Several design and maintenance measures
are usually undertaken to maintain unsaturated conditions of the sub-grade to achieve favorable
engineering properties of soil (i.e., low coefficient of permeability and high shear strength).
However, the conventional procedures for the pavement design are often based on empirical
procedures that are based on the principles of saturated soil mechanics. Limited numbers of studies
are available in the literature for the design of pavements where degrees of saturation are less then
100%.
The recent focus of the Departments of Transportation both in Canada and the United States has
been towards proposing pavement design procedures based on mechanistic-empirical approach
using resilient modulus as the primary soil parameter. These design procedures also do not use the
principles of unsaturated soil mechanics. Conventionally, resilient modulus values for pavement
materials are determined using modified triaxial shear testing equipment. These tests are time
consuming and require elaborate laboratory testing facilities. Simple correlations are available in
the literature to estimate resilient modulus of pavement materials from the California Bearing Ratio
(CBR) tests. The design of pavements was conventionally based on CBR test results prior to
development of the present design procedures that are based on resilient modulus values.

3
In the research study presented in this paper, a modified CBR test is proposed to take into account
the influence of unsaturated conditions in terms of degree of saturation. Specimens compacted in
CBR moulds at nearly saturated conditions were allowed to dry for varying time periods in order to
achieve different values of degree of saturation (i.e. unsaturated conditions). Unconfined
compression strengths were also determined on specimens that were prepared in a similar manner
as the CBR specimens. The unconfined compression tests were chosen in this study because it is a
quicker and simpler test to perform.
The focus of the present study was to understand the influence of degree of saturation on CBR
values and unconfined compressive strength behavior, and to propose a simple technique to
estimate the resilient modulus (Mr) from these tests. The research study presented in this paper is
promising and shows potential to propose a simple technique of estimating the resilient modulus
based on information of simple unconfined compression tests. A larger database of testing values is
required using different soils to propose valid correlations for estimating resilient modulus values
for compacted soils.
4
ACKNOWLEDGEMENTS
We would like to thank our supervising professor, Dr. S.K. Vanapalli for his time, guidance, and
support during the writing of this paper. He has been a guiding influence throughout our years at
Lakehead University, and his efforts will not soon be forgotten.
Our appreciation extends to the Minnesota Department of Transportation for supplying the soil used
in the project, as well all the help they’ve given us during the project’s preparation.
We would also like to thank Elizabeth Garven, for her help in preparing the figures for the paper.
Finally, we would like to thank our family and loved ones. Without their love and support, we
would not be here today.

5
TABLE OF CONTENTS
ABSTRACT ....................................................................................................................................... 2
ACKNOWLEDGEMENTS .............................................................................................................. 4
CHAPTER 1: INTRODUCTION ................................................................................................... 7
1.1 Background ........................................................................................................................ 7 1.2 Objectives and Scope of Study ......................................................................................... 8 1.3 Project Organization ......................................................................................................... 9
CHAPTER 2: REVIEW OF LITERATURE .............................................................................. 10
2.1 Introduction of Pavement Structure.............................................................................. 10 2.2 Design Criteria................................................................................................................. 10
2.2.1 Water Content............................................................................................................ 11 2.2.2 Compaction ............................................................................................................... 11 2.2.3 Coefficient of Permeability ....................................................................................... 12 2.2.4 Pavement Loading and Strength................................................................................ 13
2.3 Roadway Design Testing................................................................................................. 13 2.3.1 California Bearing Ratio (CBR)................................................................................ 14 2.3.2 R-Values.................................................................................................................... 15 2.3.3 Resilient Modulus...................................................................................................... 17 2.3.4 Index Properties......................................................................................................... 19 2.3.5 Mechanistic Empirical Design .................................................................................. 19
2.4 Bearing Capacity and Unsaturated Soils ...................................................................... 20 2.4.1 Categories of Failure ................................................................................................. 20 2.4.2 Design Loads............................................................................................................. 20 2.4.3 Design Theory and Equations ................................................................................... 21
2.5 Pavement Design Using the Principles of Unsaturated Soil Mechanics ..................... 22 2.5.1 Fluid Flow and Moisture Distribution Beneath Pavements ............................................. 22 2.5.2 Empirical Estimation of Resilient Modulus .............................................................. 23
2.6 Unconfined Compression Testing of Unsaturated Soil ................................................ 24 2.7 Summary .......................................................................................................................... 25
CHAPTER 3: The Relationship Between CBR Testing and Bearing Capacity ....................... 27
3.1 Introduction ..................................................................................................................... 27 3.2 Bearing Capacity Theory................................................................................................ 27 3.3 Stress Bulb Analogy ........................................................................................................ 27 3.4 The Stress Bulb and CBR Testing ................................................................................. 28
CHAPTER 4: TESTING PROGRAM ......................................................................................... 30
4.1 Introduction ..................................................................................................................... 30 4.2 The Soil ............................................................................................................................. 30 4.3 CBR Testing ..................................................................................................................... 31 4.4 Unconfined Compression Strength Testing .................................................................. 32
CHAPTER 5: PRESENTATION OF TEST RESULTS ........................................................ 34

6
5.1 CBR Testing Relationships............................................................................................. 34 5.2 Unconfined Compression Testing Relationships .......................................................... 35 5.3 Degree of Saturation versus Test Values....................................................................... 36
CHAPTER 6: INTERPERTATION OF RESULTS ................................................................... 38
6.1 Unconfined Compression Tests ...................................................................................... 38 6.2 CBR Tests......................................................................................................................... 39 6.3 Normalized Comparison of Test Values........................................................................ 40
CHAPTER 7: SUMMARY AND CONCLUSIONS.................................................................... 42
REFERENCES ................................................................................................................................ 43
APPENDICIES A: CBR Test Data 51 B: Unconfined Compression Test Data 58 C: CBR Plots 70 D: Unconfined Compression Plots 77 E: Technical Paper 81
7
CHAPTER 1: INTRODUCTION 1.1 Background Pavements are typically constructed using compacted soils that are in a state of unsaturated
conditions (with degrees of saturation between 75 to 90% and negative pore-water pressures in the
order of many atmospheres). The negative pore-water pressure, or matric suction, (ua - uw) is
defined as the difference between ua, the pore air pressure and uw, the pore-water pressure. The
matric suction varies considerably under a pavement and has a significant effect on soil strength.
However, conventional design procedures are based on empirical methods and the principles of
unsaturated soil mechanics are typically not accounted for.
Two procedures are commonly used by the transportation agencies in Canada and the U.S.A. in the
design of pavements. The first procedure is based on test results of the California Bearing Ratio
Tests (CBR Test). In this test procedure; a compacted, submerged soil specimen is loaded at a
constant rate until a defined deformation is reached. This test provides an indirect measure of the
shear strength of a soil, which is used in the design of pavements (Head, 1982). Some investigators
have reservations in using the CBR test procedure as it does not properly simulate the shearing
forces imposed on sub-soils that underlie a pavement structure (Garber and Hoel, 1997). More
recently, pavement design procedures have been based on the second method, which is a
mechanistic-empirical design method using resilient modulus (Mr) values. The resilient modulus
value is determined through the cyclic loading of a specimen by subjecting it to triaxial loading
conditions while measuring the recoverable axial strain. The resilient modulus value is more
widely accepted as the fundamental most descriptive property of a pavements sub-soil under
vertical loading conditions (Barksdale et al. 1997). It is based on realistic interpretation as
8
pavements are loaded in a cyclic manner. However, the determination of resilient modulus values
is expensive, time consuming and requires extensive laboratory facilities.
In the above design procedures, the thicknesses of the various layers of a pavement structure are
determined based on traffic volumes, loads, and vehicle sizes. The influence of matric suction is
not considered in both these analyses. This is one of the key limitations as matric suction has
significant influence on the engineering behavioural characteristics of pavements. A rational
approach of the design of pavements should be based on the principles of unsaturated soil methods.
1.2 Objectives and Scope of Study An attempt is made through this study towards understanding the influence of unsaturated
conditions (in terms of degree of saturation) on compacted soil that is used as a sub-grade. A
modified CBR test is proposed to interpret the results taking into account the influence of the
degree of saturation. Specimens compacted in CBR moulds at nearly saturated conditions were
allowed to dry for varying time periods in order to achieve different values of degree of saturation
(i.e., unsaturated conditions). Unconfined compression strengths were also determined on
specimens that were prepared in a similar manner as the CBR test specimens. The unconfined
compression tests were chosen in this study because it is a quicker and simpler test to perform.
The focus of the present study was to understand the relationship between the modified CBR and
the unconfined compressive strength behaviour and propose a simple technique to indirectly
estimate resilient modulus (Mr) values from these tests. The results are encouraging as they
promote simplistic methods of laboratory testing that can be used in the design of pavements using
the principles of unsaturated soil mechanics.
9
1.3 Project Organization This research project is organized into eight chapters. The need for research is presented in the first
chapter. The scope and objectives of the research program are presented in this chapter. The
second chapter provides a review of the literature on this research topic. It provides an overview of
the key topics related roadway design procedures. The third chapter describes the theory associated
with the CBR testing procedures for unsaturated soils. The soil properties and testing program
details are provided in the fourth chapter. The fifth and sixth chapters respectively present and
interpret the results of the research study. The seventh chapter summarizes and concludes the
research and presents conclusions based on the results.

10
CHAPTER 2: REVIEW OF LITERATURE 2.1 Introduction of Pavement Structure A pavement structure is typically comprised of several different layers and identified as the sub-
grade, the sub-base, the granular base and the wearing surface or asphalt surface. A typical
schematic of such a pavement structure is shown in Figure 2.1.
Figure 2.1. Typical Pavement Layers
Each layer of the roadway system has a specific purpose and design requirement. The sub-grade
acts as the foundation of the road and often, material native to the site is used. In the case of poor
soil conditions, a compacted fill material can take its place. The sub-base lays overtop of the sub-
grade. It is comprised of a more refined material then the sub-grade for purposes of strength and
drainage. The granular base is placed over the sub-base. This base layer typically constitutes of
larger particle sizes in order to meet the drainage and strength requirements that a roadway system
requires. An asphalt layer compromised of selected aggregates and a binding material provides a
capping system. It acts as a protective surface for other soil layers and a wearing surface for
passing vehicles. The main function of an asphalt surface is protection rather than strength.
2.2 Design Criteria Several soil index properties are important in meeting the design criteria of a pavement structure.
The index properties that need to be considered are the initial compaction, moisture content, and
Asphalt Concrete Surface
Granular Base
Sub-base
Sub-grade
Asphalt Concrete Surface
Granular Base
Sub-base
Sub-grade
11
degree of saturation. These provide valuable information with respect to the general characteristics
of the pavements behaviour. However, mechanical properties that include the shear strength and
the coefficient of permeability impact design. As pavements undergo a unique type of loading
conditions, empirical tests have been used in understanding a soil’s mechanical properties. Due to
this reason, direct testing of these properties is difficult. The assessment of the mechanical
behaviour of soil is achieved through a number of tests either specific for pavement design
applications or conventionally used for testing soils.
2.2.1 Water Content The engineering behaviour of soil is influenced by the water content. Water coming from many
sources such as rainfall, capillary action, seasonal movement of the water table and ingress can
enter the pavement system (Drumm et al. 1998). It is important to keep moisture out of the sub-soil
during construction and during the design life of the pavement as it affects the soils mechanical
properties. Control of moisture in a pavement system can be accomplished by preventative
measures, such as blocking of the entrance of incoming water with barriers and also the use of
proper drainage of the soil layers (Park, Lytton and Button 1998). These preventative measures can
be achieved by the proper design of the soil layers using principles of unsaturated soil mechanics in
order to design a capillary barrier. Such barriers are needed as the moisture content of a soil affects
its mechanical properties such as the strength and permeability.
2.2.2 Compaction In order to achieve required strengths needed for a long lasting pavement, the properties of the
material in place in the field must simulate what is designed in the laboratory. This is primarily
achieved by compaction to increase the density of the soil. It should also be noted that compaction
12
not only affects the shear strength of the soil in place, but also the flow behaviour through the soil
(i.e. coefficient of permeability). A high degree of compaction will minimize settlement and
volume change. This is associated with the increase of strength of the compacted soil layers. As
well, compaction of a soil in either wet of optimum or dry of optimum conditions will affect the soil
structure. This soil structure can have dramatic effects with regards to shear strength and the
coefficient of permeability (Lambe, 1958 and Vanapalli et. al. 1999). As such, it is important to
keep control over the compaction in the field to ensure that the soil is at the appropriate design
water content. This will ensure the resulting soil structure influence on the engineering behaviour
of soil is known. Inconsistencies also occur in design as a soil is usually only compacted to 95-98%
compaction in the field, in comparison to the 100% compaction achieved in the laboratory. These
soils, supposedly at optimum water content or slightly wet of, often are compacted on the dry side
resulting in a soil structure not accounted for in design (Jiménez-Salas, 1994).
2.2.3 Coefficient of Permeability The coefficient of permeability, k, of a soil is one of the key parameters to be considered in the
design of a pavements sub soil layers. It is essential that the soil layers allow drainage away from
the pavement surface such that no unstable layers occur. As well, the soils must be permeable
enough that water does not pool in soil layers or on the surface, weakening the soils strength
characteristics (Garber and Hoel, 1997). As current empirical design methods only take into
account a single favourable moisture condition, permeability must reach an equilibrium in which
moisture lost will be regained, allowing the road structure to retain its favorable properties. Hence,
permeability must be used in correlation with climatic data in order to achieve proper design with
respect to the drainage of the soil layers. In addition, permeability is a main factor influencing
capillary action in a soil. Capillary action is defined as the movement of free moisture by capillary
13
forces through the openings in the soil into pores that do not contain water. Capillary action must
be controlled as it can cause stability problems and lead to frost heave. An additional problem with
permeability occurs with the surface, impermeable layer. This layer impedes evaporation of the
water beneath it and an unstudied “pumping” effect increases moisture under the pavement
(Jiménez-Salas, 1994). As such, the influence of permeability must be taken into account in order
to ensure a free flowing, well drained, constant and consistent road structure.
2.2.4 Pavement Loading and Strength Loads for the strength design of a pavement are determined using the equivalent single axle load
(ESAL) (AASHTO Guide for Design of Pavement Structures, 1986). The ESAL is defined by the
number of repetitions a 18 000-lb or 80 kN, single axle load applied to a pavement structure on two
sets of dual tires will move over a point on a pavement over its design life (Garber and Hoel 1997).
The use of 18 000 lb, or 80 kN, has been experimentally proven to be the worst case condition when
considering other similar load effects on a pavement. The type and number of vehicles that will use
the pavement structure during its design life must be known along with how loading conditions will
be affected. Testing methods which use such design loads, and the values they derive are described
in the following paragraphs and expanded upon further into the paper.
2.3 Roadway Design Testing The soil layers of a pavement structure are commonly designed based on CBR values, liquid limits,
plasticity indices, particle size distributions and minimum sand equivalents. More recently, the
resilient modulus is used in the design of pavement structures. The resilient modulus can be
estimated directly by laboratory testing, or through conversion equations that relate Mr values to
CBR values and R-Values. The AASHTO 2002 Guide for Design of Pavement Structures has
14
provided requirements and parameters for direct and indirect determination of resilient modulus
values. However, CBR and R-Values tests are still used in the design of pavements.
2.3.1 California Bearing Ratio (CBR) The California Bearing Ratio test was developed by the California State Highway Association in
the 1930’s. Figure 2.2 shows typical CBR testing equipment.
Figure 2.2. Typical CBR Testing Equipment (http://www.intec.com.my/product/soilequip/cbr_access.html)
When a pavement system is in use the underlying soils are required to resist deformations, which
can occur due to the forces generated by vehicles loads (Wattson, 1989). This test is performed to
simulate these loads at the surface of a sub-grade by modeling deformation of sub-soil layers. The
CBR test not only takes into account the forces generated by vehicle loads, but also the surcharge
due to overlaying pavements. This is simulated through a surcharge equal to that of the weight of
the pavement expected on the sub-soil. Tested CBR values have been presented graphically to suit
the needs of the designer. With the aid of such charts estimations of the strength of a sub-grade can
be determined. As a result, a majority of transportation organizations in Canada, the U.S.A. and
other parts of the world use the charts for the design of road foundations. The procedure for
laboratory CBR tests is described in ASTM D 1883-99, and is entitled “Standard Test Method for

15
CBR of Laboratory-Compacted Samples”. AASHTOs Guide for Design of Pavement Structures
has a similar procedure under the designation T193.
Though CBR tests have been performed extensively on saturated soils, little data is available on
testing procedures using soils with degrees of saturation less then 100%. The literature provides no
modifications to testing procedures, nor any estimates of values that could be achieved through
testing with respect to unsaturated soil.
2.3.2 R-Values The resistance test was first formulated in the 1930s and was used to determine the stability of field
and laboratory samples of bituminous pavements. Later it was modified in order to determine the
resistance of subgrade materials. This test can also be used to determine values of a soils ability to
resist lateral deformation when there is an applied vertical load on a sub-soil. The apparatus used
for the resistance test is shown in Figure 2.3.
Figure 2.3. Standard Compactor used for finding exudation and expansion pressures as well as R-Values.

16
Several parameters that include exudation pressure, expansion pressure and resistance values (R-
values) are determined from this test. Exudation pressure is the compressive stress that will exude
water from a compacted soil sample. There have been tests performed in California to determine
such values resulting in a exudation pressure of 300 lbs/in2 for a soil underlying a pavement
structure. Studies have shown that this is equal to laboratory exudation pressure (Garber and Hoel,
1997). Exudation pressures occur at a moisture content that is used for sample preparation in the
stabilometer test. This test is used to determine the resistance values for a soil. Expansion pressure
is defined as the pressure that prevents a soil from expanding under design criteria. This pressure is
related to the required thickness of material above the sub soil that will prevent any swelling (Hoel,
Garber, 1997). Resistance values are determined using a force Hveem stabilometer test after the
expansion pressure is measured. A vertical pressure is applied, at a slow and constant rate, to a
defined end pressure that has been previously determined. Once the end pressure is reached the
horizontal pressure and any displacement are recorded. The Hveem and Sherman, (1963) equation
can be used to calculate the R-value as given below.
[1] ⎥⎦
⎤⎢⎣
⎡+⎟⎟
⎠
⎞⎜⎜⎝
⎛−⎟
⎠⎞
⎜⎝⎛
−=115.2
100100
h
v
PP
D
R
where:
Pv is the vertical pressure; Ph is the horizontal pressure and; D is the vertical displacement
Further explanation of the test procedure can be found in ASTM D 2844-01, and is entitled
“Standard Test Method for Resistance R-Value and Expansion Pressure of Compacted Soils”.
AASHTO’s Guide for Design of Pavement Structures has a similar procedure under the designation
T190.
17
2.3.3 Resilient Modulus The primary engineering property used in the mechanistic empirical design of pavement structures
is the resilient modulus (Mr). The apparatus used for estimating resilient modulus values is shown
in Figure 2.4.
Figure 2.4. Apparatus used for determining the resilient modulus (http://www.geosensor.com).
The resilient modulus is equal to the peak applied repeated axial stress divided by the recoverable
axial strain occurring within the specimen. The resilient modulus can be calculated with the
following equation.
[2] ( )
1
31
arM
εσσ −
=
where: σ1- σ3 equals maximum repeated axial stress (deviator stress) and; εal is the maximum recoverable resilient axial strain

18
Determination of resilient modulus values from laboratory tests using triaxial shear testing
equipment are difficult and time consuming. Due to this reason, the resilient modulus is estimated
from CBR values and resistance, R-values. The conversion between the CBR values and the
resilient modulus is described by the Asphalt Institute’s Soils Manual for the Design of Asphalt
Pavement Structures. The conversions equations are as follows:
[3.1] ( ) CBRMPaM r 342.10= [3.2] ( ) CBRinlbM r 1500/ 2 = The above conversion factors are valid only for resilient modulus values less then 30,000 lb/in2.
The conversion between R-values and the resilient modulus is described by the Asphalt Institute’s
Soils Manual for the Design of Asphalt Pavement Structures by the following equations:
[4.1] ( ) ( )valueRMPaM r −∗+= 8.38 [4.2] ( ) ( )valueRMPaM r −∗+= 5551000 Design charts are also available in place of the above conversion equations. However, they are not
accurate as these values must be extrapolated. Also, several studies have shown the resilient
modulus, Mr values estimated from resistance, R-values are not accurate (Garber and Hoel, 1997).
A number of parameters can influence resilient modulus values. Changes in temperature,
particularly those that cause freeze-thaw cycles, can cause significant differences in Mr values.
Studies have shown values of the resilient modulus can decrease up to 3.5 times in clay and fine
sands after thawing and before freezing (Janoo et al. 1999). Unsaturated conditions and associated
matric suction effects also influence resilient modulus values. Richards and Peter, (1987), reported

19
increases with suction, resilient modulus values increased for expansive soils. The Mr value of a
sub-soil overlain by a pavement can increase by a factor of 5 or more as the soil goes from a wet to
dry state because the suction created from this transition causes an increase in effective stress.
However, at higher Mr values, matric suction causes minimal variations (Berg et al. 1996). In the
field, changes in moisture content (and therefore degree of saturation and suction), almost always
occur due to weather and seasonal changes. Therefore, estimation of resilient modulus values must
take into account moisture effects from time of construction to long term conditions (Philip and
Cameron, 1994).
2.3.4 Index Properties The design of pavements can also be based on index properties of the soil. Testing of index
properties is relatively simple and inexpensive. Correlation of the index properties of a soil to a
more fundamental property such as resilient modulus has the potential to provide a reasonable and
cost effective means of pavement design (Zeghal, 2001).
2.3.5 Mechanistic Empirical Design In 1986, the AASHTO Guide for Design of Pavement Structures initiated the resilient modulus
concept as a qualitative measure of pavement subsoil strength under dynamic loading. Mechanistic
empirical design uses the resilient modulus as a key design parameter, as well as previously
available empirical data in an attempt to increase the efficiency of pavement design. The resilient
modulus has had issues with its usefulness in design since it is a non-linear stress dependant
measurement, making its determination a complicated task (Ping, 2001). However, the current
acceptance of mechanistic empirical design methods have led to research on finding simplified
methods of estimating resilient modulus values.
20
2.4 Bearing Capacity and Unsaturated Soils An alternate method of pavement design can be based on extending bearing capacity theory using
principles of unsaturated soil mechanics. The bearing capacity of roadway systems depends on the
strength of soils beneath the surface layer. The required soil properties for determining the bearing
capacity include the saturated shear stength parameters (c’, φ’) and the frictional angle indicating
the rate of increase in shear strength with respect to matric suction, (φb).
2.4.1 Categories of Failure Two modes of failure are considered in the bearing capacity design approach for roadway systems.
The first failure criteria are based on the limit equilibrium method. This method assumes that the
base layer acts as an elastic material to distribute load to the sub-grade (Broms, 1963, 1964;
Barenburg and Bender, 1978; Giroud and Noiray, 1981; Milligan et. al. 1989; Sattler et. al. 1989;
Szafron, 1991). Complex factors such as pore water pressure and soil layering can be modelled in a
simpler form using this method (Fredlund et. al. 1997). The second mode of failure is based on
extending the general shear failure criteria for all the pavement layers (McLeod, 1953). This
method is realistic; however, it involves a complex and tedious series of calculation. Also,
incorporation of matric suction and pore water pressures into this failure mode criteria is difficult
and complex (Fredlund et. al. 1997). Due to these reasons, it is not the preferred method of
determining the bearing capacity of a layered soil system.
2.4.2 Design Loads Design loads in bearing capacity design are estimated using the Equivalent Single Wheel Load
(ESWL). The load calculation procedure is similar to the ESAL estimation as per AASHTO’s
Guide for the Design of Pavement Structures. The basis of the ESWL is the pressure a tire places
21
on a roadway system over an assumed rectangular area. Portland Cement Association (PCA, 1984)
assists in the calculation of these design loads.
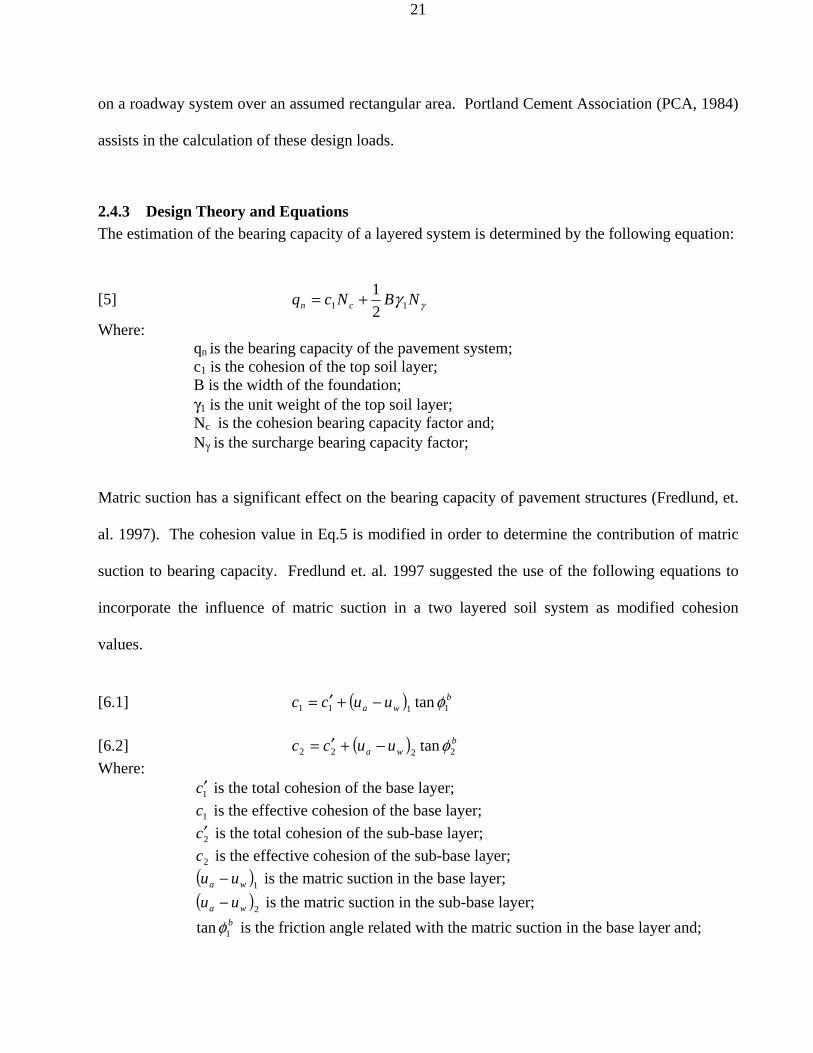
2.4.3 Design Theory and Equations The estimation of the bearing capacity of a layered system is determined by the following equation:
[5] γγ NBNcq cn 11 21+=
Where: qn is the bearing capacity of the pavement system; c1 is the cohesion of the top soil layer; B is the width of the foundation; γ1 is the unit weight of the top soil layer; Nc is the cohesion bearing capacity factor and; Nγ is the surcharge bearing capacity factor;
Matric suction has a significant effect on the bearing capacity of pavement structures (Fredlund, et.
al. 1997). The cohesion value in Eq.5 is modified in order to determine the contribution of matric
suction to bearing capacity. Fredlund et. al. 1997 suggested the use of the following equations to
incorporate the influence of matric suction in a two layered soil system as modified cohesion
values.
[6.1] ( ) b
wa uucc 1111 tanφ−+′= [6.2] ( ) b
wa uucc 2222 tanφ−+′= Where: 1c′ is the total cohesion of the base layer; 1c is the effective cohesion of the base layer; 2c′ is the total cohesion of the sub-base layer; 2c is the effective cohesion of the sub-base layer; ( )1wa uu − is the matric suction in the base layer; ( )2wa uu − is the matric suction in the sub-base layer;
b1tanφ is the friction angle related with the matric suction in the base layer and;
22
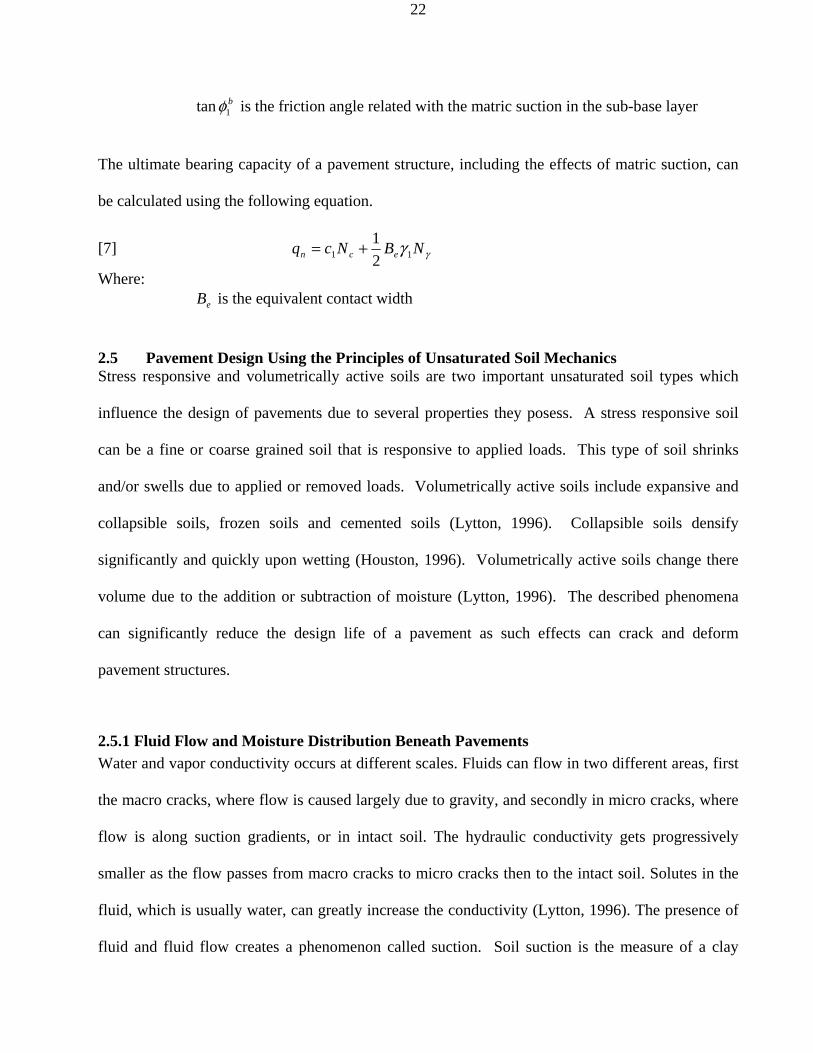
b1tanφ is the friction angle related with the matric suction in the sub-base layer
The ultimate bearing capacity of a pavement structure, including the effects of matric suction, can
be calculated using the following equation.
[7] γγ NBNcq ecn 11 21+=
Where: eB is the equivalent contact width 2.5 Pavement Design Using the Principles of Unsaturated Soil Mechanics Stress responsive and volumetrically active soils are two important unsaturated soil types which
influence the design of pavements due to several properties they posess. A stress responsive soil
can be a fine or coarse grained soil that is responsive to applied loads. This type of soil shrinks
and/or swells due to applied or removed loads. Volumetrically active soils include expansive and
collapsible soils, frozen soils and cemented soils (Lytton, 1996). Collapsible soils densify
significantly and quickly upon wetting (Houston, 1996). Volumetrically active soils change there
volume due to the addition or subtraction of moisture (Lytton, 1996). The described phenomena
can significantly reduce the design life of a pavement as such effects can crack and deform
pavement structures.
2.5.1 Fluid Flow and Moisture Distribution Beneath Pavements Water and vapor conductivity occurs at different scales. Fluids can flow in two different areas, first
the macro cracks, where flow is caused largely due to gravity, and secondly in micro cracks, where
flow is along suction gradients, or in intact soil. The hydraulic conductivity gets progressively
smaller as the flow passes from macro cracks to micro cracks then to the intact soil. Solutes in the
fluid, which is usually water, can greatly increase the conductivity (Lytton, 1996). The presence of
fluid and fluid flow creates a phenomenon called suction. Soil suction is the measure of a clay
23
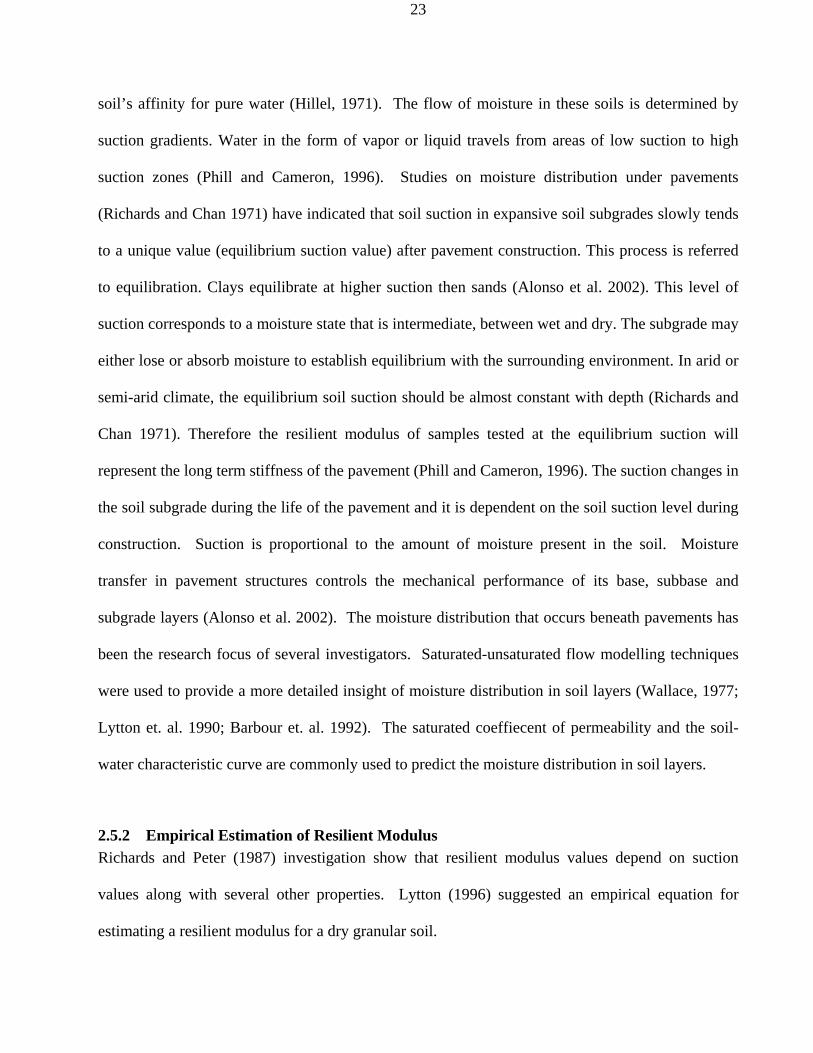
soil’s affinity for pure water (Hillel, 1971). The flow of moisture in these soils is determined by
suction gradients. Water in the form of vapor or liquid travels from areas of low suction to high
suction zones (Phill and Cameron, 1996). Studies on moisture distribution under pavements
(Richards and Chan 1971) have indicated that soil suction in expansive soil subgrades slowly tends
to a unique value (equilibrium suction value) after pavement construction. This process is referred
to equilibration. Clays equilibrate at higher suction then sands (Alonso et al. 2002). This level of
suction corresponds to a moisture state that is intermediate, between wet and dry. The subgrade may
either lose or absorb moisture to establish equilibrium with the surrounding environment. In arid or
semi-arid climate, the equilibrium soil suction should be almost constant with depth (Richards and
Chan 1971). Therefore the resilient modulus of samples tested at the equilibrium suction will
represent the long term stiffness of the pavement (Phill and Cameron, 1996). The suction changes in
the soil subgrade during the life of the pavement and it is dependent on the soil suction level during
construction. Suction is proportional to the amount of moisture present in the soil. Moisture
transfer in pavement structures controls the mechanical performance of its base, subbase and
subgrade layers (Alonso et al. 2002). The moisture distribution that occurs beneath pavements has
been the research focus of several investigators. Saturated-unsaturated flow modelling techniques
were used to provide a more detailed insight of moisture distribution in soil layers (Wallace, 1977;
Lytton et. al. 1990; Barbour et. al. 1992). The saturated coeffiecent of permeability and the soil-
water characteristic curve are commonly used to predict the moisture distribution in soil layers.
2.5.2 Empirical Estimation of Resilient Modulus Richards and Peter (1987) investigation show that resilient modulus values depend on suction
values along with several other properties. Lytton (1996) suggested an empirical equation for
estimating a resilient modulus for a dry granular soil.
24
[8] 32
11
k
a
oct
k
aa pp
IpkE ⎟⎟
⎠
⎞⎜⎜⎝
⎛⎟⎟⎠
⎞⎜⎜⎝
⎛=
τ
Where :
I1 is the sum of all principal mechanical stresses; τoct is the octahedral shear stress; pa is the atmospheric pressure in the same units as the resilient modulus and; k1,k2,k3 is the material properties of the dry granular soil
When the soil is in a state of unsaturated condition, the effect of soil suction is incorporated into
Eq.8. Eq.8 takes the form given below after the inclusion of suction parameter.
[9] 3231
1
k
a
oct
k
a
ma pp
fhIpkE ⎟⎟
⎠
⎞⎜⎜⎝
⎛⎟⎟⎠
⎞⎜⎜⎝
⎛ −=
τθ
Where: θ hm is the lower bound term from Lamborn’s theory and; ƒ is the function of volumetric water content
The value of ƒ is 1 at all water contents greater than θa, (volumetric water content at the air entry
value), and it is equal to θ at all water contents less then θu (volumetric water content at
unsaturation). The parameter f is bounded by the zone between saturated and unsaturated behavior
(Lytton, 1996).
2.6 Unconfined Compression Testing of Unsaturated Soil A native or borrowed soil is compacted to form the sub-grade of a pavement. The compacted soil
that forms the pavement is typically in a state of unsaturated condition. The compacted soil has a
negative pore water pressure, uw, and the pore-air pressure, ua, is typically equal to the atmospheric
pressure conditions. In other words, the matric suction, (ua - uw), is equal to the negative pore water
pressure. The shear strength of unsaturated soils can be interpreted using the unconfined

25
compression test results extending the shear strength equation for unsaturated soils proposed by
Fredlund et. al. 1978 (Vanapalli et. al. 1998). The pore air and the pore water pressures are not
measured in a conventional unconfined compression test during the shearing stage. The shear
strength of the soil can be interpreted in terms of initial matric suction values. (Vanapalli et. al.
1998). The matric suction of the soil specimen can decrease, increase or remain relatively constant
during the shearing stage. However, matric suction is likely to slightly decrease in field compacted
samples as the pore air pressure slightly increases due to compression without significant changes
in the pore water pressures. In other words, the matric suction in soil specimens at failure
conditions in the unconfined compression tests will be slightly less then the initial matric suction.
Due to this reason, it is quite probable that the determined shear strength will be a conservative
value from the unconfined compression test results (Fredlund and Rahardjo, 1993).
Kawai et. al. 2002 described the relationship between matric suction and unconfined compressive
strength of a dynamically compacted specimen by the following relationship.
[10] ( )wau uuq −= 09.8 Where: qu is the unconfined compression strength and; (ua – uw) is the suction strength at failure 2.7 Summary Pavement structure design is based on CBR values, R-Values or Resilient Modulus values. These
values are based on direct and indirect testing methods. These properties indicate the soils ability to
offer resistance to the applied loads and the performance of the pavement structure. In many of the
pavement design procedures, the influence of the degree of saturation (and suction) is not
considered. The soil properties, the CBR values, the R-values and the resilient modulus, will be
26
significantly different if the contribution of matric suction is considered. Therefore, there is a need
for more testing to be undertaken to study the influence of CBR and resilient modulus values of
unsaturated the condition of soils. These studies will improve mechanistic empirical design
procedures. Knowledge of the contribution of matric suction to pavement subsoil will aid in
discovering more accurate estimations of the soils strength and future behavior.

27
CHAPTER 3: The Relationship Between CBR Testing and Bearing Capacity
3.1 Introduction In a CBR test, a 2 inch diameter plunger is loaded into the soil that is compacted using an energy
that simulates field compaction conditions. The compacted soil sample in the standard mould is 5
inches in height and 6 inches diameter with a 2 inch spacer disk. From this test, CBR values are
determined by plotting penetration depth versus load. CBR values are an indirect indicator of the
shear strength of a soil.
3.2 Bearing Capacity Theory A bearing type load is created in CBR testing, where the load increases gradually over time. Failure
due to bearing is defined as the sudden decrease in the bearing capacity of a soil. The failure
loading is a function of the shear strength of the soil. Bearing failure has three forms depending on
the density of the soil. Denser soils fail along a well defined slip plane, loose soils fail locally, and
very loose soils exhibit punching shear failure. A number of equations are available In order to
calculate these failure loads (Budhu, 2000). The principles used in calculating the bearing capacity
of soil can be extended further using unsaturated soil mechanics. Cohesion values can be viewed as
having two components in this case. The first component is the effective cohesion and the second
is due to matric suction (Fredlund, 1993). Effective cohesion is modified to take into account
matric suction in Eq.6. In this project, the bearing capacity of unsaturated soils is not studied.
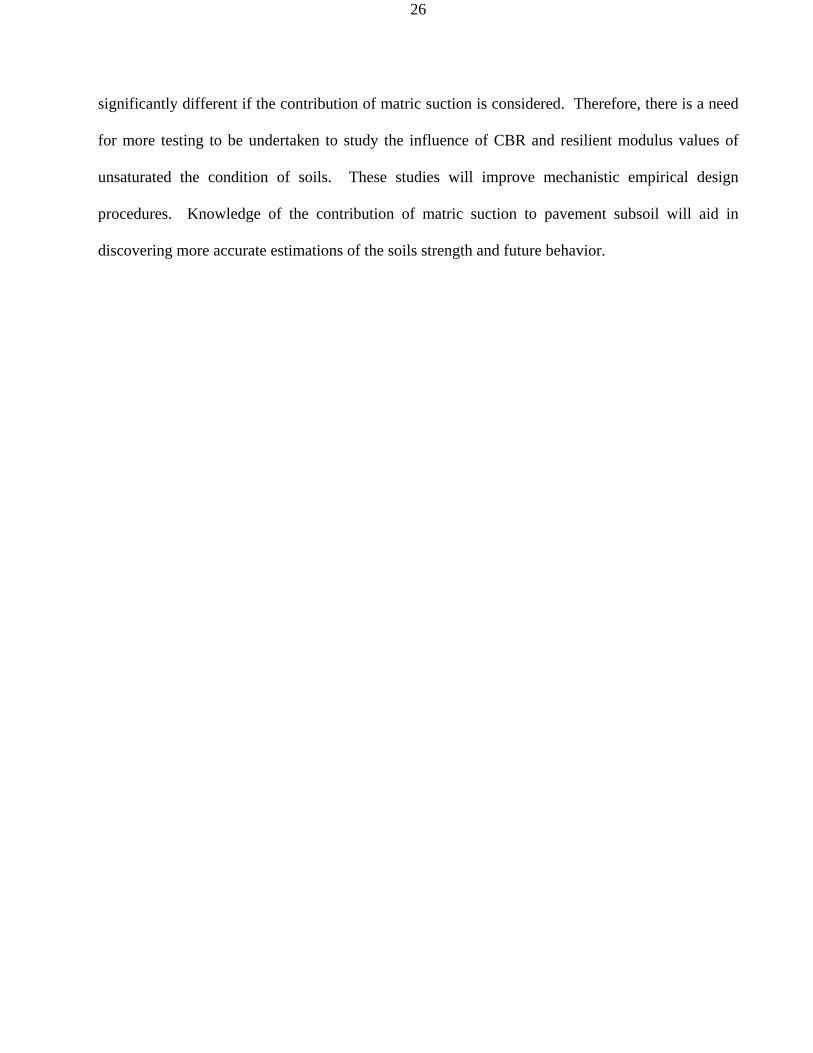
3.3 Stress Bulb Analogy The well known concept of the stress bulb analogy can be extended in understanding the
relationship between the CBR test and the bearing capacity. In bearing, not all the soil beneath the
load is affected. A bulb of the soil, however, is stressed and loaded as shown in Figure 3.1.
28
Figure 3.1: Soil Stress Bulb Under Bearing As such, one must be careful in choosing the soil layers which will affect the strength of a soil. The
stress bulb typically extends twice the base width into the soil layers. As well, the soils closer to the
base have a larger effect in soil strength. When comparing this analogy to the way in which a CBR
test is performed, it can be observed that there is a relationship between CBR values and bearing
parameters.
3.4 The Stress Bulb and CBR Testing In order to achieve a degree of saturation less then 100%, CBR test specimens were dried under two
40 watt light bulbs for varying time periods. The top portion of the specimen was drier in
comparison to lower portions even after letting the moulds sit in a moisture controlled room after
drying for a period of a week. For analysis purposes, the stress bulb was divided into three zones,
based on the degree of saturation of the specimen. A degree of saturation was calculated based on
the top third of soil. Secondly, a plot was made which calculated the degrees of saturation based on
the top two thirds of the soil as the stress bulb extended into this zone. The top third of the
specimen had higher degrees of saturation as compared to the top two thirds of the soil.
Comparison of the two different methods of plotting the CBR data is given in Figure 3.2.
Q
B
Df = 2B

29
Figure 3.2: Top Third and Two Thirds Water Content vs. CBR Values The stress bulb that arises due to loading extend into zones of varying degrees of saturation. In
other words, the matric suction value in the stress bulb is not a constant value. As the top layers of
soil most affect the soil strength in the stress bulb analogy, the top third plot of the degree of
saturation versus the CBR number was taken for comparison of results.
0.00
2.00
4.00
6.00
8.00
10.00
12.00
14.00
16.00
18.00
20.00
0.0 5.0 10.0 15.0 20.0w%
CB
R
30
CHAPTER 4: TESTING PROGRAM
4.1 Introduction The standardized ASTM testing methods were used for determining CBR and unconfined
compression strength values. Preparation of the soil samples, however, was modified in order to
obtain unsaturated conditions in both testing cases. More details about this procedure are detailed
later in the chapter. A number of drying times were determined in order to achieve various
saturations for the soil samples, and a full overview of the testing methods, procedures and soils
follows.
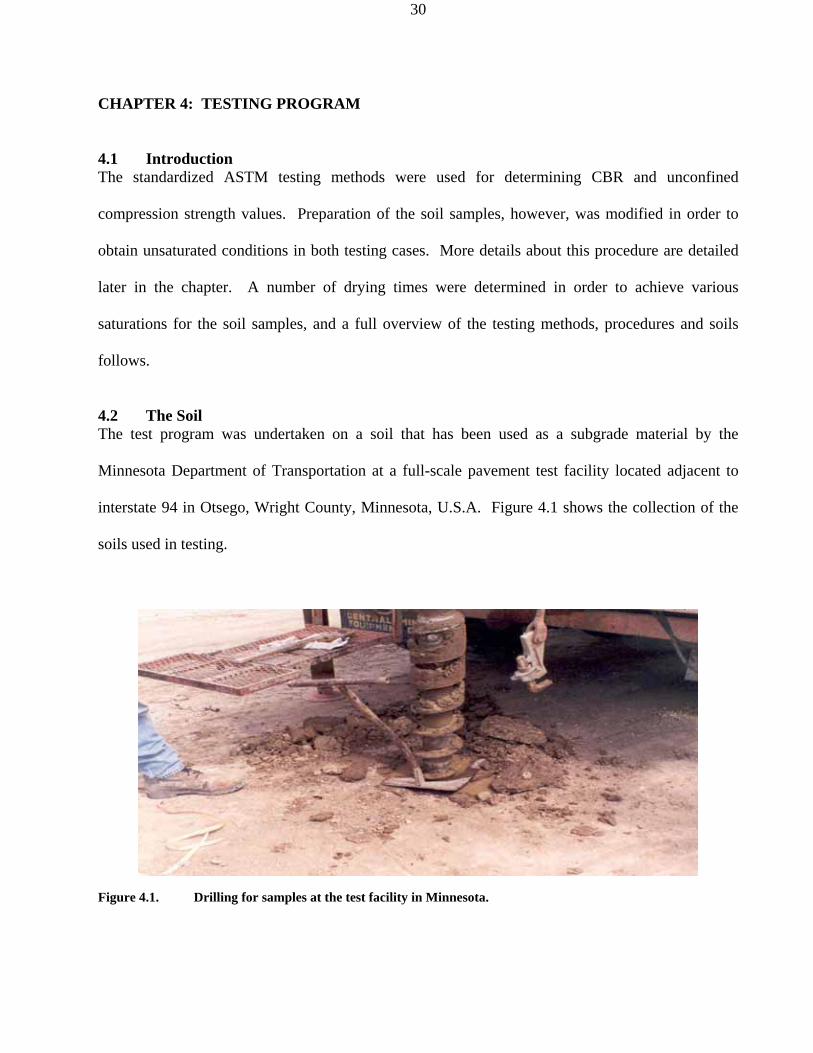
4.2 The Soil The test program was undertaken on a soil that has been used as a subgrade material by the
Minnesota Department of Transportation at a full-scale pavement test facility located adjacent to
interstate 94 in Otsego, Wright County, Minnesota, U.S.A. Figure 4.1 shows the collection of the
soils used in testing.
Figure 4.1. Drilling for samples at the test facility in Minnesota.

31
According to the Unified Soil Classification System (USCS) the soil would be classified as SM, or
a silty sand with respect to the grain size analysis preformed in the lab (Figure 4.2). The soil
consists of about 50% coarse particles (i.e. sand) and 50% fine particles (i.e. silt and sand).
Figure 4.2. Grain size analysis data of two representative soil samples.
The specific gravity of the soil was 2.7. The optimum water content and dry unit weight of the soil
from modified proctor tests were determined to be 13% and 18.6 kN/m3 respectively.
4.3 CBR Testing The CBR test was conducted in the laboratory on the soil using conventional ASTM standardized
testing methods (ASTM, 1997). The initial water content and density values were chosen such that
the specimen prepared for CBR tests were initially in a state of saturated condition. The water
content and dry density used to achieve this condition were 16% and 18.6 kN/m3 respectively. This
procedure deviates from conventional CBR procedures in which the tests are conducted only at
optimum moisture content values. The compacted samples in the CBR moulds were subjected to
0.010.1110 Particle Size (mm)
0
10
20
30
40
50
60
70
80
90
100
Per
cent
Pas
sing
(%)

32
drying under two-40 watt light bulbs for varying time increments in order to achieve different
degrees of saturation. Discolouration and some shrinkage cracks were observed after drying in
some specimens that were subjected to periods of drying greater then 12 hours. This is shown in
Figure 4.3. The CBR moulds were wrapped in plastic after drying and placed in a moisture
controlled room for a period of a week in order to achieve equilibrium moisture content conditions
in the sample. Soil samples were collected at three different heights after drying for the CBR
mould compacted specimens to determine degrees of saturation from mass-volume properties. The
sample preparation procedures described here facilitated preparation and testing of CBR samples in
order to understand the influence of unsaturated conditions in terms of the degree of saturation on
the CBR values.
4.4 Unconfined Compression Strength Testing Soil specimens of 33 mm diameter and 70 mm height were prepared to determine the unconfined
compression strength of the soil using a procedure proposed by Subbarao (1972). In this procedure,
a soil specimen in a Harvard mini-mould is subjected to a defined constant load for a defined period
of time. Sample preparation in the lab using this procedure is shown in Figure 4.3.
Figure 4.3. Compaction of unconfined compression specimens using the Subbaro and Fry method.
33
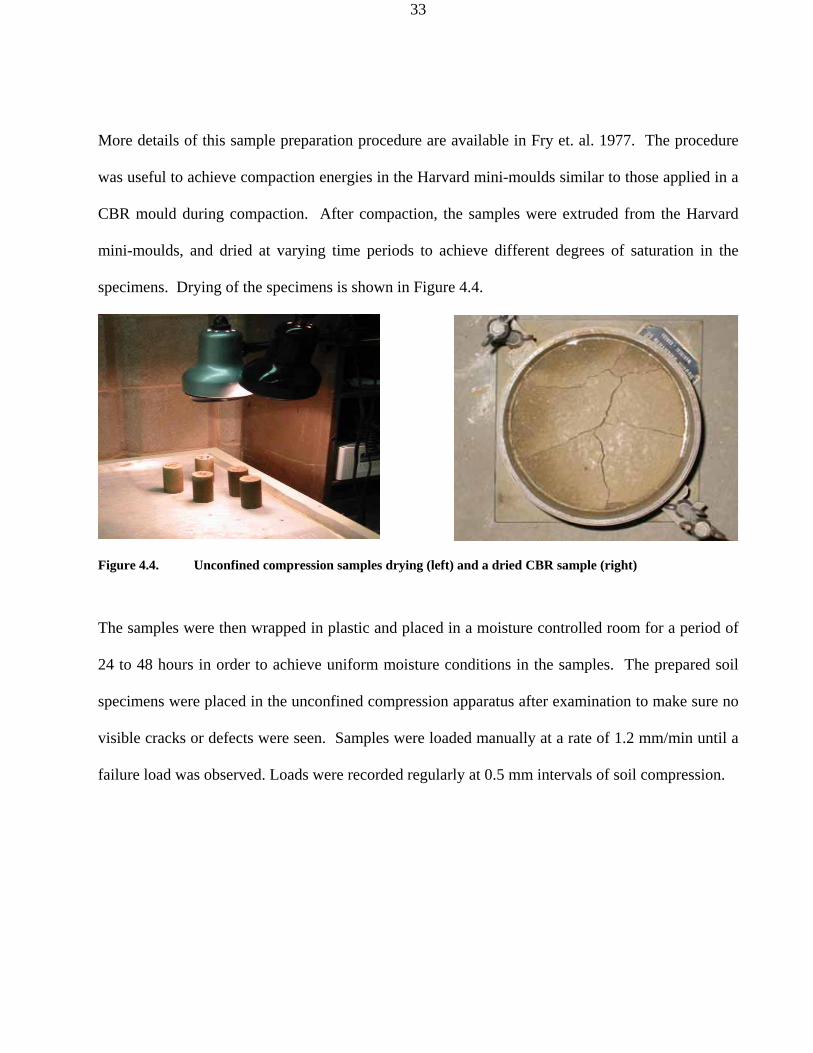
More details of this sample preparation procedure are available in Fry et. al. 1977. The procedure
was useful to achieve compaction energies in the Harvard mini-moulds similar to those applied in a
CBR mould during compaction. After compaction, the samples were extruded from the Harvard
mini-moulds, and dried at varying time periods to achieve different degrees of saturation in the
specimens. Drying of the specimens is shown in Figure 4.4.
Figure 4.4. Unconfined compression samples drying (left) and a dried CBR sample (right)
The samples were then wrapped in plastic and placed in a moisture controlled room for a period of
24 to 48 hours in order to achieve uniform moisture conditions in the samples. The prepared soil
specimens were placed in the unconfined compression apparatus after examination to make sure no
visible cracks or defects were seen. Samples were loaded manually at a rate of 1.2 mm/min until a
failure load was observed. Loads were recorded regularly at 0.5 mm intervals of soil compression.
34
CHAPTER 5: PRESENTATION OF TEST RESULTS
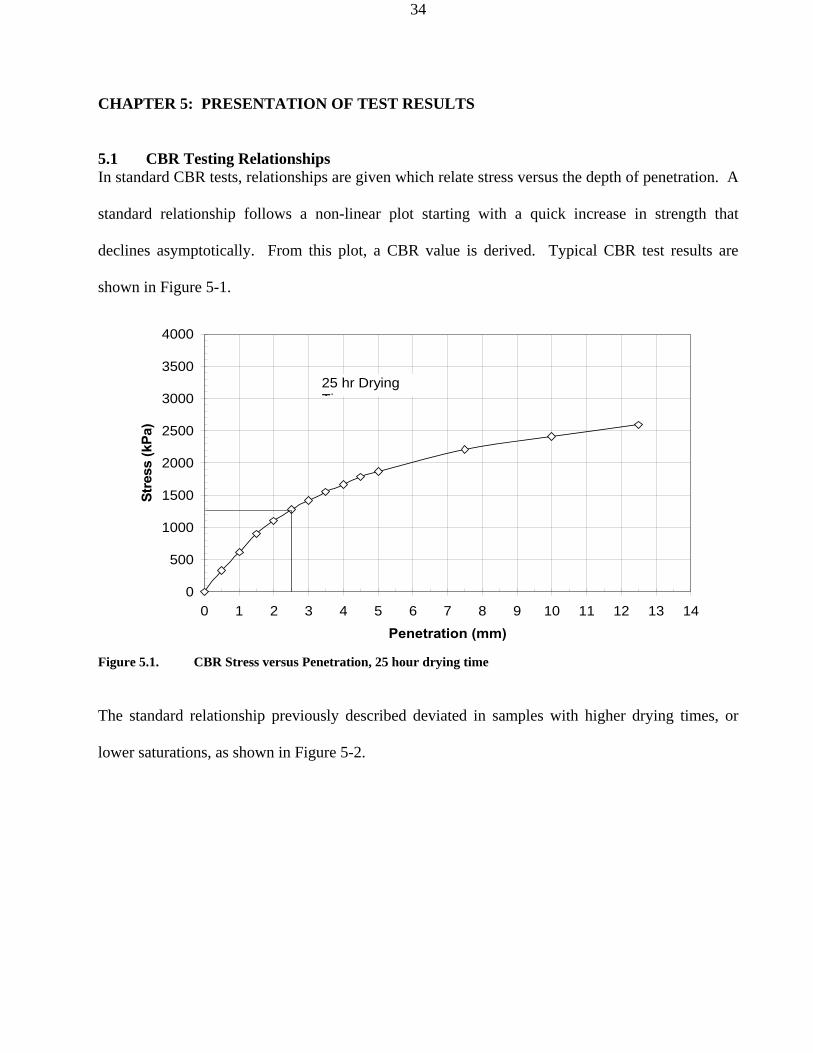
5.1 CBR Testing Relationships In standard CBR tests, relationships are given which relate stress versus the depth of penetration. A
standard relationship follows a non-linear plot starting with a quick increase in strength that
declines asymptotically. From this plot, a CBR value is derived. Typical CBR test results are
shown in Figure 5-1.
Figure 5.1. CBR Stress versus Penetration, 25 hour drying time
The standard relationship previously described deviated in samples with higher drying times, or
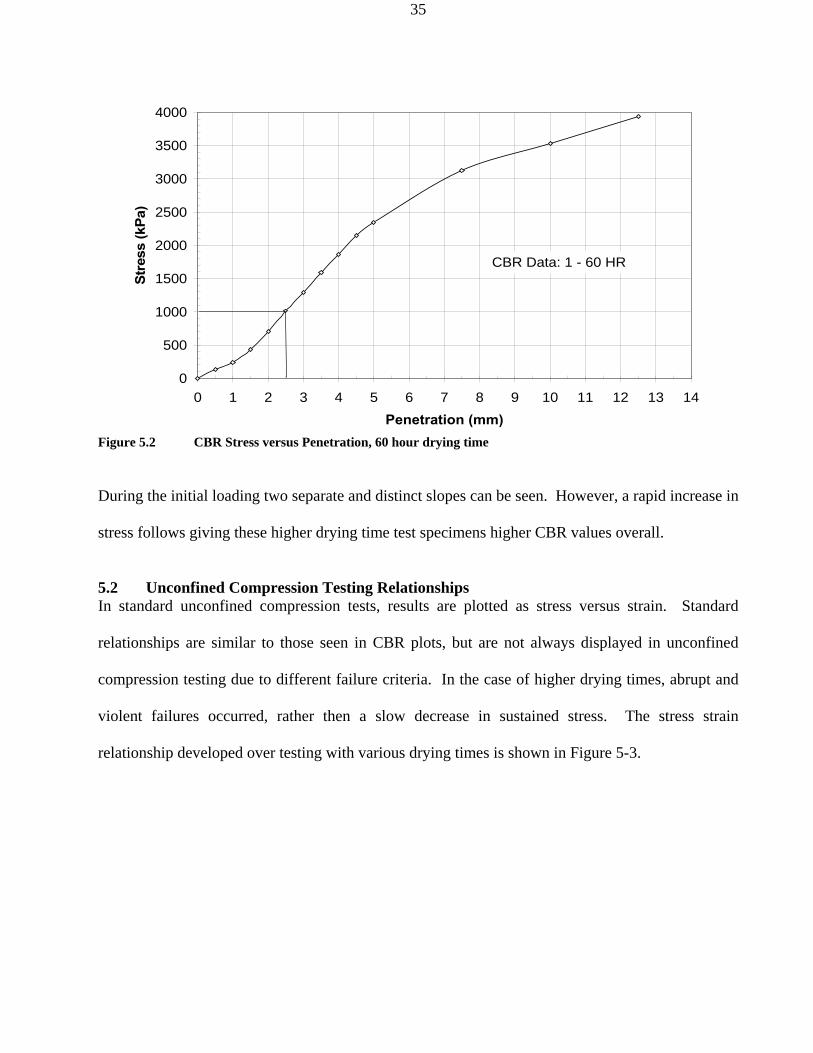
lower saturations, as shown in Figure 5-2.
0
500
1000
1500
2000
2500
3000
3500
4000
0 1 2 3 4 5 6 7 8 9 10 11 12 13 14Penetration (mm)
Stre
ss (k
Pa)
25 hr Drying Ti
35
Figure 5.2 CBR Stress versus Penetration, 60 hour drying time During the initial loading two separate and distinct slopes can be seen. However, a rapid increase in
stress follows giving these higher drying time test specimens higher CBR values overall.
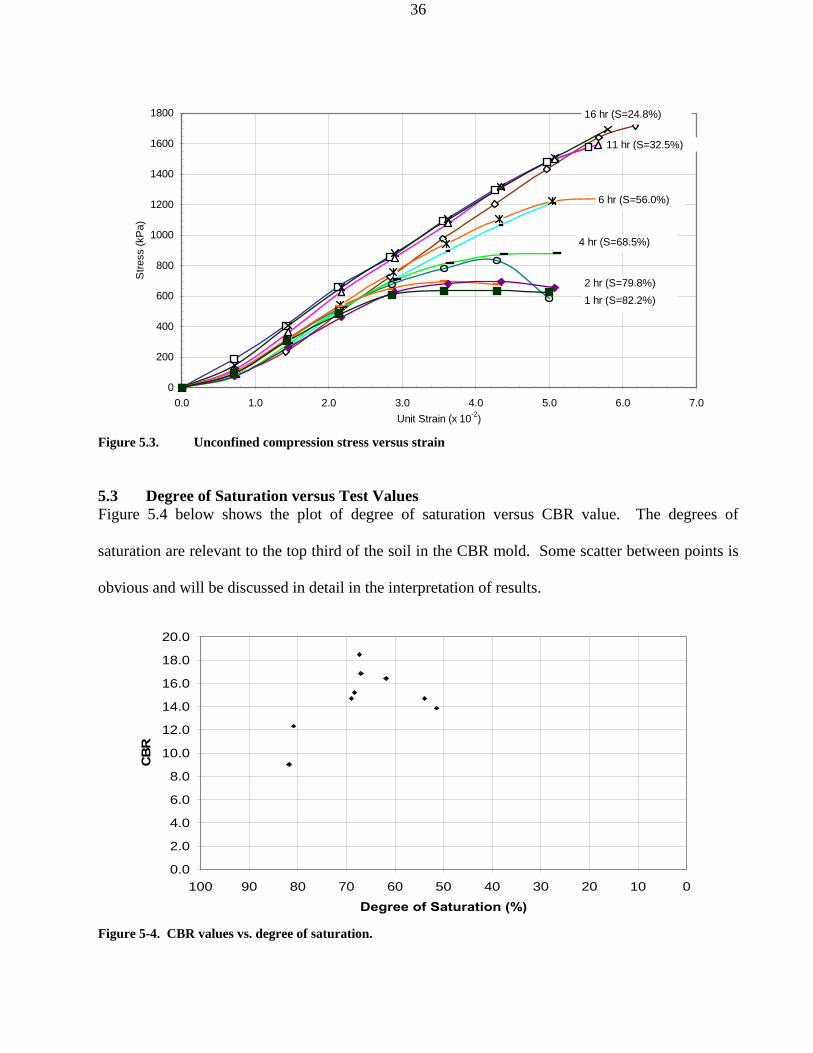
5.2 Unconfined Compression Testing Relationships In standard unconfined compression tests, results are plotted as stress versus strain. Standard
relationships are similar to those seen in CBR plots, but are not always displayed in unconfined
compression testing due to different failure criteria. In the case of higher drying times, abrupt and
violent failures occurred, rather then a slow decrease in sustained stress. The stress strain
relationship developed over testing with various drying times is shown in Figure 5-3.
CBR Data: 1 - 60 HR
0
500
1000
1500
2000
2500
3000
3500
4000
0 1 2 3 4 5 6 7 8 9 10 11 12 13 14Penetration (mm)
Stre
ss (k
Pa)
36
Figure 5.3. Unconfined compression stress versus strain 5.3 Degree of Saturation versus Test Values Figure 5.4 below shows the plot of degree of saturation versus CBR value. The degrees of
saturation are relevant to the top third of the soil in the CBR mold. Some scatter between points is
obvious and will be discussed in detail in the interpretation of results.
Figure 5-4. CBR values vs. degree of saturation.
0
200
400
600
800
1000
1200
1400
1600
1800
0.0 1.0 2.0 3.0 4.0 5.0 6.0 7.0Unit Strain (x 10-2)
Stre
ss (k
Pa)
16 hr (S=24.8%)
11 hr (S=32.5%)
6 hr (S=56.0%)
4 hr (S=68.5%)
2 hr (S=79.8%)1 hr (S=82.2%)
0.0
2.0
4.0
6.0
8.0
10.0
12.0
14.0
16.0
18.0
20.0
0102030405060708090100Degree of Saturation (%)
CB
R

37
Figure 5-5 shows a similar plot, comparing unconfined compression strength this time to the degree
of saturation.
Figure 5-5. Unconfined compression strength vs. degree of saturation.
The trend here is very good, showing a steady increase in strength as the saturation decreases. In
order to compare these results, one more step was taken.
0
200
400
600
800
1000
1200
1400
1600
1800
020406080100Degree of Saturation (%)
Stre
ngth
(kPa
)

38
CHAPTER 6: INTERPERTATION OF RESULTS
6.1 Unconfined Compression Tests Figure 5.3 shows the variation of axial stress with respect to axial strain from unconfined
compression tests. The results show a regular trend of increase in the shear strength of the soil
specimens with a decrease in the degree of saturation. The reduction in the degree of saturation is
associated with an increase in matric suction values. Similar to earlier studies by other
investigators, the experimental data suggests there is a non-linear increase in the shear strength of
unsaturated soils (Escario and Juca, 1989; Gan et. al.1988; Vanapalli et. al. 1996). Figure 6.1
shows the plot of unconfined compression strength versus the degree of saturation.
Figure 6.1. Normalized unconfined compression strength versus degree of saturation
Some scatter was observed particularly in the soil specimens with low degrees of saturation. (i.e.
high suction). Vanapalli et. al. 2000 reported similar observation from unconfined compression test
results undertaken on a silty soil for the entire suction range (i.e 0 to 1000000 kPa). The scatter at
lower degrees of saturation can be attributed to large change in suction values even with small
0.0
0.2
0.4
0.6
0.8
1.0
020406080100Degree of Saturation (%)
Nor
mal
ized
UC
S R
esul
ts

39
changes in water content values of the soil specimens. No scatter was observer in the results in the
specimens with higher degrees of saturation (i.e. 55 to 100%).
6.2 CBR Tests Figure 6.2 shows the relationship between CBR values and degree of saturation. The relationship
presented shows a rather weak trend, unlike those found in the unconfined compression testing. A
great deal of scatter was evident regardless of the degree of saturation, though there was a general
trend of strength increase with decreasing saturation.
Figure 6.2. Normalized CBR values versus degree of saturation
Several possible reasons for this scatter are provided as follows. Some shrinkage was observed in
the compacted soil specimen within the CBR moulds particularly for specimens at low degrees of
saturation. This shrinkage resulted in a few millimetres gap that was extending approximately 1 to 3
mm length along a part of the CBR mould perimeter. Due to this reason, there was as a reduction in
the lateral confining pressure at certain portions particularly at the top of the specimen in the CBR
mould during the loading. Also, there was a scatter in degree of saturation values within the CBR
0.0
0.2
0.4
0.6
0.8
1.0
020406080100% Saturation
Nor
mal
ized
Res
ults

40
mould along the length of the specimen. The scatter in the degree of saturation values may be
attributed to the larger size of CBR specimen and faster rate of drying. It is also likely the time
period used for achieving equilibration water content (or degree of saturation) by placing the dried
specimen in moisture control room for one week may not be sufficient due to the large size of the
specimen.
6.3 Comparison of Test Values Comparing the unconfined compression strength and CBR values showed a promising trend. As is
shown in Figure 6.3, the mean lines passing through the test points results in two parallel lines
which can easily be compared using a linear factor.
Figure 6.3. Comparison of normalized CBR and Unconfined compressive strength values
Relationships such as those given in Equations [3] and [4] have been presented to indirectly
estimate the Resilient Modulus from other testing procedures. Relationships similar to these
equations can be developed in terms of the unconfined compression strength, CBR Values and the
Resilient Modulus. Investigations are in progress to propose such relationships.
0
4
8
12
16
20
020406080100Degree of Saturation (%)
CBR
Res
ults
0
400
800
1200
1600
2000
UC
S R
esults (kPa).
CBRUCSBest fit line (UCS)Best fit line (CBR)

41

42
CHAPTER 7: SUMMARY AND CONCLUSIONS
Pavement design procedures are commonly based on CBR tests, R-values or resilient modulus (Mr)
values. More recently, the use of Mr values is widely accepted in the design of pavements.
However, determination of Mr value is time consuming and needs extensive testing procedures. Due
to this reason, this is an expensive technique.
The influence of one of key parameters, soil suction, is not taken into consideration in the
determination of Mr values. In this paper, a modified test procedure is proposed to interpret the
California Bearing Ratio (CBR) test results taking into account the influence of unsaturated
conditions in terms of degree of saturation. Along similar lines, unconfined compression strengths
were also determined on unsaturated soil specimens. The test results show similar trends of CBR
tests and unconfined compression test results. This behaviour is consistent with the non-linear
variation of shear strength with respect to suction. These results are encouraging as they not only
provide a valid frame work to understand the influence of soil suction on the engineering behaviour
of pavements; but also are helpful to develop simple relationships to estimate Mr values from
conventional unconfined compression tests.
43
REFERENCES Alonso E.E., Canete A., Olivella S., Moisture transfer and deformation behavior of pavements:
effect of climate, material and drainage. 3rd International Conference on Unsaturated Soils, Brazil, 2002, pp. 671-677
Barbour, S.L., Fredlund, D.G., Gan, J.K-M., and Wilson, G.W. 1992. Prediction of moisture
movement in highway subgrade soils. Proceedings, 45th Canadian Geotechnical Conference, Toronto, pp. 41A-1 to 41A-13.
Barksdale, R.D., Alba, J., Hosier, N.P., Kim,R., Lambe, P.C., Rahman, M.S. Laboratory
determination of resilient modulus for flexible pavement design, Final report, 1997, NCHRP Web Document 14.
Bender, D.A., and Barenberg, E.J. 1978. Design and behaviour of soil-fabric-aggregate systems.
Transportation Research Board, Washington, Transportation Research Record No. 671, pp. 64-75.
Berg, R.L., Bigl, S.R., Stark, J.A., Durell, G.D. Resilient Modulus Testing of Material from
Mn/Road, Phase 1, 1996, CRREL, Special Report 96-19 Broms, B.B. 1963. The bearing capacity of pavements subjected frost action. Highway Research
Board, No. 39, pp. 66-180 Cameron. D.A., Phillip A.W., The influence of soil suction on the resilient modulus of expansive
soil subgrades, 1st International Conference on Unsaturated Soils, Paris, 1995, pp. 171-176 Drumm, E.C., Rainwater, N.R., Andrew, J., Jackson, N.M., Yoder, R.E., Wilson, G.V. Pavement
response due to seasonal changes in subgrade moisture conditions. 2nd International Conference on Unsaturated Soils, Beijing, 1998, pp. 196-201
Escario, V. and J.F.T. Juca (1989). “Strength and Deformation of Partly Saturated Soils”,
Proceedings of the Twelfth International Conference On Soil Mechanics and Foundation Engineering, Vol. 2, pp. 43-46.
Fredlund, D.G. and N.R. Morgenstern and R.A. Widger (1978) “Shear Strength of Unsaturated
Soils”, Canadian Geotechnical Journal, Vol. 15, No. 3, pp. 313-321. Fredlund, D.G., and Rahardjo, H. 1994, Soil mechanics for unsaturated soils. Wiley Fredlund, D.G., Oloo S.Y., Gan J. Bearing capacity of unpaved roads. Canadian Geotechnical
Journal, Volume 34, 1997, pp 398-407 Fredlund, D.G., Oloo S.Y.. Matric suction monitoring in an expansive soil subgrade in Kenya. 1st
International Conference on Unsaturated Soils, Paris, 1995, pp. 631-636

44
Fry, J.J. 1977. Contribution a l'etude et a la pratique du compactage, Ph.D. thesis, Ecole Centrale de Paris, France.
Gan, J.K.M, D.G. Fredlund and H. Rahardjo (1988). “Determination of the Shear Strength
Parameters of an Unsaturated Soil Using the Direct Shear Test”, Canadian Geotechnical Journal, Vol. 25, pp. 500-510.
Garber, G.J., and Hoel, L.A. 1997, Traffic and Highway Engineering, Second Edition, PWS Giroud, J.P., and Noiray, L, 1981. Geotextiles-reinforced unpaved road design. Journal of the
Geotechnical Engineering Division, ASCE, 107 (GT9): 1233-1254. Heydinger A.G., Randolph B.W., Investigation of an unsaturated, fine-grained pavement subgrade
soil. 2nd International Conference on Unsaturated Soils, Beijing, 1998, pp208-212 Hillel D (1971). Soil and Water Physical Principles and Processes. 1st edition, Department of Soil
Science, The Hebrew University of Jerusalem, Israel Houston. Sandra, L, Foundations on unsaturated soils-Part one Collapsible soils, 1st International
Conference on Unsaturated Soils, Paris, 1995, pp.1421-1439 Hveem F.N., Sherman G.B., 1963. Thickness of Flexible Pavements by the California Formula
Compared to AASHTO Road Test Data, Proceedings Highway Research Board. Janoo, V.C., Bayer, J.J.Jr., Durell, G.D., Smith C.E.Jr. Resilient Modulus for New Hampshire
Subgrade Soil for Use in Mechanistic AASHTO Design, 1999, US Army Corps of Engineers, Special Report 99-14
Jimenez-Salas J.A., Foundations on unsaturated soils-Part two Expansive clays, 1st International
Conference on Unsaturated Soils, Paris, 1995, pp. 1441-1463 Joshi, B. 1993. A finite element model for the coupled flow of moisture and heat in soils. M.Sc.
thesis, University of Saskatchewan, Saskatoon. Kato, S., Kawai, K., Yoshimura, Y., Sunden, W. Effects of suction on unconfined compressive
strength and undrained shear strength of a compacted silty clay, 3rd International Conference on Unsaturated Soils, Brazil, 2002, pp. 513-519
Lytton, R.L., Pufahl, D.E., Michalak, C.H., Liang, H.S., and Dempsey, B.J., 1990. An integrated
model of the climatic effects on pavements. Texas Transportation Institute, Texas A&M University, Final Report No. RF 7089
Lytton, Robert, L., Foundations and pavement on unsaturated soils, 1st International Conference on
Unsaturated Soils, Paris, 1995, pp. 1201-1220 McLeod, N.W. 1953. Some basic problems in flexible pavement design. Proceedings, Highway
Research Board, No. 32, pp.90-109.

45
Milligan, G.W.E., Jewell, R.A., Houlsby, G.T., and Burd, H.J. 1989. A new approach to the design
of unpaved roads. Part 1. Ground Engineering, 22(3): 25-29 Park, S-W. Lytton, R.L., Button, J.W. Innovative site investigation procedures for characterizing
pavement subgrades. 2nd International Conference on Unsaturated Soils, Beijing, 1998, pp. 266-271
PCA. 1984. Design thickness for concrete highway and street pavements. Portland Cement Association.
Ping, V.W. Implementation of the Resilient Modulus in the State of Florida Flexible Pavement
Design Procedure, 2001 Richards B.G. and Chan C.Y. (1971). Theoretical analyses of subgrade moisture under Australian
environmental conditions and their particle applications Australia Road Res.. 4 (6), pp 32-49.
Richards B.G. and Peter P. (1987). Measurements of negative pore pressure or soil water suction.
Geotechnical Field Instrumentation. Australia Geomechanics Society, Melbourne. Russam, K. 1965. The prediction of subgrade moisture conditioned for design purposes. In moisture
equilibria and moisture changes in soil beneath covered area. Butter worth, Sydney, Australia, pp. 233-236.
Russell, H.S., Hossain, M. Design Resilient Modulus of Subgrade Soils from FWD Tests, 1997,
Kansas Department of Transportation. Sattler, P., Fredlund, D.G., Klassen, M.J., Jubien, W.B., and Rowam, W.G. 1989. Bearing capacity
approach to railway design, utilizing subgrade matric suction. Transportation Research Board, Transportation Research Record No.1241, pp.27-33
Subbarao, C. 1972. Compactage et mecanique des milieaux continues. Ph.D. thesis, Grennoble
University, France. Szafron, B.J. 1991. The influence of soil suction on bearing capacity failures of low volume roads.
M.Sc thesis, University of Saskatchewan, Saskatoon. Tanyu, B.F., Kim, W.H., Edil, T.B., and C.H. Benson, 2003. Comparison of laboratory resilient
modulus with back-calculated elastic moduli from large-scale model experiments and FWD tests on granular materials, Resilient Modulus Testing for Pavement Components, ASTM STP 1437, editors Durham et al.; American Society for Testing and Materials, West Conshohocken, PA.
Vanapalli, S.K., Fredlund, D. G., Pufahl, D. E. and Clifton, A. W., 1996. Model for the prediction
of shear strength with respect to soil suction. Canadian Geotechnical Journal, Vol. 33, No. 3, pp. 379-392.
46
Vanapalli, S.K., Pufahl, D.E. and Fredlund, D.G., 1999. Interpretation of the shear strength of
unsaturated soils in undrained loading conditions. 52nd Canadian Geotechnical Conference, Regina, October 25-27, 1999, pp. 643-650.
Vanapalli, S.K., Wright, A., and Fredlund, D.G., 2000. Shear strength of an unsaturated silty soil
over the suction range from 0 to 1,000,000 kPa. 53rd Canadian Geotechnical Conference, Montreal, October 15-18, 2000, pp. 1161-1168.
Wallace, K.B. 1977. Moisture transient at the pavement edge; analytical studies of the influence of
materials and cross-section design. Geotechnique, 27(4): 497-516 Wilson, G.W. 1990. Soil evaporative fluxes for geotechnical engineering. Ph.D. thesis, University
of Saskatchewan, Saskatoon. Wilson, G.W., Fredlund, D.G., Barbour, S.L., Pufahl, D.E. 1997. The use of ground surface flux
boundary conditions in geotechnical engineering. 14th International Conference on Soil Mechanics and Foundation Engineering, Hamburg, Germany
Zeghal, M. Effects of particle shapes on the resilient behaviour of aggregate materials, Canadian
Society for Civil Engineering Annual Conference, Victoria, 2001, pp. 1-5
47
APPENDIX A
CBR TESTING DATA

48
CBR Test Data
4 HR Drying 8 HR Drying
Mold (g) Soil+Mold (g) Vol. Mold (cm3) Mold (g) Soil+Mold (g) Vol. Mold (cm3)
4399 9164 2317 4301 9208 2317 ρwet Top 1/3, Wet (g) Top 1/3, Dry (g) ρwet Top 1/3, Wet (g) Top 1/3, Dry (g) 2.06 64 55.3 2.12 84.3 74.4 w% ρdry γdry W% ρdry γdry
15.73 1.78 17.43 13.31 1.87 18.34 e %S w% ave e %S w% ave
0.52 81.79 16.20 0.44 80.81 14.98
Penetration (mm)
Piston Load Dial Reading Stress (kPa)
Penetration
(mm) Piston Load Dial Reading Stress (kPa)
0 0.0 0 0 0.0 0 0.5 25.0 177 0.5 39.0 276 1 47.0 333 1 66.0 467
1.5 64.5 457 1.5 89.0 630 2 77.5 549 2 105.0 743
2.5 88.0 623 2.5 120.0 850 3 100.0 708 3 132.0 935
3.5 109.0 772 3.5 143.5 1016 4 115.0 814 4 153.5 1087
4.5 121.0 857 4.5 163.0 1154 5 127.0 899 5 171.0 1211
7.5 151.0 1069 7.5 205.0 1451 10 169.0 1197 10 231.0 1635
12.5 183.0 1296 12.5 252.0 1784 CBR VALUE
[email protected]/Standard Resistance
CBR VALUE
[email protected]/Standard Resistance
623/6900 850/6900 9.03 12.32
Stress@5mm/Standard Resistance
Stress@5mm/Standard Resistance
899/10300 1211/10300 8.73 11.76

49
16 HR Drying 17.5 HR Drying
Mold (g) Soil+Mold (g) Vol. Mold (cm3) Mold (g) Soil+Mold (g) Vol. Mold (cm3)
4399 9172 2317 4351 9094 2317 ρwet Top 1/3, Wet (g) Top 1/3, Dry (g) ρwet Top 1/3, Wet (g) Top 1/3, Dry (g) 2.06 86.3 77.1 2.05 62 55.3 w% ρdry γdry w% ρdry γdry
11.93 1.84 18.05 12.12 1.83 17.91 e %S w% ave e %S w% ave
0.47 68.98 14.29 0.48 68.33 14.06
Penetration (mm)
Piston Load Dial Reading Stress (kPa)
Penetration
(mm) Piston Load Dial Reading Stress (kPa)
0 0.0 0 0 0.0 0 0.5 36.0 255 0.5 36.5 258 1 70.0 496 1 69.0 489
1.5 96.0 680 1.5 101.0 715 2 121.0 857 2 126.0 892
2.5 143.0 1012 2.5 148.0 1048 3 162.0 1147 3 163.0 1154
3.5 178.0 1260 3.5 180.0 1274 4 190.0 1345 4 194.0 1374
4.5 204.0 1444 4.5 210.0 1487 5 216.0 1529 5 220.0 1558
7.5 255.0 1805 7.5 264.0 1869 10 283.0 2004 10 291.0 2060
12.5 300.0 2124 12.5 313.0 2216 CBR VALUE
[email protected]/Standard Resistance
CBR VALUE
[email protected]/Standard Resistance
1012/6900 1048/6900 14.67 15.19
Stress@5mm/Standard Resistance
Stress@5mm/Standard Resistance
1529/10300 1558/10300 14.84 15.13

50
25 HR Drying 26 HR Drying
Mold (g) Soil+Mold (g) Vol. Mold (cm3) Mold (g) Soil+Mold (g) Vol. Mold (cm3)
4567 9293 2317 4399 9146 2317 ρwet Top 1/3, Wet (g) Top 1/3, Dry (g) ρwet Top 1/3, Wet (g) Top 1/3, Dry (g) 2.04 93 83 2.05 59.1 52.9 w% ρdry γdry w% ρdry γdry
12.05 1.82 17.86 11.72 1.83 17.99 e %S w% ave e %S w% ave
0.48 67.31 14.07 0.47 67.02 15.30
Penetration (mm)
Piston Load Dial Reading Stress (kPa)
Penetration
(mm) Piston Load Dial Reading Stress (kPa)
0 0.0 0 0 0.0 0 0.5 47.0 333 0.5 54.0 382 1 87.0 616 1 92.0 651
1.5 127.0 899 1.5 120.0 850 2 155.0 1097 2 144.0 1020
2.5 180.0 1274 2.5 164.0 1161 3 200.0 1416 3 183.0 1296
3.5 219.0 1551 3.5 199.0 1409 4 235.0 1664 4 214.0 1515
4.5 252.0 1784 4.5 230.0 1628 5 264.0 1869 5 242.0 1713
7.5 312.0 2209 7.5 289.0 2046 10 340.0 2407 10 319.0 2259
12.5 366.0 2591 12.5 335.0 2372 CBR VALUE
[email protected]/Standard Resistance
CBR VALUE
[email protected]/Standard Resistance
1274/6900 1161/6900 18.46 16.83
Stress@5mm/Standard Resistance
Stress@5mm/Standard Resistance
1869/10300 1713/10300 18.15 16.63

51
48 HR Drying 1 - 60 HR Drying
Mold (g) Soil+Mold (g) Vol. Mold (cm3) Mold (g) Soil+Mold (g) Vol. Mold (cm3)
4298 9113 2317 4531 9141 2317 ρwet Top 1/3, Wet (g) Top 1/3, Dry (g) ρwet Top 1/3, Wet (g) Top 1/3, Dry (g) 2.08 63 57.4 1.99 68.5 62.4 w% ρdry γdry w% ρdry γdry 9.76 1.89 18.57 9.78 1.81 17.78
e %S w% ave e %S w% ave 0.43 61.81 12.86 0.49 53.90 13.31
Penetration
(mm) Piston Load Dial Reading Stress (kPa)
Penetration
(mm) Piston Load Dial Reading Stress (kPa)
0 0.0 0 0 0.0 0 0.5 28.0 198 0.5 18.5 131 1 60.0 425 1 34.0 241
1.5 93.0 658 1.5 61.0 432 2 129.0 913 2 99.5 704
2.5 160.0 1133 2.5 143.0 1012 3 189.0 1338 3 183.0 1296
3.5 217.0 1536 3.5 224.0 1586 4 240.0 1699 4 263.5 1866
4.5 259.0 1834 4.5 303.0 2145 5 278.0 1968 5 332.0 2351
7.5 339.0 2400 7.5 441.0 3122 10 389.0 2754 10 498.0 3526
12.5 427.0 3023 12.5 555.5 3933 CBR VALUE
[email protected]/Standard Resistance
CBR VALUE
[email protected]/Standard Resistance
1133/6900 1012/6900 16.42 14.67
Stress@5mm/Standard Resistance
Stress@5mm/Standard Resistance
1968/10300 2351/10300 19.11 22.83
52
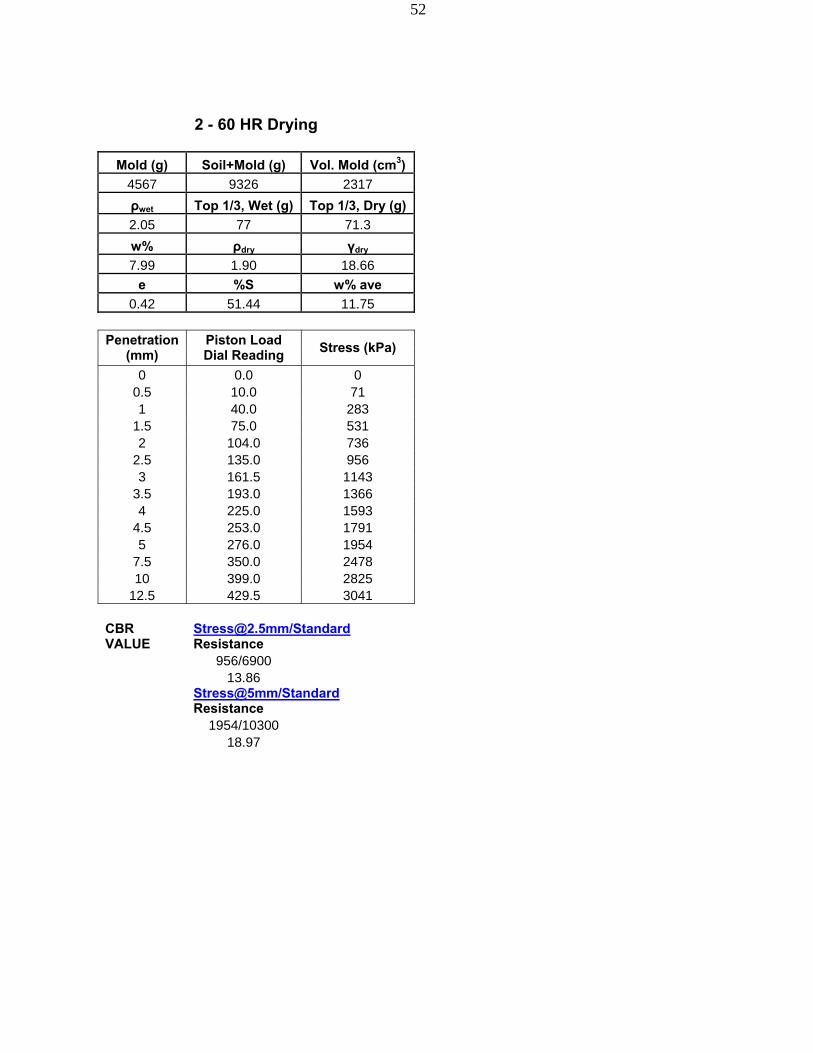
2 - 60 HR Drying
Mold (g) Soil+Mold (g) Vol. Mold (cm3)
4567 9326 2317 ρwet Top 1/3, Wet (g) Top 1/3, Dry (g) 2.05 77 71.3 w% ρdry γdry 7.99 1.90 18.66
e %S w% ave 0.42 51.44 11.75
Penetration
(mm) Piston Load Dial Reading Stress (kPa)
0 0.0 0
0.5 10.0 71 1 40.0 283
1.5 75.0 531 2 104.0 736
2.5 135.0 956 3 161.5 1143
3.5 193.0 1366 4 225.0 1593
4.5 253.0 1791 5 276.0 1954
7.5 350.0 2478 10 399.0 2825
12.5 429.5 3041 CBR VALUE
[email protected]/Standard Resistance
956/6900 13.86
Stress@5mm/Standard Resistance
1954/10300 18.97

53
Final CBR Results
CBR 5 CBR 2.5/CBR
2.50 CBR 5/CBR
50 e θw 1/3 w%
2/3 w%
8.73 0.49 0.38 0.5193 0.2796 15.7 16.2 11.76 0.67 0.52 0.4446 0.2487 13.3 15.0 14.84 0.79 0.65 0.4671 0.2196 11.9 14.3 15.13 0.82 0.66 0.4787 0.2212 12.1 14.1 18.15 1.00 0.80 0.4833 0.2193 12.1 14.1 16.63 0.91 0.73 0.4722 0.2150 11.7 15.3 19.11 0.89 0.84 0.4262 0.1847 9.8 12.9 22.83 0.79 1.00 0.4897 0.1772 9.8 13.3 18.97 0.75 0.83 0.4196 0.1519 8.0 11.8

54
APPENDIX B
UNCONFINED COMPRESSION TESTING DATA

55
1 HR DRYING: Sample 1
Load Ring Constant (kN/div) 0.00136 Length, Lo
(mm) 70 Diameter (mm) 33
Area, Ao
(cm2) 8.55
Volume (cm3) 59.9 Mass (g) 128.2 15%
Strain (mm)
10.50 L/d Ratio 2.1
Deformation Dial
Reading Load Dial
Reading
Sample Deformation
Unit Strain Area CF Corrected
Area Total Load (kN)
Sample Stress (kPa)
0 0 0.0 0.0000 1.000 8.55 0.0000 0.0 50 60 0.5 0.7143 0.993 8.61 0.0816 94.7
100 195 1.0 1.4286 0.986 8.68 0.2652 305.6 150 310 1.5 2.1429 0.979 8.74 0.4216 482.4 200 394 2.0 2.8571 0.971 8.80 0.5358 608.6 250 414 2.5 3.5714 0.964 8.87 0.5630 634.8 300 419 3.0 4.2857 0.957 8.94 0.5698 637.7 350 415 3.5 5.0000 0.950 9.00 0.5644 626.9
Wet Mass (g) 125.20 Dry Mass (g) 110.90
Mass Water (g) 14.30 Water Content 12.89 Wet Density 2.14 Dry Density 1.90
Dry Unit Weight 18.61 Void Ratio 0.42
Degree of Saturation (%S) 82.2
56
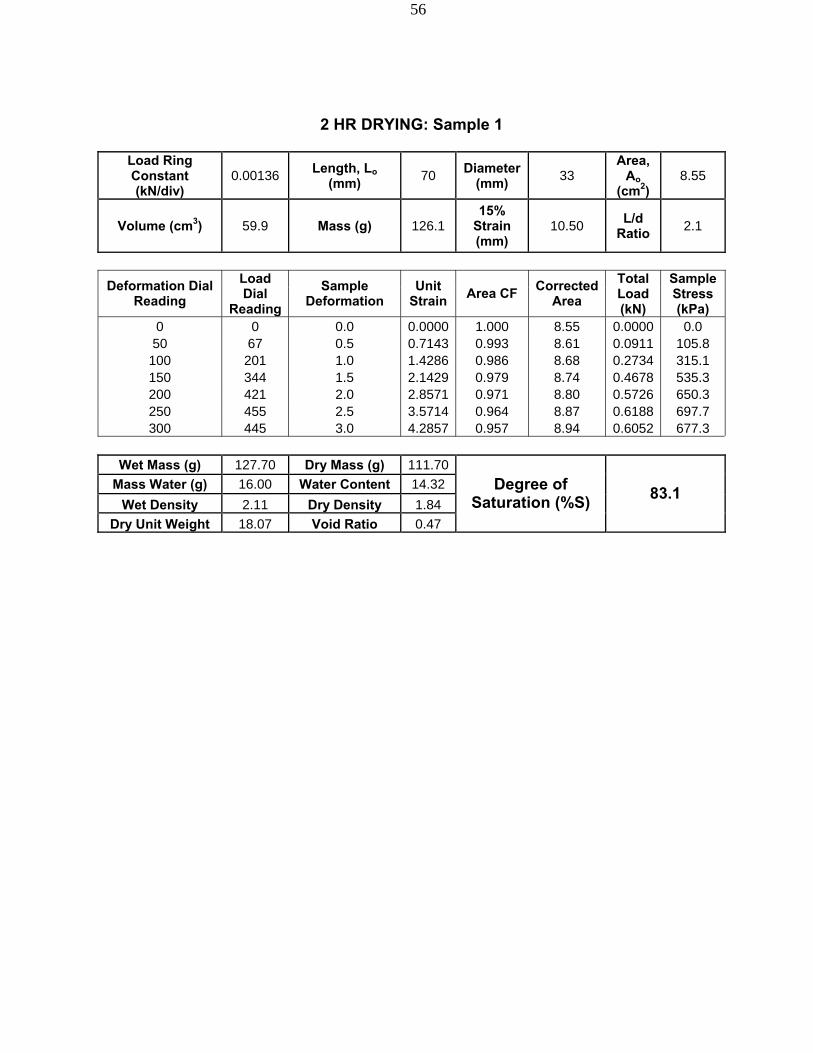
2 HR DRYING: Sample 1
Load Ring Constant (kN/div)
0.00136 Length, Lo (mm) 70 Diameter
(mm) 33 Area,
Ao (cm2)
8.55
Volume (cm3) 59.9 Mass (g) 126.1 15%
Strain (mm)
10.50 L/d Ratio 2.1
Deformation Dial Reading
Load Dial
Reading
Sample Deformation
Unit Strain Area CF Corrected
Area Total Load (kN)
Sample Stress (kPa)
0 0 0.0 0.0000 1.000 8.55 0.0000 0.0 50 67 0.5 0.7143 0.993 8.61 0.0911 105.8
100 201 1.0 1.4286 0.986 8.68 0.2734 315.1 150 344 1.5 2.1429 0.979 8.74 0.4678 535.3 200 421 2.0 2.8571 0.971 8.80 0.5726 650.3 250 455 2.5 3.5714 0.964 8.87 0.6188 697.7 300 445 3.0 4.2857 0.957 8.94 0.6052 677.3
Wet Mass (g) 127.70 Dry Mass (g) 111.70
Mass Water (g) 16.00 Water Content 14.32 Wet Density 2.11 Dry Density 1.84
Dry Unit Weight 18.07 Void Ratio 0.47
Degree of Saturation (%S) 83.1

57
2 HR DRYING: Sample 2
Load Ring Constant (kN/div)
0.00136 Length, Lo (mm) 69 Diameter
(mm) 33 Area,
Ao (cm2)
8.55
Volume (cm3) 59.0 Mass (g) 124.4 15%
Strain (mm)
10.35 L/d Ratio 2.1
Deformation Dial Reading
Load Dial
Reading
Sample Deformation
Unit Strain Area CF Corrected
Area Total Load (kN)
Sample Stress (kPa)
0 0 0.0 0.0000 1.000 8.55 0.0000 0.0 50 49 0.5 0.7246 0.993 8.62 0.0666 77.4
100 167 1.0 1.4493 0.986 8.68 0.2271 261.7 150 297 1.5 2.1739 0.978 8.74 0.4039 462.0 200 405 2.0 2.8986 0.971 8.81 0.5508 625.3 250 445 2.5 3.6232 0.964 8.87 0.6052 682.0 300 457 3.0 4.3478 0.957 8.94 0.6215 695.1 350 435 3.5 5.0725 0.949 9.01 0.5916 656.6
Wet Mass (g) 123.80 Dry Mass (g) 109.20
Mass Water (g) 14.60 Water Content 13.37 Wet Density 2.11 Dry Density 1.86
Dry Unit Weight 18.24 Void Ratio 0.45
Degree of Saturation (%S) 79.8

58
4 HR DRYING: Sample 1
Load Ring Constant (kN/div) 0.00136 Length, Lo
(mm) 70 Diameter (mm) 33
Area, Ao
(cm2) 8.55
Volume (cm3) 59.9 Mass (g) 124.3 15%
Strain (mm)
10.50 L/d Ratio 2.1
Deformation Dial Reading
Load Dial
Reading
Sample Deformation
Unit Strain Area CF Corrected
Area Total Load (kN)
Sample Stress (kPa)
0 0 0.0 0.0000 1.000 8.55 0.0000 0.0 50 60 0.5 0.7143 0.993 8.61 0.0816 94.7 100 201 1.0 1.4286 0.986 8.68 0.2734 315.1 150 334 1.5 2.1429 0.979 8.74 0.4542 519.7 200 438 2.0 2.8571 0.971 8.80 0.5957 676.6 250 510 2.5 3.5714 0.964 8.87 0.6936 782.0 300 548 3.0 4.2857 0.957 8.94 0.7453 834.0 350 390 3.5 5.0000 0.950 9.00 0.5304 589.1
Wet Mass (g) 121.10 Dry Mass (g) 109.10
Mass Water (g) 12.00 Water Content 11.00 Wet Density 2.08 Dry Density 1.87
Dry Unit Weight 18.35 Void Ratio 0.44
Degree of Saturation (%S) 67.0
59
4 HR DRYING: Sample 2
Load Ring Constant (kN/div) 0.00136 Length, Lo
(mm) 68.5 Diameter (mm) 33
Area, Ao
(cm2) 8.55
Volume (cm3) 58.6 Mass (g) 122.1 15%
Strain (mm)
10.28 L/d Ratio 2.1
Deformation Dial Reading
Load Dial
Reading
Sample Deformation
Unit Strain Area CF Corrected
Area Total Load (kN)
Sample Stress (kPa)
0 0 0.0 0.0000 1.000 8.55 0.0000 0.0 50 46 0.5 0.7299 0.993 8.62 0.0626 72.6 100 187 1.0 1.4599 0.985 8.68 0.2543 293.0 150 339 1.5 2.1898 0.978 8.74 0.4610 527.3 200 460 2.0 2.9197 0.971 8.81 0.6256 710.1 250 535 2.5 3.6496 0.964 8.88 0.7276 819.7 300 575 3.0 4.3796 0.956 8.94 0.7820 874.3 350 586 3.5 5.1095 0.949 9.01 0.7970 884.2
Wet Mass (g) 121.40 Dry Mass (g) 109.20
Mass Water (g) 12.20 Water Content 11.17 Wet Density 2.08 Dry Density 1.87
Dry Unit Weight 18.39 Void Ratio 0.44
Degree of Saturation (%S) 68.5
60
6 HR DRYING: Sample 1
Load Ring Constant (kN/div) 0.00136 Length, Lo
(mm) 69.5 Diameter (mm) 33
Area, Ao
(cm2) 8.55
Volume (cm3) 59.4 Mass (g) 122.3 15%
Strain (mm)
10.43 L/d Ratio 2.1
Deformation Dial Reading
Load Dial
Reading
Sample Deformation
Unit Strain Area CF Corrected
Area Total Load (kN)
Sample Stress (kPa)
0 0 0.0 0.0000 1.000 8.55 0.0000 0.0 50 59 0.5 0.7194 0.993 8.61 0.0802 93.1 100 199 1.0 1.4388 0.986 8.68 0.2706 311.9 150 350 1.5 2.1583 0.978 8.74 0.4760 544.5 200 491 2.0 2.8777 0.971 8.81 0.6678 758.3 250 616 2.5 3.5971 0.964 8.87 0.8378 944.3 300 728 3.0 4.3165 0.957 8.94 0.9901 1107.6 350 809 3.5 5.0360 0.950 9.01 1.1002 1221.6 400 826 4.0 5.7554 0.942 9.08 1.1234 1237.9
Wet Mass (g) 116.80 Dry Mass (g) 107.50
Mass Water (g) 9.30 Water Content 8.65 Wet Density 2.06 Dry Density 1.89
Dry Unit Weight 18.58 Void Ratio 0.43
Degree of Saturation (%S) 54.9
61
6 HR DRYING: Sample 2
Load Ring Constant (kN/div) 0.00136 Length, Lo
(mm) 69 Diameter (mm) 33
Area, Ao
(cm2) 8.55
Volume (cm3) 59.0 Mass (g) 122.3 15%
Strain (mm)
10.35 L/d Ratio 2.1
Deformation Dial Reading
Load Dial
Reading
Sample Deformation
Unit Strain Area CF Corrected
Area Total Load (kN)
Sample Stress (kPa)
0 0 0.0 0.0000 1.000 8.55 0.0000 0.0 50 50 0.5 0.7194 0.993 8.61 0.0680 78.9 100 170 1.0 1.4388 0.986 8.68 0.2312 266.4 150 330 1.5 2.1583 0.978 8.74 0.4488 513.4 200 459 2.0 2.8777 0.971 8.81 0.6242 708.9 250 584 2.5 3.5971 0.964 8.87 0.7942 895.2 300 701 3.0 4.3165 0.957 8.94 0.9534 1066.6 350 803 3.5 5.0360 0.950 9.01 1.0921 1212.6
Wet Mass (g) 112.30 Dry Mass (g) 103.40
Mass Water (g) 8.90 Water Content 8.61 Wet Density 2.07 Dry Density 1.91
Dry Unit Weight 18.72 Void Ratio 0.41
Degree of Saturation (%S) 56.0

62
11 HR DRYING: Sample 1
Load Ring Constant (kN/div) 0.00136 Length, Lo
(mm) 69 Diameter (mm) 33
Area, Ao
(cm2) 8.55
Volume (cm3) 59.0 Mass (g) 117.6 15%
Strain (mm)
10.35 L/d Ratio 2.1
Deformation Dial Reading
Load Dial
Reading
Sample Deformation
Unit Strain Area CF Corrected
Area Total Load (kN)
Sample Stress (kPa)
0 0 0.0 0.0000 1.000 8.55 0.0000 0.0 50 74 0.5 0.7246 0.993 8.62 0.1006 116.8
100 232 1.0 1.4493 0.986 8.68 0.3155 363.6 150 405 1.5 2.1739 0.978 8.74 0.5508 630.0 200 553 2.0 2.8986 0.971 8.81 0.7521 853.9 250 705 2.5 3.6232 0.964 8.87 0.9588 1080.4 300 868 3.0 4.3478 0.957 8.94 1.1805 1320.2 350 993 3.5 5.0725 0.949 9.01 1.3505 1498.9 391 1063 3.9 5.6667 0.943 9.07 1.4457 1594.5
Wet Mass (g) 107.00 Dry Mass (g) 101.50
Mass Water (g) 5.50 Water Content 5.42 Wet Density 1.99 Dry Density 1.89
Dry Unit Weight 18.54 Void Ratio 0.43
Degree of Saturation (%S) 34.2
63
11 HR DRYING: Sample 2
Load Ring Constant (kN/div) 0.00136 Length, Lo
(mm) 70 Diameter (mm) 33
Area, Ao
(cm2) 8.55
Volume (cm3) 59.9 Mass (g) 117.6 15%
Strain (mm)
10.50 L/d Ratio 2.1
Deformation Dial Reading
Load Dial
Reading
Sample Deformation
Unit Strain Area CF Corrected
Area Total Load (kN)
Sample Stress (kPa)
0 0 0.0 0.0000 1.000 8.55 0.0000 0.0 50 94 0.5 0.7246 0.993 8.62 0.1278 148.4
100 261 1.0 1.4493 0.986 8.68 0.3550 409.0 150 424 1.5 2.1739 0.978 8.74 0.5766 659.6 200 572 2.0 2.8986 0.971 8.81 0.7779 883.2 250 721 2.5 3.6232 0.964 8.87 0.9806 1104.9 300 864 3.0 4.3478 0.957 8.94 1.1750 1314.1 350 1000 3.5 5.0725 0.949 9.01 1.3600 1509.5 400 1130 4.0 5.7971 0.942 9.08 1.5368 1692.7
Wet Mass (g) 109.40 Dry Mass (g) 103.80
Mass Water (g) 5.60 Water Content 5.39 Wet Density 1.96 Dry Density 1.86
Dry Unit Weight 18.28 Void Ratio 0.45
Degree of Saturation (%S) 32.5
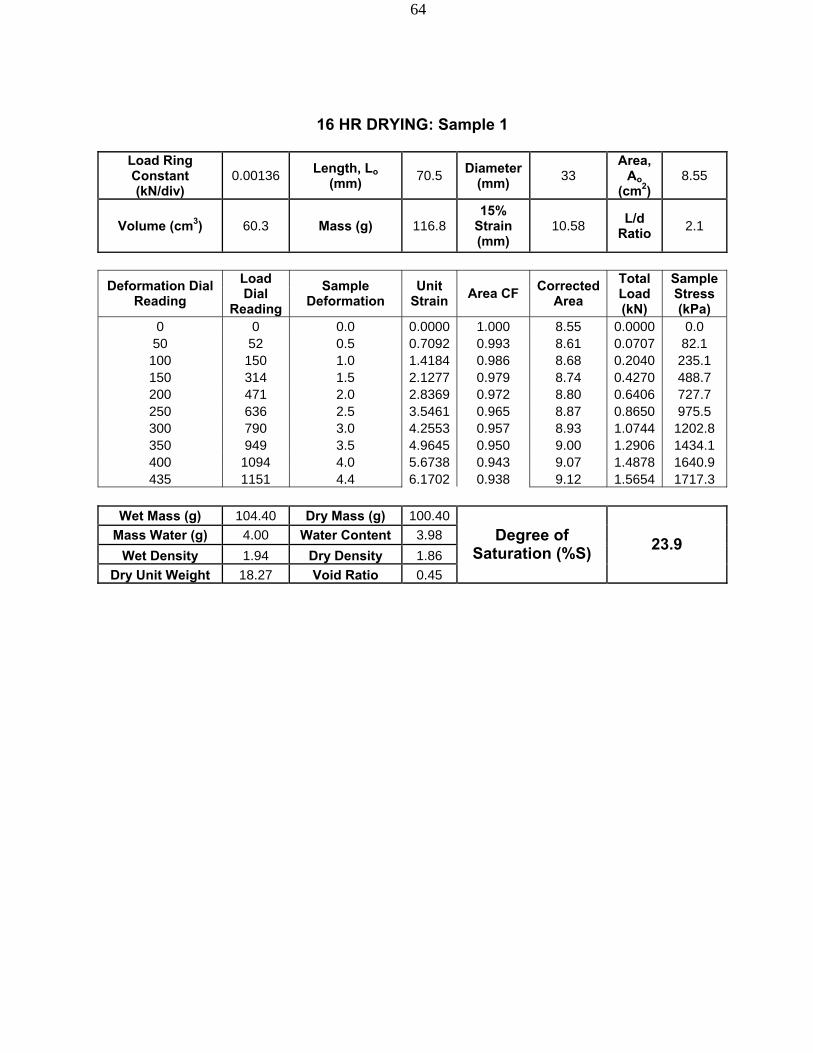
64
16 HR DRYING: Sample 1
Load Ring Constant (kN/div)
0.00136 Length, Lo (mm) 70.5 Diameter
(mm) 33 Area,
Ao (cm2)
8.55
Volume (cm3) 60.3 Mass (g) 116.8 15%
Strain (mm)
10.58 L/d Ratio 2.1
Deformation Dial Reading
Load Dial
Reading
Sample Deformation
Unit Strain Area CF Corrected
Area Total Load (kN)
Sample Stress (kPa)
0 0 0.0 0.0000 1.000 8.55 0.0000 0.0 50 52 0.5 0.7092 0.993 8.61 0.0707 82.1 100 150 1.0 1.4184 0.986 8.68 0.2040 235.1 150 314 1.5 2.1277 0.979 8.74 0.4270 488.7 200 471 2.0 2.8369 0.972 8.80 0.6406 727.7 250 636 2.5 3.5461 0.965 8.87 0.8650 975.5 300 790 3.0 4.2553 0.957 8.93 1.0744 1202.8 350 949 3.5 4.9645 0.950 9.00 1.2906 1434.1 400 1094 4.0 5.6738 0.943 9.07 1.4878 1640.9 435 1151 4.4 6.1702 0.938 9.12 1.5654 1717.3
Wet Mass (g) 104.40 Dry Mass (g) 100.40
Mass Water (g) 4.00 Water Content 3.98 Wet Density 1.94 Dry Density 1.86
Dry Unit Weight 18.27 Void Ratio 0.45
Degree of Saturation (%S) 23.9

65
16 HR DRYING: Sample 2
Load Ring Constant (kN/div)
0.00136 Length, Lo (mm) 70 Diameter
(mm) 33 Area,
Ao (cm2)
8.55
Volume (cm3) 59.9 Mass (g) 116.2 15%
Strain (mm)
10.50 L/d Ratio 2.1
Deformation Dial Reading
Load Dial
Reading
Sample Deformation
Unit Strain Area CF Corrected
Area Total Load (kN)
Sample Stress (kPa)
0 0 0.0 0.0000 1.000 8.55 0.0000 0.0 50 118 0.5 0.7092 0.993 8.61 0.1605 186.3 100 260 1.0 1.4184 0.986 8.68 0.3536 407.6 150 426 1.5 2.1277 0.979 8.74 0.5794 663.0 200 554 2.0 2.8369 0.972 8.80 0.7534 855.9 250 711 2.5 3.5461 0.965 8.87 0.9670 1090.5 300 852 3.0 4.2553 0.957 8.93 1.1587 1297.1 350 978 3.5 4.9645 0.950 9.00 1.3301 1477.9 390 1049 3.9 5.5319 0.945 9.05 1.4266 1575.8
Wet Mass (g) 108.80 Dry Mass (g) 104.50
Mass Water (g) 4.30 Water Content 4.11 Wet Density 1.94 Dry Density 1.86
Dry Unit Weight 18.29 Void Ratio 0.45
Degree of Saturation (%S) 24.8
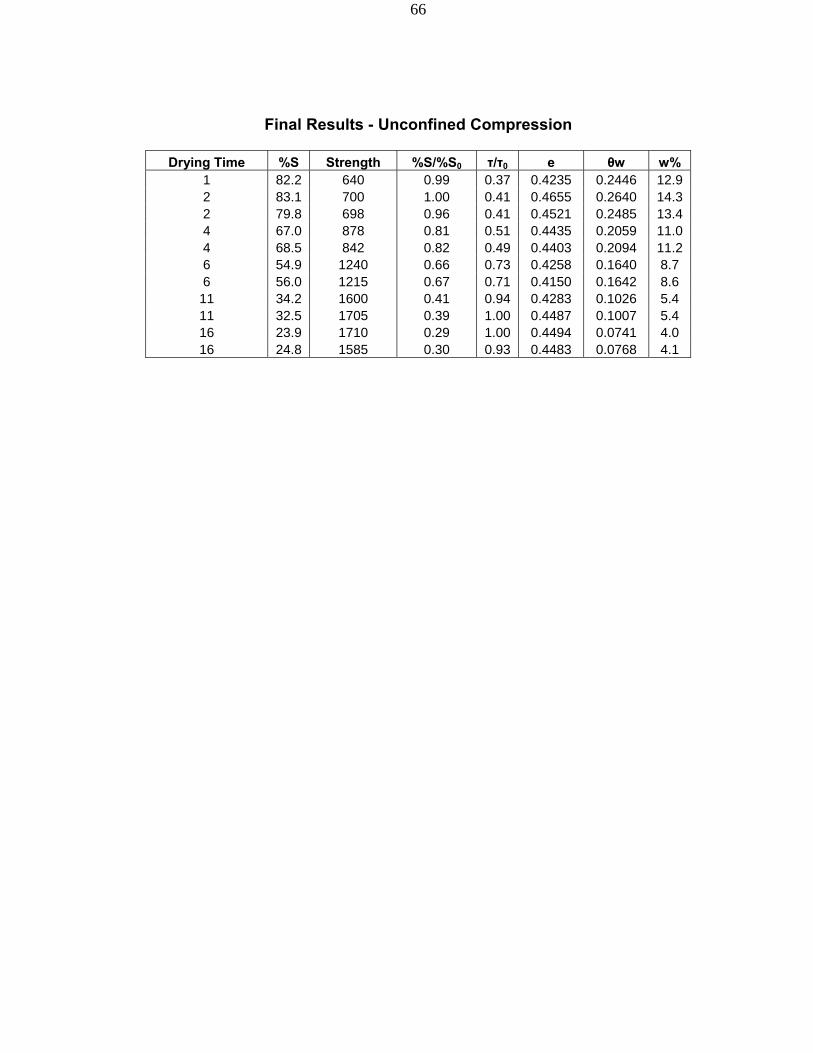
66
Final Results - Unconfined Compression
Drying Time %S Strength %S/%S0 τ/τ0 e θw w%
1 82.2 640 0.99 0.37 0.4235 0.2446 12.9 2 83.1 700 1.00 0.41 0.4655 0.2640 14.3 2 79.8 698 0.96 0.41 0.4521 0.2485 13.4 4 67.0 878 0.81 0.51 0.4435 0.2059 11.0 4 68.5 842 0.82 0.49 0.4403 0.2094 11.2 6 54.9 1240 0.66 0.73 0.4258 0.1640 8.7 6 56.0 1215 0.67 0.71 0.4150 0.1642 8.6 11 34.2 1600 0.41 0.94 0.4283 0.1026 5.4 11 32.5 1705 0.39 1.00 0.4487 0.1007 5.4 16 23.9 1710 0.29 1.00 0.4494 0.0741 4.0 16 24.8 1585 0.30 0.93 0.4483 0.0768 4.1

67
APPENDIX C
CBR PLOTS

68
CBR Data: 4 HR
0
500
1000
1500
2000
2500
3000
3500
4000
0 1 2 3 4 5 6 7 8 9 10 11 12 13 14
Penetration (mm)
Stre
ss (k
Pa)
CBR Data: 16 HR
0
500
1000
1500
2000
2500
3000
3500
4000
0 1 2 3 4 5 6 7 8 9 10 11 12 13 14
Penetration (mm)
Stre
ss (k
Pa)

69
CBR Data: 17.5 HR
0
500
1000
1500
2000
2500
3000
3500
4000
0 1 2 3 4 5 6 7 8 9 10 11 12 13 14
Penetration (mm)
Stre
ss (k
Pa)
CBR Data: 8 HR
0
500
1000
1500
2000
2500
3000
3500
4000
0 1 2 3 4 5 6 7 8 9 10 11 12 13 14
Penetration (mm)
Stre
ss (k
Pa)

70
CBR Data: 25 HR
0
500
1000
1500
2000
2500
3000
3500
4000
0 1 2 3 4 5 6 7 8 9 10 11 12 13 14
Penetration (mm)
Stre
ss (k
Pa)
CBR Data: 26 HR
0
500
1000
1500
2000
2500
3000
3500
4000
0 1 2 3 4 5 6 7 8 9 10 11 12 13 14
Penetration (mm)
Stre
ss (k
Pa)
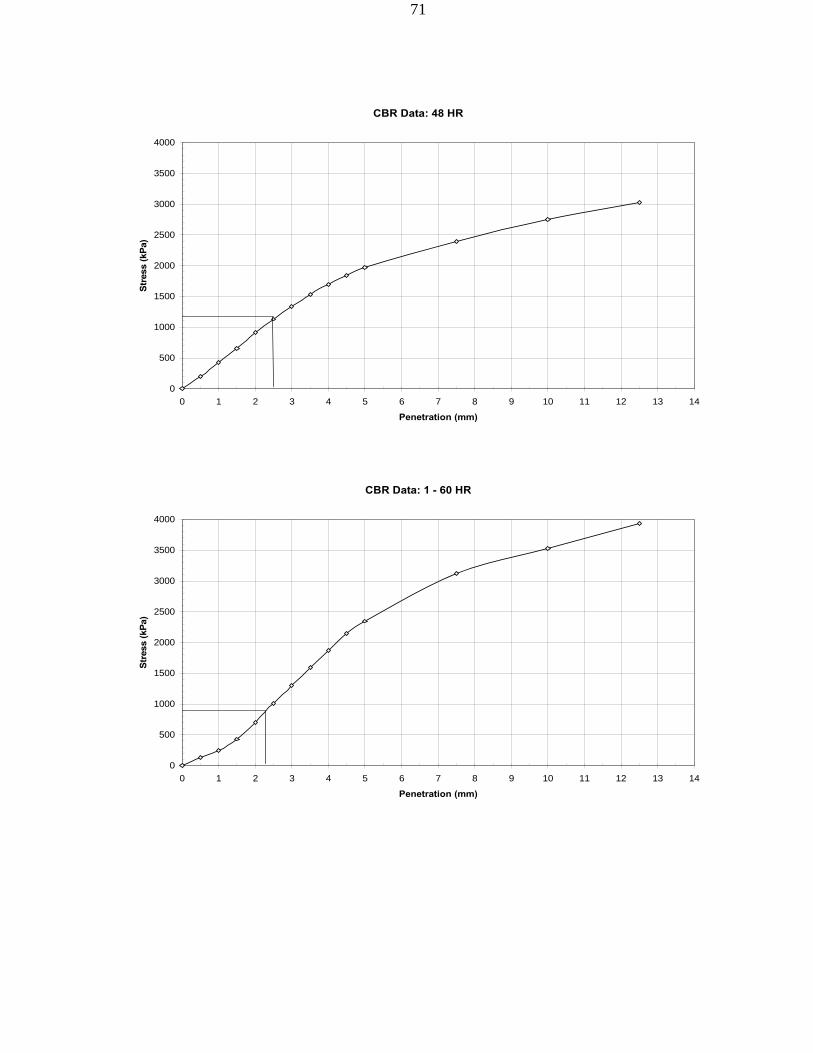
71
CBR Data: 48 HR
0
500
1000
1500
2000
2500
3000
3500
4000
0 1 2 3 4 5 6 7 8 9 10 11 12 13 14
Penetration (mm)
Stre
ss (k
Pa)
CBR Data: 1 - 60 HR
0
500
1000
1500
2000
2500
3000
3500
4000
0 1 2 3 4 5 6 7 8 9 10 11 12 13 14
Penetration (mm)
Stre
ss (k
Pa)

72
CBR Data: 1 - 60 HR
0
500
1000
1500
2000
2500
3000
3500
4000
0 1 2 3 4 5 6 7 8 9 10 11 12 13 14
Penetration (mm)
Stre
ss (k
Pa)
Degree of Saturation vs. Normalized CBR
0.00
0.10
0.20
0.30
0.40
0.50
0.60
0.70
0.80
0.90
1.00
0.0010.0020.0030.0040.0050.0060.0070.0080.0090.00100.00
%S
CB
R 2
.5/C
BR
2.5
o
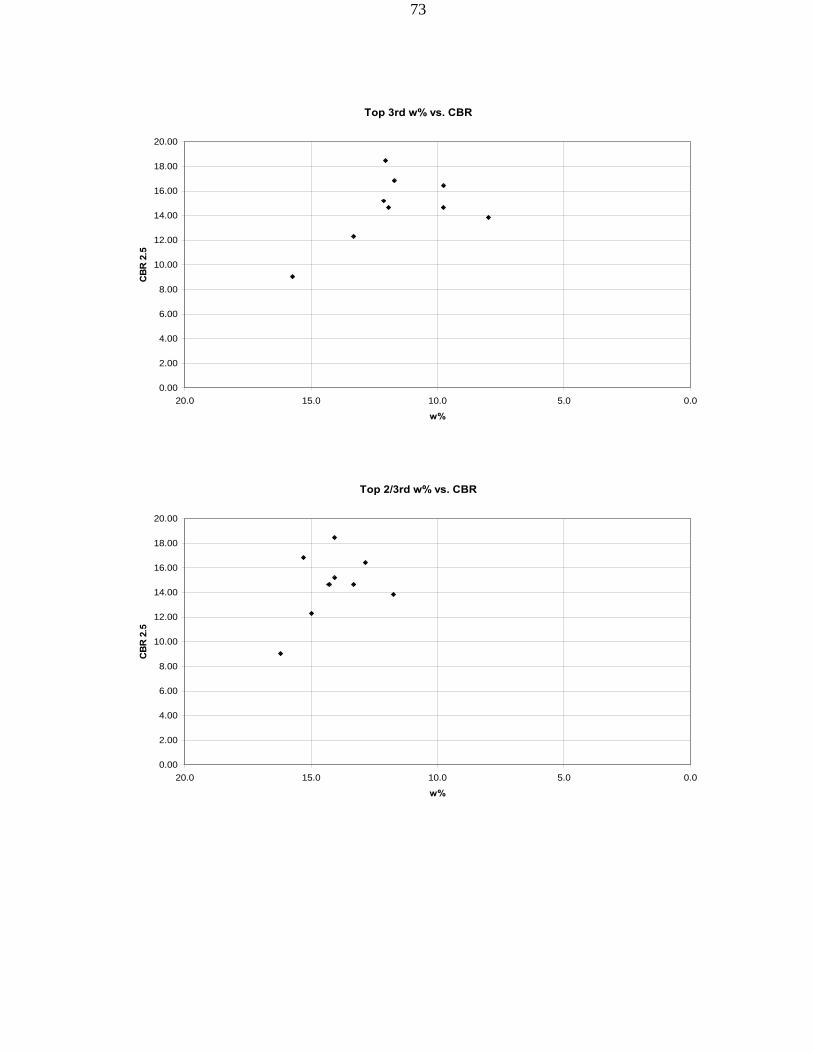
73
Top 3rd w% vs. CBR
0.00
2.00
4.00
6.00
8.00
10.00
12.00
14.00
16.00
18.00
20.00
0.05.010.015.020.0
w%
CB
R 2
.5
Top 2/3rd w% vs. CBR
0.00
2.00
4.00
6.00
8.00
10.00
12.00
14.00
16.00
18.00
20.00
0.05.010.015.020.0
w%
CB
R 2
.5
74
APPENDIX D
UNCONFINED COMPRESSION PLOTS

75
1 Hr Drying
0.0
200.0
400.0
600.0
800.0
1000.0
1200.0
1400.0
1600.0
1800.0
0.0 1.0 2.0 3.0 4.0 5.0 6.0 7.0
Unit Strain (x 10-2)
Stre
ss (k
Pa)
Sample 1, %S = 82.2Average Stress, qu = 640
640 kPa
Estimated Suction =
2 Hr Drying
0.0
200.0
400.0
600.0
800.0
1000.0
1200.0
1400.0
1600.0
1800.0
0.0 1.0 2.0 3.0 4.0 5.0 6.0 7.0
Unit Strain (x 10-2)
Stre
ss (k
Pa)
Sample 1, %S = 83.1
Sample 2, %S = 79.8Average Stress, qu = (700 + 698)/2 = 699kPa
Estimated Suction =
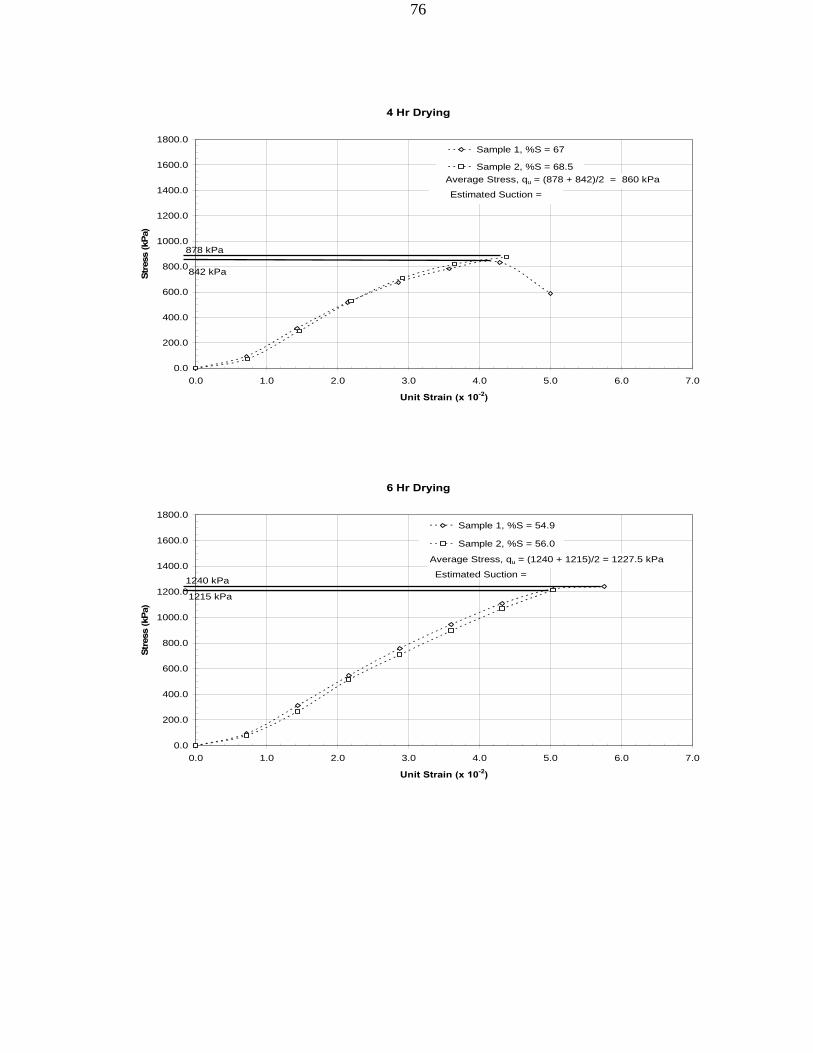
76
4 Hr Drying
0.0
200.0
400.0
600.0
800.0
1000.0
1200.0
1400.0
1600.0
1800.0
0.0 1.0 2.0 3.0 4.0 5.0 6.0 7.0
Unit Strain (x 10-2)
Stre
ss (k
Pa)
Sample 1, %S = 67
Sample 2, %S = 68.5
878 kPa
842 kPa
Average Stress, qu = (878 + 842)/2 = 860 kPa
Estimated Suction =
6 Hr Drying
0.0
200.0
400.0
600.0
800.0
1000.0
1200.0
1400.0
1600.0
1800.0
0.0 1.0 2.0 3.0 4.0 5.0 6.0 7.0
Unit Strain (x 10-2)
Stre
ss (k
Pa)
Sample 1, %S = 54.9
Sample 2, %S = 56.0
1240 kPa
1215 kPa
Average Stress, qu = (1240 + 1215)/2 = 1227.5 kPa
Estimated Suction =
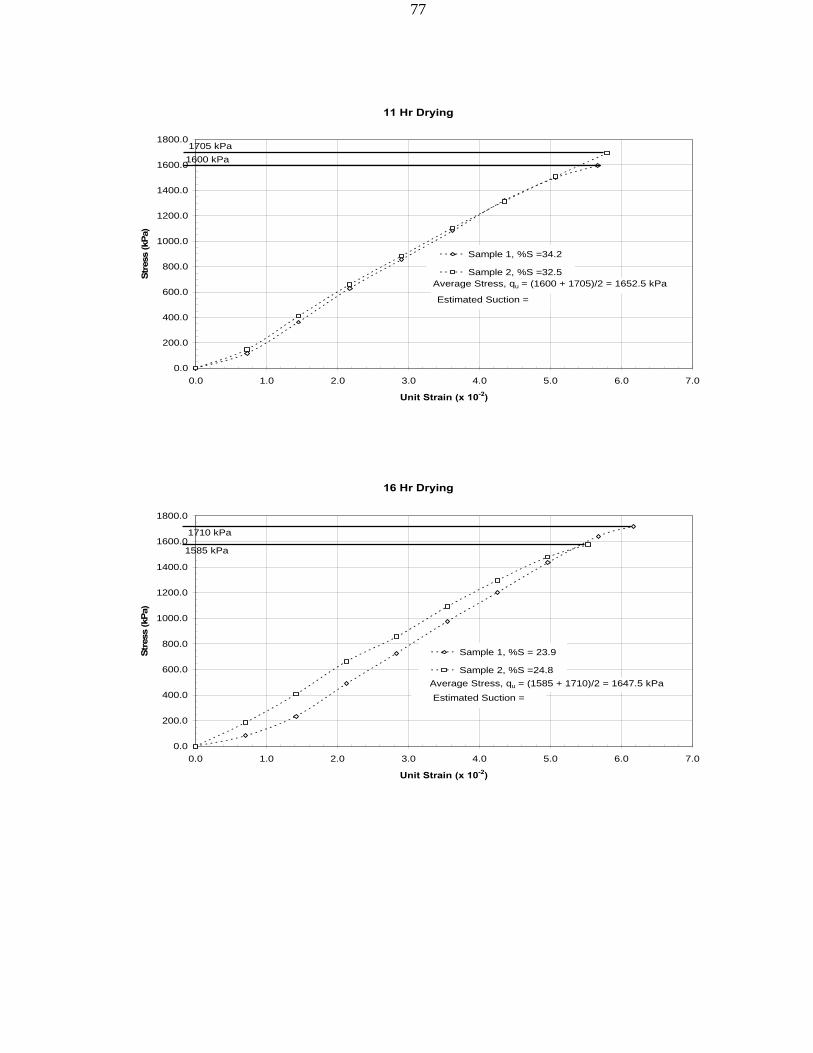
77
11 Hr Drying
0.0
200.0
400.0
600.0
800.0
1000.0
1200.0
1400.0
1600.0
1800.0
0.0 1.0 2.0 3.0 4.0 5.0 6.0 7.0
Unit Strain (x 10-2)
Stre
ss (k
Pa)
Sample 1, %S =34.2
Sample 2, %S =32.5
1600 kPa 1705 kPa
Average Stress, qu = (1600 + 1705)/2 = 1652.5 kPa
Estimated Suction =
16 Hr Drying
0.0
200.0
400.0
600.0
800.0
1000.0
1200.0
1400.0
1600.0
1800.0
0.0 1.0 2.0 3.0 4.0 5.0 6.0 7.0
Unit Strain (x 10-2)
Stre
ss (k
Pa)
Sample 1, %S = 23.9
Sample 2, %S =24.8
1585 kPa
1710 kPa
Average Stress, qu = (1585 + 1710)/2 = 1647.5 kPaEstimated Suction =
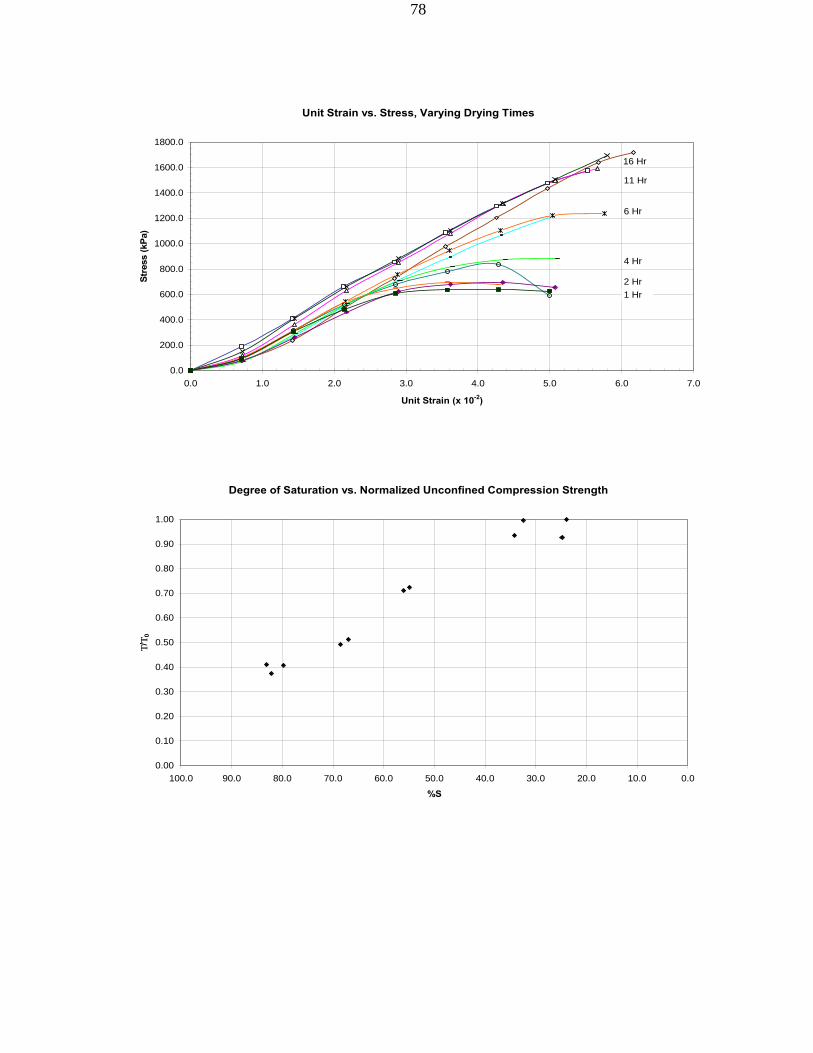
78
Unit Strain vs. Stress, Varying Drying Times
0.0
200.0
400.0
600.0
800.0
1000.0
1200.0
1400.0
1600.0
1800.0
0.0 1.0 2.0 3.0 4.0 5.0 6.0 7.0
Unit Strain (x 10-2)
Stre
ss (k
Pa)
16 Hr
11 Hr
6 Hr
4 Hr
2 Hr1 Hr
Degree of Saturation vs. Normalized Unconfined Compression Strength
0.00
0.10
0.20
0.30
0.40
0.50
0.60
0.70
0.80
0.90
1.00
0.010.020.030.040.050.060.070.080.090.0100.0
%S
Τ/Τ 0

79
APPENDIX E
TECHNICAL PAPER

80