a hybrid ultrasonic guided wave-fiber optic system for
TRANSCRIPT

applied sciences
Article
A Hybrid Ultrasonic Guided Wave-Fiber OpticSystem for Flaw Detection in Pipe
Joseph L. Rose 1,2, Jason Philtron 1,*, Guigen Liu 3, Yupeng Zhu 3 and Ming Han 3
1 FBS, Inc. dba Guidedwave, 450 Rolling Ridge Drive, Bellefonte, PA 16823, USA;[email protected] or [email protected]
2 Department of Earth and Engineering Sciences, Pennsylvania State University, University Park,PA 16802, USA
3 Department of Electrical and Computer Engineering, Michigan State University, East Lansing,MI 48824-1226, USA; [email protected] (G.L.); [email protected] (Y.Z.); [email protected] (M.H.)
* Correspondence: [email protected]
Received: 11 April 2018; Accepted: 2 May 2018; Published: 5 May 2018�����������������
Abstract: The work presented in this paper shows that Fiber Bragg Grating (FBG) optical fiber sensorscan potentially be used as receivers in a long-range guided wave torsional-mode pipe inspectionsystem. Benefits over the conventional pulse-echo method arise due to reduced total travel distanceof the ultrasonic guided wave reflections, since reflections from defects and structural features do notneed to propagate a full round trip back to the transmitting collar. This is especially important inpipe configurations with high attenuation, such as coated and buried pipelines. The use of FBGs asreceivers instead of conventional piezoelectric or magnetostrictive elements also significantly reducescabling, since multiple FBG receivers can be placed along a single optical fiber which has a diameteron the order of only around 100 µm. The basic approach and sample results are presented in thepaper. Additionally, a brief overview of some topics in ultrasonic guided waves is presented as abackground to understand the inspection problem presented here.
Keywords: ultrasonic guided waves; fiber optics; fiber Bragg grating; nondestructive testing;structural health monitoring; pipe inspection
1. Introduction
Guided wave ultrasound is increasingly being used to solve inspection problems in a wide varietyof applications. This is because guided waves can be used to inspect over long distances from a singleprobe position, offer complete volumetric coverage, and can inspect hidden/inaccessible structures,such as those under water, coatings, insulation, and soil. Before discussing the merger of ultrasonicguided waves with fiber optic technology, the major topic in this paper, a brief review of some of ourfirst accomplishments on various topics in ultrasonic guided waves is presented. This illustrates thebackground leading to the topic of this paper.
Two textbooks on the subject of wave mechanics fundamentals with emphasis on guidedwaves for nondestructive testing (NDT) and structural health monitoring (SHM) are presented byRose, [1] 1999, [2] 2014. Some selected developments over the last few decades include the following.The value of computing and selecting specific wave structures from the phase velocity dispersioncurves was initially pointed out by Ditri, Rose, and Chen [3] 1991, where defects close to a surfacewere found with wave structure having lots of energy near the surface. Since then paying attentionto wave structure has led to solutions for many important problems in NDT and SHM. Pilarski,Ditri, and Rose in [4] 1993, demonstrated the ability to locate wave structure profiles with in-planedisplacement on the surface of a waveguide, which has played a significant role in ice detection and
Appl. Sci. 2018, 8, 727; doi:10.3390/app8050727 www.mdpi.com/journal/applsci
Appl. Sci. 2018, 8, 727 2 of 14
the impact of water loaded surfaces on many NDT and SHM problems. A variety of problems inthe aircraft industry are covered by Rose and Soley [5] 2000. Such topics as lap joint, tear strap andhoneycomb inspection are discussed. A method of focusing ultrasonic guided waves in pipe wasintroduced by Rose, Sun, Mudge, and Avioli [6] 2003. The phased array focusing approach improvesdetection sensitivity, axial and lateral resolution and even penetration power. The ability to generatedispersion curves for structures having an arbitrary cross section was introduced by Hayashi, Song,and Rose [7] 2003. Many new applications with guided waves became possible and in particulara breakthrough in treating guided wave propagation in rails. Guided wave tomography conceptsand several sample problems were coved by Gao, Shi, and Rose [8] 2005. The critical problem of railinspection under shelling for transverse crack detection in the rail head along with possibilities ofweb and base defect detection was presented by Lee, Rose, and Cho [9] 2008. Adhesive bondlineinspection breakthroughs was reported for certain substrate systems by Puthillath and Rose [10] 2010.Utilization of magnetostrictive technology advancements for the generation and utilization of guidedwaves was reported by Van Velsor, Royer, Owens, and Rose [11] 2013. Guided wave mode andfrequency tuning and optimization is discussed in Philtron and Rose [12] 2014, making it possibleto find defects in a variety of different structures more completely. A phased array system for plateinspection was developed and reported by Rose, Borigo, Owens, and Reese [13] 2017. This techniqueis responsible for amazingly fast inspection of corrosion type defects in large plate-like structuresemploying radar type circumferential or sector scans. Other NDT applications for guided waves, forexample, include oil-tank weld detection using EMAT-generated shear-horizontal guided waves [14]2017, fundamental torsional mode detection of angled cut flaws [15] 2016, and liquid level displacementmeasurements using magnetostrictive sensors [16] 2017.
Our background in ultrasonic guided waves thus prepared us for a merger with conceptspresented by Perez, Cui, and Udd [17] 2001. Perez et al. [17] showed the possibility of ultrasonicwave interaction with fiber Bragg gratings (FBG) in an optical fiber. To date, FBG ultrasonic sensorshave been extensively investigated [18] 2008. The use of the fundamental shear horizontal mode inplates and torsional mode in pipes is of interest for ultrasonic inspection due to the nondispersivenature and insensitivity to water loading that these modes offer. However, the majority of FBGultrasonic sensors have been used to detect Lamb-type guided waves which are quite different fromthe shear horizontal (SH) waves in plates and torsional waves in pipes, there are only a few papersexperimentally describing the usage of FBG sensors for SH wave detection [19–21] but with inclusiveresults. The mechanism governing the interaction of an FBG sensor with SH waves in plates hasnot been thoroughly reported until our work was recently published by Liu, Philtron, Zhu, Rose,and Han [22] 2018. Our results in [22] confirm both theoretically and experimentally the feasibility ofusing FBG sensors for SH wave detection with a maximum reception efficiency around 45◦ incidence,which shows a completely different angular dependence in comparison to Lamb-type wave detection.
In this current paper, taking advantage of the remote sensing (attenuation of the optical signal inan optical fiber is ultralow) and multiplexing capability of FBG sensors, the work is expanded upon ourprevious work in [22] to demonstrate how the technique could be used to extend the range in mediumand long-range pipe inspection applications using torsional guided waves. The use of the fundamentalshear horizontal mode in plates and torsional mode in pipes is of interest for ultrasonic inspection dueto the nondispersive nature and insensitivity to water loading that these modes offer. Since long-rangeguided wave pipe inspection is critical and taking place all over the world on thousands of milesof pipe, the work reported in this paper was intended to investigate if improvements in inspectionreliability and cost reduction would be possible with a hybrid ultrasonic guided wave-FBG approach.Some earlier work on this subject was reported by Hu, Zhao, and Li [23] 2012 and Ray, Srinivasan,Balasubramaniam, and Rajagopal [24] 2017. Hu et al. [23] 2012 performed a modeling study suggestingfeasibility to integrate optical fiber sensors into pipeline inspection using the L(0,2) mode, but anexperiment was not reported. Ray et al. [24] 2017 describe the use of fiber optic sensors to detectchanges in the guided wave features of the L(0,2) mode to assess cross sectional irregularities such as
Appl. Sci. 2018, 8, 727 3 of 14
pipe eccentricity. Obviously, their work does not address torsional wave detection. The work reportedin this paper will illustrate how FBG receivers could be implemented as part of a hybrid ultrasonicpipe inspection technology using torsional guided waves.
2. Hybrid Ultrasonic—Fiber Optic System Concept
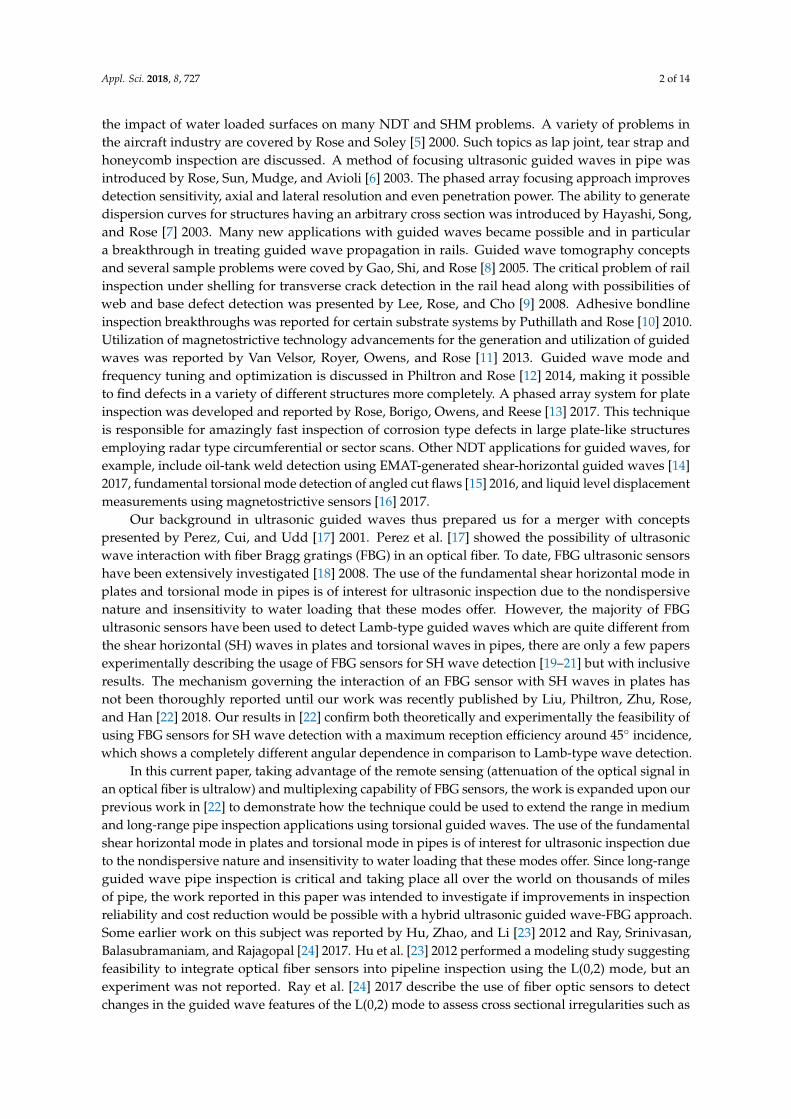
Commercially available systems for ultrasonic guided wave pipe inspection can quickly andreliably scan large sections of pipeline for flaws. However, there are certain situations where increasedrange of an inspection system is desired. This may occur in such situations as for highly attenuativepipe, such as buried, coated, or generally corroded lines, or in situations where access is limited.In these situations, use of an alternate method, such as fiber optic sensors, in conjunction withconventional ultrasonic guided wave inspection can be beneficial to increase inspection range intothe non-inspected region. Fiber optic sensors may be attached to a pipeline during installation andthen left in place for use during periodic inspections. The fiber optic sensors could be placed near theend of the range of a conventional pulse-echo inspection system, allowing for increased range by asmuch as 50%, if the optical system has a similar signal-to-noise ratio. This can be achieved because thereflected wave energy from a flaw need not travel the full return distance to the actuator, but only backto the remote fiber optic sensor to be detected.
This concept is illustrated in Figure 1. The conventional ultrasonic collar generates guided wavesin the pipe at location 0. Remote fiber optic sensor(s) are placed at a distance X from the collar,which should be near, but not beyond, the effective inspection range of the conventional system.The inspection range of the hybrid system is then extended such that a flaw at a distance Y from thecollar is now detectable from the original collar location through use of the fiber optic sensor. Note thatthe optical system could be collocated with the ultrasonic equipment, or not. One key differencebetween optical fiber and conventional metal cable carrying ultrasonic signals is that the loss of theoptical signal is very low in comparison.
Appl. Sci. 2018, 8, x FOR PEER REVIEW 3 of 14
assess cross sectional irregularities such as pipe eccentricity. Obviously, their work does not address
torsional wave detection. The work reported in this paper will illustrate how FBG receivers could be
implemented as part of a hybrid ultrasonic pipe inspection technology using torsional guided
waves.
2. Hybrid Ultrasonic—Fiber Optic System Concept
Commercially available systems for ultrasonic guided wave pipe inspection can quickly and
reliably scan large sections of pipeline for flaws. However, there are certain situations where
increased range of an inspection system is desired. This may occur in such situations as for highly
attenuative pipe, such as buried, coated, or generally corroded lines, or in situations where access is
limited. In these situations, use of an alternate method, such as fiber optic sensors, in conjunction
with conventional ultrasonic guided wave inspection can be beneficial to increase inspection range
into the non-inspected region. Fiber optic sensors may be attached to a pipeline during installation
and then left in place for use during periodic inspections. The fiber optic sensors could be placed
near the end of the range of a conventional pulse-echo inspection system, allowing for increased
range by as much as 50%, if the optical system has a similar signal-to-noise ratio. This can be
achieved because the reflected wave energy from a flaw need not travel the full return distance to
the actuator, but only back to the remote fiber optic sensor to be detected.
This concept is illustrated in Figure 1. The conventional ultrasonic collar generates guided
waves in the pipe at location 0. Remote fiber optic sensor(s) are placed at a distance X from the collar,
which should be near, but not beyond, the effective inspection range of the conventional system. The
inspection range of the hybrid system is then extended such that a flaw at a distance Y from the
collar is now detectable from the original collar location through use of the fiber optic sensor. Note
that the optical system could be collocated with the ultrasonic equipment, or not. One key difference
between optical fiber and conventional metal cable carrying ultrasonic signals is that the loss of the
optical signal is very low in comparison.
Figure 1. Global hybrid ultrasonic guided wave and fiber optic inspection system concept. The range of
a conventional collar at position 0 can be increased beyond position X using a fiber optic sensor
attached near position X. This allows the hybrid system to detect a flaw at a further distance, position Y.
Consider an example coated pipeline with high attenuation. It is possible that a conventional
inspection distance is only 50 feet. Flaws beyond 50 feet from the collar are not detected because
potential flaw reflections are hidden within the noise. However, if a fiber optic sensor was installed
near the 50-foot location, the inspection range could be increased by 25 feet, to a total of 75 feet.
Assuming constant attenuation along the pipe, the ultrasonic wave energy would decrease the same
amount traveling from 50 feet back to the collar, or from 50 to 75 feet and back to the fiber optic
sensor. If the fiber optic sensor has a similar signal-to-noise ratio as the ultrasonic collar, the effective
inspection range can be increased by as much as 50%. The fiber optic sensors could be attached and
left in place (under coatings) during pipeline installation, saving significant time and cost from
inspection and preparation costs to expose the pipe for collar application, particularly for the case
where access must be dug in the middle of a buried section of pipeline. Note that the use of a hybrid
system could be costly due to the need for extra components to perform optical sensing such as the
laser, controller, photodetector, etc. However, in certain cases where it can achieve improved
performance, such as in cases where increased inspection range provides inspection of previously
Figure 1. Global hybrid ultrasonic guided wave and fiber optic inspection system concept. The rangeof a conventional collar at position 0 can be increased beyond position X using a fiber optic sensorattached near position X. This allows the hybrid system to detect a flaw at a further distance, position Y.
Consider an example coated pipeline with high attenuation. It is possible that a conventionalinspection distance is only 50 feet. Flaws beyond 50 feet from the collar are not detected becausepotential flaw reflections are hidden within the noise. However, if a fiber optic sensor was installednear the 50-foot location, the inspection range could be increased by 25 feet, to a total of 75 feet.Assuming constant attenuation along the pipe, the ultrasonic wave energy would decrease the sameamount traveling from 50 feet back to the collar, or from 50 to 75 feet and back to the fiber opticsensor. If the fiber optic sensor has a similar signal-to-noise ratio as the ultrasonic collar, the effectiveinspection range can be increased by as much as 50%. The fiber optic sensors could be attached and leftin place (under coatings) during pipeline installation, saving significant time and cost from inspectionand preparation costs to expose the pipe for collar application, particularly for the case where accessmust be dug in the middle of a buried section of pipeline. Note that the use of a hybrid system couldbe costly due to the need for extra components to perform optical sensing such as the laser, controller,photodetector, etc. However, in certain cases where it can achieve improved performance, such as in
Appl. Sci. 2018, 8, 727 4 of 14
cases where increased inspection range provides inspection of previously un-inspectable or expensiveor hard-to-inspect areas, use of a hybrid system will be worthwhile. Future developments will alsolead to reduced cost of optical components. Generally, it is expected that the fiber sensors will beused in a similar method as for conventional piezoelectric and magnetostrictive sensors, i.e., to detectreflections from flaws. Although it may be possible to detect flaws between a sender and receiver,flaw detection is much easier and more straight forward when analyzing a reflected wave signal froma flaw.
Note also that additional SMS collar(s) could be installed at location X, etc., to extend the inspectionrange, but these collars are generally more expensive than optical fiber, would require many, longcables (typically 16, one per channel) with a remotely used data acquisition system, and there may notphysically be access space to install these collars. The use of fiber optic sensors also allows for manysensors along a single optical cable.
3. Materials and Methods
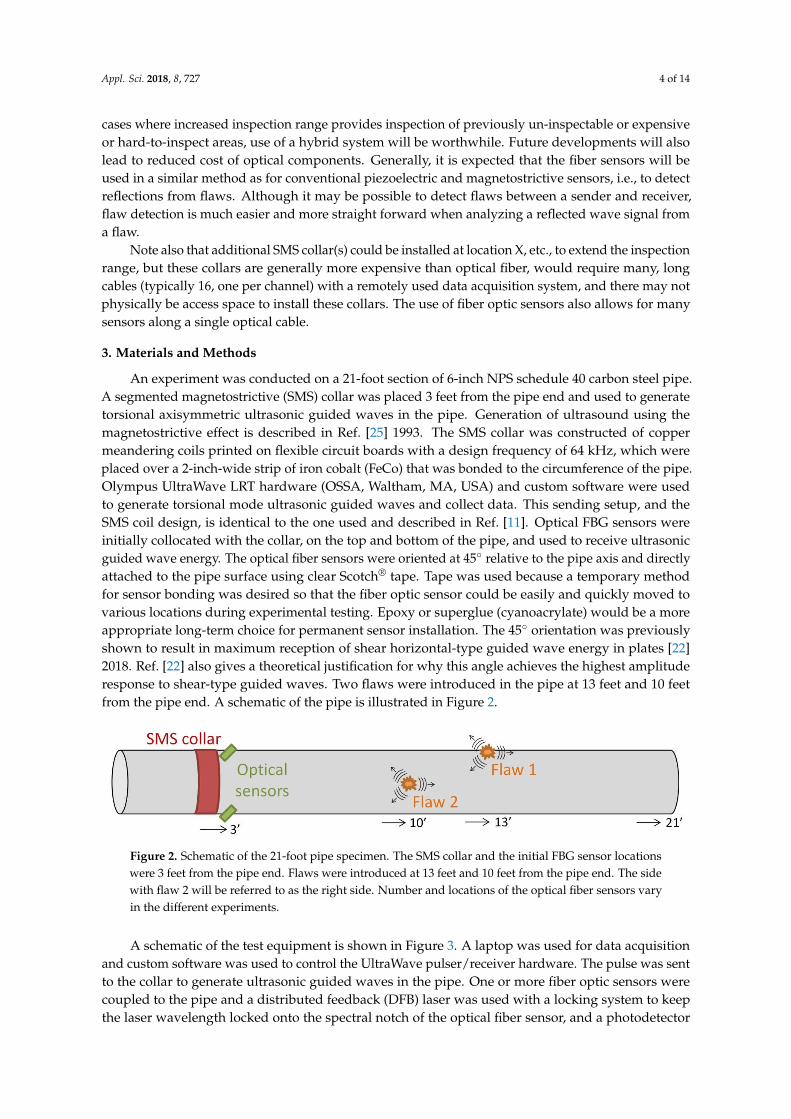
An experiment was conducted on a 21-foot section of 6-inch NPS schedule 40 carbon steel pipe.A segmented magnetostrictive (SMS) collar was placed 3 feet from the pipe end and used to generatetorsional axisymmetric ultrasonic guided waves in the pipe. Generation of ultrasound using themagnetostrictive effect is described in Ref. [25] 1993. The SMS collar was constructed of coppermeandering coils printed on flexible circuit boards with a design frequency of 64 kHz, which wereplaced over a 2-inch-wide strip of iron cobalt (FeCo) that was bonded to the circumference of the pipe.Olympus UltraWave LRT hardware (OSSA, Waltham, MA, USA) and custom software were usedto generate torsional mode ultrasonic guided waves and collect data. This sending setup, and theSMS coil design, is identical to the one used and described in Ref. [11]. Optical FBG sensors wereinitially collocated with the collar, on the top and bottom of the pipe, and used to receive ultrasonicguided wave energy. The optical fiber sensors were oriented at 45◦ relative to the pipe axis and directlyattached to the pipe surface using clear Scotch® tape. Tape was used because a temporary methodfor sensor bonding was desired so that the fiber optic sensor could be easily and quickly moved tovarious locations during experimental testing. Epoxy or superglue (cyanoacrylate) would be a moreappropriate long-term choice for permanent sensor installation. The 45◦ orientation was previouslyshown to result in maximum reception of shear horizontal-type guided wave energy in plates [22]2018. Ref. [22] also gives a theoretical justification for why this angle achieves the highest amplituderesponse to shear-type guided waves. Two flaws were introduced in the pipe at 13 feet and 10 feetfrom the pipe end. A schematic of the pipe is illustrated in Figure 2.
Appl. Sci. 2018, 8, x FOR PEER REVIEW 4 of 14
un-inspectable or expensive or hard-to-inspect areas, use of a hybrid system will be worthwhile.
Future developments will also lead to reduced cost of optical components. Generally, it is expected
that the fiber sensors will be used in a similar method as for conventional piezoelectric and
magnetostrictive sensors, i.e., to detect reflections from flaws. Although it may be possible to detect
flaws between a sender and receiver, flaw detection is much easier and more straight forward when
analyzing a reflected wave signal from a flaw.
Note also that additional SMS collar(s) could be installed at location X, etc., to extend the
inspection range, but these collars are generally more expensive than optical fiber, would require
many, long cables (typically 16, one per channel) with a remotely used data acquisition system, and
there may not physically be access space to install these collars. The use of fiber optic sensors also
allows for many sensors along a single optical cable.
3. Materials and Methods
An experiment was conducted on a 21-foot section of 6-inch NPS schedule 40 carbon steel pipe.
A segmented magnetostrictive (SMS) collar was placed 3 feet from the pipe end and used to generate
torsional axisymmetric ultrasonic guided waves in the pipe. Generation of ultrasound using the
magnetostrictive effect is described in Ref. [25] 1993. The SMS collar was constructed of copper
meandering coils printed on flexible circuit boards with a design frequency of 64 kHz, which were
placed over a 2-inch-wide strip of iron cobalt (FeCo) that was bonded to the circumference of the
pipe. Olympus UltraWave LRT hardware (OSSA, Waltham, MA, USA) and custom software were
used to generate torsional mode ultrasonic guided waves and collect data. This sending setup, and
the SMS coil design, is identical to the one used and described in Ref. [11]. Optical FBG sensors were
initially collocated with the collar, on the top and bottom of the pipe, and used to receive ultrasonic
guided wave energy. The optical fiber sensors were oriented at 45° relative to the pipe axis and
directly attached to the pipe surface using clear Scotch® tape. Tape was used because a temporary
method for sensor bonding was desired so that the fiber optic sensor could be easily and quickly
moved to various locations during experimental testing. Epoxy or superglue (cyanoacrylate) would
be a more appropriate long-term choice for permanent sensor installation. The 45° orientation was
previously shown to result in maximum reception of shear horizontal-type guided wave energy in
plates [22] 2018. Ref. [22] also gives a theoretical justification for why this angle achieves the highest
amplitude response to shear-type guided waves. Two flaws were introduced in the pipe at 13 feet
and 10 feet from the pipe end. A schematic of the pipe is illustrated in Figure 2.
Figure 2. Schematic of the 21-foot pipe specimen. The SMS collar and the initial FBG sensor locations
were 3 feet from the pipe end. Flaws were introduced at 13 feet and 10 feet from the pipe end. The
side with flaw 2 will be referred to as the right side. Number and locations of the optical fiber sensors
vary in the different experiments.
A schematic of the test equipment is shown in Figure 3. A laptop was used for data acquisition
and custom software was used to control the UltraWave pulser/receiver hardware. The pulse was
sent to the collar to generate ultrasonic guided waves in the pipe. One or more fiber optic sensors
were coupled to the pipe and a distributed feedback (DFB) laser was used with a locking system to
keep the laser wavelength locked onto the spectral notch of the optical fiber sensor, and a
photodetector was used to convert the light signal into a voltage signal for recording. Different from
the benchtop narrow linewidth laser used in our previous work [22], the much more portable and
low-cost DFB lasers (A1905LMI, Avanex, New York, NY, USA) were used in this paper with
Figure 2. Schematic of the 21-foot pipe specimen. The SMS collar and the initial FBG sensor locationswere 3 feet from the pipe end. Flaws were introduced at 13 feet and 10 feet from the pipe end. The sidewith flaw 2 will be referred to as the right side. Number and locations of the optical fiber sensors varyin the different experiments.
A schematic of the test equipment is shown in Figure 3. A laptop was used for data acquisitionand custom software was used to control the UltraWave pulser/receiver hardware. The pulse was sentto the collar to generate ultrasonic guided waves in the pipe. One or more fiber optic sensors werecoupled to the pipe and a distributed feedback (DFB) laser was used with a locking system to keepthe laser wavelength locked onto the spectral notch of the optical fiber sensor, and a photodetector

Appl. Sci. 2018, 8, 727 5 of 14
was used to convert the light signal into a voltage signal for recording. Different from the benchtopnarrow linewidth laser used in our previous work [22], the much more portable and low-cost DFBlasers (A1905LMI, Avanex, New York, NY, USA) were used in this paper with moderate compromisein signal-to-noise ratio (due to the larger noise of a DFB laser). Furthermore, a two-channel system wasused in this work to demonstrate the multiplexing capability of the FBG sensing system (see Figure 3),i.e., one DFB laser and FBG pair works at 1550 nm wavelength while the other pair works at 1545 nm.A dense wavelength division multiplexer (DWDM) was used to optically separate the two channels andthe ultrasonic signals received by the two FBG sensors are acquired simultaneously. Additional detailsdescribing each single-channel setup are found in Ref. [22] 2018. Although the two-channel systemis enough for the demonstration of multiplexing capability, when using this type of optical setupadditional lasers could be added for additional simultaneous reception by fiber sensors connected toother channels of the DWDM but it is not the focus of this paper. Note that the type of optical fibersensor used in this study is a Fabry-Perot interferometer formed by a pair of tandem chirped fiberBragg gratings, each with a 5-mm grating length, abbreviated as CFBG-FPI and referred to in this worksimply as an optical fiber sensor. Any reasonable optical fiber Bragg grating type sensor may be usedto detect torsional guided waves; this sensor type was selected due to its relatively high signal-to-noiseratio, although it has other properties such as the ability to withstand relatively large static strains inthe structure while still using its narrow spectral notch pattern [26] 2017.
Appl. Sci. 2018, 8, x FOR PEER REVIEW 5 of 14
moderate compromise in signal-to-noise ratio (due to the larger noise of a DFB laser). Furthermore, a
two-channel system was used in this work to demonstrate the multiplexing capability of the FBG
sensing system (see Figure 3), i.e., one DFB laser and FBG pair works at 1550 nm wavelength while
the other pair works at 1545 nm. A dense wavelength division multiplexer (DWDM) was used to
optically separate the two channels and the ultrasonic signals received by the two FBG sensors are
acquired simultaneously. Additional details describing each single-channel setup are found in Ref.
[22] 2018. Although the two-channel system is enough for the demonstration of multiplexing
capability, when using this type of optical setup additional lasers could be added for additional
simultaneous reception by fiber sensors connected to other channels of the DWDM but it is not the
focus of this paper. Note that the type of optical fiber sensor used in this study is a Fabry-Perot
interferometer formed by a pair of tandem chirped fiber Bragg gratings, each with a 5-mm grating
length, abbreviated as CFBG-FPI and referred to in this work simply as an optical fiber sensor. Any
reasonable optical fiber Bragg grating type sensor may be used to detect torsional guided waves; this
sensor type was selected due to its relatively high signal-to-noise ratio, although it has other
properties such as the ability to withstand relatively large static strains in the structure while still
using its narrow spectral notch pattern [26] 2017.
Figure 3. Schematic of the integrated ultrasonic-optical system setup. A servo controller was used to
keep the laser wavelength locked to the slope of the FBG spectrum for each channel. The optical
signal was converted to a voltage signal and recorded using conventional ultrasonic hardware.
4. Results
4.1. Confirmation of Torsional Mode and Flaw Detection
Figure 4 shows a frequency scan (F-Scan) plot of data collected using ultrasound generated by
the SMS collar and received by the optical fiber sensor attached on the bottom of the pipe at 3 feet
from the pipe end. The F-Scan plot shows data from a series of A-scans (amplitude scans) with
different pulse center frequencies vs. distance, with amplitude shown in color. The dead zone, pipe
end reflections, and flaw indications are indicated. These two flaws are located at 7 feet and 10 feet
from the sensor and on the top and right side of the pipe, respectively. The flaws are 0.5-inch
diameter and 0.25-inch deep drilled holes, which represent a simulated 2% CSA (pipe cross-sectional
area) corrosion flaw.
Reflections from a reverse wave are also shown in Figure 4. Although the SMS collar was
activated with directional control, in which two axially-separated coils are used with a time delay to
cancel the backward-travelling wave, the cancellation is not perfect, and therefore extra reflections
Figure 3. Schematic of the integrated ultrasonic-optical system setup. A servo controller was used tokeep the laser wavelength locked to the slope of the FBG spectrum for each channel. The optical signalwas converted to a voltage signal and recorded using conventional ultrasonic hardware.
4. Results
4.1. Confirmation of Torsional Mode and Flaw Detection
Figure 4 shows a frequency scan (F-Scan) plot of data collected using ultrasound generated by theSMS collar and received by the optical fiber sensor attached on the bottom of the pipe at 3 feet from thepipe end. The F-Scan plot shows data from a series of A-scans (amplitude scans) with different pulsecenter frequencies vs. distance, with amplitude shown in color. The dead zone, pipe end reflections,and flaw indications are indicated. These two flaws are located at 7 feet and 10 feet from the sensor

Appl. Sci. 2018, 8, 727 6 of 14
and on the top and right side of the pipe, respectively. The flaws are 0.5-inch diameter and 0.25-inchdeep drilled holes, which represent a simulated 2% CSA (pipe cross-sectional area) corrosion flaw.
Reflections from a reverse wave are also shown in Figure 4. Although the SMS collar was activatedwith directional control, in which two axially-separated coils are used with a time delay to cancel thebackward-travelling wave, the cancellation is not perfect, and therefore extra reflections are shown at3 feet and 13 feet, and to a lesser extent near 10.5 feet, from the collar location. These signals wouldnot be as prevalent in a longer length of pipeline, since a 100% reflector (cut pipe end) would not bepresent. Also, these reverse wave reflections could be suppressed if two axially-separated optical fibersensors are used and a directional control routine is applied on the received signals.
Appl. Sci. 2018, 8, x FOR PEER REVIEW 6 of 14
are shown at 3 feet and 13 feet, and to a lesser extent near 10.5 feet, from the collar location. These
signals would not be as prevalent in a longer length of pipeline, since a 100% reflector (cut pipe end)
would not be present. Also, these reverse wave reflections could be suppressed if two
axially-separated optical fiber sensors are used and a directional control routine is applied on the
received signals.
Figure 4. F-Scan generated using an FBG sensor directly bonded to the bottom side of the pipe at 3
feet from the pipe end, collocated with SMS sending collar. Flaw indications are shown at 7 feet and
10 feet from the sensor. Pipe end reflections are shown at −3 feet and 18 feet. Indications at 3 feet and
13 feet are due to waves traveling from the SMS collar in the reverse direction and bouncing off the
near end of the pipe at −3 feet, a result of imperfect directional control. The optical fiber sensor can
clearly be used for flaw detection.
Even though the FBG sensor is effectively sensing at only a small portion (approximately a
“point”) along the circumference, as opposed to sensing around nearly the full circumference as is
achieved with a conventional long-range ultrasonic collar, it is clear from Figure 4 that positive flaw
detection occurs over a range of frequencies. The ability of the “point” optical fiber sensor to detect a
flaw reflection is dependent on the relative locations of the flaw and sensor, as will be discussed
further below.
For comparison, F-Scan data using solely the SMS collar in pulse-echo mode is displayed in
Figure 5. The two 2% CSA flaws are clearly detectable at 7 and 10 feet. Also, there is a higher
signal-to-noise ratio for this setup, which is typically seen for magnetostrictive sensors. Use of
different optical components, such as a laser with lower noise, could achieve a similar
signal-to-noise ratio. Note also that the dual axially-separated coils allow for directional control and
also a suppression algorithm on the received wave, suppressing the reverse waves shown in Figure
4, which is not possible for a single fiber optic sensor but could be achieved with multiple fiber optic
sensors, as noted above. The experimental pipe tested here does not highlight the advantages of the
hybrid sensing method, since this application of a short pipe of low attenuation would not benefit
from range extension. The overall goal of this work is to prove that detection with a hybrid system is
possible and describe future applications where it could prove beneficial.
Figure 4. F-Scan generated using an FBG sensor directly bonded to the bottom side of the pipe at 3 feetfrom the pipe end, collocated with SMS sending collar. Flaw indications are shown at 7 feet and 10 feetfrom the sensor. Pipe end reflections are shown at −3 feet and 18 feet. Indications at 3 feet and 13 feetare due to waves traveling from the SMS collar in the reverse direction and bouncing off the near endof the pipe at −3 feet, a result of imperfect directional control. The optical fiber sensor can clearly beused for flaw detection.
Even though the FBG sensor is effectively sensing at only a small portion (approximately a“point”) along the circumference, as opposed to sensing around nearly the full circumference as isachieved with a conventional long-range ultrasonic collar, it is clear from Figure 4 that positive flawdetection occurs over a range of frequencies. The ability of the “point” optical fiber sensor to detecta flaw reflection is dependent on the relative locations of the flaw and sensor, as will be discussedfurther below.
For comparison, F-Scan data using solely the SMS collar in pulse-echo mode is displayed inFigure 5. The two 2% CSA flaws are clearly detectable at 7 and 10 feet. Also, there is a highersignal-to-noise ratio for this setup, which is typically seen for magnetostrictive sensors. Use of differentoptical components, such as a laser with lower noise, could achieve a similar signal-to-noise ratio.Note also that the dual axially-separated coils allow for directional control and also a suppressionalgorithm on the received wave, suppressing the reverse waves shown in Figure 4, which is not possiblefor a single fiber optic sensor but could be achieved with multiple fiber optic sensors, as noted above.The experimental pipe tested here does not highlight the advantages of the hybrid sensing method,since this application of a short pipe of low attenuation would not benefit from range extension.The overall goal of this work is to prove that detection with a hybrid system is possible and describefuture applications where it could prove beneficial.

Appl. Sci. 2018, 8, 727 7 of 14Appl. Sci. 2018, 8, x FOR PEER REVIEW 7 of 14
Figure 5. F-Scan generated using the SMS collar in pulse-echo mode at 3 feet from the pipe end. Flaw
indications are shown at 7 feet and 10 feet from the sensor. Pipe end reflections are shown at −3 feet
and 18 feet. There is a higher signal-to-noise ratio for this setup. Note also that the dual coils allow for
directional control of the received wave, suppressing the reverse waves shown in Figure 4.
4.2. Progressive Damage Test in SHM Mode
Hybrid ultrasonic-optical data was also collected in a structural health monitoring (SHM)
mode. In SHM mode, data was collected on the undamaged pipe, and then after each successive
growth in flaw size. Figure 6 shows enveloped waveforms from several SHM states when the second
flaw, located 7 feet from the sensor, was at 0%, 0.5%, 1% and 2% CSA. As shown, the reflection
amplitude increases as the flaw size increases. Additionally, the reflection amplitude from the flaw
at 10 feet from the sensor remains relatively constant, because the size of this flaw remains the same.
Note that the 0.5% and 1% CSA flaws represent a 0.25-inch diameter hole with 0.125-inch depth and
a 0.25-inch diameter hole with 0.236-inch depth, respectively.
Figure 6. Waveform data (amplitude envelope) for SHM states with flaw growth of 0 to 2% CSA for
the flaw located 7 feet from the optical fiber sensor. Waveforms are shown for an excitation
frequency of 76 kHz using the SMS collar and a single direct-bonded FBG optical fiber sensor used as
a receiver. As the flaw grows, the reflected ultrasonic wave energy from the flaw increases. The
optical fiber sensor can clearly be used for flaw sizing.
4.3. Individual FBG Sensor NDT
It is clear from Figures 4 and 6 that the ultrasonic-optical approach can be effective for flaw
detection. This section assesses the ability of a point-like receiver to reliably detect reflections from a
particular flaw location. What is found is that if the flaw is relatively far from the receiving sensor,
then detection is possible at all circumferential locations (see Figure 7). However, if the flaw is
relatively close to the receiving sensor, then detection is less reliable as it is more dependent on the
circumferential location of the FBG relative to the flaw (see Figure 8). This result will be dependent
on the scattering field from the flaw at small sensor-flaw distances, which will vary according to
flaw geometry and ultrasonic wavelength. However, at further distances, for circular and many
Figure 5. F-Scan generated using the SMS collar in pulse-echo mode at 3 feet from the pipe end.Flaw indications are shown at 7 feet and 10 feet from the sensor. Pipe end reflections are shown at−3 feet and 18 feet. There is a higher signal-to-noise ratio for this setup. Note also that the dual coilsallow for directional control of the received wave, suppressing the reverse waves shown in Figure 4.
4.2. Progressive Damage Test in SHM Mode
Hybrid ultrasonic-optical data was also collected in a structural health monitoring (SHM) mode.In SHM mode, data was collected on the undamaged pipe, and then after each successive growthin flaw size. Figure 6 shows enveloped waveforms from several SHM states when the second flaw,located 7 feet from the sensor, was at 0%, 0.5%, 1% and 2% CSA. As shown, the reflection amplitudeincreases as the flaw size increases. Additionally, the reflection amplitude from the flaw at 10 feet fromthe sensor remains relatively constant, because the size of this flaw remains the same. Note that the0.5% and 1% CSA flaws represent a 0.25-inch diameter hole with 0.125-inch depth and a 0.25-inchdiameter hole with 0.236-inch depth, respectively.
Appl. Sci. 2018, 8, x FOR PEER REVIEW 7 of 14
Figure 5. F-Scan generated using the SMS collar in pulse-echo mode at 3 feet from the pipe end. Flaw
indications are shown at 7 feet and 10 feet from the sensor. Pipe end reflections are shown at −3 feet
and 18 feet. There is a higher signal-to-noise ratio for this setup. Note also that the dual coils allow for
directional control of the received wave, suppressing the reverse waves shown in Figure 4.
4.2. Progressive Damage Test in SHM Mode
Hybrid ultrasonic-optical data was also collected in a structural health monitoring (SHM)
mode. In SHM mode, data was collected on the undamaged pipe, and then after each successive
growth in flaw size. Figure 6 shows enveloped waveforms from several SHM states when the second
flaw, located 7 feet from the sensor, was at 0%, 0.5%, 1% and 2% CSA. As shown, the reflection
amplitude increases as the flaw size increases. Additionally, the reflection amplitude from the flaw
at 10 feet from the sensor remains relatively constant, because the size of this flaw remains the same.
Note that the 0.5% and 1% CSA flaws represent a 0.25-inch diameter hole with 0.125-inch depth and
a 0.25-inch diameter hole with 0.236-inch depth, respectively.
Figure 6. Waveform data (amplitude envelope) for SHM states with flaw growth of 0 to 2% CSA for
the flaw located 7 feet from the optical fiber sensor. Waveforms are shown for an excitation
frequency of 76 kHz using the SMS collar and a single direct-bonded FBG optical fiber sensor used as
a receiver. As the flaw grows, the reflected ultrasonic wave energy from the flaw increases. The
optical fiber sensor can clearly be used for flaw sizing.
4.3. Individual FBG Sensor NDT
It is clear from Figures 4 and 6 that the ultrasonic-optical approach can be effective for flaw
detection. This section assesses the ability of a point-like receiver to reliably detect reflections from a
particular flaw location. What is found is that if the flaw is relatively far from the receiving sensor,
then detection is possible at all circumferential locations (see Figure 7). However, if the flaw is
relatively close to the receiving sensor, then detection is less reliable as it is more dependent on the
circumferential location of the FBG relative to the flaw (see Figure 8). This result will be dependent
on the scattering field from the flaw at small sensor-flaw distances, which will vary according to
flaw geometry and ultrasonic wavelength. However, at further distances, for circular and many
Figure 6. Waveform data (amplitude envelope) for SHM states with flaw growth of 0 to 2% CSA forthe flaw located 7 feet from the optical fiber sensor. Waveforms are shown for an excitation frequencyof 76 kHz using the SMS collar and a single direct-bonded FBG optical fiber sensor used as a receiver.As the flaw grows, the reflected ultrasonic wave energy from the flaw increases. The optical fiber sensorcan clearly be used for flaw sizing.
4.3. Individual FBG Sensor NDT
It is clear from Figures 4 and 6 that the ultrasonic-optical approach can be effective for flawdetection. This section assesses the ability of a point-like receiver to reliably detect reflections from aparticular flaw location. What is found is that if the flaw is relatively far from the receiving sensor, thendetection is possible at all circumferential locations (see Figure 7). However, if the flaw is relativelyclose to the receiving sensor, then detection is less reliable as it is more dependent on the circumferential

Appl. Sci. 2018, 8, 727 8 of 14
location of the FBG relative to the flaw (see Figure 8). This result will be dependent on the scatteringfield from the flaw at small sensor-flaw distances, which will vary according to flaw geometry andultrasonic wavelength. However, at further distances, for circular and many corrosion-like flaws,the reflected wave will be detectable at nearly any circumferential location due to the wrapping of thereflected wave path circumferentially around the pipe. Additionally, sweeping inspection frequency togenerate the F-scan further improves the likelihood of detection.
Appl. Sci. 2018, 8, x FOR PEER REVIEW 9 of 14
Figure 7. F-Scans collected using a direct-bonded FBG receiver collocated with the sending collar at
several circumferential locations: (a) top; (b) right side; (c) bottom; and (d) left side of the pipe. Since
the receiver is relatively far from the flaws, both flaws (red ovals) are clearly detectable at all
circumferential locations. Flaw indications are marked by the red ovals. Arrows indicate the axial
location of the fiber optic receiver. Distance is indicated from source/receiver position. When the
receiver is relatively far from the flaw, i.e., multiple pipe circumferences, flaw detection is reliable at
any circumferential location. Note that the indication in (c) at 13 feet (rectangle) is due to a reverse
wave reflection.
Figure 7. F-Scans collected using a direct-bonded FBG receiver collocated with the sending collarat several circumferential locations: (a) top; (b) right side; (c) bottom; and (d) left side of the pipe.Since the receiver is relatively far from the flaws, both flaws (red ovals) are clearly detectable at allcircumferential locations. Flaw indications are marked by the red ovals. Arrows indicate the axiallocation of the fiber optic receiver. Distance is indicated from source/receiver position. When thereceiver is relatively far from the flaw, i.e., multiple pipe circumferences, flaw detection is reliable atany circumferential location. Note that the indication in (c) at 13 feet (rectangle) is due to a reversewave reflection.

Appl. Sci. 2018, 8, 727 9 of 14Appl. Sci. 2018, 8, x FOR PEER REVIEW 10 of 14
Figure 8. F-Scans collected using a direct-bonded FBG receiver 6 feet in front of the sending collar at
several circumferential locations: (a) top; (b) right side; (c) bottom; and (d) left side of the pipe. Since
the receiver is relatively close to the flaws, the best flaw detection occurs directly in line with the flaw
location, while the detection at other circumferential locations is unreliable. Clear flaw indications
are marked by the red ovals and less clear or undetectable flaw indications are marked by dashed red
ovals. Arrows indicate the axial location of the fiber optic receiver. Distance is indicated from the
sending collar. When the receiver is near the flaw, but not at the same circumferential location, flaw
detection is not reliable, due to the use of a point-like sensor.
4.4. Sparse Array NDT
As mentioned at the end of the previous section, to increase flaw detection reliability, a sparse
array of optical fiber sensors could be situated at different circumferential and/or axial locations
along the pipe. This would allow detection of a flaw at any location along a pipe, because if it is close
to one sensor it will also be sufficiently far from other sensors to allow for reliable detection. Several
Figure 8. F-Scans collected using a direct-bonded FBG receiver 6 feet in front of the sending collarat several circumferential locations: (a) top; (b) right side; (c) bottom; and (d) left side of the pipe.Since the receiver is relatively close to the flaws, the best flaw detection occurs directly in line with theflaw location, while the detection at other circumferential locations is unreliable. Clear flaw indicationsare marked by the red ovals and less clear or undetectable flaw indications are marked by dashedred ovals. Arrows indicate the axial location of the fiber optic receiver. Distance is indicated fromthe sending collar. When the receiver is near the flaw, but not at the same circumferential location,flaw detection is not reliable, due to the use of a point-like sensor.
Figure 7 shows F-Scans collected with optical fiber sensors collocated with the collar at fourdistinct circumferential positions (top, right, bottom, and left sides). The axial distance to the two flawsis 7 feet and 10 feet, respectively. Compared to the pipe circumference, this axial distance is relativelylarge compared to the pipe circumference, at 4 and 5.8 times the circumference, respectively. At thisaxial distance, sensors at all four circumferential positions detect both flaw reflections. It is believedthat detection is possible at all circumferential locations because the scattered wave generated by the
Appl. Sci. 2018, 8, 727 10 of 14
interaction of the initial axisymmetric wave and the flaw has had sufficient time to spiral around thepipe by the time the waves return to the receiving sensor locations.
Figure 8 shows F-Scans collected with optical fiber sensors located 6 feet in front of the collar atfour separate circumferential positions. In this setup, the axial distance to the two flaws is 1 foot and4 feet, respectively. This is a relatively small axial distance between the sensors and flaws at 0.6 and2.3 times the circumference, respectively. In this case, the sensor located on the opposite side of the pipefrom the flaw has the lowest reflected wave amplitude from that position. In both cases, the sensor onthe opposite side does not effectively detect the flaw, and the reliability of the other sensor locations forflaw detection is intermittent. This may be due to the smaller amount of energy in the scattered wavefield travelling at high angles relative to the axis of the pipe, and also the natural angular receptionefficiency of the optical sensor which decreases as incident angle increases relative to the pipe axis,with a maximum efficiency at 45◦. The exception is for the sensor at the same circumferential location(directly in line) with the flaw. The sensor on the top of the pipe clearly detects the flaw at 10 feet,and the sensor on the right of the pipe clearly detects the flaw at 7 feet. These results suggest that tohave 100% detection coverage of the pipe using point-like sensors, including at axial distances close tothe sensors, an array of optical fiber sensors is preferred—either circumferentially around the pipe,axially around the pipe, or a combination of the two. An array of sensors can detect flaws regardless ofthe closeness of the optical sensors to the flaws.
4.4. Sparse Array NDT
As mentioned at the end of the previous section, to increase flaw detection reliability, a sparsearray of optical fiber sensors could be situated at different circumferential and/or axial locationsalong the pipe. This would allow detection of a flaw at any location along a pipe, because if it isclose to one sensor it will also be sufficiently far from other sensors to allow for reliable detection.Several sparse arrays were simulated by moving the optical fiber sensors to different locations on thetest pipe. An optical fiber sensor was located at 0 feet, 3 feet, 6 feet and 9 feet from the sending collaron the top, left, bottom, and right sides at each of those axial locations. Data was collected at twolocations at a time until data from all 16 locations was collected. Data from multiple positions is thencombined to allow for an assessment of a variety of sensor array geometries.
In the present work, two optical fiber sensor arrays are considered. Both spiral down the pipe sothat there is one sensor located on the top, right, bottom, and left sides of the pipe, each at a differentaxial location. Group 1 contained sensors on the left, bottom, right, and top, and group 2 containedsensors on the right, top, left, and bottom of the pipe at axial locations of 0 feet, 3 feet, 6 feet and 9 feet,respectively. This is shown schematically in Figure 9. These groups were selected such that group 1had sensors directly in front of the two flaws, while the sensors closest to the flaws in group 2 are onthe opposite side of the pipe (and therefore those two sensors are not expected to easily detect theflaws). Note that the flaws are located on the top and right sides of the pipe at 10 feet and 7 feet fromthe sending collar, respectively.
To combine the four waveforms collected via the four FBGs in each array into a single “groupwaveform”, the individual waveforms are processed by suppressing known position-dependent signalsincluding the dead zone, the direct wave arrival, and the reverse pipe end reflection. When theseevents are present in the signals, the amplitude is reduced to a value of 20 mV, chosen because it isclose to the noise level. The amplitude envelope of each of the four waveforms is also shifted in timeto correspond to their respective positions along the pipe axis. After time-shifting, the waveformsare added, and the average is calculated. Flaws are more easily detectable in the group waveformthan in any individual waveform from a single FBG. Additionally, the combined waveform is morerobust than data from a single location since we are unlikely to miss a flaw due to a particular flawposition relative to a single sensor. Note that in general, the arrival times of these suppressed featureswould be known a priori since the sensor locations are known. This suppression algorithm also adds ajaggedness to the waveforms, as the suppression is applied as a step function. For the data shown in

Appl. Sci. 2018, 8, 727 11 of 14
Figure 10, this jaggedness occurs for the approximate length of the initial wave pulse (1 foot) as thewave passes each sensor location: 1–2 ft, 3–4 ft, 6–7 ft and 9–10 ft.
Appl. Sci. 2018, 8, x FOR PEER REVIEW 11 of 14
sparse arrays were simulated by moving the optical fiber sensors to different locations on the test
pipe. An optical fiber sensor was located at 0 feet, 3 feet, 6 feet and 9 feet from the sending collar on
the top, left, bottom, and right sides at each of those axial locations. Data was collected at two
locations at a time until data from all 16 locations was collected. Data from multiple positions is then
combined to allow for an assessment of a variety of sensor array geometries.
In the present work, two optical fiber sensor arrays are considered. Both spiral down the pipe so
that there is one sensor located on the top, right, bottom, and left sides of the pipe, each at a different
axial location. Group 1 contained sensors on the left, bottom, right, and top, and group 2 contained
sensors on the right, top, left, and bottom of the pipe at axial locations of 0 feet, 3 feet, 6 feet and 9
feet, respectively. This is shown schematically in Figure 9. These groups were selected such that
group 1 had sensors directly in front of the two flaws, while the sensors closest to the flaws in group
2 are on the opposite side of the pipe (and therefore those two sensors are not expected to easily
detect the flaws). Note that the flaws are located on the top and right sides of the pipe at 10 feet and 7
feet from the sending collar, respectively.
Figure 9. Schematic showing sensor locations for array groups 1 (above) and 2 (below). Fiber optic
sensors are indicated by green rectangles and the optical fiber is indicated by the blue line. Dashed
lines indicate the optical fiber and sensor on the far side of the pipe. The pipe is being viewed from
the right side (flaw 2 side).
To combine the four waveforms collected via the four FBGs in each array into a single “group
waveform”, the individual waveforms are processed by suppressing known position-dependent
signals including the dead zone, the direct wave arrival, and the reverse pipe end reflection. When
these events are present in the signals, the amplitude is reduced to a value of 20 mV, chosen because
it is close to the noise level. The amplitude envelope of each of the four waveforms is also shifted in
time to correspond to their respective positions along the pipe axis. After time-shifting, the
waveforms are added, and the average is calculated. Flaws are more easily detectable in the group
waveform than in any individual waveform from a single FBG. Additionally, the combined
waveform is more robust than data from a single location since we are unlikely to miss a flaw due to
a particular flaw position relative to a single sensor. Note that in general, the arrival times of these
suppressed features would be known a priori since the sensor locations are known. This suppression
algorithm also adds a jaggedness to the waveforms, as the suppression is applied as a step function.
For the data shown in Figure 10, this jaggedness occurs for the approximate length of the initial
wave pulse (1 foot) as the wave passes each sensor location: 1–2 ft, 3–4 ft, 6–7 ft and 9–10 ft.
Figure 10 shows F-Scans of the processed group waveforms for both (a) group 1 and (b) group 2
fiber optic sensor arrays over 30 to 100 kHz frequencies generated with the SMS collar. The
combined group 1 and group 2 signals both show good flaw detection capabilities. Both FBG sensor
groups detect the flaws at 7 feet and 10 feet from the collar location, even though multiple sensors in
group 2 are on the far side of the pipe from the flaw to which they are nearest. This confirms that the
potential to miss a flaw based on its relative location to a single sensor is greatly diminished using
this approach versus placing a single fiber sensor at a single axial location. The array approach can
Figure 9. Schematic showing sensor locations for array groups 1 (above) and 2 (below). Fiber opticsensors are indicated by green rectangles and the optical fiber is indicated by the blue line. Dashed linesindicate the optical fiber and sensor on the far side of the pipe. The pipe is being viewed from the rightside (flaw 2 side).
Appl. Sci. 2018, 8, x FOR PEER REVIEW 12 of 14
increase detection confidence. Creating a group signal from sensors at 4 circumferential locations at
a single axial location can also give a similar result. Depending on inspection requirements and
access limitations, different implementations of a sensor array may be desired. Additionally, the
array group signals appear to be more stable over a wider frequency range, which makes for more
reliable interpretation by the inspector. Due to these characteristics, the F-Scans in Figure 10 are
easier to interpret and more reliable for flaw detection than the F-Scans shown in Figures 7 and 8, for
a single fiber sensor at a single axial and circumferential location.
Figure 10. F-Scans of the processed group waveforms for both (a) group 1 and (b) group 2 fiber optic
sensor arrays. Flaws (red ovals) are clearly detected at 7 feet and 10 feet from the sending collar
across a wide range of frequencies. The far pipe end reflection is detected at 18 feet. Note that groups
1 and 2 both detect the flaws even though group 2 has multiple sensors near flaws in non-ideal
locations for efficient flaw detection.
5. Discussion
It is believed that the work presented here represents the first study of flaw detection in pipes
using an ultrasonic-optical system and torsional ultrasonic guided waves. Torsional wave reception
using FBG sensors was successful, and damage detection, monitoring, and localization were
demonstrated. Additionally, one method for increased confidence for flaw detection was
demonstrated, in which signals from a sparse array of optical fiber sensors were combined.
A hybrid ultrasonic-optical inspection system has a wide variety of potential applications. One
application is with permanently-mounted long-range ultrasonic guided wave pipe inspection
collars. The optical fiber could be far from the excitation area and can increase the effective
inspection range from a single sending collar position. Optical fiber sensors may also be used in
places with limited access for traditional collars. The optical cable is very thin (as little as 80 µm
diameter for bare fiber), so it can easily be mounted under coatings. Additionally, the optical fiber
sensors can withstand harsh environments such as high temperature, radiation, and high levels of
electromagnetic interference (EMI). Finally, the optical fiber sensors have a much wider bandwidth
than traditional piezoelectric or magnetostrictive sensors.
Figure 10. F-Scans of the processed group waveforms for both (a) group 1 and (b) group 2 fiber opticsensor arrays. Flaws (red ovals) are clearly detected at 7 feet and 10 feet from the sending collar acrossa wide range of frequencies. The far pipe end reflection is detected at 18 feet. Note that groups 1 and 2both detect the flaws even though group 2 has multiple sensors near flaws in non-ideal locations forefficient flaw detection.
Figure 10 shows F-Scans of the processed group waveforms for both (a) group 1 and (b) group 2fiber optic sensor arrays over 30 to 100 kHz frequencies generated with the SMS collar. The combined
Appl. Sci. 2018, 8, 727 12 of 14
group 1 and group 2 signals both show good flaw detection capabilities. Both FBG sensor groupsdetect the flaws at 7 feet and 10 feet from the collar location, even though multiple sensors in group 2are on the far side of the pipe from the flaw to which they are nearest. This confirms that the potentialto miss a flaw based on its relative location to a single sensor is greatly diminished using this approachversus placing a single fiber sensor at a single axial location. The array approach can increase detectionconfidence. Creating a group signal from sensors at 4 circumferential locations at a single axial locationcan also give a similar result. Depending on inspection requirements and access limitations, differentimplementations of a sensor array may be desired. Additionally, the array group signals appear tobe more stable over a wider frequency range, which makes for more reliable interpretation by theinspector. Due to these characteristics, the F-Scans in Figure 10 are easier to interpret and more reliablefor flaw detection than the F-Scans shown in Figures 7 and 8, for a single fiber sensor at a single axialand circumferential location.
5. Discussion
It is believed that the work presented here represents the first study of flaw detection in pipes usingan ultrasonic-optical system and torsional ultrasonic guided waves. Torsional wave reception usingFBG sensors was successful, and damage detection, monitoring, and localization were demonstrated.Additionally, one method for increased confidence for flaw detection was demonstrated, in whichsignals from a sparse array of optical fiber sensors were combined.
A hybrid ultrasonic-optical inspection system has a wide variety of potential applications.One application is with permanently-mounted long-range ultrasonic guided wave pipe inspectioncollars. The optical fiber could be far from the excitation area and can increase the effective inspectionrange from a single sending collar position. Optical fiber sensors may also be used in places withlimited access for traditional collars. The optical cable is very thin (as little as 80 µm diameter forbare fiber), so it can easily be mounted under coatings. Additionally, the optical fiber sensors canwithstand harsh environments such as high temperature, radiation, and high levels of electromagneticinterference (EMI). Finally, the optical fiber sensors have a much wider bandwidth than traditionalpiezoelectric or magnetostrictive sensors.
Future work should focus on the development of ruggedized and miniaturized opticalcomponents and the demonstration of system effectiveness in field tests. Tests demonstratingan increase in inspection range on buried pipe could open avenues for additional applications.Optical fiber sensors provide unique advantages over traditional sensor types which will encouragetheir use in challenging inspection problems in the future.
Author Contributions: Joseph L. Rose and Jason Philtron contributed the ultrasonic guided wave and hybridaspect of the research work including theory, experiment, and the write up. Guigen Liu, Yupeng Zhu,and Ming Han contributed fiber optic Bragg grating experimental portion of the work and assisted inmanuscript revision.
Funding: The work carried out by J. L. Rose and J. Philtron was funded by Naval Research Laboratory grantnumber N0001417RX00182. The work carried out by G. Liu, Y. Zhu, and M. Han was carried out primarily atUniversity of Nebraska-Lincoln and funded by the Office of Naval Research under Grant N000141712819 andGrant N000141410456.
Acknowledgments: The authors would like to thank Bob Brown and James Tagert at the Naval ResearchLaboratory for making this work possible. The authors would also like to acknowledge Russell Love andCody Borigo for assistance with software and the experimental setup.
Conflicts of Interest: The authors declare no conflict of interest.
References
1. Rose, J.L. Ultrasonic Waves in Solid Media; Cambridge University Press: New York, NY, USA, 1999.2. Rose, J.L. Ultrasonic Guided Waves in Solid Media; Cambridge University Press: New York, NY, USA, 2014.

Appl. Sci. 2018, 8, 727 13 of 14
3. Ditri, J.J.; Rose, J.L.; Chen, G. Mode Selection Guidelines for Defect Detection Optimization Using LambWaves. In Proceedings of the 18th Annual Review of Progress in Quantitative NDE, Brunswick, ME, USA,28 July–2 August 1991; Plenum: New York, NY, USA, 1991; Volume 11, pp. 2109–2115.
4. Pilarski, A.; Ditri, J.J.; Rose, J.L. Remarks on Symmetric Lamb Waves with Dominant LongitudinalDisplacements. J. Acoust. Soc. Am. 1993, 93, 2228–2230. [CrossRef]
5. Rose, J.L.; Soley, L.E. Ultrasonic Guided Waves for Anomaly Detection in Aircraft Components. Mater. Eval.2000, 50, 1080–1086.
6. Rose, J.L.; Sun, Z.; Mudge, P.J.; Avioli, M.J. Guided Wave Flexural Mode Tuning and Focusing for PipeInspection. Mater. Eval. 2003, 61, 162–167.
7. Hayashi, T.; Song, W.J.; Rose, J.L. Guided Wave Dispersion Curves for a Bar with an Arbitrary Cross-section,a Rod and Rail Example. Ultrasonics 2003, 41, 175–183. [CrossRef]
8. Gao, H.; Shi, Y.; Rose, J.L. Guided Wave Tomography on an Aircraft Wing with Leave in Place Sensors.In Review of Quantitative Nondestructive Evaluation; AIP: New York, NY, USA, 2005; Volume 24, pp. 1788–1794.
9. Lee, C.M.; Rose, J.L.; Cho, Y. A Guided Wave Approach to Defect Detection under Shelling in Rail. NDT E Int.2008, 42, 174–180. [CrossRef]
10. Puthillath, P.; Rose, J.L. Ultrasonic Guided Wave Inspection of a Titanium Repair Patch Bonded to anAluminum Aircraft Skin. Int. J. Adhes. Adhes. 2010, 30, 566–573. [CrossRef]
11. Van Velsor, J.; Royer, R.; Owens, S.; Rose, J.L. A Magnetostrictive Phased Array System for Guided WaveTesting and Structural Health Monitoring of Pipe. Mater. Eval. 2013, 71, 1296–1301.
12. Philtron, J.H.; Rose, J.L. Mode Perturbation Method for Optimal Guided Wave Mode and Frequency Selection.Ultrasonics 2014, 54, 1817–1824. [CrossRef] [PubMed]
13. Rose, J.L.; Borigo, C.; Owens, S.; Reese, A. Rapid Large Area Inspection from a Single Sensor Position:A Guided Wave Phased Array Scan. Mater. Eval. 2017, 75, 671–678.
14. Chen, L.; Choi, W.R.; Lee, J.G.; Kim, Y.G.; Moon, H.S.; Bae, Y.C. Oil-Tank Weld Detection Using EMAT. Int. J.Hum. Robot. 2017, 14, 1750008. [CrossRef]
15. Kim, Y.G.; Chen, L.; Moon, H.S. Numerical Simulation and Experimental Investigation of Propagation ofGuided Waves on Pipe with Discontinuities in Different Axial Angles. Mater. Eval. 2016, 74, 1168–1175.
16. Chen, L.; Kim, Y.G.; Bae, Y.C. Long Range Displacement Measurements Systems Using Guided Wave. Int. J.Fuzzy Log. Intell. Syst. 2017, 17, 154–161. [CrossRef]
17. Perez, I.; Cui, H.-L.; Udd, E. Acoustic emission detection using fiber Bragg gratings. In Proceedings of theSPIE’s 8th Annual International Symposium on Smart Structures and Materials, Newport Beach, CA, USA,4–8 March 2001; International Society for Optics and Photonics: Bellingham, WA, USA, 2001.
18. Wild, G.; Hinckley, S. Acousto-ultrasonic optical fiber sensors: Overview and state-of-the-art. IEEE Sens. J.2008, 8, 1184–1193. [CrossRef]
19. Li, F.; Murayama, H.; Kageyama, K.; Shirai, T. Guided wave and damage detection in composite laminatesusing different fiber optic sensors. Sensors 2009, 9, 4005–4021. [CrossRef] [PubMed]
20. Harish, A.V.; Ray, P.; Rajagopal, P.; Balasubramaniam, K.; Srinivasan, B. Detection of fundamental shearhorizontal mode in plates using fibre Bragg gratings. J. Intel. Mater. Syst. Struct. 2016, 27, 2229–2236.[CrossRef]
21. Ray, P.; Rajagopal, P.; Srinivasan, B.; Balasubramaniam, K. Feature-guided wave-based health monitoring ofbent plates using fiber Bragg gratings. J. Intel. Mater. Syst. Struct. 2017, 28, 1211–1220. [CrossRef]
22. Liu, G.; Philtron, J.H.; Zhu, Y.; Rose, J.L.; Han, M. Detection of Fundamental Shear Horizontal Guided WavesUsing a Surface-bonded Chirped-fiber-Bragg-grating Fabry-Perot Interferometer. IEEE J. Lightwave Technol.2018, 36, 2286–2294. [CrossRef]
23. Hu, Y.; Zhao, M.; Li, S. Pipeline Defect Detection Based on Ultrasonic Guided Wave Technique Using FiberBragg Gratings. In Proceedings of the International Conference on Pipelines and Trenchless Technology(ICPTT), Wuhan, China, 19–22 October 2012; pp. 996–1010.
24. Ray, P.; Srinivasan, K.; Rajagopal, P. Fiber Bragg Grating-based Detection of Cross Sectional Irregularitiesin Metallic Pipes. In Proceedings of the SPIE, 25th International Conference on Optical Fiber Sensors, Jeju,South Korea, 24–28 April 2017; pp. 1–4.

Appl. Sci. 2018, 8, 727 14 of 14
25. Trémolet de Lacheisserie, E. Magnetostriction: Theory and Applications of Magnetoelasticity; CRC Press:Boca Raton, FL, USA, 1993; Volumes 339–352, pp. 359–361.
26. Zhang, Q.; Zhu, Y.; Luo, X.; Liu, G.; Han, M. Acoustic Emission Sensor System Using a ChirpedFiber-Bragg-grating Fabry-Perot Interferometer and Smart Feedback Control. Opt. Lett. 2017, 42, 631–634.[CrossRef] [PubMed]
© 2018 by the authors. Licensee MDPI, Basel, Switzerland. This article is an open accessarticle distributed under the terms and conditions of the Creative Commons Attribution(CC BY) license (http://creativecommons.org/licenses/by/4.0/).