a hybrid prediction and assessment quality of experience
TRANSCRIPT

A Hybrid Prediction and Assessment Quality of
Experience Approach for Videostreaming Applications over
Wireless Mesh Networks
André F. Riker1, Elisangela S. Aguiar
234, Diogo C. B. Cardoso
5, Patrícia A. de
Oliveira4, Eduardo Cerqueira
1256, Antônio J. G. Abelém
1
1Post-graduate Program in Computer Science, Federal University of Pará
2Post-graduate Program in Electrical Engineering, Federal University of Pará
3Federal Service of Data Processing (SERPRO)
4Amazon University (UNAMA)
5Faculty of Computer Engineering, Federal University of Para (FEC/UFPA)
6Centre for Informatics and Systems of the University of Coimbra, Portugal (CISUC)
{afr, eaguiar, cerqueira, abelem}@ufpa.br, {dogobenassuly, haroldopg}@gmail.com, [email protected]
Abstract. As Wireless Mesh Networks (WMNs) have been increasingly
deployed, the need of new quality measurement schemes became essential
since operators want to control and optimize their network resources, while
keeping users of multimedia applications with a good quality level. However,
currently WMN in-service assessment schemes fails in capturing subjective
aspects of real-time multimedia content related to the user perception.
Therefore, this paper proposes a new on-the-fly quality estimator approach,
called Hybrid Quality of Experience (HyQoE) Prediction, for real-time
videostreaming applications. Moreover, performance evaluation results
present the benefits and accuracy of HyQoE in predicting the user perception
compared to well-know subjective and objective methods in a WMN scenario.
1. Introduction
Recent advances in wireless communications and real-time multimedia applications, as
well as, the explosion in the numbers of users are changing the Internet and creating a
wireless content-aware multimedia era. Regarding wireless systems, Wireless Mesh
Networks (WMNs) [Akyildiz and Wang 2009], based on the IEEE 802.11 standard, is
the most interesting solution for low cost and quality level support in last mile networks.
Regarding real-time multimedia, new thousands of users and providers are sharing their
content ubiquitously, where quality level assurance is the main requirement to the
success of such multimedia systems.
Before the beginning of multimedia communication era, simple network/packet
level parameters, such as bandwidth, loss, delay or other network-related metrics were
enough to evaluate the Quality of Service (QoS) of applications, because the provided
services are plain applications, such as e-mail or file transfer. These applications do not
have strict quality level requirements, for example, with file transfer, bandwidth or
delay would probably be sufficient to imply quality of service.
However, real-time multimedia applications are being deployed on IP networks
and technical parameters can no longer assess accurately the quality of service as it is
XXIX Simpósio Brasileiro de Redes de Computadores e Sistemas Distribuídos 367

perceived by human. Users expect to have good perceptual quality that can be derived
from many factors, including not only technical parameters, but also user’s experience.
The problem is that it is not easy to accurately assess the performance of
multimedia applications, as the quality perceived by the end-user is a very subjective
concept. In the context of real-time videostreaming applications, QoS measurements
become not sufficient for evaluating the quality of delivered video, especially that they
do not consider user satisfaction. For this reason, many researches have started to study
the evaluations of Quality of Experience (QoE), which can be considered as the overall
performance of a system from user’s perspective.
Different subjective and objective assessment tools have been developed and
applied trying to effectively evaluate the user perception. In brief, subjective assessment
[ITU-R 2002] consists of human observers rating the overall quality of an image or a
sequence. On the other hand, objective assessment [Park et al. 2006] [Manish and
Constantine 2007] stands for the use of techniques (generally signal processing
algorithms) to produce automotive, quantitative and repeatable measures of visual
quality. However, each approach still has its own limitations. Thus, a hybrid assessment
has been proposed in [Rubino et al. 2006] [Bonnin et al. 2008] to cope with the
limitations of both subjective and objective methods.
This paper proposes a Hybrid Quality of Experience (HyQoE) prediction
scheme that can evaluate the quality level of a video sequence automatically, in real-
time and correlates well with the results obtained from subjective tests. In order to
assesse the QoE of the video perceived by end-user, a tool was built taking as input the
values of a set of parameters related to the video and encoder characteristics, and
correspondingly quantifies the video quality.
HyQoE is based on statistic learning using random neural network (RNN) and
was trained with real videos generated over a simulated wireless mesh scenario.
Performance evaluation results show how the HyQoE tool can evaluate the multimedia
quality in a manner that is close to real human observations, and in real-time.
Consequently, HyQoE outperforms the well-known objectives metrics and also the
subjective methods for evaluating the perceived video quality.
The remainder of the paper is organized as follows. Section II describes some
related works. In Section III we introduce a comparison overview of the three
assessment approaches. Section IV explains HyQoE for videostreaming over wireless
mesh networks. The test environment, scenario, implementations, results of experiments
and simulations are described in Section V. Finally, Section VI gives conclusion as well
as future works about QoE prediction.
2. Related Works
Real-time videostreaming has strong constrained that lead to a series of specific
technical problems. The most important one is that videostreaming quality, as perceived
by the user, is very sensitive to frame losses [Cancela et al. 2008].
A hybrid assessment tool called Pseudo-Subjective Quality Assessment (PSQA)
has been proposed in [Mohamed 2002] [Rubino et al. 2006] [Bonnin et al. 2008]. Using
PSQA, some works have been done using hybrid technique [Piamrat et al. 2009], for
368 Anais
example, VoIP over WLANs [Rubino et al. 2006], video application over DiffServ
networks or IPTV over peer-to-peer networks [Cancela et al. 2008].
[Piamrat et al. 2009] presents performance evaluation of hybrid approach for
assessing QoE in videostreaming application over wireless networks in different
network conditions (using variation of loss rate and its distribution), but the results are
compared only with Peak Signal to Noise Ratio (PSNR).
Ghareeb and Viho (2010) focus in to determine the most appropriate method for
assessing the QoE in the context of Multiple Description Coding (MDC)
videostreaming, over multiple overlay paths, in video distribution networks (VDN). For
this objective, it compares three different types of QoE assessment approaches
(subjective, objective and a hybrid) that can overcome the limitations of both subjective
and objective ones. Results show how the PSQA can out perform only the well-known
PSNR, as well as, the subjective methods for evaluating the perceived video quality in
context of MDC streaming.
Koumaras et al. (2010) proposes, describes and evaluates a novel framework for
video quality prediction of MPEG-based video services, considering the perceptual
degradation that is introduced by the encoding process and the provision of the encoded
signal over an error-prone wireless or wired network.
RNN has received, since its inception in 1989, considerable attention and has
been successfully used in a number of prediction applications. Details about RNN out
scope of this paper, but, for further information please see a study in Mohamed and
Rubino (2002). On the other hand, for QoE evaluating, RNN is better than a traditional
neural network [Mohamed 2002] [Timotheou 2009] [Georgiopoulos 2010], and its use
is mandatory for future comparison with other techniques for assessing the performance
of HyQoE. In Georgiopoulos et al. (2010), a critical review paper is presented and
focused on the feed-forward RNN model and its ability to solve classification problems.
HyQoE and PSQA use RNN, but differences can be listed as follows. PSQA is
not applied in wireless mesh networks, which is becoming very popular nowadays.
HyQoE uses a database of videos obtained by simulation taking advantage of a client's
infrastructure backbone. The videos are embedded the Network Simulator, transmitted
and reconstructed with the aid of Evalvid and MSU tools. In PSQA proposals, losses are
only included in the simulated traces of the videos and not real scenarios.
Using a greater videos variety, HyQoE takes into account six parameters
(percents losses in I frame, P frame and B frame, general loss, complexity and motion)
that directly impact the quality of the video to Mean Opinion Score (MOS) predict. In
general, the other hybrid approaches mostly use only QoS parameters, such as average
length of burst, packet loss and without considering the diversity of movement and/or
complexity. HyQoE is compared with the PSNR, Structural Similarity Index Metric
(SSIM) and Video Quality Metric (VQM) metrics, while others schemes only were
compared with PSNR, which not suitable for video QoE assessment.
3. Quality of Experience Assessment Approaches
3.1 Subjective Assessment The most accurate approach to assess perceived quality is the subjective assessment
because there is no better indicator of video quality than the one given by humans.
XXIX Simpósio Brasileiro de Redes de Computadores e Sistemas Distribuídos 369
2255
log10MSE
PSNR = ( ) ( )åå= =
-=M
m
N
n
nmdnmoNM
MSE1
2
1
,,.
1
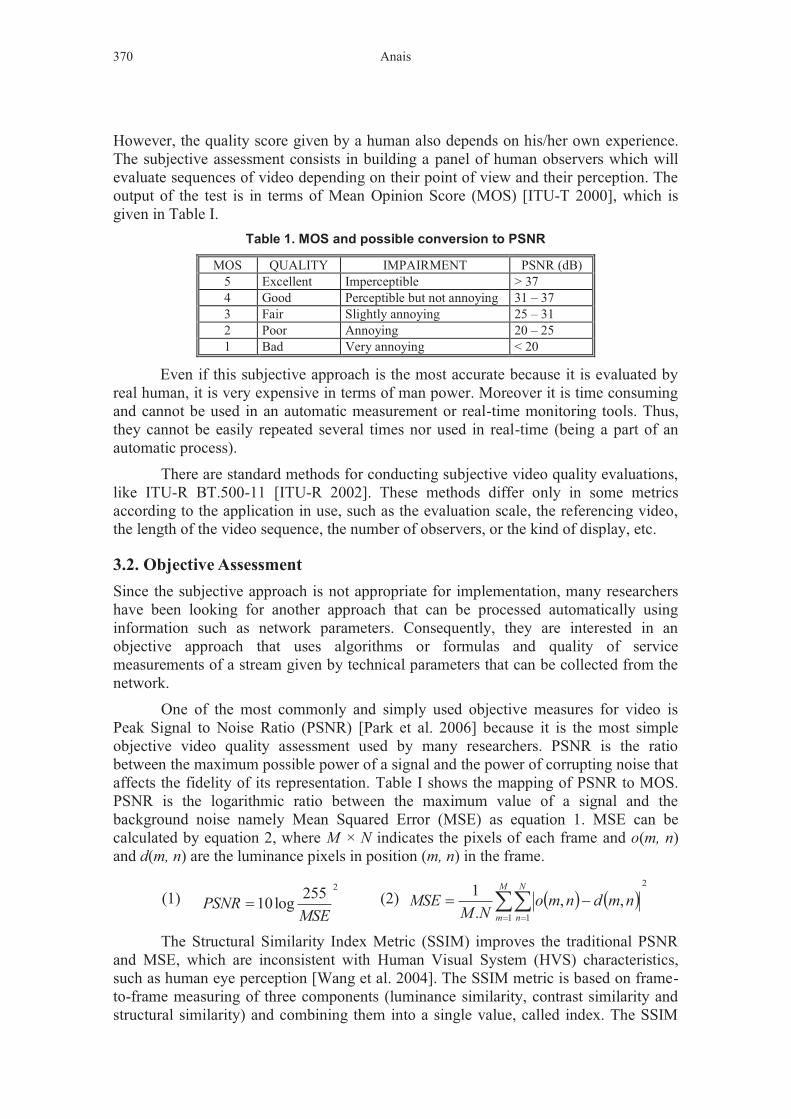
However, the quality score given by a human also depends on his/her own experience.
The subjective assessment consists in building a panel of human observers which will
evaluate sequences of video depending on their point of view and their perception. The
output of the test is in terms of Mean Opinion Score (MOS) [ITU-T 2000], which is
given in Table I.
Table 1. MOS and possible conversion to PSNR
MOS QUALITY IMPAIRMENT PSNR (dB)
5 Excellent Imperceptible > 37
4 Good Perceptible but not annoying 31 – 37
3 Fair Slightly annoying 25 – 31
2 Poor Annoying 20 – 25
1 Bad Very annoying < 20
Even if this subjective approach is the most accurate because it is evaluated by
real human, it is very expensive in terms of man power. Moreover it is time consuming
and cannot be used in an automatic measurement or real-time monitoring tools. Thus,
they cannot be easily repeated several times nor used in real-time (being a part of an
automatic process).
There are standard methods for conducting subjective video quality evaluations,
like ITU-R BT.500-11 [ITU-R 2002]. These methods differ only in some metrics
according to the application in use, such as the evaluation scale, the referencing video,
the length of the video sequence, the number of observers, or the kind of display, etc.
3.2. Objective Assessment
Since the subjective approach is not appropriate for implementation, many researchers
have been looking for another approach that can be processed automatically using
information such as network parameters. Consequently, they are interested in an
objective approach that uses algorithms or formulas and quality of service
measurements of a stream given by technical parameters that can be collected from the
network.
One of the most commonly and simply used objective measures for video is
Peak Signal to Noise Ratio (PSNR) [Park et al. 2006] because it is the most simple
objective video quality assessment used by many researchers. PSNR is the ratio
between the maximum possible power of a signal and the power of corrupting noise that
affects the fidelity of its representation. Table I shows the mapping of PSNR to MOS.
PSNR is the logarithmic ratio between the maximum value of a signal and the
background noise namely Mean Squared Error (MSE) as equation 1. MSE can be
calculated by equation 2, where M × N indicates the pixels of each frame and o(m, n)
and d(m, n) are the luminance pixels in position (m, n) in the frame.
(1) (2)
The Structural Similarity Index Metric (SSIM) improves the traditional PSNR
and MSE, which are inconsistent with Human Visual System (HVS) characteristics,
such as human eye perception [Wang et al. 2004]. The SSIM metric is based on frame-
to-frame measuring of three components (luminance similarity, contrast similarity and
structural similarity) and combining them into a single value, called index. The SSIM
370 Anais
index is a decimal value between 0 and 1, where 0 means no correlation with the
original image, and 1 means the exact same image.
Another objective metric is the Video Quality Metric (VQM) method defines a
set of computational models that also have been shown to be superior to traditional
PSNR and MSE metrics [Revés et al. 2006]. The VQM method takes as input the
original video, the processed video, verifies the multimedia quality level based on
human eye perception and subjectivity aspects, including blurring, global noise, block
distortion and color distortion. The VQM evaluation results vary from 0 to 5 values,
where 0 is the best possible score.
3.3. Hybrid Assessment
Apart from the two approaches described previously, one hybrid assessment called
Pseudo-Subjective Quality Assessment (PSQA) [Mohamed 2002] [Rubino 2010] has
been created to provide accurate QoE assessment as perceived by human. PSQA
[Bonnin et al. 2008] allows quantifying the quality of a videostreaming at the receiving
end, in a manner that is very close to the human observations, and in real-time.
The hybrid assessment is a subjective evaluation in the methodology, but this
stage can be done only once and used as many times as necessary with the help of
quality factors (objective parameters previous selected). An important point of HyQoE
is that they are based on statistic learning using RNN. The idea of both is to train the
RNN to learn the mapping between QoE score and technical parameters so the trained-
RNN can used as a function to give QoE score in real-time.
Thus, it is necessary to understand that HyQoE is an application and system-
dependent tool, if other network technologies were used, e.g., Wimax, other parameters
would be considered and videostreaming quality prediction would be different.
Therefore, a new training stage must be done for every new application. However, as
mentioned before, the training procedure is done once and then the trained network can
be used in real-time and as many times as necessary.
4. QoE-Assessment for videostreaming
4.1. MPEG Video Structure
The MPEG standard [Mitchell and Pennebaker 1996] defines three frame types for the
compressed videostreams, namely I (Intra-coded), P (Predictive-coded) and B (Bi-
directionally predictive-coded) frames. The frame classification is mainly based on the
procedure, according to which each frame type has been generated and encoded. The
successive frames between two succeeding I frames define a Group of Pictures (GoP).
In the MPEG literature the GoP pattern is described by two parameters GoP (N,
M), where N defines the GoP length (i.e. the total number of frames within each GoP)
and M is the number of B frames between I-P or P-P frames, as shown in Figure 1.
In the Figure 1, the arrows indicate the encoding/decoding correlation between
the frames and more specifically that the B and P frames depend on the respective
preceding and succeeding I or P frames. In the MPEG codec, the I-frame coding
technique is limited to process the video signal on a spacial basis, relative only to data
within the current I-frame. However, this codec has more efficiency compression in the
XXIX Simpósio Brasileiro de Redes de Computadores e Sistemas Distribuídos 371

P-frames and B-frames since the technique used in theses frames explore temporal
or/and time-based redundancies.
Figure 1: MPEG GoP struture.
As shown in Figure 1, in a GoP an I-frame is the main reference of a P and B
frames, and the I-frame are coded with no reference to any other frame. Besides that, P-
frames are predicted from I-frames and from other P-frame, although only in the
forward time manner. Each P-frame within the GoP is predicted from the frame
immediately preceding it (an I-frame or a P-frame). The B-frame uses
forward/backward interpolated prediction from the previous I and P frames, as well as
from the succeeding I and P frames, as shown on the Figure 1. However B-frames are
not used to predict other frames.
4.2. HyQoE for videostreaming MPEG
4.2.1. HyQoE Implementation
In order to implement the HyQoE approach, it is summarized below the four steps that
are necessary for its implementation and validation.
4.2.1.1. Quality-affecting factors
The hierarchical structure of MPEG encoding allows to identify different impact levels
that an IP packet loss has on viewer’s quality of experience. If the network drops, at
least, one IP packet within an I-frame, the errors will be propagated through the rest of
the GoP, because the MPEG decoder uses the I-frame as the reference frame for all
others frames within a GoP. When this occurs, the video quality will be recovered only
when the decoder receives an unimpairment I-frame. If the dropped packet is a P-frame,
the impairments will be extended through the remainder of the GoP. At last, if the
dropped packet is a B-frame, the damage will affect only that particular frame.
Besides that, the impact of a dropped packet varies with the video motion. This
occurs because high-motion content should have low temporal redundancy and this
makes the B and P-frames larger. With larger P-frames, a greater probability exists that
the loss will affect a P-frame. In comparison, low-motion videos allow the P and B
frames to be more compressed, in this case the probability of a loss affect an I-frame is
greater.
Another parameter that has impact in the video quality prediction is the
complexity. This occurs because when a frame is damaged, the interpolation algorithm
in the decoder tries to predict the loss data using neighboring information. If the frame
complexity is high, the interpolation algorithm does not achieve high performance
because the different kinds of texture that a complex video has.
Finally, in this first stage, it is selected a set of quality affecting factors that have
an impact on overall video quality. The selected parameters were: percentage of I-
372 Anais

frame, P-frame and of B-frame losses, overall loss percentage, video motion and
complexity estimations. As mentioned before, each type of frame can distort differently
the quality perceived by the user because each one propagates errors into the GoP
differently. The motion parameter was selected because it changes the loss probability
of each frame types distributed over the network, while complexity modifies the
behavior of the interpolation algorithm of the MPEG.
4.2.1.2. Distorted video database generation
For generate a distorted video database, ten videos were selected from the Video Trace
Library (2011). The selected videos have high, medium and low level of motion and
complexity. The Figure 2.a) shows that four videos have low motion, two videos have
medium motion and four videos have high motion.
Figure 2: a) Motion and complexity video estimation. b) Selected videos
In the Figure 2.a) is possible to see that the relation between motion and
complexity is not proportional. In four videos (3, 4, 5 and 9), the difference between
motion-complexity was more than 70%. The name and the frame quantity of each video
selected is shown in the Figure 2.b), respectively.
To obtain the motion and complexity values shown in the Figure 2.a) an
algorithm was used to calculate the motion estimative based on absolute differences
between frames. The algorithm used to calculate the complexity estimative was adapted
from [ITU-T 2000] proposed for single images which is a measure for image activity
that is derived from the amount of edges in an image.
After selecting the set of quality affecting factors, was necessary, in this stage, to
choose a mode to vary the selected set of parameters. In order to do this into a simulated
scenario and with as different as possible wireless network conditions, a client was
positioned randomly into the scenario receiving from the gateway the original video
previously selected. During the simulation experiments, users received videos with
XXIX Simpósio Brasileiro de Redes de Computadores e Sistemas Distribuídos 373
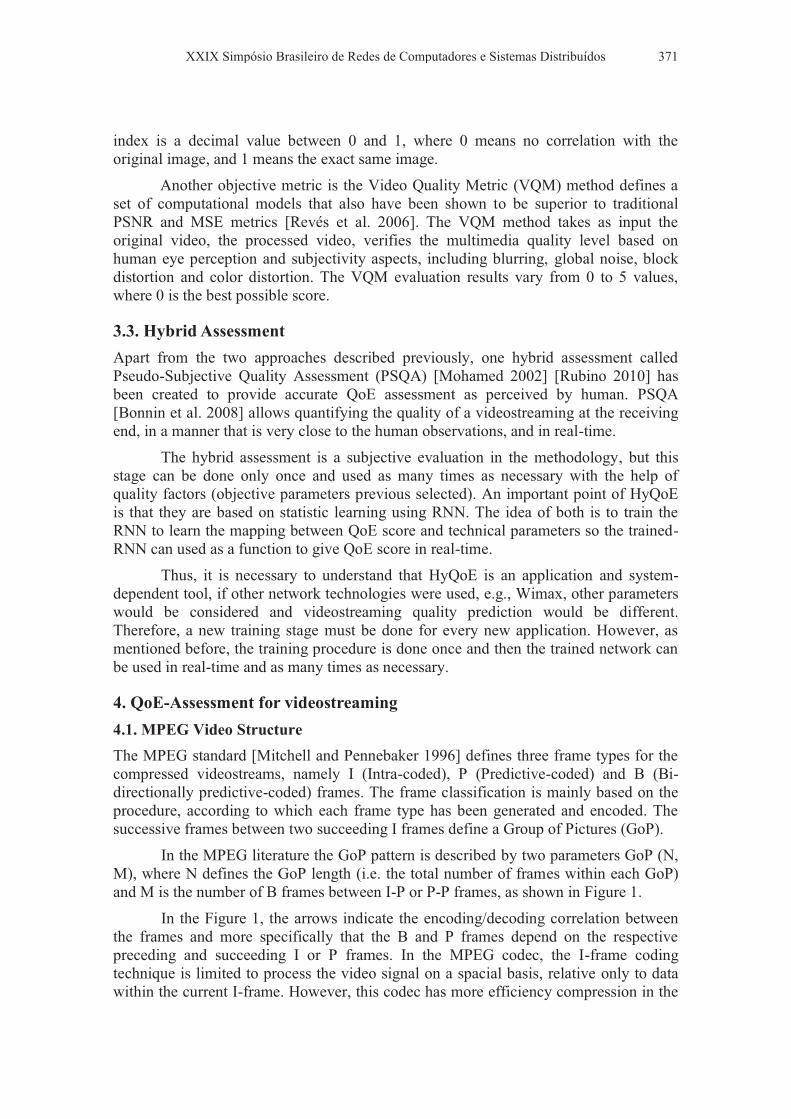
different quality level (according to current network conditions and video impairment).
This stage is visible in the first part of the Figure 3.
4.2.1.3. Subjective Quality Assessment
In the third stage, the video database was evaluated subjectively. For that, its was asked
for a panel of human observers to evaluate the distorted videos. The MOS was
computed using an average score obtained from all observers and the corresponding
MOS was put into two separated databases called training and validation databases, as
shown in Figure 3. For subjective evaluation was used a MOS system based on the
[ITU-T 2000] recommendations with a total of 25 non-expert observers.
4.2.1.4. Learning of the quality behavior with RNN
As presented in Figure 3, after humans evaluating each distorted video with specific
parameters conditions, the training process was done with the training video database in
order to obtain the mapping between the selected parameters and human scores. Upon
the tool has been trained, it was proposed a function f that can map the selected
parameters into MOS. After the training process, the validation task is accomplished
with the validation video database to ensure that the training were acceptable.
Figure 3. Methodology of HyQoE
Once RNN has been trained and validated, HyQoE can be used for real-time
QoE prediction without any interaction from real viewers. It is necessary to measure the
quality-affecting parameters at time t and to evaluate these values with the RNN to
obtain the instantaneous perceived quality. HyQoE gives scores in terms of MOS as
close as possible as a human MOS. This is the most beneficial advantage in using
HyQoE.
5. Performance Evaluation and Results
5.1. Test Environment and Scenario
Advances in WMNs are essential for the future of next generation wireless systems.
Therefore, IEEE 802.11s networks were selected to implement, evaluate and validate
HyQoE. As before mentioned in the Figure 2.b), ten videos were encoded with H.264
and have different patterns (duration, complexity and motion).
374 Anais

The selected scenario is based on Federal University of Pará mesh backbone,
which is formed of six mesh routers being two gateways as depicted in Figure 4.
Additionally to the mesh backbone, a mesh client was simulated receiving
videostreaming from the gateway 1 or 2. The client suffers from different loss rate
because, for each simulation, the client localization (different wireless conditions) was
chosen randomly.
Figure 4: Mesh backbone.
5.2. Implementation
The simulation experimens were carried out by using Network Simulator 2.34 and
Evalvid tool [Evalvid, 2011]. For the HyQoE, a RNN was built using the Random
Neural Network Simulator 2 [RnnSinn, 1999]. In order to make a comparison between
HyQoE approach and existing metrics, it was evaluated together with well-known
objective metrics, PSNR, SSIM and VQM, by using the MSU tool [MSU, 2011].
Through Evalvid simulations were able to generate the real simulated video. In
order to provide an enough video database, each selected video was simulated 50 times,
obtaining a total of 500 videos with different loss patters. From this database, 400
videos was selected for the training base and 100 videos selected for the validation
database. This selection was made randomly.
5.3. Results
In this section are shown the obtained scores of MOS, PSNR, SSIM, VQM and HyQoE,
respectively. Each of them are discussed and analyzed. The results of objective metrics
were normalized by mathematical functions into MOS standard scale.
5.3.1. MOS and Loss
The validation video database consists of 100 videos. The possible MOS scores is 1 to 5
but as shown in Figure 5 the obtained average MOS interval is 1 to 4.5 and the general
XXIX Simpósio Brasileiro de Redes de Computadores e Sistemas Distribuídos 375

MOS average is 2,51. The losses interval is from 1 to 80 percent and the general loss
average is 20,04 percent.
Figure 5: a) Subjective scores of each video and the loss % of I-frame. b) Subjective scores of each video and the loss % of B-frame. c) Subjective scores of each video and
the loss % of P-frame.
The Figure 5 shows the percent losses of each frame type related with each
video and the obtained MOS. The Figures 5.a), 5.b) and 5.c) illustrate that the MOS
values tend to be inversely proportional to the loss frame and the loss pattern for each
type of frame are similar. However the Figure 5.a), 5,b) and 5.c) are different mainly
due to the mentioned MPEG hierarchal structure. For example, the Figure 5.c) shows
that the B-frames are more damaged. This occurs because when a video loss an I-frame
or a P-frame, consequently, a B-frame is affected. However, the impact of quality that a
damaged B-frame produced is not as relevant as a damaged I-frame.
In general, the Figure 5 depicts that when the loss frame is higher than 50 %, the
MOS is close to 1, which means very poor quality. This occurs because the users react
strongly to high levels of loss frame (I, P or B). On the other hand, the most difficult
videos to evaluate are that ones with loss rage of 0-50%, because in this interval the
relation between MOS and loss frame is closer.
5.3.2. PSNR scores
According to [Gross et al. 2004] there is a heuristic mapping of PSNR to MOS as
shown in Table I.
Figure 6: PSNR scores
The obtained PSNR general average score is 1,89 and the Figure 6 shows that
PSNR does not have a great variance when the subjective scores are high. For example,
376 Anais
in the videos 70-100, the PSNR results were out of the standard deviation interval.
These results were poor because the PSNR algorithm does not consider the Human
Visual System (HVS) and the MPEG structure during the assessment process.
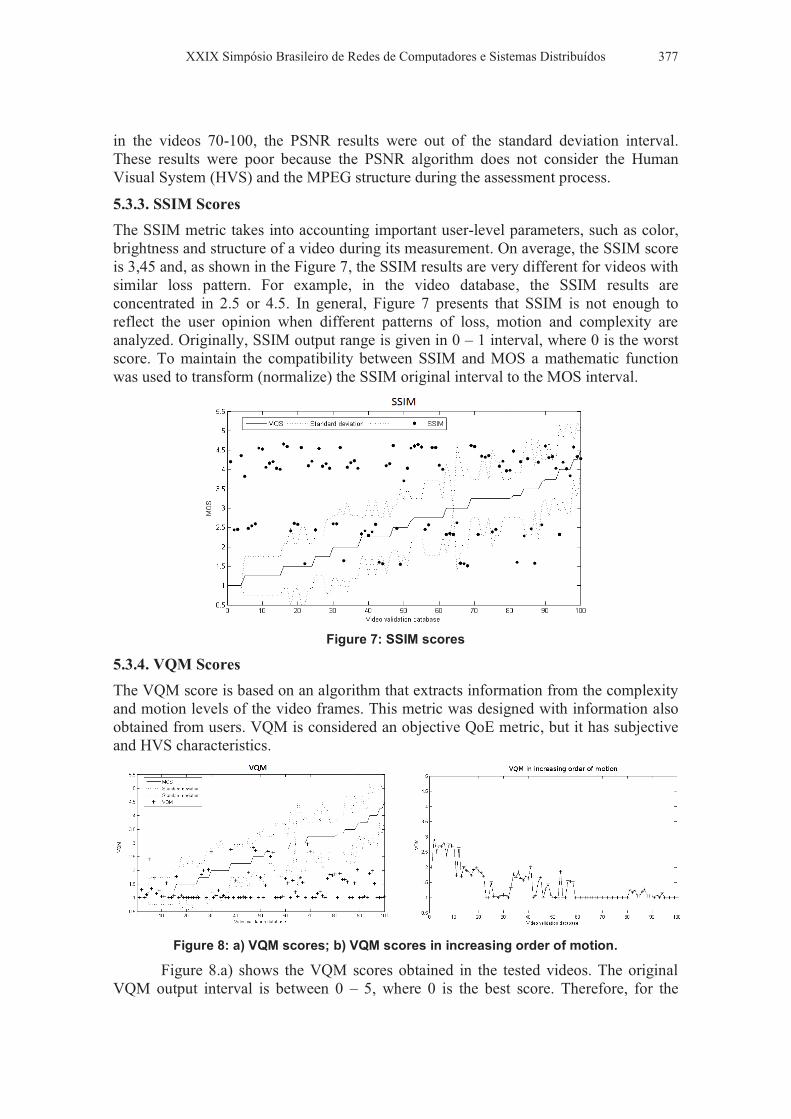
5.3.3. SSIM Scores
The SSIM metric takes into accounting important user-level parameters, such as color,
brightness and structure of a video during its measurement. On average, the SSIM score
is 3,45 and, as shown in the Figure 7, the SSIM results are very different for videos with
similar loss pattern. For example, in the video database, the SSIM results are
concentrated in 2.5 or 4.5. In general, Figure 7 presents that SSIM is not enough to
reflect the user opinion when different patterns of loss, motion and complexity are
analyzed. Originally, SSIM output range is given in 0 – 1 interval, where 0 is the worst
score. To maintain the compatibility between SSIM and MOS a mathematic function
was used to transform (normalize) the SSIM original interval to the MOS interval.
Figure 7: SSIM scores
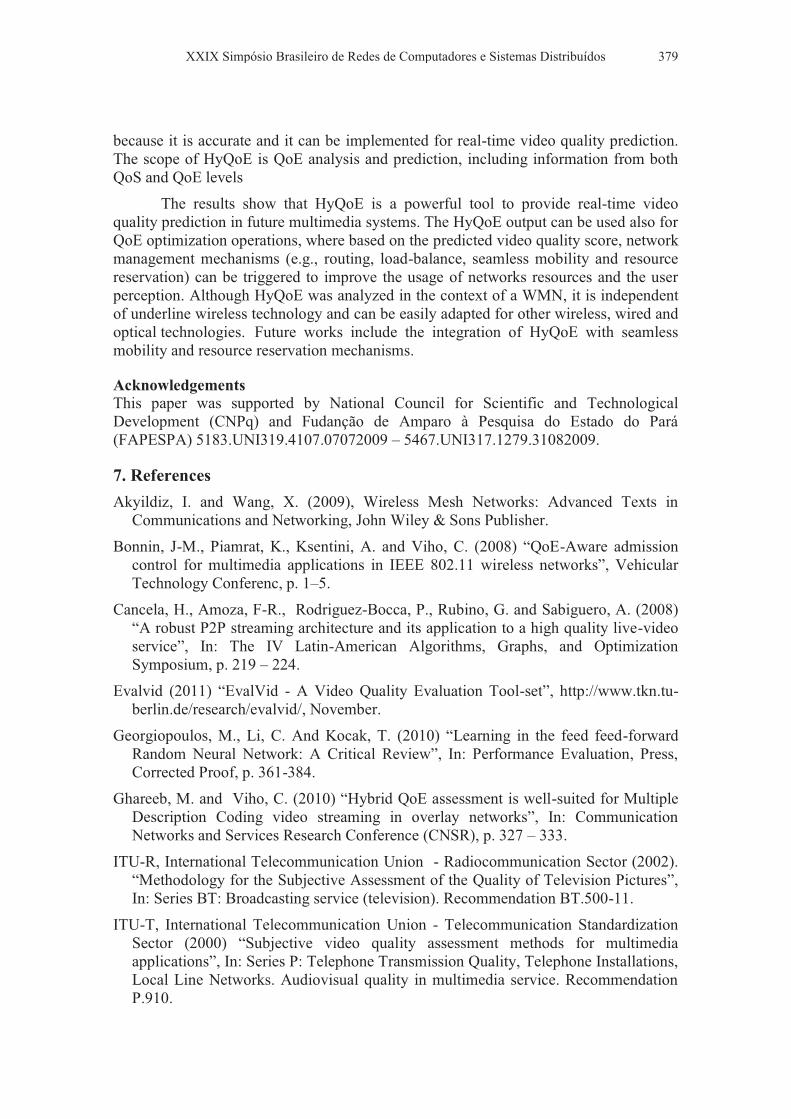
5.3.4. VQM Scores
The VQM score is based on an algorithm that extracts information from the complexity
and motion levels of the video frames. This metric was designed with information also
obtained from users. VQM is considered an objective QoE metric, but it has subjective
and HVS characteristics.
Figure 8: a) VQM scores; b) VQM scores in increasing order of motion.
Figure 8.a) shows the VQM scores obtained in the tested videos. The original
VQM output interval is between 0 – 5, where 0 is the best score. Therefore, for the
XXIX Simpósio Brasileiro de Redes de Computadores e Sistemas Distribuídos 377

compatibility of VQM output score and the subjective interval, VQM values were
normalized into a subjective interval.
As shown in the Figure 8.a), this metric does not have a satisfactory result for
the video database tested. A reason for this lack of performance is that the range of loss,
motion and complexity in the test database were very large. As presented before (Figure
2), the video database has 4 videos with low motion, two videos with medium motion
and 4 videos with high motion.
In order to introduce the VQM behavior Figure 8.b) illustrates the VQM scores
in increasing order of motion and how it tends to be inversely proportional to the
motion. The first interval (1 - 40 videos) is composed of four low motion videos and the
VQM average is 1,8. The second interval (41-60) is formed of two medium motion
videos and VQM average score is 1,31. The third interval (60 - 100) includes four high
motion videos and the VQM average score is 1,04. Therefore, all these features in the
tested videos contributed to VQM generate low scores.
5.3.5. HyQoE Approach
Figure 9 depicts the HyQoE and MOS scores. Each point in the Figure 9 is the HyQoE
score when it was submitted to the validation database. It is possible to observe that for
videos with MOS under 2, HyQoE approach sometimes super estimate the MOS, but
the difference between them do not exceed 1,5 MOS point and rarely the prediction is
far from the standard deviation interval. This super estimation is because humans pay
more attention to the period of video where they have seen the worst quality and then
they give pessimistic scores.
The general average score of HyQoE approach is 2,47. The results present that
the scores given by the HyQoE have better accuracy than the others QoE metrics
analyzed. These results demonstrate that the training database has an enough quantity of
information for RNN learning and the chosen parameters selected have a great relation
with the subjective score.
Figure 9: HyQoE scores
6. Conclusions and Future Work
This paper has presented different QoE measurement approaches. It can be seen that
HyQoE approach has advantages from both subjective and objective approaches,
378 Anais
because it is accurate and it can be implemented for real-time video quality prediction.
The scope of HyQoE is QoE analysis and prediction, including information from both
QoS and QoE levels
The results show that HyQoE is a powerful tool to provide real-time video
quality prediction in future multimedia systems. The HyQoE output can be used also for
QoE optimization operations, where based on the predicted video quality score, network
management mechanisms (e.g., routing, load-balance, seamless mobility and resource
reservation) can be triggered to improve the usage of networks resources and the user
perception. Although HyQoE was analyzed in the context of a WMN, it is independent
of underline wireless technology and can be easily adapted for other wireless, wired and
optical technologies. Future works include the integration of HyQoE with seamless
mobility and resource reservation mechanisms.
Acknowledgements
This paper was supported by National Council for Scientific and Technological
Development (CNPq) and Fudanção de Amparo à Pesquisa do Estado do Pará
(FAPESPA) 5183.UNI319.4107.07072009 – 5467.UNI317.1279.31082009.
7. References
Akyildiz, I. and Wang, X. (2009), Wireless Mesh Networks: Advanced Texts in
Communications and Networking, John Wiley & Sons Publisher.
Bonnin, J-M., Piamrat, K., Ksentini, A. and Viho, C. (2008) “QoE-Aware admission
control for multimedia applications in IEEE 802.11 wireless networks”, Vehicular
Technology Conferenc, p. 1–5.
Cancela, H., Amoza, F-R., Rodriguez-Bocca, P., Rubino, G. and Sabiguero, A. (2008)
“A robust P2P streaming architecture and its application to a high quality live-video
service”, In: The IV Latin-American Algorithms, Graphs, and Optimization
Symposium, p. 219 – 224.
Evalvid (2011) “EvalVid - A Video Quality Evaluation Tool-set”, http://www.tkn.tu-
berlin.de/research/evalvid/, November.
Georgiopoulos, M., Li, C. And Kocak, T. (2010) “Learning in the feed feed-forward
Random Neural Network: A Critical Review”, In: Performance Evaluation, Press,
Corrected Proof, p. 361-384.
Ghareeb, M. and Viho, C. (2010) “Hybrid QoE assessment is well-suited for Multiple
Description Coding video streaming in overlay networks”, In: Communication
Networks and Services Research Conference (CNSR), p. 327 – 333.
ITU-R, International Telecommunication Union - Radiocommunication Sector (2002).
“Methodology for the Subjective Assessment of the Quality of Television Pictures”,
In: Series BT: Broadcasting service (television). Recommendation BT.500-11.
ITU-T, International Telecommunication Union - Telecommunication Standardization
Sector (2000) “Subjective video quality assessment methods for multimedia
applications”, In: Series P: Telephone Transmission Quality, Telephone Installations,
Local Line Networks. Audiovisual quality in multimedia service. Recommendation
P.910.
XXIX Simpósio Brasileiro de Redes de Computadores e Sistemas Distribuídos 379
Koumaras, H., Lin, C.-H., Shieh, C.-K. and Kourtis, A. (2010) “A framework for end-
to-end video quality prediction of MPEG video”, Journal of Visual Communication
and Image Representation, p. 139-154.
Manish, J. and Constantine, D. (2007) “Path selection using available bandwidth
estimation in overlay-based video streaming,” Lecture Notes in Computer Science, p.
628–639.
Martinez, M., Moron, A., Robledo, F., Rodriguez-Bocca, P., Cancela, H. and
Rubino, G. (2008) “A GRASP Algorithm Using RNN for Solving Dynamics in a
P2P Live Video Streaming Network”, In: Eighth International Conference on Hybrid
Intelligent Systems, p. 447 – 452.
Mitchell, J., Pennebaker, W., Fogg, C. and Legall, D. (1996), MPEG Video:
Compression Standard, Chapman & Hall, Ltd. London.
Mohamed, S. and Rubino, G. (2002) “A study of real-time packet video quality using
random neural networks”, In: IEEE Transactions On Circuits and Systems for Video
Technology, p. 1071- 1083.
MSU (2011) “MSU Video Quality Measurement Tool”,
http://compression.ru/video/quality_measure/video_measurement_tool_en.html,
March.
Network Simulator (2011) “The Network Simulator – ns-2”,
http://www.isi.edu/nsnam/ns/, March.
Park, Y., Seok, Y., Choi, N., Choi, Y. and Bonnin, J-M (2006) “Rate-adaptive
multimedia multicasting over IEEE 802.11 wireless LANs”, Consumer
Communications and Networking Conference, p. 178–182.
Piamrat, K., Viho, C., Bonnin, J-M. and Ksentini, A. (2009) “Quality of Experience
Measurements for Video Streaming over Wireless Networks”, In: International
Conference on Information Technology: New Generations, p.1184-1189.
Revés, X., Nafisi, N., Ferrís, R. and Gelonch, A. (2006). “User perceived Quality
Evaluation in a B3G Network Testbed”, In Proc. of IST Mobile Summit, pages 1-5,
Mykonos.
RnnSim 2 (1999) “Random Neural Network Simulator – Versão 2”,
http://www.cs.ucf.edu/~ahossam/rnnsimv2/readme.txt, October.
Rodríguez-Bocca, P., Cancela, H. and Rubino, G. (2007) “Video Quality Assurance in
Multi-Source Streaming Techniques”, In Applications, Technologies, Architectures,
and Protocols for Computer Communication, pages 83-93. ACM.
Rubino, G. (2010) “The PSQA project”,
http://www.irisa.fr/armor/lesmembres/Rubino/myPages/psqa.html, December.
Rubino, G., Varela, M. and Bonnin, J-M (2006) “Controlling multimedia QoS in the
future home network using the PSQA metric”, The Computer Journal, p. 137–155.
Video Trace (2011) “Video Trace Library”, http://trace.eas.asu.edu/, October.
Wang, Z., Lu, L. and Bovik, A. (2004) “Video Quality Assessment based on Structural
Distortion Measurement”, In: Signal Processing: Image Communication, Special
Issue on Objective Video Quality Metrics, p. 121-132.
380 Anais